


1. Terrestrialization and the Tumblagooda Sandstone
The colonization of subaerial and non-marine landscapes by animals and plants was a defining, singular and irreversible innovation during the co-evolution of Earth and its biosphere (Vecoli et al. Reference Vecoli, Meyer-Berthaud, Clément, Vecoli, Meyer-Berthaud and Clément2010; Vermeij & Grosberg, Reference Vermeij and Grosberg2010; Kenrick et al. Reference Kenrick, Wellman, Schneider and Edgecombe2012). After the first metazoans evolved in the latest Precambrian, they remained either permanently or usually restricted to marine habitats for tens of millions of years (Minter et al. Reference Minter, Buatois, Mángano, MacNaughton, Davies and Gibling2016a), before the terrestrialization of life resulted in non-marine fauna and habitats which have persisted as a functional characteristic of the planetary surface for the remainder of the Phanerozoic.
The global trace fossil record is particularly valuable evidence for the historical onset, development and operation of the terrestrialization process. Burrows, trackways and other biological constructions are intensive properties of the sedimentary rock record and so are not diminished by the same taphonomic filters as the body fossil record is (Holland, Reference Holland2016; Davies et al. Reference Davies, Shillito, Slater, Liu and McMahon2020), thus having the potential to reveal a more accurate census of early terrestrial communities (when tracemakers can be inferred). Additionally, they provide tangible evidence of ancient, in situ organism–sediment interactions within physical habitats that cannot be examined by any other means (Buatois et al. Reference Buatois, Mángano, Genise and Taylor1998; Minter et al. Reference Minter, Buatois, Mángano, MacNaughton, Davies and Gibling2016a, b, Reference Minter, Buatois, Mángano, Davies, Gibling, MacNaughton and Labandeira2017; Buatois & Mángano, Reference Buatois and Mángano2018).
Our current understanding of the ichnological record reveals that arthropods were the earliest pioneer animals to make forays onto land. Evidence for sporadic excursions onto subaerially exposed substrates by marine-dwelling arthropods can be witnessed in Cambrian and Ordovician successions worldwide, where sedimentological evidence proves that trackway-hosting strata were deposited in littoral environments, often demonstrably within metres of the marine shoreline (MacNaughton et al. Reference MacNaughton, Cole, Dalrymple, Braddy, Briggs and Lukie2002; Collette et al. Reference Collette, Hagadorn and Lacelle2010; Davies et al. Reference Davies, Rygel and Gibling2011a; Davies & Gibling, Reference Davies and Gibling2012; McIlroy, Reference McIlroy2012; Minter et al. Reference Minter, Buatois, Mángano, MacNaughton, Davies and Gibling2016a; MacNaughton et al. Reference MacNaughton, Hagadorn and Dott2019; Shillito & Davies, Reference Shillito and Davies2019a, b). In younger strata, deposited around the Silurian–Devonian boundary, unequivocal instances of fully non-marine trace fossil communities occur (Minter et al. Reference Minter, Buatois, Mángano, Davies, Gibling and Labandeira2016b, 2017; Buatois & Mángano, Reference Buatois and Mángano2018); their environmental preferences demonstrated by close association with diagnostic non-marine sedimentary phenomena including palaeosols, certain fluvial architectural styles, and in situ plant or root fossils (e.g. Marriott & Wright, Reference Marriott and Wright1993; Griffing et al. Reference Griffing, Bridge, Hotton, Friend and Williams2000; Davies & Gibling, Reference Davies and Gibling2010). The earliest (Late Silurian) established non-marine trace fossil assemblages have a global distribution, and provide evidence for arthropod terrestrialization that, as expected, is marginally older than that afforded by the earliest (Lochkovian) air-breathing body fossils (Wilson & Anderson, Reference Wilson and Anderson2004; Shillito & Davies, Reference Shillito and Davies2017; Suarez et al. Reference Suarez, Brookfield, Catlos and Stöckli2017).
Amongst the global compendium of sites that bear testimony to the terrestrialization process, the Tumblagooda Sandstone of the Southern Carnarvon Basin, Western Australia (Fig. 1), is particularly prominent. Twenty discrete ichnogenera have been reported from this unit, and the first papers to fully document this ichnofauna suggested that the host strata were deposited by aeolian and fluvial processes in a late Silurian non-marine environment (Trewin, Reference Trewin1993a, b; Trewin & McNamara, Reference Trewin and McNamara1994). However, controversy surrounds the Tumblagooda Sandstone for two reasons: firstly, the age of the unit has subsequently been reinterpreted, from indirect evidence, to be Ordovician (Mory et al. Reference Mory, Nicoll, Gorter, Purcell and Purcell1998; Iasky & Mory, Reference Iasky and Mory1999) and, secondly, an alternative explanation for the depositional environment – one in which the trace-fossil-bearing strata were deposited in shallow marine settings – has repeatedly been put forward (Hocking, Reference Hocking1991; Bradley et al. Reference Bradley, Redfern, Hodgetts, George and Wach2018). The uncertainty that now surrounds the unit is in urgent need of clarification because: (1) examples of its trace fossils are regularly used to ascertain the stratigraphic ranges of non-marine ichnotaxa (e.g. Netto, Reference Netto2006) and ichnofacies (e.g. Krapovickas et al. Reference Krapovickas, Mángano, Buatois and Marsicano2016); (2) the apparent existence of diverse non-marine trace fossils with a revised Ordovician age has been used in support of equivocal claims of trace fossils in pre-Silurian non-marine strata elsewhere (see discussions in McNamara, Reference McNamara2008, and Davies et al. Reference Davies, Rygel and Gibling2011a); and (3) regardless of age or environment, the Tumblagooda Sandstone hosts one of the most diverse and abundant collections of arthropod trace fossils in the entire rock record, and the reasons for its ichnological richness have not been fully explored.
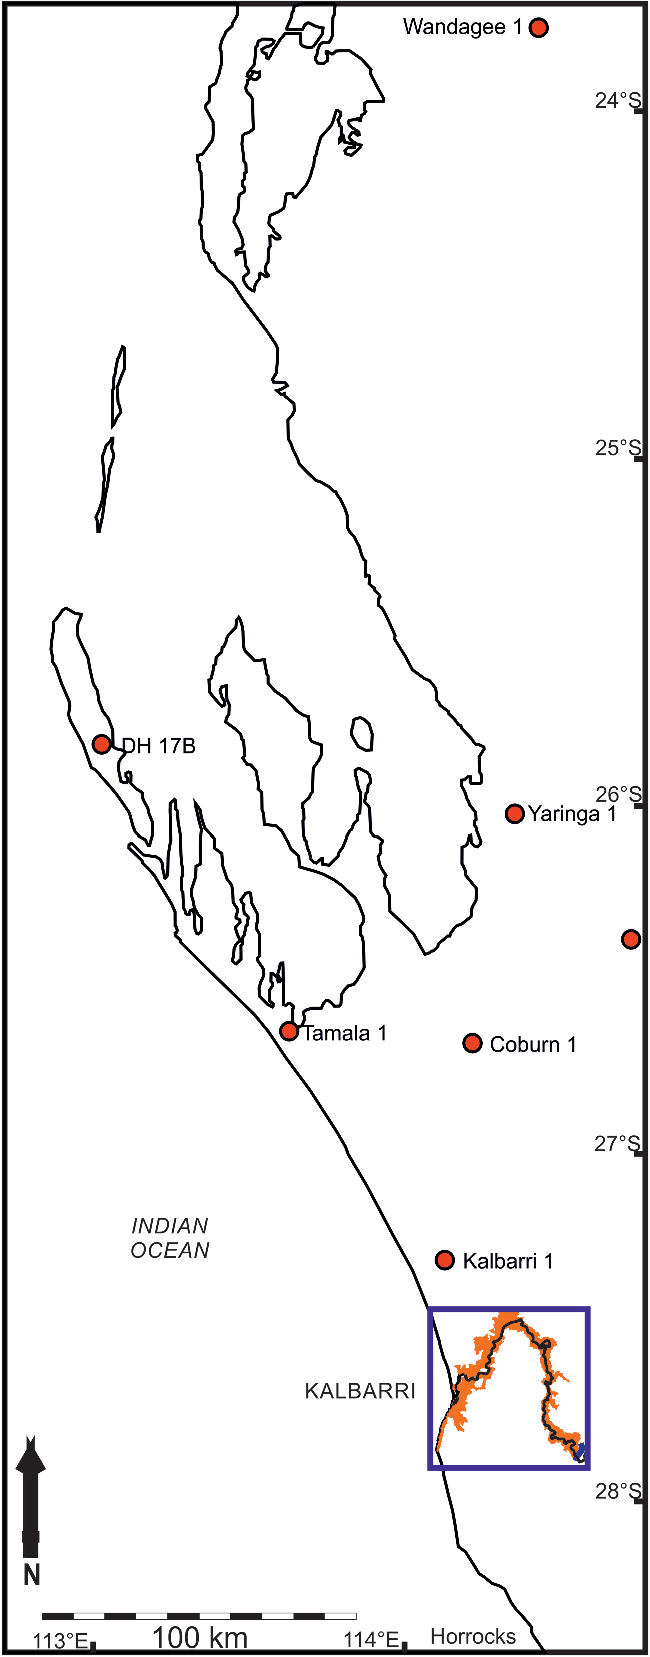
The location of outcrop of the Tumblagooda Sandstone along the Murchison River and coastal cliffs of Kalbarri National Park, Western Australia. (a) Exposure of the Tumblagooda Sandstone divided into facies associations as interpreted herein, following Hocking (Reference Hocking1991). Locations of logged sections examined in detail are marked in orange. (b) A schematic log of the stratigraphy of the Tumblagooda Sandstone. Numbered locations from (a) are marked with the stratigraphic thickness and coverage of the sections observed. Facies associations are separated by dashed horizontal lines, and the total stratigraphic areas studied are highlighted in pale green

This paper seeks to address the uncertainty surrounding the trace fossils of the Tumblagooda Sandstone, and the significance that they have for understanding invertebrate terrestrialization, using data and observations collected during 50 days of original fieldwork on the unit, undertaken in August 2014, May 2016 and September 2017. In the following sections, we first review some of the controversies that have arisen regarding the age and environment of the Tumblagooda Sandstone (Section 2). We then present new sedimentological (Section 3) and ichnological (Section 4) evidence that demonstrates a marine influence throughout much of the Tumblagooda Sandstone, in particular those strata with the highest diversity and disparity of trace fossils. We conclude by comparing the new information from the Tumblagooda Sandstone with other lower Palaeozoic successions, to demonstrate that, rather than being a crucible of terrestrialization, the unit is better understood as hosting an archetypal littoral ichnofauna that was imparted shortly before the full arthropod invasion of the land.
2. Geological background and controversy
The Tumblagooda Sandstone is a 1210 m thick (at outcrop) succession of strata composed almost entirely of medium- to coarse-grained sandstones, with mudrocks and conglomerates making up <1 % of the unit. It was deposited at the intersection of the Southern Carnarvon and Perth Basins, and presently crops out, with a typically gentle tectonic dip, over an area of >7000 km2 in a number of well-exposed coastal cliff and inland river gorge sections around Kalbarri National Park, Western Australia. Gorge sections along the Murchison River provide a full transect through most of the thickness of the unit (Fig. 1).
2.a. Age
The Tumblagooda Sandstone contains no direct indicators of its age. It is unfossiliferous with the exception of a single endemic body fossil with no biostratigraphic significance: the euthycarcinoid Kalbarria brimmellae (McNamara & Trewin, Reference McNamara and Trewin1993; McNamara, Reference McNamara2014). Early survey work considered the unit to be Upper Cretaceous (Clarke & Teichert, Reference Clarke and Teichert1948) from fossils in the locally overlying ‘Butte Sandstone’ (now the Birdrong Formation (Condon, Reference Condon1965)); however, this contact was later identified as unconformable (Condon, Reference Condon1965) and a Cambrian to Ordovician age was proposed, based upon the ichnofauna (Öpik, Reference Öpik1959). Hocking (Reference Hocking1991) showed a Cambrian age to be implausible because lead mineralization in the underlying basement (the Proterozoic Northampton Complex) is dated at 434 ± 16 Ma (Richards et al. Reference Richards, Blockley and De Laeter1985; Bruguier et al. Reference Bruguier, Bosch, Pidgeon, Byrne and Harris1999) but is absent from the Tumblagooda Sandstone. This implied a maximum Llandovery (and likely late Silurian) age, and was considered most probable when the first detailed ichnological work was performed on the unit (Trewin, Reference Trewin, North and Prosser1993b; Trewin & McNamara, Reference Trewin and McNamara1994).
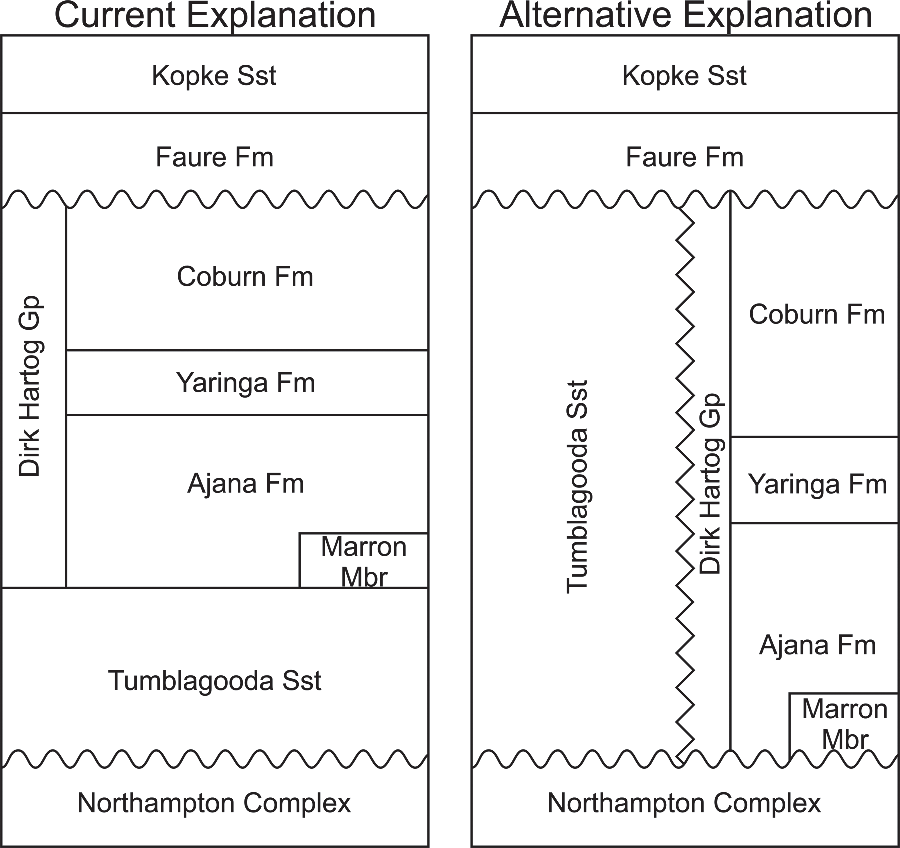
Subsequently, the unit has been considered to be Ordovician based on the presence of Llandovery-aged conodont fossils in the Dirk Hartog Group (DHG): a 650–740 m thick succession of dolomites and evaporites, with subordinate siliciclastic strata (Gorter et al. Reference Gorter, Nicoll, Foster, Purcell and Purcell1994; Mory et al. Reference Mory, Nicoll, Gorter, Purcell and Purcell1998; Iasky & Mory, Reference Iasky and Mory1999; Figs 2, 3). No direct field evidence exists to demonstrate the DHG–Tumblagooda stratigraphic relationship because the DHG is known only from the Carnarvon Basin centre, 400 km north of the nearest Tumblagooda Sandstone exposures on the basin margin (Fig. 2). However, Mory et al. (Reference Mory, Nicoll, Gorter, Purcell and Purcell1998) and Iasky & Mory (Reference Iasky and Mory1999) inferred that sandstone lithologies underneath the DHG, revealed in boreholes from the basin centre, were part of the Tumblagooda Sandstone, based upon correlation of cores and seismic subcrop data (Fig. 2). This interpretation relies on the assumption that there is no lateral facies variation or diachroneity up to 400 km north of its known outcrop. There is reason to question this, because (1) facies are demonstrably variable and diachronous even within exposed outcrop of the Tumblagooda Sandstone, and (2) the main exposure of the unit appears to have been deposited in a nearshore/coastal environment where the palaeo-shoreline was oriented approximately east–west, with more marine conditions towards the basin centre in the north (see Section 3). A plausible alternative explanation is therefore that the Tumblagooda Sandstone and DHG are chronostratigraphically-equivalent units, with the latter being an offshore, basin-centre correlative to the marginal siliciclastic strata of the Tumblagooda Sandstone (Fig. 3). Ultimately, the true relationship between the Tumblagooda Sandstone and the units known from boreholes to the north remains uncertain, but this explanation would accord with the sedimentary environmental context of the unit.
Locations of boreholes in which the Tumblagooda Sandstone has been identified in core (red), to the north of the outcrop area of the Tumblagooda Sandstone along the Murchison River (orange). Map area shown in Figure 1 is highlighted by the blue box.
Regional stratigraphy. Left panel shows the regional stratigraphy as currently understood following Mory et al. (Reference Mory, Nicoll, Gorter, Purcell and Purcell1998). Right panel shows an alternative explanation for the regional stratigraphy proposed herein, where the Tumblagooda Sandstone is a more proximal lateral equivalent to the Dirk Hartog Group to the north.
Detrital zircon dates from the Tumblagooda Sandstone set a maximum possible age at 466 ± 8 Ma (Markwitz et al. Reference Markwitz, Kirkland, Wyrwoll, Hancock, Evans and Lu2017). When considered alongside the c. 430 Ma Rb–Sr ages for regional uplift across SW Australia (Libby & De Laeter, Reference Libby and De Laeter1998; McNamara, Reference McNamara2014), which were dated using biotites from the Yilgarn Craton (a minor provenance source for the Tumblagooda Sandstone; Kettanah et al. Reference Kettanah, Mory, Wach and Wingate2015), there is circumstantial evidence that the unit is likely Silurian. Our fieldwork supports the contention that there are no palaeosols in the Tumblagooda Sandstone, in agreement with previous work (Hocking, Reference Hocking1991; Trewin, Reference Trewin, North and Prosser1993b; Evans et al. Reference Evans, Mory and Tait2007; McNamara, Reference McNamara2014; Kettanah et al. Reference Kettanah, Mory, Wach and Wingate2015; Bradley et al. Reference Bradley, Redfern, Hodgetts, George and Wach2018). As such, there is no evidence for the palaeosol ‘pedostratigraphy’ of Retallack (Reference Retallack2009), who considered the Tumblagooda Sandstone to have been deposited continually throughout the entire 45 Ma duration of the Ordovician Period.
2.b. Depositional environment
The Tumblagooda Sandstone was originally described as a deltaic deposit (Teichert, Reference Teichert1947), and considered largely non-marine (e.g. Veevers, Reference Veevers1971) until detailed sedimentological work by Hocking (Reference Hocking1991), who logged 45 sections totalling almost all of the unitʼs stratigraphic thickness. Using these sections, he divided the unit into four main facies associations (FA1–FA4), which have subsequently been utilized as informal stratigraphic members by other researchers. FA1 was described as a low-sinuosity, braided fluvial association (Hocking, Reference Hocking1991), based upon the unidirectional palaeocurrent measurements and textural immaturity of the predominantly trough-cross-bedded sandstone. FA2 was described as an intertidal facies association due to the abundant bioturbation and sedimentary structures including ripple marks and various adhesion marks (Hocking, Reference Hocking1991). Trewin (Reference Trewin, North and Prosser1993b) later reinterpreted FA2 as fluvial and aeolian deposits, while the most recent interpretation of FA2 (Bradley et al. Reference Bradley, Redfern, Hodgetts, George and Wach2018) considered it to have been deposited in a macrotidal estuary setting. Hocking (Reference Hocking1991) interpreted FA3 as a low-sinuosity high-energy braided fluvial association, similar to FA1, due to its unidirectional palaeoflow indicators, coarse grain size and dominant trough cross-bedding. FA4 was interpreted as having been deposited in a protected interdistributary bay, on sand flats and within channels, due to the near-total absence of reworking by tides or waves and the presence of bioturbation (Hocking, Reference Hocking1991). Evans et al. (Reference Evans, Mory and Tait2007) later divided FA3–FA4 into a series of constituent facies reflecting fluvio-deltaic deposition.
The significance of the Tumblagooda Sandstone to the understanding of terrestrialization has arisen because Trewin & McNamaraʼs (Reference Trewin and McNamara1994) description of the Tumblagooda ichnofauna followed the non-marine reinterpretation of FA2 strata by Trewin (Reference Trewin, North and Prosser1993b). However, such interpretations are equivocal for the following reasons:
-
1. Fluvial. Trewin (Reference Trewin, North and Prosser1993 b) interpreted trough-cross-bedded sandstones in FA2 as having been deposited by small fluvial channels, but besides the similar palaeocurrent directions to FA1 there is little compelling evidence for this. A plausible alternative explanation is that the deposits record marine subaqueous barforms.
-
2. Aeolian. Trewin (Reference Trewin, North and Prosser1993b) identified two facies in FA2 that he suggested had an aeolian origin: (A) Low-angle cross-bedded sandstones. These occur as fine- to medium-grained, well-sorted sandstone, forming low-angle cross-beds as part of low-amplitude (typically <50 cm) features. Trewin (Reference Trewin, North and Prosser1993b) suggested that reactivation surfaces and internal millimetre-scale lamination could be explained by aeolian deposition; an interpretation that he supported by citing the lack of water-lain sedimentary structures and bioturbation. (B) Sub-parallel bedded sand sheets: These he reported to contain diagnostic aeolian features, including millimetre-scale ‘pinstripe’ lamination, and coarse highly spherical ‘millet-seed’ grains. Such features are conspicuous within parts of FA2 and do appear to reflect some aeolian contribution to deposition, but are far outweighed by more abundant evidence for subaqueous deposition and emergence of wet substrates throughout FA2 (e.g. ripple-marked and adhesion-marked surfaces).
3. Sedimentary facies of the Tumblagooda Sandstone
Understanding the degree of marine influence during the deposition of the Tumblagooda Sandstone is prerequisite for determining its context within the global record of the terrestrialization process. However, differentiating marine and non-marine strata is problematic in early Palaeozoic, fossil-poor siliciclastic deposits where there are few indicators that can reliably be used to distinguish marine versus non-marine subaqueous deposits (McMahon & Davies, Reference McMahon and Davies2018; Wizevich et al. Reference Wizevich, Ahern and Meyer2019). This issue is heightened during transitional phases in evolutionary history where ichnofacies may be in a state of flux as new environmental niches are exploited (Davies et al. Reference Davies, Sansom and Turner2006; Shillito & Davies, Reference Shillito and Davies2017).
Ultimately, asking whether a specific formation (or even individual bed) is ‘marine’ or ‘non-marine’ can be an intractable question, for a number of reasons: (1) there may be practical issues of a lack of diagnostic evidence; (2) there may be both marine and non-marine influences active during the duration of accrual of the strata; and (3) they may have been deposited in an environment that could, even instantaneously, be considered both ‘marine’ and ‘non-marine’. The latter two issues are particularly pertinent, because they relate to the fact that there is no universal spatio-temporal boundary between ‘marine’ and ‘non-marine’ in the natural world, and emphasize the need for caution even where there are tangible clues to the physical environment. Even in modern environments, whether an environment is ‘marine’ or ‘non-marine’ depends on what parameters are being used to define the terms. The landward extents of marine physical, biological and chemical processes are often disharmonic: for example, in an estuarine setting, the landward limit of marine energy influence (e.g. waves or tidal bores) is not the same as the landward extent of saltwater or brackish water, or the landward limit of (e.g. amphidromous) marine organisms (e.g. Dalrymple & Choi, Reference Dalrymple and Choi2007). This implies that there are few ‘smoking guns’, in terms of sedimentary characteristics, that are individually diagnostic within sedimentary rocks. Additionally, even when the ‘marine’/’non-marine’ boundary is defined by just one of the potential physical, chemical or biological limits, temporally, such boundaries can fluctuate on timescales of hours (e.g. within a tidal prism), seasons, or up to thousands of years: an issue that is especially pertinent to interpreting marine influence from the rock record because these are all timescales over which a loose sediment substrate could be exposed to environmental influence, prior to its lithification as a stratum of sedimentary rock.
The inherent uncertainty is even further complicated by the inconsistent usage of multiple near-synonyms in published literature (e.g. ‘continental’ or ‘terrestrial’ instead of ‘non-marine’). As such issues are of direct relevance to understanding the terrestrialization process, we here offer definitions of pertinent terms in Figure 4 and Table 1. ‘Marine’ and ‘non-marine’ are considered to be non-exclusive, overlapping descriptors of general environment, and are shown in relation to other related concepts: ‘saline’, ‘brackish’ and ‘freshwater’, which refer to water chemistry and are only rarely diagnosable from the sedimentary record, and ‘subaqueous’, ‘subaerial’ and ‘emergent’, which refer to the direct influences on sediment deposition and patterning. The latter three descriptors are commonly conclusively diagnosable from sedimentary rocks, but carry no implication of whether marine waters were involved. Furthermore, due to potential palimpsesting of trace fossils onto substrates where the degree of submergence may have been in flux (Davies et al. Reference Davies, Liu, Gibling and Miller2016), additional evidence for the order of events may be required to confirm the substrate state at the time that organisms interacted with it (although, practically, such evidence may be lacking). Recognizing the full extent of marine influence requires combining and explaining multiple individual strands of evidence, as discussed for the Tumblagooda Sandstone in Section 5.
Cartoon map showing common sedimentary environments at the marine to non-marine boundary. Lower maps show descriptive terms that may be used to describe instances of these environments in terms of general environment, water salinity and water coverage. Extent of descriptive terms highlighted in purple – note that the terms are not mutually exclusive. See Table 1 for definitions.

Definitions of environmental descriptive terms with relevance to understanding the degree of marine influence at the time of deposition of sedimentary strata

Note: ‘Continental’ and ‘terrestrial’ are here considered inferior synonyms to ‘non-marine’. ‘Submergent’ could be considered an antonym to ‘emergent’, but is excluded here due to the scarcity of sedimentary evidence for such a state.
3.a. Facies association 1
3.a.1. FA1 – description
The majority of the exposure of FA1 occurs stratigraphically below FA2, as steeply dipping strata within the Hardabut Anticline (Hocking, Reference Hocking1991). The tectonic dip decreases downstream along the Murchison River and is approximately flat-lying at Ross Graham and Hawks Head (Fig. 1, locations 1–3). Above the first occurrences of FA2, a thick band of trough-cross-bedded sandstone assigned to FA1 is traceable from these locations north along the river as far as Fourways (Fig. 1, location 6). Cumulatively, FA1 accounts for c.460 m (38 % of total stratigraphic thickness) of the Tumblagooda Sandstone.
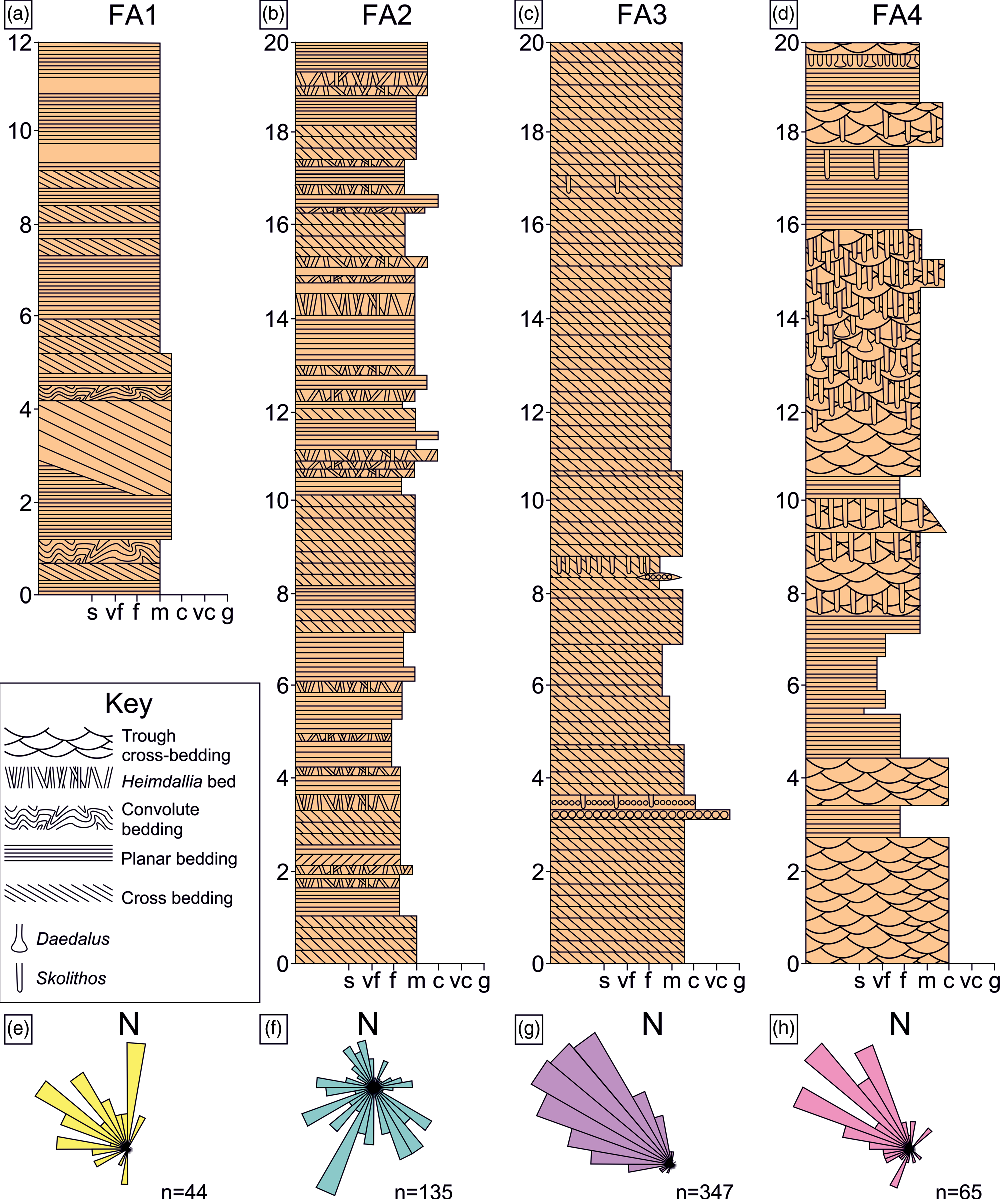
Facies association 1 is comprised of medium- to coarse-grained trough-cross-bedded sandstones, with occasional sandstone intraclasts and quartz pebbles (Fig. 5a). Mudrock is absent. Cross-beds occur in sets typically ranging from 15 to 60 cm thick, with rare instances up to 2.5 m thick. Palaeoflow measurements taken from foresets record a consistent flow direction to the northwest (Fig. 5e). FA1 only crops out as vertical cliffs, with negligible bedding plane exposures, so any sedimentary structures can only be viewed in cross-section. Convolute bedding (up to 50 cm thick) and scoured tops of cross-bedded sets are common, along with infrequent ripple cross-lamination. No trace fossils have been identified within FA1, either in this or previous studies.
A summary of the stratigraphy and palaeocurrent directions for FA1–FA4. (a) FA1 – the 12 m sedimentary log was taken at Four Ways (location 6, Fig. 1), showing the characteristic large-scale cross-bedded coarse sandstone of FA1, with some convolute laminated beds. (b) FA2 – the 20 m sedimentary log was taken at the Z-Bend (location 5, Fig. 1) showing the three characteristic facies of FA2: cross-bedded sandstone, densely bioturbated sandstone and planar-bedded sandstone. (c) FA3 – the 20 m sedimentary log was taken at Stone Wall (location 16, Fig. 1) showing the dominant trough-cross-bedded facies of FA3, with subordinate bioturbated horizons. (d) FA4 – the 20 m sedimentary log was taken at Rainbow Valley (location 22, Fig. 1) showing the characteristic facies of FA2: trough-crossbedded sandstone, densely bioturbated trough-cross-bedded sandstone, and planar-bedded sandstone. (e) The palaeocurrent rose for FA1 shows a strongly dominant flow to the north and northwest. (f) The palaeocurrent rose for FA2 shows variable flow directions, dominantly to the south/southeast, with a minor northerly flow. (g) The palaeocurrent rose for FA3 shows a very strongly unimodal flow to the northwest. (h) The palaeocurrent rose for FA4 shows a consistent flow to the northwest, with very minor evidence for an opposing southerly flow.
3.a.2. Facies association 1 – interpretation
The strongly unidirectional palaeoflow and ubiquitous trough cross-bedding support previous interpretations (Hocking, Reference Hocking1991) that FA1 was deposited in a braided fluvial setting. The fluvial sediments were apparently not colonized by burrowing organisms.
3.b. Facies association 2
3.b.1. FA2 – description
Rocks belonging to FA2 crop out from just upstream of Ross Graham Lookout (Fig. 1, location 1) to Mount Yooadda Darlinoo (Fig. 1, location 13). They are frequently interbedded with FA1 in the lower reaches of the succession, with scattered thin bioturbated beds of FA2 increasing in frequency upwards through 20 m of strata until they make up most of the exposure at Ross Graham Lookout. The upper boundary between FA2 and FA3 rocks was not observed in this study, but Hocking (Reference Hocking1991) reports that it is an abrupt transition from the dominantly planar-laminated and bioturbated sandstones into the thick trough-cross-bedded packages of FA3, with no intercalation. The total thickness of FA2 is c. 410 m (34 % of the total stratigraphic thickness of the formation).
Facies association 2 is the most sedimentologically and ichnologically diverse part of the succession (Fig. 5b). The stepped style of outcrop exposure that is prevalent throughout FA2 reveals many bedding surfaces as well as vertical sections through beds. Sedimentary surface textures and surficial trace fossils are abundant on bedding planes, with ripple marks and adhesion marks co-occurring along with diverse burrows and trackways of FA2 (Fig. 6). Five lithofacies are recognized: 1. planar-bedded sandstones (c. 45 % of FA2); 2. Medium-scale cross-bedded sandstones (c. 45 % of FA2); 3. densely bioturbated sandstones (c. 10 % of FA2); 4. herringbone cross-stratified sandstones (<1 % of FA2); and 5. pinstripe-laminated sandstone (<1 % of FA2). These lithofacies are interbedded with variable frequency.
-
1. FA2a: Planar-bedded medium-coarse sandstones. These typically occur as packages of 2–5 cm thick beds, with some beds up to 20 cm thick. Ripple and climbing ripple lamination are observed in vertical sections, and abundant surface textures occur on bedding planes. Ripple marks occur in symmetrical and asymmetrical forms which locally show evidence of having been washed out or deflected, or occur as ladder ripples (Fig. 7a–c). Some ripple marks contain water-level markings on their flanks (Fig. 7h), and one instance of weakly apparent V-shaped markings on a bedding plane was noted at Fourways, resembling the patterns that develop when water drains across a flat surface (Daerr et al. Reference Daerr, Lee, Lanuza and Clément2003) (Fig. 7g). Adhesion marks occur in high concentrations in FA2, both in association with ripple marks and in isolation, including adhesion warts, setulfs (inverted ‘flutes’ that record wind erosion of damp substrates (Friedman & Sanders, Reference Friedman and Sanders1974)) and adhesion ripples (Fig. 7d–f). Together these bedding plane markings reveal the existence of ‘true substrates’ (sensu Davies & Shillito, Reference Davies and Shillito2018) that indicate that the bedding planes are preserved sediment–fluid interfaces from the time of deposition.
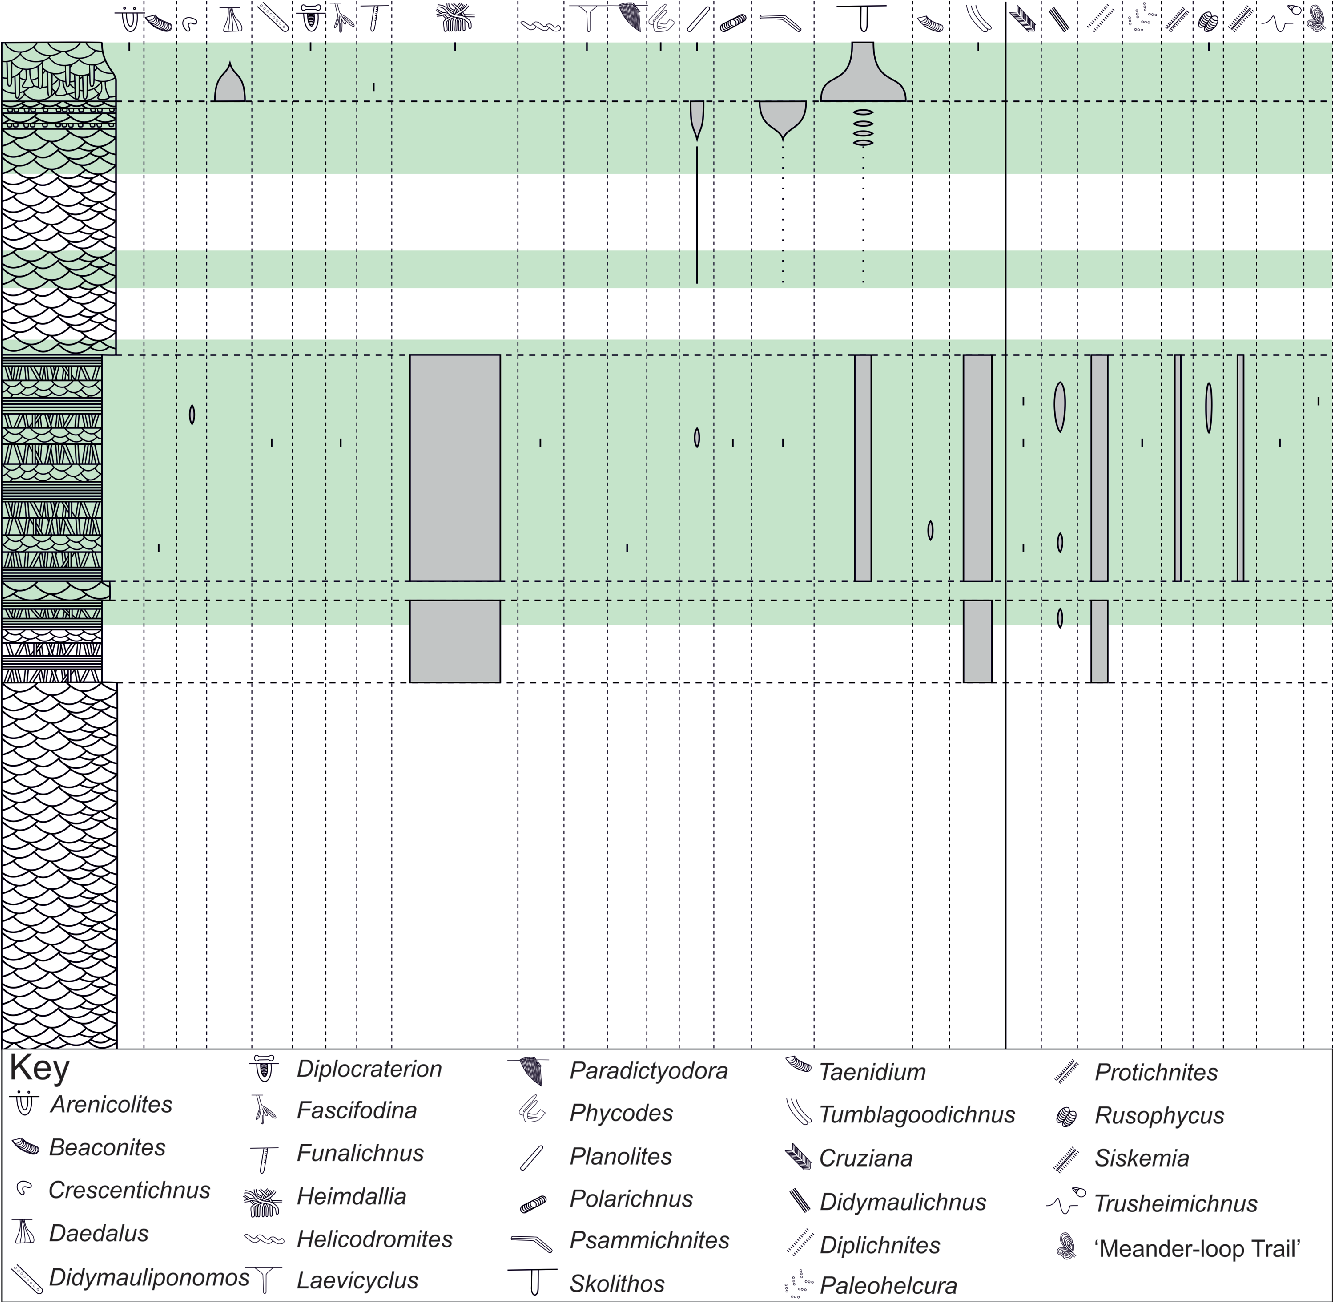
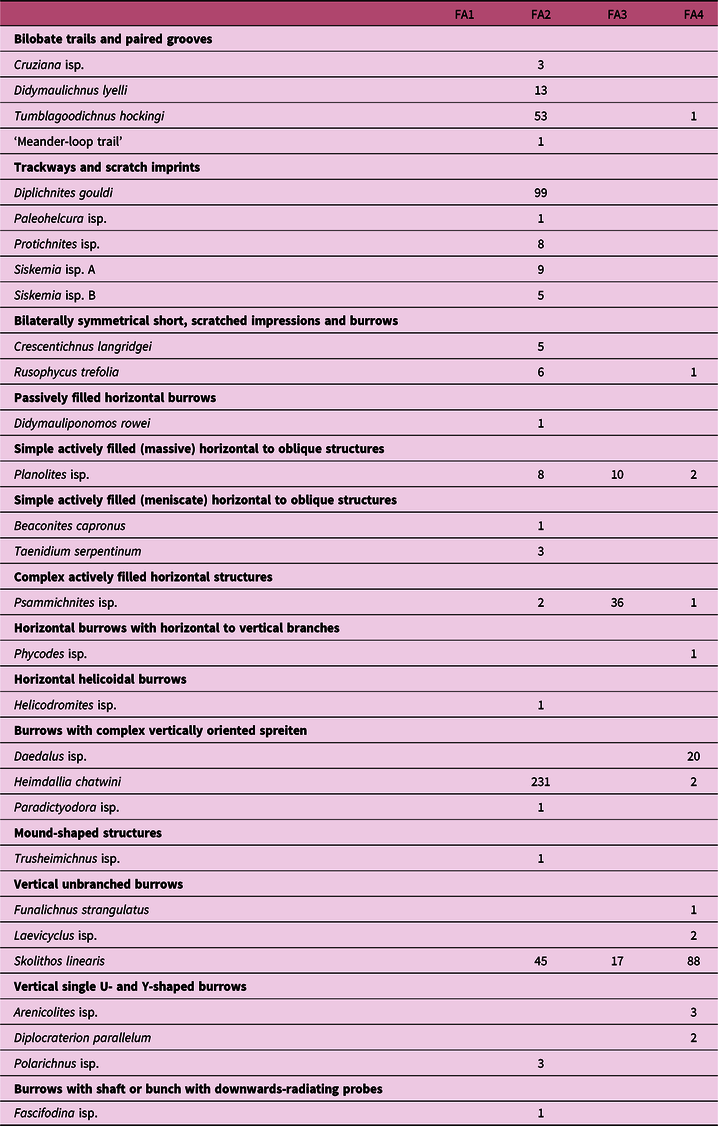
The stratigraphic distribution and relative abundance of identified ichnospecies within the Tumblagooda Sandstone. Infaunal traces are illustrated to the left, and epifaunal traces to the right. Pale green highlights the parts of the stratigraphy that have been studied in detail (see Fig. 1). This shows by far the greatest abundance and diversity of trace fossils occurs within FA2, with a moderate abundance of traces in both FA3 and FA4, but a low diversity in both facies associations.
Examples of the variable forms of ripple marks and adhesion marks known from FA2 of the Tumblagooda Sandstone. (a) Washed-out ripples – suggesting a high-energy flow across parts of the substrate removed the existing bedforms. (b) Deflected ripples – variable ripple crest directions across a small area reveal a variable flow direction, or flow outwards away from a source. (c) Ladder ripples – revealing a later secondary flow perpendicular to the major ripple crests, recording drainage of water from the substrate. (d) Adhesion warts – small adhesion marks revealing that no preferential wind direction was involved in their formation. (e) Setulfs – elongate adhesion marks, with the direction of elongation parallel to the prevailing wind under which they were formed. (f) Adhesion ripples – ripple marks covered in adhesion structures, with the formational wind direction perpendicular to ripple crests. (g) V-ing drainage marks on a surface on the Fourways trail. Faint Vs are highlighted at the top right and centre bottom of the image, and point towards the bottom. (h) Drainage marks on ripple crests, showing where water has sat at different levels within the troughs of the ripples. (i) Tadpole nest ripples – ripples in multiple different directions coalesced, showing drainage has occurred in differing directions to the main flow direction. Black scale bar – 10 cm.

The true substrates host a range of different trace fossils, both solitary and in infrequent dense patches, dominated by trackways but with short vertical burrows, resting traces and horizontal burrows also present (Beaconites, Crescentichnus, Cruziana, Didymaulichnus, Didymauliponomos, Diplichnites, Fascifodina, Heimdallia, Helicodromites, Paleohelcura, Paradictyodora, Planolites, Polarichnus, Protichnites, Psammichnites, Rusophycus, Siskemia, Skolithos, Taenidium, Trusheimichnus, Tumblagoodichnus). These are accompanied on some surfaces by bubble marks (Fig. 8).
-
2. FA2b: Planar- and trough-cross-bedded sandstones. These occur as 20 to 60 cm thick packages of fine- to coarse-grained sandstone. Cross-bedded packages can be traced along the dip direction of the foresets on the scale of tens of metres, with a particularly prominent example of such observed at The Loop (Fig. 9). These are distinct from the cross-bedded sandstones of FA1 because they host a number of trace fossils, both in vertical section cross-cutting bedding, and on the foresets in association with sedimentary surface textures such as ripple marks and adhesion marks (Fig. 9c, d).
-
3. FA2c: Densely bioturbated sandstones. These are fine- to coarse-grained sandstone beds, ranging from 10 to 40 cm in thickness, that are densely bioturbated with 6 to 13 mm J-shaped burrows, predominantly belonging to the ichnogenus Heimdallia (with subordinate Paradictyodora) and often overprinted with Tumblagoodichnus from overlying beds. The beds are typically individual and separated by 0.1 m and 2 m of less bioturbated strata, but less frequently can be seen stacked directly on top of one another. In many instances all original sedimentary bedding surface features are absent due to total overprinting with burrows but, in less densely bioturbated examples, ripple marks can be observed on bedding surfaces. In vertical section, sedimentary structures are totally overprinted by the ichnofabric. This lithofacies typically weathers proud of the walls of the river gorges, forming a large proportion of stepped platforms throughout the exposure of FA2.
-
4. FA2d: Herringbone cross-stratified sandstone. Apparent bi-directional cross-strata are not uncommon within FA2, and one 50 cm thick instance at The Loop can be conclusively diagnosed as herringbone cross-strata due to the three-dimensional nature of the outcrop (Fig. 10a). Asymmetric ripples occur over the top of cross-bedded medium sandstone dipping towards the NNE, and are succeeded by cross-beds dipping to the SSW. At 12.5 m stratigraphically below this, ripples climbing to the south top medium cross-bedded sandstone dipping to the north (Fig. 10). This same section contains a solitary occurrence of mud-drapes overlying asymmetric sand ripples, where the mud-drapes have been worked into a symmetric ripple form that is discordant with the underlying sediment (Fig. 10b).
-
5. FA2e: Pinstripe-laminated sandstone. This is observed in two 20-cm thick packages c. 70 cm apart near the base of the section at Z-Bend. It comprises very finely laminated fine–medium sandstone, lacking any bioturbation or physical sedimentary structures. Sand grains are very well rounded and have a frosted appearance. In one example, the fine laminations are truncated by an irregular surface of coarser sediment lag, potentially recording a deflation surface (Fig. 11).
A surface with bubble marks (black arrows), patchy ripples and Rusophycus (white arrows). Interpreted as potentially representative of a microbial film covering the original substrate. (a) Overview of the surface. (b) Close-up showing Rusophycus, truncated ripples marks, and bubble marks. (c) Close-up showing bubble marks on an otherwise unmarked part of the bedding surface. Black scale bar – 10 cm.

An example of a barform preserved as cross-bedded sandstone within FA2 at The Loop. (a) A view of part of the barform, with the topset and bottomset marked with thick black lines, and reactivation surfaces marked in blue. (b) A depositional surface from within the barform covered in adhesion marks, showing that this surface was exposed subaerially during a period of non-deposition. (c) A depositional surface with several examples of Diplichnites, revealing that animals traversed the surface during sedimentary stasis. (d) A vertical burrow, cutting obliquely through a sub-horizontal depositional surface. This burrow appears to originate from higher up within the barform, likely the horizontal top surface. Geologist is 1.8 m tall; black scale bar – 10 cm.

Sedimentological evidence for tidal deposition in parts of FA2. All features were observed at The Loop. (a) Herringbone cross-laminated sandstone. The beds in the base of the photo are dipping to the right of the image, and the overlying beds (above the ripple-marked surface) are dipping to the left. (b) Mud-draped ripple marks, recording low-energy deposition associated with the slack-water phase of a tidal cycle. (c, d) Reverse climbing ripples – ripple marks climbing in an opposing direction to the underlying cross-beds, suggesting reversing flow direction. Black scale bar – 10 cm.

Sedimentological evidence for aeolian deposition in parts of FA2. (a) Pinstripe-laminated fine sandstone, with a band of coarse sandstone at the base and cutting through the middle, recording the original topography of the surface. This is overlain by further pinstripe-laminated sandstone and a top surface with adhesion marks. Observed in cliffs opposite the base of the trail, Z-Bend. (b) A line drawing highlighting the key features in (a). The coarse surface carving through the middle of the pinstripe-laminated sandstone is interpreted as an aeolian deflation surface. The area shown in the photo (a) is highlighted by the blue box. (c) A close-up of pinstripe-laminated fine sandstone. (d) A close-up of a layer of highly rounded coarse sandstone, interpreted as ‘millet seed’ texture, from Fourways. Black scale bar – 10 cm; red scale bar – 1 cm.

3.b.2. FA2 – interpretation
The five lithofacies within FA2 reflect deposition in distinct littoral sub-environments, predominantly under subaqueous conditions but with evidence for recurrent subaerial reworking of substrates.
FA2a, the planar-bedded medium–coarse sandstones, exhibit diverse ripple marks (Fig. 7a–c, h, i) that were formed during subaqueous sediment motion, and adhesion warts (Fig. 7d–f) formed during intermittent periods of emergence, when dry sand was blown across, and adhered to, damp substrates. Evidence of draining water is seen in the ladder ripples and water-level marks of this lithofacies. Bubble marks are potentially circumstantial evidence for microbial films covering some substrates (Davies et al. Reference Davies, Liu, Gibling and Miller2016, Reference Davies, Shillito and McMahon2017): such would not be unexpected in an emergent littoral environment but there is no accessory evidence to definitively confirm such an interpretation.
FA2b, sets of fine- to coarse-grained cross-bedded sandstone, show evidence of periods of emergence during their deposition through adhesion marks on their foresets (Fig. 9). This lithofacies can be attributed to subaqueous dunes that occasionally became subaerially exposed. Some of the foresets host arthropod trackways, indicating that they were traversed during intervals of sedimentary stasis associated with emergence. Vertical burrows cutting through the cross-beds originate only from topsets (Fig. 9), indicating that they were emplaced after resubmergence.
FA2c, densely bioturbated sandstones, bear physical similarities with the planar-bedded sandstones, but there is no evidence to suggest that the burrows were generated subaerially. Occasional overprinting by adhesion marks proves that the burrows were excavated under subaqueous conditions and later emergent. Due to the penetrative nature of the burrows, they cross-cut through earlier sediment layers that were both subaqueously deposited and intermittently emergent.
Hocking (Reference Hocking1991) reports restricted occurrences of bioturbated medium-grained sandstones containing Heimdallia in thin (<30 cm) planar beds identical to these bioturbated horizons from the top of FA1, 35 m below the first reported occurrence of FA2. These few horizons do not conform to the description of FA1 as coarse, trough-cross-bedded sandstones, and do not occur in the lower 400 m of exposed stratigraphy. As there is strong evidence for the interbedding of FA1 and FA2 after this point at Ross Graham Lookout and downstream from there, we consider these bioturbated beds to instead mark the first occurrence of FA2 in the stratigraphy.
The above three lithofacies indicate only that the strata of FA2 were subaqueously deposited and recurrently emergent. However, FA2d, the instances of herringbone cross-stratified sandstone and mud-draped ripple marks, provide very strong evidence from the Tumblagooda Sandstone of a tidal influence to sedimentation, and are incompatible with the fluvial–aeolian depositional model proposed by Trewin (Reference Trewin1993a). Evidence for both repeated flow direction reversal and stillstand conditions (including evidence for a switch from directed currents to oscillatory currents during waning flow: Fig. 10.b) are common motifs in tidal settings. Whilst, in isolation, these could potentially have plural environmental explanations (Dalrymple, Reference Dalrymple, James and Dalrymple2010), the weight of evidence from the combined suite of sedimentary structures within this lithofacies implicates fully submerged and marine conditions. The close association of FA2d with the other lithofacies of FA2 suggests that it was marginally offshore from the other littoral lithofacies, the intermittent emergence of which can best be explained by their having been deposited within an intertidal prism between maximum high and low tide.
Fa2e, the pinstripe-laminated sandstone with highly rounded, frosted grains, provides a counterpoint to this, as it is direct evidence for aeolian deposition. The occurrence of this lithofacies within FA2 can be explained as a marginally supratidal or high-intertidal setting within a broad sandy tidal flat environment.
In summary, there is very strong direct evidence that FA2 was deposited within a tidally influenced environment. There is little evidence for fully subaerial deposition apart from the two instances of FA2e, but evidence for the subaerial reworking and emergence of subaqueously deposited sand is a common motif. In agreement with other interpretations (Hocking, Reference Hocking1991; Bradley et al. Reference Bradley, Redfern, Hodgetts, George and Wach2018), the recognition that FA2 can only represent littoral deposition on tidal sand flats means that the fluvial–aeolian depositional model for FA2 of the Tumblagooda Sandstone (Trewin, Reference Trewin1993a, b; Trewin & McNamara, Reference Trewin and McNamara1994; McNamara, Reference McNamara2014) must be rejected. This has crucial implications for the significance of the unit for understanding the terrestrialization process. Close association between arthropod trackways and emergent indicators shows that some organisms were traversing subaerial substrates, but all of these substrates were littoral and likely resubmerged within a diurnal or synodic tidal cycle: there is no evidence that any of these tracemakers were permanent non-marine denizens. Significantly, there is no evidence that any of the burrows in FA2 were created subaerially, and their partial reworking by adhesion structures implies that they were fully subaqueous constructions that were either abandoned or used as refuges during low tide (see Sections 4 and 5 for more detail on the environmental preferences of these traces).
3.c. Facies association 3
3.c.1. FA3 – description
Exposures of FA3 occur in the Murchison River Gorge downstream of Mount Yooadda Darlinoo (Fig. 1, location 13) where it occurs as stepped outcrops, and vertical coastal cliffs near Kalbarri (Fig. 12). Wave-cut ledges revealing bedding planes occur along the entire length of the coastal exposures from Jakeʼs Point (Fig. 1, location 20) to Grandstand Rock (Fig. 1, location 24). The total thickness of FA3 is measured as c. 280 m (23 % of the total stratigraphic thickness of the Tumblagooda Sandstone).
An overview of the three distinct types of outcrop of Tumblagooda Sandstone that occur in the river gorges and coastal cliffs of Kalbarri National Park. Block diagrams show the hypothetical distribution of observed trace fossils in a 3×3 unit cube, if units contain vertical (blue), horizontal (red) or no (yellow) traces. Grey shows areas which cannot be observed, and absent units show those lost to erosion. Pie charts show proportion of existing vertical traces (blue/grey) and horizontal traces (red/grey) which can be observed with a given outcrop style, and the relative bias towards observed vertical/horizontal traces (red/blue) given equal proportions existing within the volume. Type 1 – Stepped Exposure. (a) An example of stepped exposure from The Loop. (b) Block diagram and pie charts given vertical and horizontal traces in every unit cube. (c) Block diagram and pie charts given vertical and horizontal traces in every alternate unit cube. Type 2 – Coastal Exposure. (d) An example of coastal exposure from Eagle Gorge. (e) Block diagram and pie charts given vertical and horizontal traces in every unit cube. (f) Block diagram and pie charts given vertical and horizontal traces in every alternate unit cube. Type 3 – Cliff Exposure. (g) An example of cliff exposure from Hawks Head Lookout. (h) Block diagram and pie charts given vertical and horizontal traces in every unit cube. (i) Block diagram and pie charts given vertical and horizontal traces in every alternate unit cube.

Facies association 3 consists almost entirely of stacked, medium- to very coarse-grained, trough-cross-bedded sandstones with frequent pebbly horizons (Fig. 5c). Trough-cross-bedded co-sets are separated by second-order (sensu Allen, Reference Allen1983) bounding surfaces which are typically near-horizontal (Fig. 13f). Occasionally channelized scour pathways cut across these surfaces, resulting in topographic lows lined with coarse gravel lags (Davies & Shillito, Reference Davies and Shillito2018, their fig. 1B). In the upper part of FA3 these trough-cross-bedded sandstones are occasionally separated by thin planar-bedded packages of medium- to coarse-grained sandstone containing vertical burrows. Measurements from foresets indicate a strongly unimodal palaeoflow to the NW (Fig. 5g).
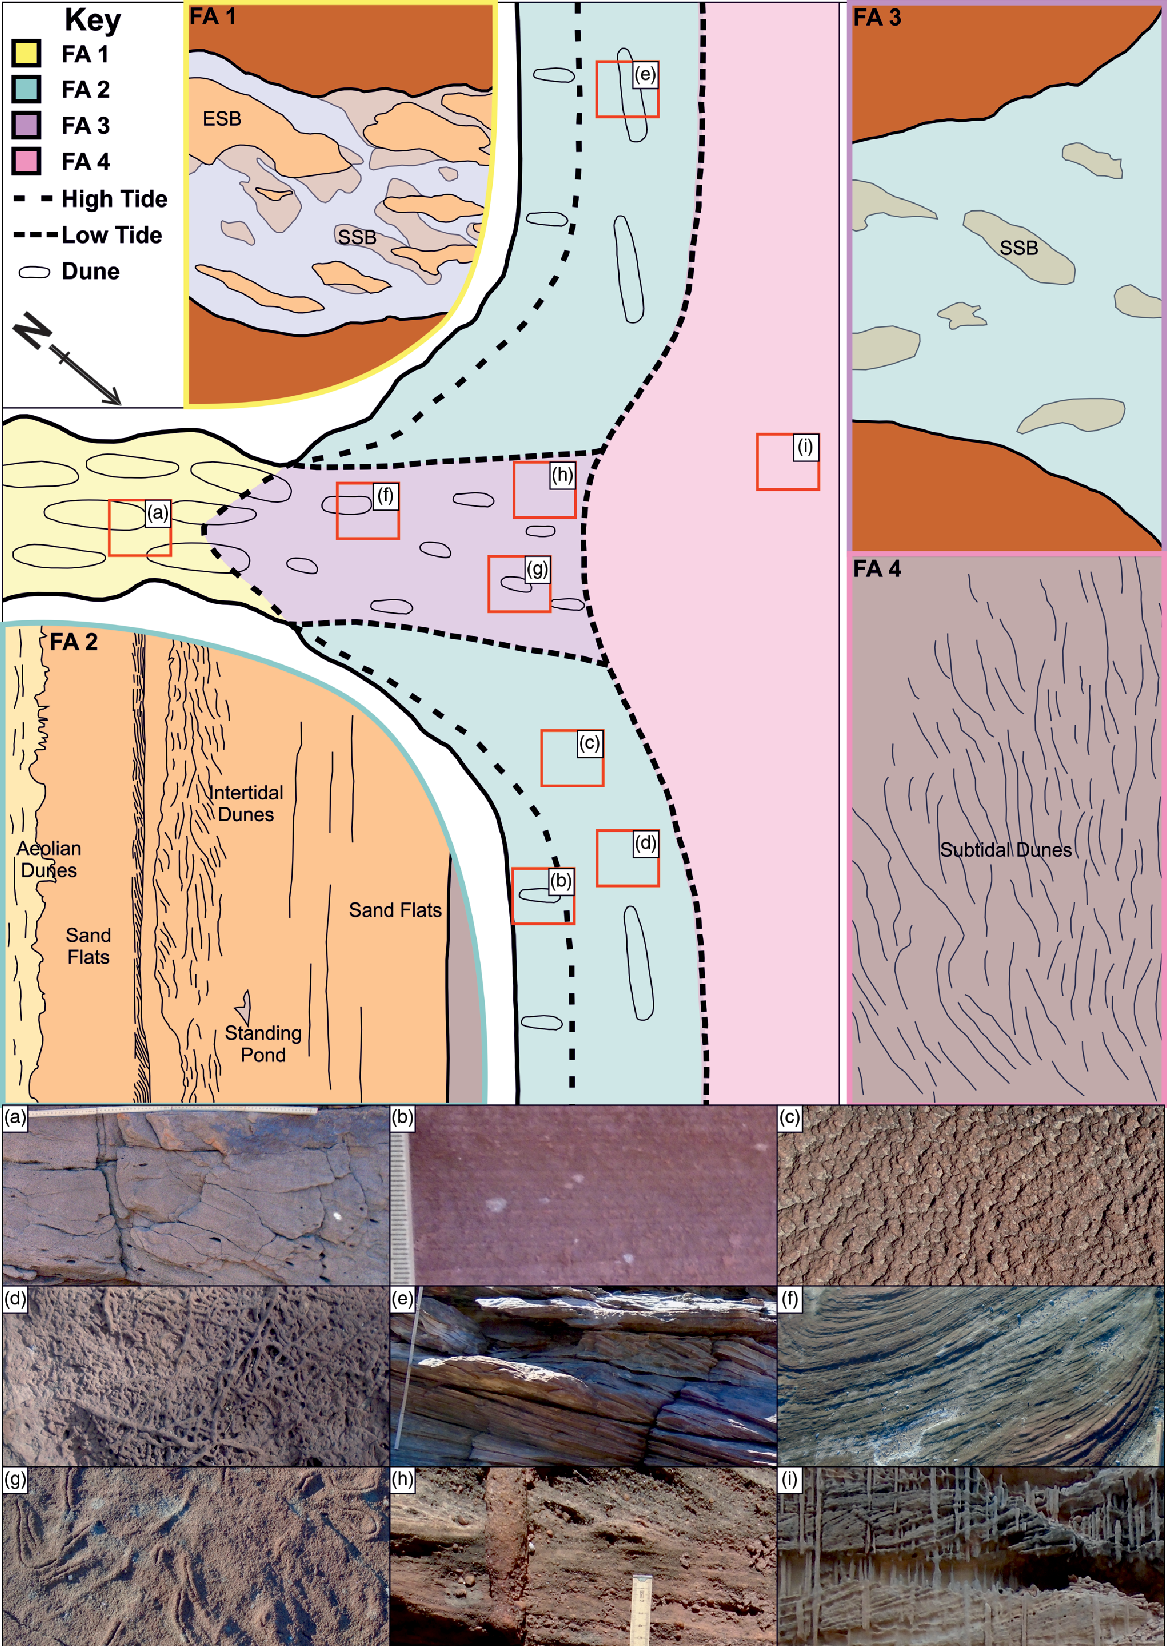
An overview of the depositional environment of the Tumblagooda Sandstone. Main schematic shows the broad depositional environment for all facies associations. Small schematics show a more detailed plan view highlighting the different sub-environments that are included within each facies association. ESB – emergent sand bar; SSB – submerged sand bar. Photos illustrate features from different areas of the facies associations as they are observed in the rock record. (a) Large-scale cross-bedded coarse sandstone containing rip-up clasts. (b) Pinstripe lamination. (c) Adhesion marks. (d) Densely bioturbated ‘Heimdallia Bed’. (e) Cross-beds from barform deposits. (f) A scoured horizontal surface showing truncated tops of trough cross-beds. (g) Psammichnites on the top of truncated cross-beds. (h) Skolithos in a thin planar coarse sandstone bed. (i) Dense piperock fabric cutting through large trough cross-beds.
With the exception of ubiquitous cross-bedding, few other physical sedimentary structures are seen in FA3, and no ripple marks or any other sedimentary surface features are seen on bedding planes. Trace fossils are infrequent and consist only of the horizontal trail Psammichnites, and, restricted to the top of the facies association, Planolites and Skolithos. The Psammichnites traces are notable because they can be seen to colonize the tops of truncated dunes, revealed by planform cross-sectional exposures of foresets. This implies that some of the erosional bounding surfaces are true substrates – in other words, not every erosional disruption of the mobile bedforms was immediately followed by further sedimentation, but rather by an interval of sedimentary stasis (Davies & Shillito, Reference Davies and Shillito2018).
The facies association contains the only mudstone in the whole Tumblagooda Sandstone (with the exception of the singular mud-draped ripple horizon in FA2d (Fig. 10b)), but this is not in situ, instead occurring as rare intraclasts up to 10 cm in diameter. The mud clasts are massive and barren of any microfossils (from our own micropalaeontological analyses).
3.c.2. FA3 – interpretation
The unimodal NW palaeoflow (perpendicular to the palaeo-coastline) and coarse sandstone lithology of FA3 resembles that of the fluvial strata within FA1, but is distinct because of the presence of trace fossils, infrequent planar-bedded horizons (Fig. 5c) and occasional mud clasts. It is unlikely that the strata record non-marine fluvial deposition because of (a) the absence of trace fossils in similar facies of FA1, and (b) the absence of burrows in all fluvial strata of similar age worldwide (Minter et al. Reference Minter, Buatois, Mángano, Davies, Gibling and Labandeira2016b). As FA2 consists of tidal flat sediments, and FA4 contains evidence for fully marine deposition (see Section 3.a.4), an explanation for the abundance of trace fossils within unidirectional cross-bedded strata may be found by considering this facies association to record the distal, marine-influenced reaches of a fluvial system, where physical fluid flow was dominantly river-dominated, but saline or brackish waters promoted the colonization of sediments by a restricted marine infauna. The lack of any physical evidence for emergence in FA3 suggests it was likely deposited in a fully submerged setting. These features fit with an estuarine depositional setting, although this is a cautious assertion as the scale of the outcrop does not permit identification of any incised valley.
The presence of scoured bounding surfaces that were later colonized by Psammichnites and Planolites traces can be explained by fluctuations in fluvial discharge or increased wave action (for example, as could be triggered by storm surges). The latter is considered most likely here, as the interval of stasis following erosion indicates that the dunes did not immediately readjust to a new flow regime (Davies & Shillito, Reference Davies and Shillito2018). Such a situation would arise due to a stochastic external disturbance to dune migration, as occurs when storm wave-levelling of dunes shifts the location of concentrated flow and deposition within an estuarine setting (e.g. Fruergaard et al. Reference Fruergaard, Andersen, Johannessen, Nielsen and Pejrup2013).
3.d. Facies association 4
3.d.1. FA4 – description
Outcrop of FA 4 is largely restricted to coastal cliffs, and bedding-plane exposures are only seen at localities 0–40 m from the top of FA4 (e.g. Red Hill, Tumblagooda Hill; Fig. 1 locations 18 and 19 respectively). These exhibit a moderate diversity of trace fossils, with an assemblage of sub-vertical and horizontal burrows (Arenicolites, Diplocraterion, Heimdallia, Laevicyclus, Phycodes, Rusophycus, Tumblagoodichnus) in association with vertical burrows (Daedalus, Funalichnus, Skolithos). The latter three ichnogenera are the only trace fossils that can be recognized in the vertical cliff outcrops that dominate FA4.
FA4 is similar to FA3 in that it is composed mostly of trough-cross-bedded medium to very coarse sandstones with foreset palaeocurrent measurements indicating a unimodal flow direction to the NW (Fig. 5d, h). However, unlike in FA3, these trough-cross-bedded sandstones are densely bioturbated, with Skolithos and Daedalus creating a piperock fabric. Additionally, the cross-bedded sandstones typically present as scour-based sets that are thicker and narrower than those in FA3, and, near the top of FA4, planar-bedded horizons separating packages of cross-bedded sandstones are seen, similar to those visible in FA2.
Facies association 4 is restricted to the uppermost 50 m (< 5 % total stratigraphic thickness) of the Tumblagooda Sandstone, and its base is marked by the first appearance of a Skolithos–Daedalus piperock ichnofabric.
3.d.2. FA4 – interpretation
The medium to very coarse sandstone lithology and unidirectional palaeoflow recorded in the lower parts of FA4 suggest it was deposited under the influence of the same estuarine system that deposited FA3. However, following the first instance of piperock fabric in the Tumblagooda Sandstone, the ichnodiversity of the succession increases (though not to levels seen in FA2). Ichnodiversity thus distinguishes FA4 from FA3 where the sedimentary facies are similar, and implies that the succession was deposited in the more distal reaches of the interpreted estuarine system.
The diversity of the richest ichnofauna in the stratigraphically higher exposures of FA4 is boosted by surficial trace fossils, which could be explained by the simple fact that more bedding planes are exposed here. However, some bedding surfaces are seen in large fallen blocks of the lower parts of FA4, along the coastal exposures, where, other than Psammichnites and Planolites, no surficial trace fossils are observed. Additionally, such ichnological diversity is not witnessed in any FA3 exposures that are rich in bedding planes. As such, the higher ichnodiversity towards the top of FA4 appears to relate to a genuine syn-depositional change in ecological conditions; albeit one that is recorded by only minimal change in the physical sedimentary character (i.e. occasional planar-bedded packages). As such, the terminal part of the Tumblagooda Sandstone could record the culmination of a transgression of saline waters, away from freshwater input from any river system (e.g. either due to being further offshore, or due to a shift in position or discharge from the adjacent fluvial–estuarine system).
4. Ichnology of the Tumblagooda Sandstone
The trace fossils of the Tumblagooda Sandstone are described here in terms of both ichnodiversity and the ichnodisparity because each of these provides different perspectives on the trace fossil communities. Ichnodiversity permits a direct comparison with previous work, and provides a rough estimate of the species richness of the tracemakers. However, this comes with the significant caveat that the same species can create multiple different traces, and the same trace can be produced by multiple different species (Ekdale et al. Reference Ekdale, Bromley and Pemberton1984). Twenty ichnotaxa have previously been recorded from the Tumblagooda Sandstone (Trewin & McNamara, Reference Trewin and McNamara1994), but new ichnological discoveries during the course of this study, combined with a revision and redescription of previously reported traces, brings the total number of ichnotaxa to 29 (Table 2). Trace fossils previously described by Trewin & McNamara (Reference Trewin and McNamara1994) are not discussed in detail in this section but are listed in Table 2 and illustrated in Figure 14.
All trace fossils that have been identified from the Tumblagooda Sandstone, organized based upon architectural design following Buatois et al. (Reference Buatois, Wisshak, Wilson and Mángano2017). 29 different ichnospecies from 14 different architectural design categories are reported
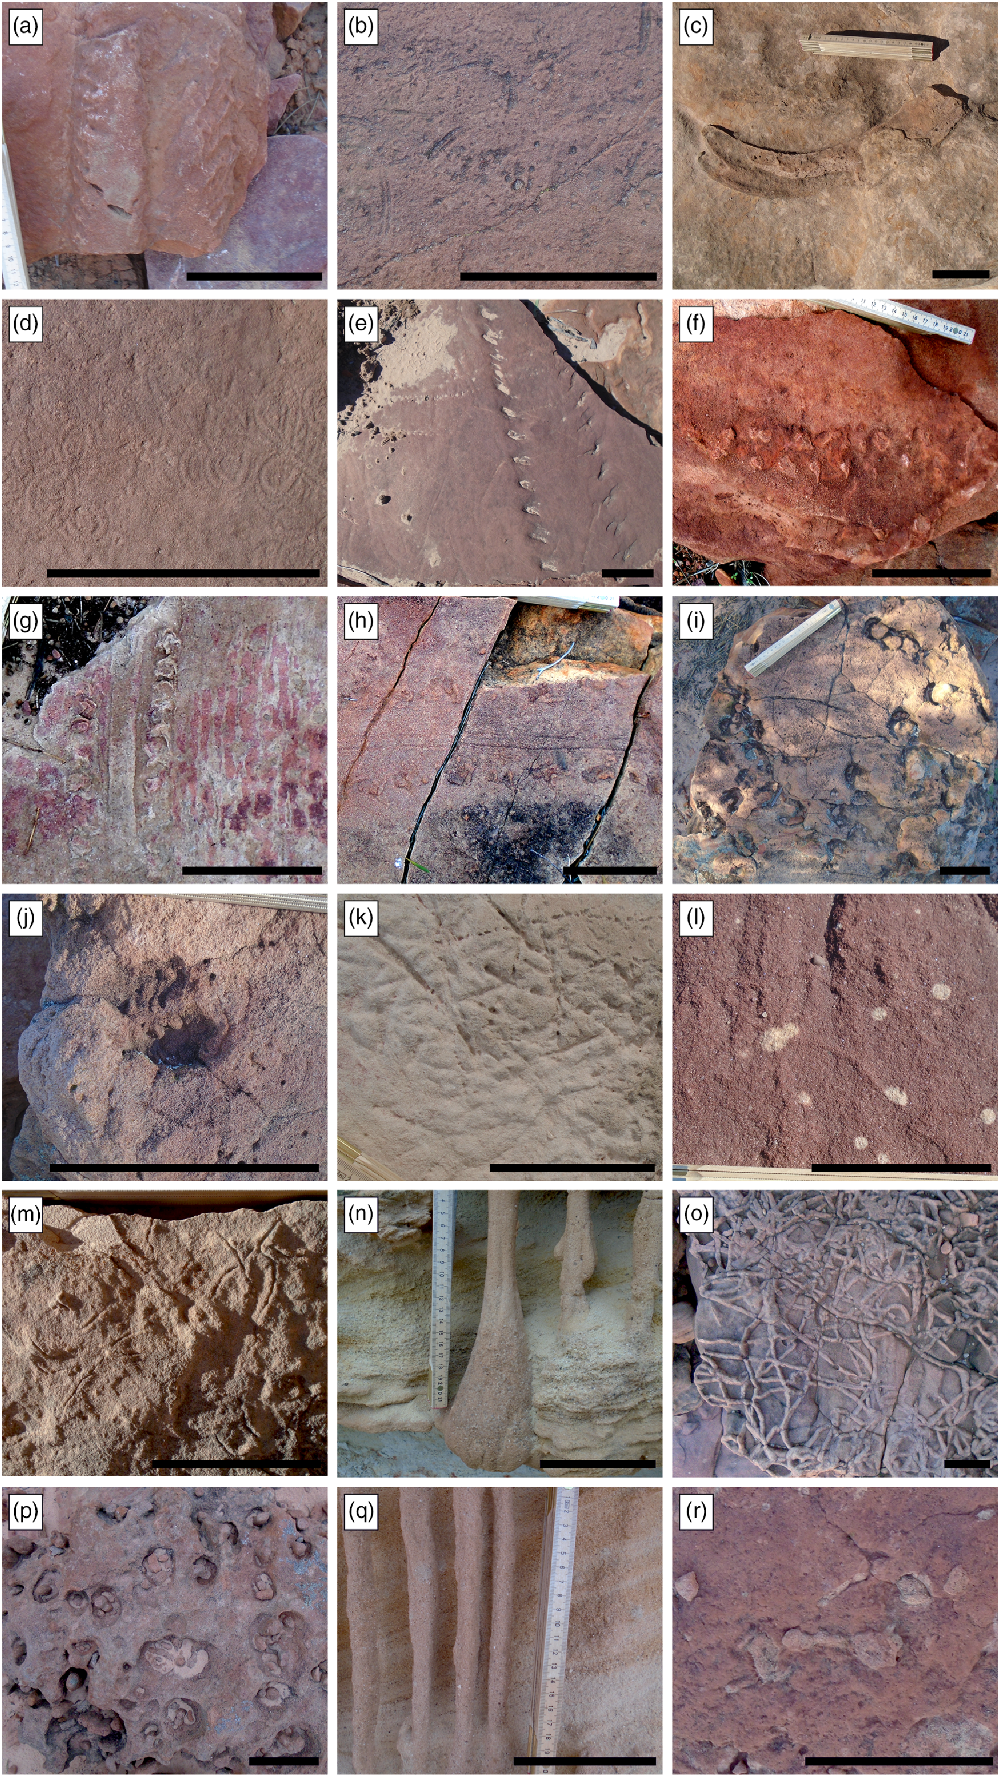
Trace fossils in the Tumblagooda Sandstone previously identified by Trewin & McNamara (Reference Trewin and McNamara1994). This includes traces which are here reassigned to new ichnogenera, and traces which are considered to be ichnotaxonomically invalid. (a) Cruziana isp. in positive hyporelief from FA2 at The Loop. (b) Didymaulichnus lyelli in negative epirelief from FA2 at The Loop. (c) Tumblagoodichnus hockingi in positive epirelief from FA2 at The Loop. (d) ‘Meander-loop Trail’ described and illustrated with a line drawing by Trewin & McNamara (Reference Trewin and McNamara1994), although photographic evidence is not provided. Found in negative epirelief on a bedding surface of a planar-bedded sandstone ascribed to FA2, at The Loop. (e) Diplichnites gouldi, in negative epirelief from FA2 at The Loop. (f) One side of a trackway thought to be assigned to Paleohelcura isp. in positive epirelief from FA2 at The Loop. A more complete specimen not observed in this study is figured by Trewin & McNamara (Reference Trewin and McNamara1994). (g) Protichnites isp. in negative epirelief with a large central drag mark, in FA2 at The Loop. (h) Siskemia isp. A, with parallel rows of footprints and two parallel central drag marks, in negative epirelief, from FA2 at The Loop. (i) Crescentichnus langridgei; originally ascribed to Selenichnites langridgei by Trewin & McNamara (Reference Trewin and McNamara1994), this ichnospecies has since been considered synonymous (Romano & Whyte, Reference Romano and Whyte2015). In negative epirelief from FA2 at The Loop. (j) Rusophycus trefolia in negative epirelief from FA2 at The Loop. (k) Open burrows ascribed to Didymauliponomos rowei, based upon a clearer example figured by Trewin & McNamara (Reference Trewin and McNamara1994) which was not directly observed during our work. Preserved in negative epirelief from FA2 at The Loop. (l) Planolites isp. in positive epirelief from FA3 at Red Bluff. (m) Psammichnites isp.; originally ascribed to Aulichnites, this ichnogenus was considered synonymous (Mángano et al. Reference Mángano, Buatois and Rindsberg2003), and hence has been reassigned. In positive epirelief, from FA3 at Red Bluff. (n) Daedalus isp. viewed in vertical section from FA4 at Rainbow Valley. (o) Heimdallia chatwini, the most commonly observed trace fossil in the Tumblagooda Sandstone, in positive epirelief from FA2 at Little Z-Bend. (p) Traces originally assigned to the new ichnogenus and ichnospecies ‘Lunatubichnus wittecarrensis’ (Trewin & McNamara, Reference Trewin and McNamara1994); close examination has revealed they are in fact a product of unusual weathering of Skolithos, caused by cementation of the sediment surrounding the original burrow. As such, L. wittecarrensis is considered ichnotaxonomically invalid. (q) Skolithos linearis, viewed in vertical section from FA3 at Eagle Gorge. (r) Burrows assigned to Diplocraterion parallelum based on a transverse section along a bedding surface. The trace appears to consist of paired burrows attached with spreite, from FA4 at Tumblagooda Hill. Black scale bar is 10 cm.
Ichnodisparity groups trace fossils based on their architectural designs, to highlight the broader morphological diversity – capturing variations in the ichnofauna at a more substantial level to provide a clearer idea of how the ecological make-up of communities varied across the different facies associations (Buatois & Mángano, Reference Buatois and Mángano2013). The traces of the Tumblagooda Sandstone are recognized as belonging to 14 different architectural design styles (after Buatois et al. Reference Buatois, Wisshak, Wilson and Mángano2017), showing a high level of ichnodisparity compared to the global norm for the Silurian (Minter et al. Reference Minter, Buatois, Mángano, Davies, Gibling and Labandeira2016 b), and these styles and their constituent ichnotaxa are discussed below.
4.a. Ichnotaxa
4.a.1. Bilobate trails and paired grooves
Four distinct ichnogenera from within this category have been previously identified; Cruziana, Didymaulichnus, Tumblagoodichnus and a ‘Meander-loop Trail’ (Trewin & McNamara, Reference Trewin and McNamara1994; Fig. 14). Of these, Cruziana, Didymaulichnus and the ‘Meander-loop Trail’ are observed uniquely on bedding surfaces, whereas Tumblagoodichnus, the most frequently observed trace of this style, is seen both on bedding planes and in vertical sections. This architectural style of trace fossil is constrained to FA2a, FA2b and FA2c, aside from a single example of Tumblagoodichnus observed in the stratigraphically highest levels of FA4.
4.a.2. Trackways and scratch imprints
There is a high abundance of trackways on bedding surfaces of the Tumblagooda Sandstone, from five ichnospecies of four ichnogenera. Of these, Diplichnites gouldi, ?Paleohelcura, Protichnites isp. and Siskemia isp. A have been previously identified by Trewin & McNamara (Reference Trewin and McNamara1994) (Fig. 14). A second, newly recognized ichnospecies of Siskemia (Siskemia isp. B) has been observed on a single bedding surface on the south side of The Loop. These trace fossils are only observed within FA2a and FA2b.
Siskemia isp. B
Five well-preserved examples of this ichnospecies occur on the single bedding surface from which it is known (Fig. 15a). As in Siskemia isp. A, two grooves spaced 1–2 mm apart occur between the track rows; however, in S. isp. B these paired grooves are typically discontinuous and repeated, 30–50 mm in length with gaps of 50–70 mm between the repetitions. The footprints forming the external part of the trackways are approximately circular, and up to 5 mm in diameter. These occur as symmetrical series of six footfall impressions, arranged with very little overlap and with repeat distance 90–110 mm. This is identified as a distinct ichnospecies due to the defined series length, the shape of the footprints, and typically discontinuous medial grooves.
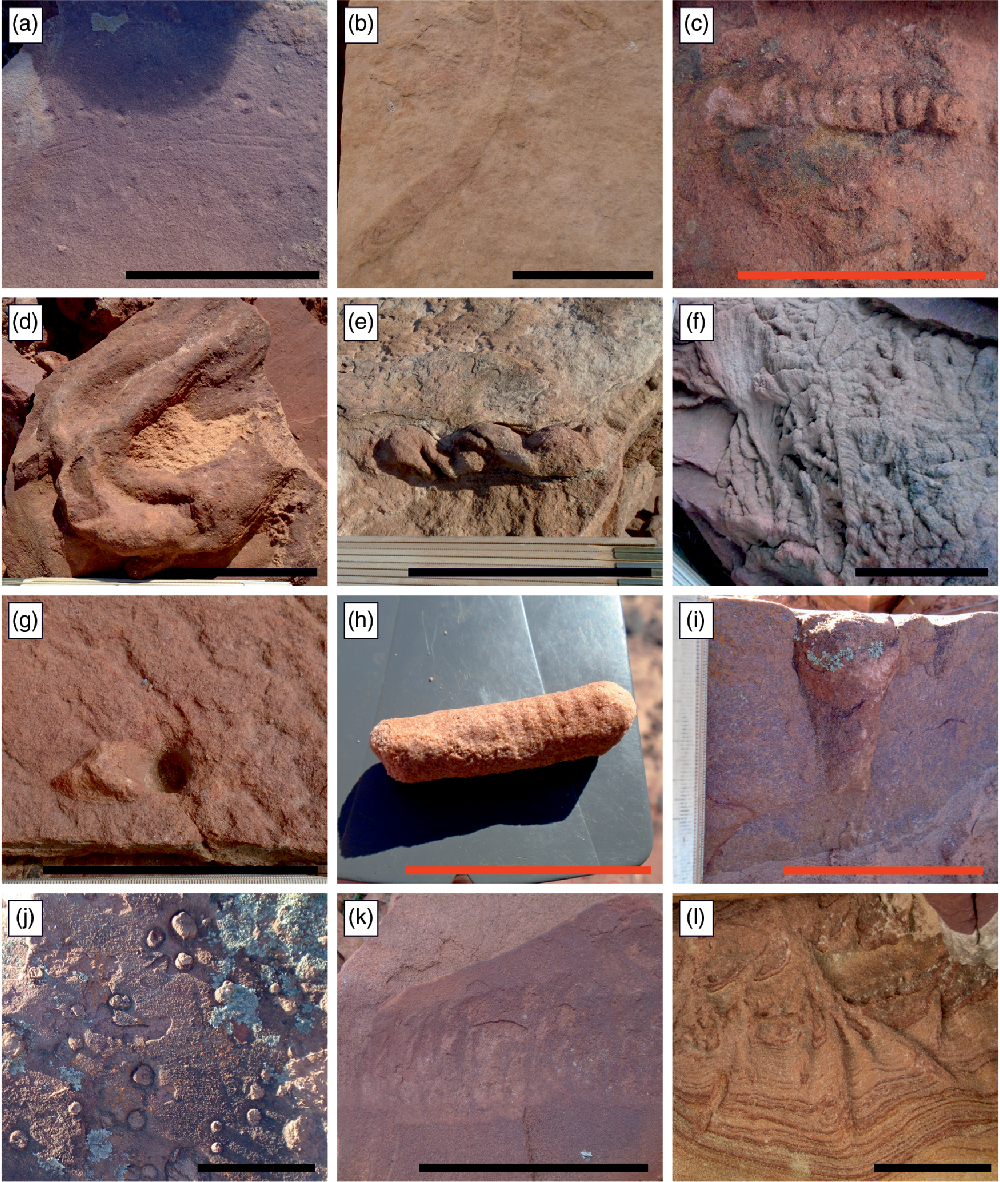
Trace fossils in the Tumblagooda Sandstone identified for the first time in this study. (a) Siskemia isp. B in negative epirelief, from FA2 at The Loop. Note the paired medial grooves and six discernible footfall impressions per cycle. (b) Beaconites capronus on a bedding surface from FA2 at The Loop. Note the sharply angular meniscate infill and clear burrow lining. (c) Taenidium serpentinum in positive epirelief from FA2 at Fourways. Note the large, homogeneous meniscate infill and lack of a burrow lining. (d) Phycodes isp. in positive epirelief from FA4 at Red Hill. (e) Helicodromites isp. in positive epirelief from FA2 at The Loop. The shaft of the burrow forms a tight, translated spiral. (f) Paradictyodora isp. in positive epirelief from FA2 at the Z-Bend. In association with many examples of Heimdallia chatwini, this trace differs from the shape of the translated J-tube forming the main structure of the burrow, as it tapers downwards. (g) Trusheimichnus isp. in both positive and negative epirelief from FA2 at The Loop. The sole example of this trace observed in the Tumblagooda Sandstone, and a new ichnospecies; note the circular depression to the right of the image, and the pyramidal mound to the left of this hollow. (h) Funalichnus strangulatus, as a loose trace from ?FA4 at Eagle Gorge. This trace is distinguished most clearly from the frequently observed Skolithos by the pronounced ribbing down one side. (i) Laevicyclus isp. observed in cross-section from FA4 at Red Hill. Note the broad conical burrow top. (j) Paired burrows observed in FA4 at Red Hill, assigned to Arenicolites isp. The lack of any evidence of internal spreite distinguishes these from the previously reported Diplocraterion parallelum (Trewin & McNamara, Reference Trewin and McNamara1994). (k) Polarichnus isp. observed in positive epirelief from FA2 at The Loop. Note the characteristic reversing menisci marking the top margin of the burrow. (l) Fascifodina isp. observed in oblique section from FA2 at The Loop. Note the wide sub-vertical branches from the main shaft. Black scale bar – 10 cm; red scale bar – 5 cm.
4.a.3. Bilaterally symmetrical short, scratched impressions and burrows
Two ichnospecies from this category have previously been identified: Rusophycus trefolia and ‘Selenichnites langridgei’ (Trewin & McNamara, Reference Trewin and McNamara1994; Fig. 14), the latter now reassigned to Crescentichnus langridgei (after Romano & Whyte, Reference Romano and Whyte2015). These ichnospecies are rare throughout the Tumblagooda Sandstone, with a cumulative 12 examples known. Both are observed on bedding plane exposures, and in most examples they are observed in association with one another. Aside from one example of Rusophycus known from the top of FA4, the traces are restricted to FA2a and FA2b.
4.a.4. Passively filled horizontal burrows
A single ichnospecies of passively filled horizontal burrow, Didymauliponomos rowei, was identified in previous studies (Trewin & McNamara, Reference Trewin and McNamara1994; Fig. 14). We observed two examples, both occurring unassociated with any other trace fossils within FA2a, and both occurring on bedding planes as with all previous examples known from the formation.
4.a.5. Simple actively filled (massive) horizontal to oblique structures
This architectural style is observed in a single ichnospecies, Planolites isp., which is known to occur in FA2a, FA3 and FA4, only recorded on bedding surfaces. This trace is most abundant in FA2a, with infrequent dense clusters occurring on true substrates within FA3, in association with Psammichnites (Davies & Shillito, Reference Davies and Shillito2018). A single example is known from the stratigraphically highest exposures of FA4.
4.a.6. Simple actively filled (meniscate) horizontal to oblique structures
A single meniscate burrow ichnospecies was identified from the Tumblagooda Sandstone by Trewin & McNamara (Reference Trewin and McNamara1994), ‘Beaconites antarcticus’. However, the subsequent revision of the ichnotaxonomy of meniscate burrows (Keighley & Pickerill, Reference Keighley and Pickerill1994) means that examples of these traces are more accurately assigned to two different ichnotaxa: B. capronus and Taenidium serpentinum. A cumulative five examples are known from bedding plane surfaces within FA2a.
Beaconites capronus Howard & Frey Reference Howard and Frey1984
B. capronus is known from two long horizontal burrows exhibiting thin linings and a heterogeneous tight chevronate pattern to their meniscate infill (Fig. 15b). The grain size of the infill matches that of the surrounding medium–coarse sediment, although in places it appears to be ordered into alternating packages of slightly finer and coarser sand.
Taenidium serpentinum Heer Reference Heer1877
Three specimens are referred to T. serpentinum, occurring on the same bedding surface. These burrows are unlined, and have meniscate infill divided into well-spaced, sub-rectangular packages (Fig. 15c). The infilling sediment is homogeneous medium sand, the same as the surrounding lithology. They are distinguished from alternative ichnospecies of Taenidium by shallow curvature of the menisci and the homogeneous nature of the infill.
4.a.7. Complex actively filled horizontal structures
‘Aulichnites’ was described from FA3 by Hocking (Reference Hocking1991) and Trewin & McNamara (Reference Trewin and McNamara1994) (Fig. 14). However, this has since been reassigned to Psammichnites (Minter et al. Reference Minter, Buatois, Mángano, MacNaughton, Davies and Gibling2016 a; Davies & Shillito, Reference Davies and Shillito2018), following the redescription of Aulichnites as a junior synonym (Mángano et al. Reference Mángano, Buatois and Rindsberg2003). Psammichnites is dominantly observed in patches of high abundance on bedding surfaces within FA3, although three examples were observed on bedding surfaces of FA2a and FA4.
4.a.8. Horizontal burrows with horizontal to vertical branches
One example of a branching horizontal burrow was observed upon the surface of a loose block within FA4 at Red Hill. This trace is previously undescribed from the Tumblagooda Sandstone, and has been assigned to an unknown ichnospecies of Phycodes.
Phycodes isp. Richter Reference Richter1850
The single burrow exhibiting multiple curved sub-horizontal branches was observed in medium sandstone on the surface of a loose block from the stratigraphically highest parts of FA4. The burrow shaft is 50 mm in diameter before it branches, and the individual branches are a maximum of 25 mm in diameter, narrowing towards their distal ends (Fig. 15d). The observed branches overlap one another, curving a full 180° along their length.
4.a.9. Horizontal helicoidal burrows
A new discovery of a single example of a horizontal helicoidal burrow was observed within FA2a, in a loose block found on the north side of The Loop. This trace has been assigned to Helicodromites mobilis.
Helicodromites mobilis Berger Reference Berger1957
H. mobilis occurs as a specimen 95 mm long with a shaft diameter of 13 mm. Two full whorls are visible in the specimen, and the total diameter of the spiral is 25 mm (Fig. 15E). The burrow is preserved in positive epirelief in medium sandstone. As only one specimen is known from a loose block, detailed palaeoenvironmental context of this trace remains unknown beyond the fact that it was formed within FA2.
4.a.10. Burrows with complex vertically oriented spreiten
Burrows with complex vertical spreite are the most abundant trace fossils known from the Tumblagooda Sandstone. Two ichnospecies have previously been reported, Daedalus isp. and Heimdallia chatwini (Trewin & McNamara, Reference Trewin and McNamara1994; Fig. 14) occurring within FA2a, FA2c and FA4, and are supplemented by Paradictyodora isp., identified here for the first time. Daedalus is commonly observed in vertical sections within FA4, although it is also observed on cross-section on some bedding surfaces. Heimdallia is observed both upon bedding surfaces and in vertical section within FA2, with two known examples from FA4 at Tumblagooda Hill. Beds densely packed with Heimdallia are a distinctive motif within FA2, with 42 distinct Heimdallia beds observed in a 68-m section at Z-Bend – 10.2 % of the total stratigraphic thickness.
Paradictyodora isp. Olivero et al. Reference Olivero, Buatois and Scasso2004
A single example of Paradictyodora has been positively identified in association with Heimdallia within the densely bioturbated facies of FA2 (Fig. 15f). Like H. chatwini, Paradictyodora is formed of horizontally stacked, vertically oriented spreiten which curve downwards. However, unlike Heimdallia the plane containing the J-tube is approximately orthogonal to the direction of displacement, whereas in Heimdallia the plane is parallel to displacement direction.
4.a.11. Mound-shaped structures
Trusheimichnus Schlirf Reference Schlirf2006 n. isp.
A short, unlined, unbranched, vertical burrow with a circular cross-section associated with a triangular pyramidal mound next to the opening (Fig. 15g). The shaft of the burrow remains unfilled and is 25 mm wide by 23 mm deep. The mound is steep-sided, 17 mm tall and the same width as the burrow along the edge which the two components of the trace share. The length of the mound (i.e. the maximum distance that it reaches from the shaft of the burrow) is 36 mm. This specimen differs from other known examples of Trusheimichnus due to the shortness and straightness of the burrow shaft and the lack of a terminal chamber, and as such it is concluded to belong to an unidentified ichnospecies.
The sole example of Trusheimichnus was found within a loose block in proximity to FA2 at the south side of The Loop, so its precise environmental context cannot be determined. However, as the trace-bearing surface preserves the original topography of the biogenic structure it records a true substrate, with the burrow formed during a period of sedimentary stasis. The sharp, steep sides of the mound beside the burrow show that it was formed in damp, subaerially exposed sediment, as dry subaerial sand would collapse, and wet submerged sand would form a shallower slope (Tegzes et al. Reference Tegzes, Albert, Paskvan, Barabási, Vicsek and Schiffer1999).
4.a.12. Vertical unbranched burrows
Vertical burrows occur in high abundance in the Tumblagooda Sandstone, dominantly within the piperock of FA4 (Hocking, Reference Hocking1991; Trewin & McNamara, Reference Trewin and McNamara1994). Two ichnospecies have been previously described, ‘Lunatubichnus wittecarrensis’ and Skolithos linearis (Fig. 14). ‘Lunatubichnus wittecarrensis’ (Trewin & McNamara, Reference Trewin and McNamara1994) is here considered to be an invalid ichnotaxon because further investigation of the traces reported from the coastal cliffs instead reveals them to be weathered cross-sections through Skolithos and Daedalus (Fig. 14). Two other ichnospecies of vertical unbranched burrows have been recognized for the first time: Funalichnus strangulatus, known from a single loose example at Eagle Gorge, and Laevicyclus, observed in two examples from the stratigraphically highest parts of FA4 at Tumblagooda Hill.
Skolithos is by far the most common trace fossil from within this grouping, forming a dense piperock in the coastal assemblages of FA4. It is most frequently observed in vertical section, although burrow cross-sections are also observed on bedding planes. Skolithos is also seen on rare marker horizons towards the top of FA3, again in vertical section, and sparsely distributed throughout the rocks of FA2a, FA2b and FA2c as short burrows on bedding surfaces and occasionally in vertical section. The variable presentation of this trace is a direct result of the different outcrop exposure between the inland river gorges and the coastal cliffs.
Funalichnus strangulatus Fritsch Reference Fritsch1883
A straight, unbranched burrow, 30 mm long by 10 mm wide with a slightly off-round cross-section. The burrow is ornamented with closely spaced transverse ridges along one side, whereas the opposite side of the shaft is smooth and unmarked (Fig. 15h). The infill is structureless and compositionally the same as the medium- to coarse-grained sandstones of bioturbated beds from close to where the specimen was discovered.
As only one example was identified, occurring within a loose block, the broader sedimentological and palaeoenvironmental context of the burrow remains unknown. However, its location amidst a scree slope towards the top of the coastal exposure at Eagle Gorge (Fig. 1, location 22) restricts it to the upper reaches of FA3 or FA4.
Laevicyclus Quenstedt Reference Quenstedt1879
Two examples of vertical, cylindrical burrows from Tumblagooda Hill are assigned to Laevicyclus isp. (Fig. 15i). These burrows are unbranched and open out into a cone towards the top of the shaft, differentiating them from the multitude of other vertical burrows known from FA4. Both examples are at least 75 mm long, although they disappear into the bed below so their total lengths are unknown. At the widest point of the cone the burrows reach 20 mm in diameter, narrowing to 10 mm for the majority of the shaft. The two examples occur in medium–coarse planar-bedded sandstone, and are in association with Skolithos.
4.a.13. Vertical single U- and Y-shaped burrows
All U-shaped burrows previously described from the Tumblagooda Sandstone were assigned to Diplocraterion parallelum, with ‘paired burrows’ also considered to belong within Diplocraterion due to the presence of spreite (Trewin & McNamara, Reference Trewin and McNamara1994; Fig. 14). Here two other ichnospecies are reported, Arenicolites isp. and Polarichnus isp. Arenicolites occurs as paired burrows with no evidence for internal spreite, on bedding surfaces near the top of FA4 at Tumblagooda Hill. A single specimen from a loose block of FA2 at The Loop is assigned to Polarichnus.
Arenicolites isp. Salter Reference Salter1857
Paired burrows observed on bedding surfaces near the top of Tumblagooda Hill are assigned to Arenicolites isp. (Fig. 15j). These burrows are distinguished from the tops of the simple vertical burrows that dominate much of FA4 as the burrow tops are consistently closely associated with one other, with a separation of c. 30–50 mm. The diameter of the burrow shafts ranges from 5 to 12 mm, and there is no evidence of spreite between the two shafts, distinguishing these from Diplocraterion.
Polarichnus isp. Narbonne et al. Reference Narbonne, Gibling and Jones1979
Polarichnus is considered a U-shaped burrow based upon the type specimen (Narbonne et al. Reference Narbonne, Gibling and Jones1979), but the burrow shaft is not seen in the Tumblagooda example; instead being recognized by the up-thrusted medial surficial epirelief ridge of sediment, exhibiting opposing directions of meniscate ridges (Fig. 15k). The same presentation is seen in trace fossils also assigned to Polarichnus in similar facies of the Ringerike Group of Norway (Davies et al. Reference Davies, Sansom and Turner2006). A single specimen of Polarichnus was observed in the Tumblagooda Sandstone, in a loose block of medium sandstone from within FA2 at The Loop. The trace is 125 mm long and 58 mm wide.
4.a.14. Burrows with shaft or bunch with downwards-radiating probes
A single example of a previously undescribed trace fossil with a shaft and downwards-radiating branches was observed in vertical section from within FA2a at The Loop. This trace has been assigned to an unknown ichnospecies of Fascifodina.
Fascifodina isp. Osgood Reference Osgood1970
Fascifodina isp. is interpreted based on one trace cutting obliquely through planar-bedded medium sandstone at The Loop. The main shaft of the trace is cylindrical and 150 mm long with a diameter of 18 mm. This shaft then branches into four probes which all originate from the same part of the main shaft, radiate downwards and outwards and bulge along their length (Fig. 15l). The trace is believed to record the deposit-feeding behaviour of a vermiform organism (Osgood, Reference Osgood1970).
4.b. Trace fossil associations
Trewin & McNamara (Reference Trewin and McNamara1994) identified two main trace fossil associations – Heimdallia–Diplichnites and Skolithos–Diplocraterion – in their original study of the ichnofauna, and paired these with the predefined facies associations of Hocking (Reference Hocking1991). These associations were later reassigned into ichnofacies by McNamara (Reference McNamara2014), with the ichnofauna of FA2 considered to belong to the non-marine Scoyenia ichnofacies and that of FA4 to the marine Skolithos ichnofacies. Here, we consider how the trace fossils are associated with one another on a bed-by-bed level rather than at the broader scale previously employed. The purpose of this is to understand the direct interactions between the traces to interpret which behaviours were occurring in the same localized spaces within similar time frames, rather than an overview of what was occurring in the same broad environment.
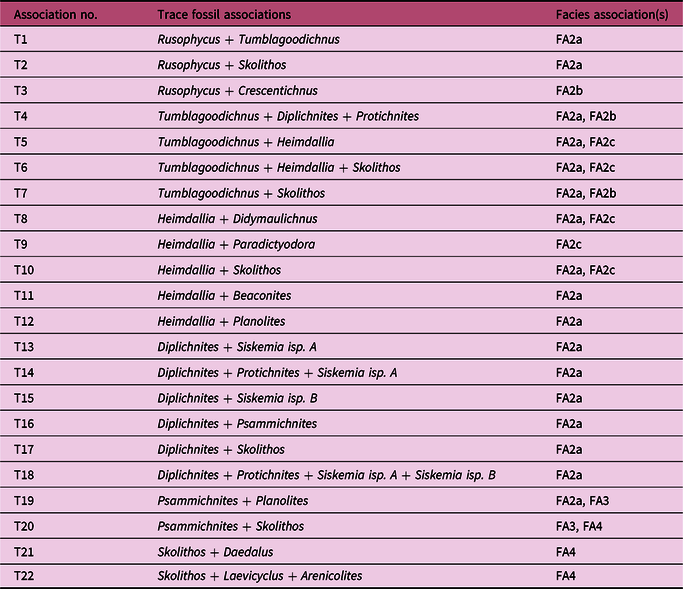
This approach has led to 22 different trace fossil associations (instances where two or more distinct traces occur in the same bed) being recognized from the Tumblagooda Sandstone, which are detailed in Table 3. Of these associations (T1–T22), 19 occur in FA2, 3 occur in FA4 and 2 occur in FA3 (one of which is shared with FA2 and the other with FA4). The 22 individual associations can be clustered into six distinct groups (A–F) based upon qualitative observations of the architectural designs of the traces, and supported by multivariate cluster analysis of the trace fossil associations (Fig. 16). These were formed in different sub-environments of the Tumblagooda depositional setting, demonstrating original ecological partitioning.
Trace fossil associations of the Tumblagooda Sandstone. All 22 trace fossil associations observed in the Tumblagooda Sandstone are listed, along with the facies associations in which they occur and sedimentary structures that they are associated with
Multivariate cluster analysis using Wardʼs method of trace fossil associations. This approach leads to the same six groupings of trace fossil associations as qualitative clustering based upon architectural designs present.

4.b.1. Association Group A – Heimdallia-dominated (T5, T6, T8, T9, T10, T11, T12)
This group of shallow infaunal trace fossil associations is dominated by Heimdallia, is the most common and is consistently present for the entire thickness of FA2 (Fig. 5b). The extent of bioturbation varies from occasional overlapping traces to total destruction of any primary bedding. The degree of bioturbation likely reflects a spatial patchiness to burrowing intensity (Marenco & Hagadorn, Reference Marenco and Hagadorn2019). On areas of the bedding surfaces where the burrows are sparse, surface features remain intact and the traces are often seen in association with subaqueous and emergent sedimentary surface features including wave ripple marks and adhesion marks. Skolithos is a common minor element of this assemblage, appearing in low abundance on some less densely bioturbated bedding surfaces. The other traces which occur in this group are: Beaconites, Didymaulichnus, Pardictyodora, Planolites and Tumblagoodichnus.
Whilst Tumblagoodichnus is recognized in association with this group (T5, T6), in these instances it always originates from beds stratigraphically above those containing Heimdallia, demonstrating that it is a palimpsest upon the original ichnofabric. The association between Heimdallia and Tumblagoodichnus has previously been noted, and interpreted as both coincidental (with Tumblagoodichnus as the record of temporary subsurface refuges made by arthropods) (Trewin & McNamara, Reference Trewin and McNamara1994) or as ‘hunting’ behaviour (with the animal responsible for Tumblagoodichnus scooping down through the sediment to eat the animal creating Heimdallia) (McNamara, Reference McNamara2014; Bradley et al. Reference Bradley, Redfern, Hodgetts, George and Wach2018). The latter contention is improbable given that the Tumblagoodichnus, originating from overlying beds, would have been formed on timescales of days to years after the Heimdallia burrowing activity.
4.b.2. Association Group B – Tumblagoodichnus-dominated (T1, T7)
Tumblagoodichnus is one of the most abundant trace fossils in the Tumblagooda Sandstone (Table 2), and occurs in direct association with sedimentary surface textures indicative of subaerial emergence, including adhesion marks, setulfs and wave ripples. Whilst there is some overlap with associations in groups A and C, where Tumblagoodichnus also plays an accessory role, it is the major trace in two associations which also contain Rusophycus and Skolithos. In these associations, burrow tops occurring on adhesion-marked surfaces suggest that some of the burrows may have been formed subaerially, although it is difficult to ascertain the relative timing of burrowing and emergence of the substrate. This group of associations is known to occur throughout the full stratigraphic thickness of FA2, specifically within FA2a and FA2b.
4.b.3. Association Group C – Trackways-dominated (T4, T13, T14, T15, T16, T17, T18)
This group of trace fossil associations is predominantly epifaunal, comprised of arthropod trackways (Diplichnites, Protichnites, Siskemia) which are occasionally associated with burrows (Skolithos, Tumblagoodichnus and Psammichnites). This group of associations is observed from the full thickness of FA2, occurring within FA2a and FA2b within similar facies to those where group B is found. The traces are associated with a range of both subaqueous and emergent sedimentary surface textures; wave ripple marks, and frequently adhesion marks, indicating that some of the traces in this group were formed subaerially.
4.b.4. Association Group D – Skolithos-dominated (T21, T22)
This group of trace fossil associations is dominantly comprised of vertical infaunal traces which together produce a piperock fabric. The main constituent traces are Skolithos and Daedalus, with Arenicolites and Laevicyclus in the upper exposures of FA4. The burrows occur only within subaqueous sedimentary strata, within trough-cross-bedded medium to very coarse sandstones. The longest burrows penetrate to depths of over 1 m: lengths that are not witnessed when Skolithos appears as an accessory trace in the other associations (Fig. 17). Burrows originate only from topsets in the trough-cross-bedded sandstones and are not seen terminating against foreset surfaces, indicating burrowing activity commenced during intervals of sedimentary stasis post-dating dune migration (Fig. 18).
Comparison of the typical length of Skolithos in the piperock fabric of FA4 vs those found as accessory traces in other associations, particularly in FA2. (a) Representative Skolithos from FA4, beginning at the top surface beside the shrub and cutting down through all of the cross-bedding. (b) A representative Skolithos from FA2 occurring in planar bedding sandstone, showing the vastly shorter length (approximately 8× shorter). Black scale bar – 10 cm.

A schematic view of coastal exposures of FA4, illustrating the consistency of palaeoflow and the locations within trough-cross-bedded units where burrows originate. (a) A photo of an exposure at Rainbow Valley. (b) A schematic drawing of the outcrop, highlighting the different trough-cross-bedded sediment packages. Flow directions are reported on bars below the line drawing following Davies et al. (Reference Davies, McMahon and Shillito2018), with colours corresponding to packages. The bar is aligned with the outcrop, drawn looking east. The red line illustrates the only surface where it is clear burrows originate – it appears that the system was only bioturbated during periods of stasis, following the deposition of all of the observed trough-cross-bedded sandstones. (c) A photo of an exposure between Red Bluff and Mushroom Rock. (d) The corresponding line drawing. Colours of sediment packages correspond to palaeocurrent measurements on the bars to the right of (c). Bars are aligned with the outcrop, drawn looking NE, and palaeoflow measurements are very similar to those reported in (b). Again, the red line marks the only surface where it is clear burrows originated, at the top of the outcrop. Black scale bar – 1 m.

4.b.5. Association Group E – Psammichnites-dominated (T19, T20)
This group is mostly comprised of shallow infaunal traces and represents the major ichnological signature in FA3, containing Psammichnites, Planolites and Skolithos. Psammichnites occurs in high-density patches on erosional bounding surfaces between subaqueously deposited trough-cross-bedded co-sets (Davies & Shillito, Reference Davies and Shillito2018), alongside occasional patches of Planolites. Skolithos rarely occurs in association with Psammichnites, and where it does it is as a result of a later overprinting of the original fabric from a higher bed.
4.b.6. Association Group F – Rusophycus-dominated (T2, T3)
This group of trace fossil associations is the least common, restricted to disparate locations throughout FA2. The associations contain Crescentichnus, Rusophycus and Skolithos, and dominantly occur in mixed subaqueous-emergent strata of FA2a. A solitary occurrence in FA2b is on an erosional bedding surface, with both Rusophycus and Crescentichnus in very high concentrations (Trewin & McNamara, Reference Trewin and McNamara1994). All other examples contain a much lower density of trace fossils on planar-bedded surfaces with no sedimentary surface textures. Whilst it is likely that Rusophycus and Crescentichnus were produced at the same time (they are thought to be produced by the same euthycarcinoid animals; Trewin & McNamara, Reference Trewin and McNamara1994), in the association between Rusophycus and Skolithos, Skolithos post-dates and overprints the fabric from above horizons.
5. Marine or non-marine? Uniting sedimentological and ichnological evidence
As shown in Figure 4, signatures in the rock record can be used to infer a wide range of different depositional states including some distinction between marine and non-marine. A recent review emphasized this sedimentological and ichnological complexity in the fluvio-tidal transition zone (Shchepetkina et al. Reference Shchepetkina, Gingras, Mángano and Buatois2019), describing the broad suite of sedimentary structures which may occur within it. Table 4 illustrates the extent to which physical sedimentological phenomena of the Tumblagooda Sandstone are indicative, or not, of environmental conditions pertaining to a marine influence. When only physical sedimentological evidence is considered, there are few features that are definitively marine or definitely non-marine and it is only possible to diagnose that the majority of the Tumblagooda Sandstone was deposited in subaqueous or emergent settings. However, FA2 has two sedimentological characteristics that allow a reasoned explanation for the extent of marine deposition throughout the formation: (1) the suite of co-occurrent sedimentary structures is significantly more likely to have formed in marine (and by extension saline or brackish) than non-marine conditions; and (2) it lacks the extensive unidirectional trough cross-bedding that is at least partially present in all the other three facies associations. Whilst there are small patches of convincing aeolian sandstone within FA2 (FA2e), it is likely that this marks the landward extent of a littoral depositional environment – in short, it is not unexpected to see aeolian sand dunes on a beach, but it is far less likely to observe instances of waning-associated flow-reversal (e.g. Fig. 11) outside of the tidal realm. At the other end of the environmental spectrum, FA1 lacks evidence for emergence but contains evidence for subaqueous conditions (Table 4). There is no evidence for any of the other descriptors shown in Figure 4 (Table 4), but the architecture and sedimentary signatures of FA1 are consistent with fluvial deposition.
Definite environmental origins of sedimentary structures
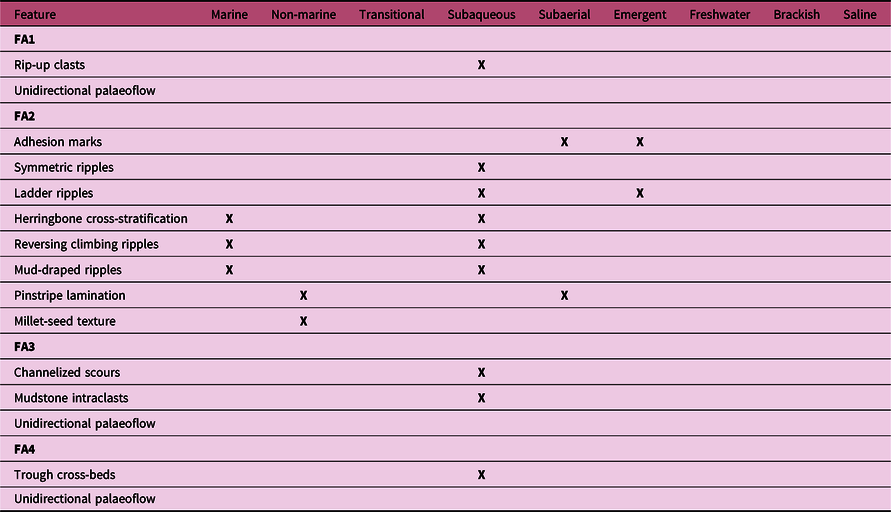
Note: Features that can be definitively identified as indicative of marine or non-marine formation, following the classification scheme outlined in Figure 4.
Demonstrably marine-influenced settings of the Tumblagooda depositional environment (FA2) thus contain the highest abundance of trace fossils, the greatest ichnodiversity and the greatest ichnodisparity, whereas the fully freshwater subaqueous settings in the Tumblagooda depositional environment (FA1) were barren of tracemakers. The correlation between ichnodiversity, ichnodisparity and evidence for marine conditions can, by extension, be used to infer salinity and environment in the other facies associations, which are less clear from a purely sedimentological standpoint.
FA3 has the second lowest ichnodiversity and ichnodisparity and is sedimentologically similar to FA1, with no evidence of emergence, and direct evidence of subaqueous deposition (Table 4). This implies physical fluvial deposition, but with greater ecological similarity to FA2 revealed by the presence of any trace fossils. If freshwater conditions restricted tracemakers during the deposition of FA1, the most likely explanation here is that there was an increase in salinity in FA3 (i.e. brackish conditions). Indirect evidence for this comes from the truncated and Psammichnites-colonized bedforms, explainable by wave attack of subaqueous estuarine dunes (Davies & Shillito, Reference Davies and Shillito2018) and which would imply mixing of saline and freshwater.
FA4 shares sedimentary signatures with FA2 and FA3, and exhibits ichnodiversity and ichnodisparity between that of the two facies associations. This suggests either that: (1) it was deposited under conditions where salinity was still somewhat affected by freshwater dilution of marine waters; or (2) it was deposited under fully subaqueous nearshore marine conditions where nutrients were less universally abundant than in the depositional environment of FA2. The latter is considered more likely as trace fossil abundance is very high, but there are few unequivocal deposit feeding traces, such as are common in FA2. Intertidal areas provide habitats for both vertical burrowers (e.g. interface feeders at high tide), as well as deposit feeders and grazers at low tide (Gingras et al. Reference Gingras, MacEachern and Dashtgard2012), whereas further offshore sediment is less nutrient-rich and filter feeding from the water column is more prevalent (Gingras et al. Reference Gingras, MacEachern and Dashtgard2012).
5.a. High-resolution palaeoenvironmental insights
The Tumblagooda Sandstone is exceptionally suited to the study of bedding planes, due to its extensive outcrop and low tectonic dip (Davies & Shillito, Reference Davies and Shillito2018). Many of these bedding planes within FA2 and FA3, exposed along the river gorges and coastal cliffs, are recognized as ‘true substrates’, defined by Davies & Shillito (Reference Davies and Shillito2018) as ‘sedimentary bedding planes that demonstrably existed at the sediment–water or sediment–air interface at the time of deposition, as evidenced by features such as ripple marks or trace fossils’. These true substrates provide a snapshot of life and the environment during sedimentary stasis (Tipper, Reference Tipper, Smith, Bailey, Burgess and Fraser2015), the state in which local sedimentary systems spend most of the time. As tidal environments are heterogeneous in many aspects (Dalrymple & Choi, Reference Dalrymple and Choi2007; Gingras et al. Reference Gingras, MacEachern and Dashtgard2012), the preservation of true substrates in tidally influenced facies should be expected to be favoured.
True substrates are identified by surficial trace fossils and sedimentary surface textures existing on the bedding surface, and the abundance of such surfaces in the Tumblagooda Sandstone provides snapshots of life activity on individual days of its deposition (Fig. 19). These surfaces commonly record multiple different ichnotaxa associated with one another. Considering these co-occurring trace fossils as associations permits a high-resolution analysis of organism–sediment interactions throughout the Tumblagooda littoral environments. For example, whilst the overall ichnodisparity of FA2 is relatively high, when looked at on a bed-by-bed scale, the disparity is very low, with at most three different architectural designs occurring together. Groups A–F illustrate that there are behavioural patterns which co-occur repeatedly within the Tumblagooda Sandstone, restricted to specific facies. When compared with trace fossils in recent and modern tidal environments, A–F can be used to interpret recurrent localized sub-environments best suited to the modes of life of the tracemakers (Gingras et al. Reference Gingras, MacEachern and Dashtgard2012). This partitioning is illustrated in Figure 20.
Three examples of ‘True substrates’ from the Tumblagooda Sandstone. (a) A surface from FA2 at The Loop, recording the sequence of events which occurred at the sloping edge of a body of water. The submergent parts of the surface show ripple marks in two different directions: those formed in the deeper water record a more dominant flow, whereas those from the shallower margins record the lapping water at the edge of the pond. Upslope adhesion marks reveal wind blowing sand across the damp surface, and a ‘raft’ tells of an animal dislodging a cohesive piece of the emergent surface, either whilst entering or exiting the water. Whatever the case, it is clear this shows evidence for subaerial locomotion. (b) Further evidence for subaerial locomotion on a more extensive bedding surface, from FA2 at The Loop. Ripple marks occur across the whole surface, with seven distinct Diplichnites trackways of different sizes crossing over them and each other. Most significantly, this surface records some original topography, as there are two large, shallow depressions where the ripples fade and into which the trackways disappear and reappear. These topographic lows are interpreted as ponds on the surface, not recording the trackways as the differing mechanical properties of the saturated sediment make it less stable and cohesive. This once again provides evidence for subaerial locomotion, punctuated by a return to the water. (c) A surface from FA3 at Red Bluff, recording the shaved tops of trough cross-beds covered in Psammichnites trails such as the surfaces described by Davies & Shillito (Reference Davies and Shillito2018). This surface records a period of sedimentary stasis following the deposition of the dune recorded as trough-cross-bedded sandstone and the erosional event that shaved the top of it, during which the substrate was colonized by opportunistic grazing organisms. The significance of this surface is that the subsequent depositional event, whilst occurring in an energetic environment, had no erosional capacity and covered the grazing trails without destroying them. Black scale bar – 10 cm.
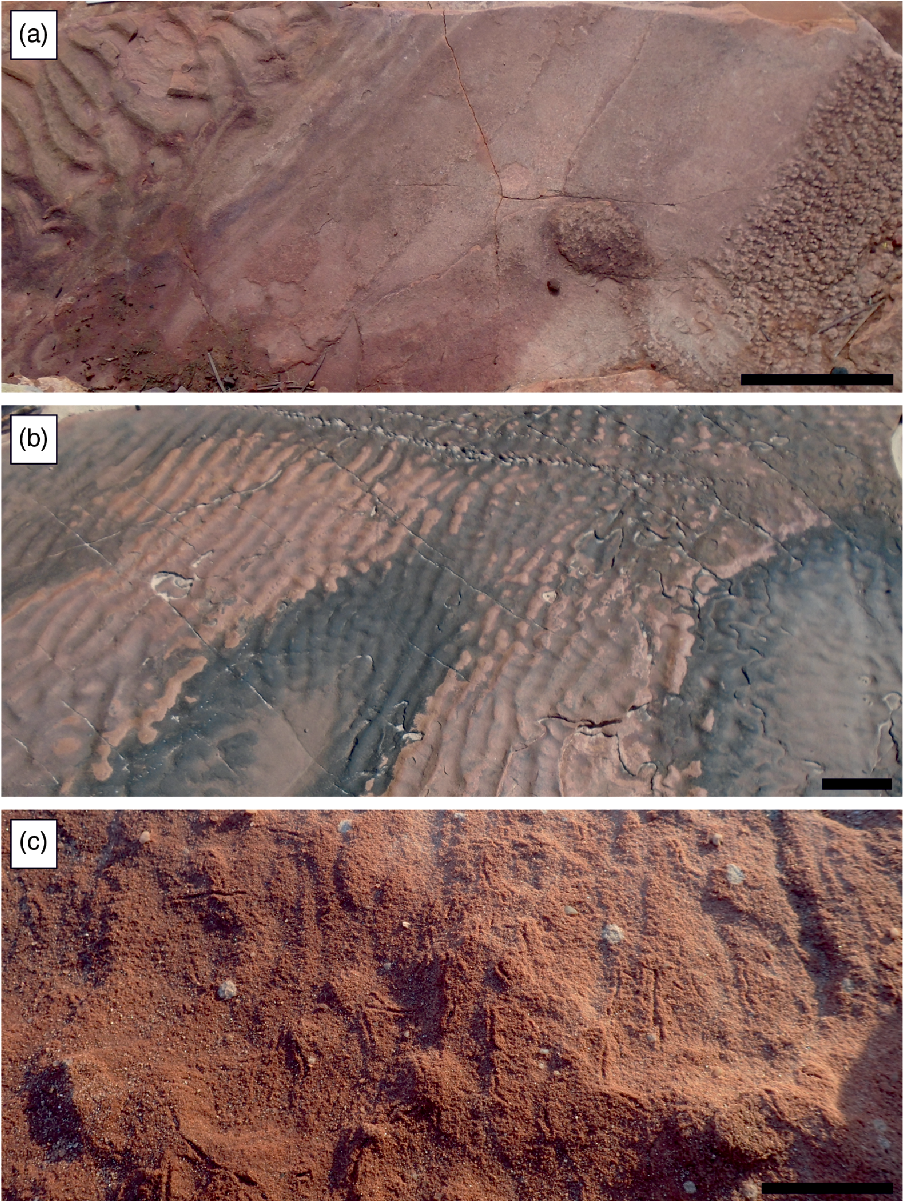
Examples of where the six groups of trace fossil associations occur within the depositional environments responsible for the facies associations, following the overarching depositional setting illustrated in Figure 13. A–F mark areas within the depositional environment where these groups of trace fossils occur, and the approximate ichnodisparity of each group of trace fossil associations is illustrated as pie charts. These pie charts show that all groups have a fairly low ichnodisparity (2–5) and each is dominated by traces of a single architectural design (although this is in part due to how associations were grouped). Typically, horizontal and sub-horizontal traces are most common in the intertidal facies, whereas vertical burrows are most common in the offshore facies of FA4.

Group A is a deposit-feeding assemblage: dominant Heimdallia (and rare Paradictyodora) record the behaviour of small animals systematically feeding infaunally, and a variable abundance of diminutive Skolithos records subordinate interface feeding behaviour. Group A reflects the ichnofauna of sandy intertidal flats, demonstrated by the co-occurrence of emergent sedimentary structures with these trace fossil associations. There is strong modern analogue for Group A: densely populated infaunal assemblages are common in intertidal environments, due to the abundance of food resources, as planktonic organic material is deposited during slack water and sieved by granular sediment during falling tides (Gingras et al. Reference Gingras, MacEachern and Dashtgard2012).
Group B is dominated by Tumblagoodichnus, the dimensions of which indicate that they were made by some of the largest arthropods in the depositional environment. Sedimentological evidence for emergence (adhesion marks and setulfs in association with some of the burrows) suggests that the burrows could be refugia associated with tracemakers digging down to moist sediment, to avoid subaerial desiccation. The lack of associated deposit-feeding traces suggests that this group records a less organic-rich part of the substrate, and as such could record emergence near the landward margin of the tidal prism.
Group C records both subaerial and subaqueous activities of arthropods within the intertidal sand flats and dunes of FA2. As this group is mostly comprised of locomotion traces, rather than the feeding traces which make up much of groups A, D and E, it suggests limited interstitial or interface nutrients. Clear evidence of subaerial activity comes from the many true substrates, where trackways can be seen traversing rippled substrates with topographic lows where receding water would have been retained (Fig. 19). This is reinforced by observations of trackways occurring in association with adhesion marks on foresets within the cross-bedded facies of FA2, recording emergent intertidal barforms (Fig. 9). The particular environmental niche represented by group C is similar to that of group B, with animals spending time on or in the exposed substrate on a short-term basis.
Group D is an interface feeding assemblage of traces as the main constituent is Skolithos, although subordinate Daedalus shows some element of deposit-feeding behaviour was occurring. The length of these burrows (up to 1 m) implies that they may have been semi-permanent domiciles of filter-feeding organisms, exploiting the nutrient-rich waters in an outer estuary, where normal salinity and less frequently mobile sand would have promoted infaunal communities. This is supported by the fact that burrows are only seen to originate from topsets of cross-bedded packages (Fig. 18), implying colonization of dunes during a post-depositional interval of sedimentary stasis.
Group E records a deposit-feeding assemblage of short Psammichnites and Planolites trails, colonizing erosional true substrates in intervals of stasis post-dating dune truncation by wave attack (Davies & Shillito, Reference Davies and Shillito2018). The low diversity and small dimensions of the ichnofauna could reflect brackish conditions, as would be expected within the FA3 estuary (Buatois et al. Reference Buatois, Gingras, MacEachern, Mángano, Zonneveld, Pemberton, Netto and Martin2005). As conditions would be changeable on hourly timescales with the changing tides, these trace fossil associations show opportunists taking advantage of temporarily favourable conditions to exploit the high abundance of nutrients in the sediment (Gingras et al. Reference Gingras, MacEachern and Dashtgard2012).
Group F occurs infrequently throughout FA2, and thus reflects a narrower environmental niche than the other more abundant trace fossil associations. The single example of co-occurring Crescentichnus and Rusophycus has previously been described as a hunting assemblage (Trewin & McNamara, Reference Trewin and McNamara1994), as they report abundant Diplocraterion of the same depth as the Crescentichnus on the same surface. However, these burrows are not clear in any figured examples, and were not observed directly in the field during our study. Alternatively, Group F may fall more in line with the palaeoenvironmental context of groups B and C, although due to its relative scarcity it is difficult to definitively place.
5.b. The role of outcrop geomorphology in analysis of the Tumblagooda Sandstone
The exposed outcrop geomorphology of the Tumblagooda Sandstone is variable across the outcrop belt, and determines, to an extent, the sedimentary structures and trace fossils that can be observed. Three main geomorphic expressions are present: (1) stepped exposure of successive beds, making up much of the river gorges, (2) coastal exposure with few horizontal wave-cut platforms and vertical cliffs, and (3) sheer vertical cliff exposure, lacking bedding planes, in narrow parts of the river gorges (Fig. 12). This variability could feasibly bias ichnological analysis (e.g. Marenco & Hagadorn, Reference Marenco and Hagadorn2019) – the significance of surficial trace fossils such as trackways is clearly apparent in extensive bedding planes of the gorges, but more likely to be concealed where bedding plane exposures are limited.
Figure 12 shows how the exposure of trace fossils would be expected to vary within the different types of exposure, in scenarios of either ubiquitous or scattered presence of trace fossils. The large pie charts show that even with stepped exposure, the majority of trace fossils within an area either remain concealed within the rock or are destroyed by erosion. The smallest pie charts consider only the visible trace fossils, showing that even though coastal and cliff exposures would result in a skew towards vertical traces rather than surficial traces, examples of both should be observed if they were present. Figure 21 shows the true observed distribution of trace fossil types within the Tumblagooda Sandstone, revealing that FA2 and FA3 have a higher concentration of horizontal trace fossils than can be accounted for by outcrop bias alone, and FA4 has a higher concentration of vertical traces. Thus, while outcrop geomorphology has played a role in determining which trace fossils can be recognized in the field, the broad trends apparent from the groupings of trace fossil associations appear to reflect a genuine primary environmental control.
Pie charts showing the relative proportions of different architectural styles of trace fossil observed in facies associations 2, 3 and 4. Horizontal traces are marked in shades of red, vertical traces in shades of blue, and traces with both horizontal and vertical components in shades of purple. The expected relative proportions of horizontal to vertical traces in each facies association (based upon trace fossil information from Figure 12 and dominant outcrop style) are shown in the small red-blue pie charts. These show FA2 and FA3 both contain a far greater than expected proportion of horizontal trace fossils than can be accounted for by outcrop bias, and FA4 contains a higher than expected proportion of vertical traces, suggesting these signals are based on behavioural factors.

6. Implications of the Tumblagooda Ichnofauna
Combining sedimentological and ichnological evidence from the Tumblagooda Sandstone, there is no evidence to support contentions that its trace fossil-bearing strata were deposited in a mixed aeolian–fluvial setting (contra Trewin & McNamara, Reference Trewin and McNamara1994). As a result, the arthropod communities recorded by its ichnofauna were not denizens of one of the first fully non-marine habitats on Earth. However, the exceptional exposure of the Tumblagooda Sandstone and the diversity and abundance of its trace fossils mean that the unit still has ichnological significance. As discussed in Section 5 and shown in Figure 20, the unit provides a clear window onto lower Palaeozoic littoral trace fossil associations, which can be combined with sedimentological evidence for subaqueous, subaerial and emergent conditions to recognize ecological and ethological partitioning within distinct sub-environments of a dominantly transitional environment between land and sea. These insights demonstrate that, by the Silurian at the latest, littoral environments were already regions of patchy distributions of nutrients and physical processes, which were imparting direct environmental controls on organism distribution and organism–sediment interactions, directly comparable to modern littoral habitats (Gingras et al. Reference Gingras, MacEachern and Dashtgard2012). Yet even though the Tumblagooda Sandstone can no longer be considered to be a crucible of the arthropod invasion of the land, the quality of outcrop and exceptional abundance of trace fossils afforded by this means that it has significance for considering the wider context of the terrestrialization process, when compared with other lower Palaeozoic ichnofaunas.
Figure 22 shows the bulk and median ichnodiversity and ichnodisparity for marine, transitional, and non-marine environments between the middle Cambrian (the earliest known non-marine ichnofauna; MacNaughton et al. Reference MacNaughton, Cole, Dalrymple, Braddy, Briggs and Lukie2002) and the Devonian (by which time terrestrial arthropod communities were fully developed, and attested to by multiple lines of palaeontological, ichnological and sedimentological observations). We have separated the late Silurian as a distinct interval, due to the global abundance of strata from this time that attest to early fully non-marine habitats. The data used to compile these plots is taken from Minter et al. (Reference Minter, Buatois, Mángano, MacNaughton, Davies and Gibling2016 a, b), with the original environmental classifications discussed therein translated into the classifications outlined in Figure 4 and Table 1. Figure 22b shows the bulk ichnodiversity and ichnodisparity of the various facies associations of the Tumblagooda Sandstone for comparison, further illustrating how much of an anomaly the unit would be if it actually were a Silurian (or Ordovician) non-marine succession.
Histograms comparing ichnodiversity and ichnodisparity in lower Palaeozoic settings with the Tumblagooda Sandstone (using data from Minter et al. Reference Minter, Buatois, Mángano, MacNaughton, Davies and Gibling2016a, b). (a) Bulk ichnodiversity and ichnodisparity for all marine, transitional and non-marine settings during the middle Cambrian to middle Silurian, late Silurian and Devonian. Dark lines and numbers show the mean ichnodiversity and ichnodisparity within individual formations of the given ages and facies. (b) Ichnodiversity and ichnodisparity for FA2, FA3 and FA4 of the Tumblagooda Sandstone.
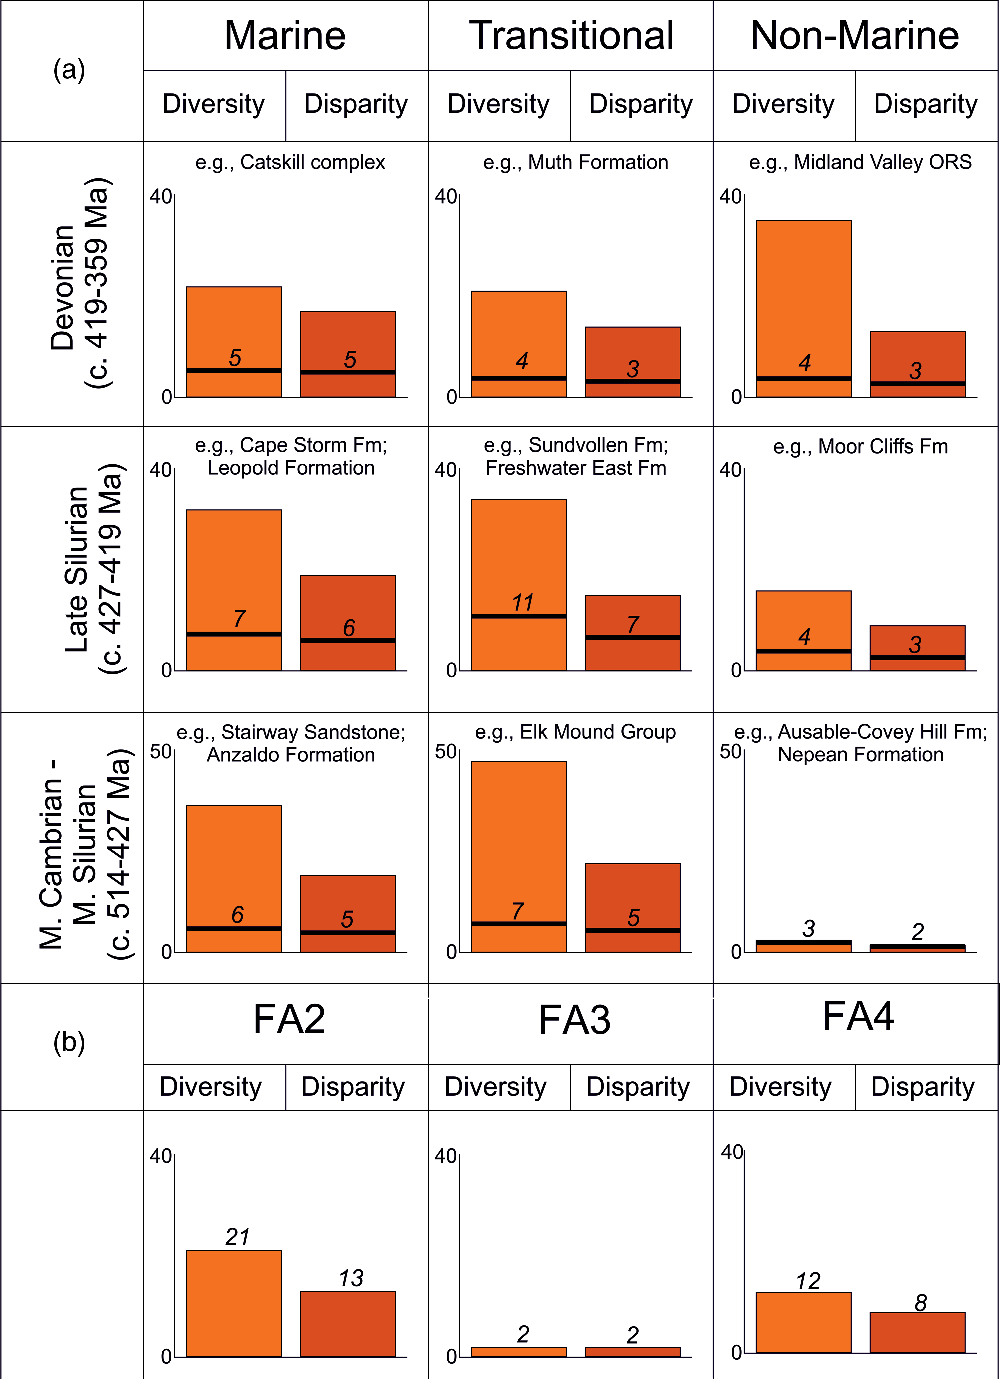
The trends in Figure 22 show that non-marine habitats in the Cambrian to middle Silurian had negligible ichnodiversity and ichnodisparity, and the Ausable – Covey Hill Formation and Nepean Formation of the New York–Ontario–Quebec region provide (the only) archetypes for these earliest non-marine arthropod trackways (MacNaughton et al. Reference MacNaughton, Cole, Dalrymple, Braddy, Briggs and Lukie2002; Hagadorn et al. Reference Hagadorn, Collette and Belt2011). Crucially, although the trace fossils (Diplichnites, Diplopodichnus, Protichnites) in these units are hosted within non-marine aeolian dune strata, they were all demonstrably active within metres of the transitional zone, and thus reflect subaerial excursions of amphidromous explorers rather than established arthropod communities (Minter et al. Reference Minter, Buatois, Mángano, MacNaughton, Davies and Gibling2016 a). In the late Silurian, and developing into the Devonian, there is a burst of ichnodiversity and ichnodisparity in fully non-marine environments (Minter et al. Reference Minter, Buatois, Mángano, Davies, Gibling, MacNaughton and Labandeira2017; Buatois & Mángano, Reference Buatois and Mángano2018). Such trends are revealed in archetypal Old Red Sandstone facies such as the Silurian Moor Cliffs Formation of Wales (Marriott et al. Reference Marriott, Morrissey and Hillier2009) or Devonian strata of the Midland Valley of Scotland (Walker, Reference Walker1985), but a similar pattern emerges globally at this time, with analogous ichnodiversity and ichnodisparity trends recognized in 34 formations worldwide (Minter et al. Reference Minter, Buatois, Mángano, Davies, Gibling and Labandeira2016b). Crucially, amongst these early fully non-marine trace fossil communities, other Australian examples are known, such as the Late Silurian – Early Devonian Mereenie Sandstone of Northern Territory (Gouramanis & McLoughlin, Reference Gouramanis and McLoughlin2016), Late Silurian – Early Devonian Mt Daubeny Formation of New South Wales (Neef, Reference Neef2004a), and Early Devonian Ravendale Formation of New South Wales (Neef et al. Reference Neef2004b); all of which contain demonstrably non-marine signatures (e.g. aeolian dune and interdune facies) and extensive outcrop, but which are also diminished in trace fossil diversity and disparity relative to the Tumblagooda Sandstone.
In contrast, marine ichnodiversity and ichnodisparity remain relatively constant throughout the lower Palaeozoic (here ‘marine’ is restricted to coastal marine waters, reflecting the data presented in Minter et al, Reference Minter, Buatois, Mángano, MacNaughton, Davies and Gibling2016a, b). Trace fossils are well described from Ordovician marine strata such as the Anzaldo Formation of Bolivia (Davies et al. Reference Davies, Sansom, Albanesi and Cespedes2007) or Stairway Sandstone of the Northern Territory, Australia (Gibb et al. Reference Gibb, Chatterton and Pemberton2009; Davies et al. Reference Davies, Sansom, Nicoll and Ritchie2011b), which are directly comparable in diversity and disparity terms with late Silurian marine ichnofaunas such as those typified by the Leopold and Cape Storm formations of Arctic Canada (Narbonne et al. Reference Narbonne, Gibling and Jones1979; Narbonne, Reference Narbonne1984). Similar stability of ichnodiversity and ichnodisparity is also apparent across Cambrian (e.g. the Elk Mound Group, Wisconsin (Collette et al. Reference Collette, Hagadorn and Lacelle2010)) to late Silurian (e.g. the Sundvollen Formation, Norway (Davies et al. Reference Davies, Sansom and Turner2006)) transitional environments. There is an apparent global dip in ichnodiversity and ichnodisparity in marine and transitional strata of Devonian age (such as those typified by the Catskill complex of the NE United States (Miller, Reference Miller1979; Knox & Gordon, Reference Knox and Gordon1999), or Muth Formation of India (Draganits et al. Reference Draganits, Braddy and Briggs2001)), and this could be an artefact of increased ecospace occupation under the ‘early burst’ pattern of ichnological colonization (e.g. Minter et al. Reference Minter, Buatois, Mángano, Davies, Gibling, MacNaughton and Labandeira2017). However, it is also possible that the diminishment of behavioural styles and diversity apparent from Devonian marine trace fossils was associated with the emergence of increased competition from non-bioturbating organisms (i.e. more advanced marine predators such as gnathostomes (Friedman & Sallan, Reference Friedman and Sallan2012)), which itself is thought to have played a partial role in encouraging terrestrialization (Bambach, Reference Bambach1999).
Amongst these globally distributed units, the predominantly transitional facies of the Tumblagooda Sandstone (FA2) bear greatest similarities with mean ichnodiversity and ichnodisparity values of transitional environments that are contemporaneous with, or immediately precede, the terrestrialization of arthropods (Fig. 22). Characterized by relatively high ichnodiversity and ichnodisparity, they reflect established invertebrate communities within the environmentally patchy littoral zone, prior to full ecospace occupation and increased predation. Fully marine facies of the Tumblagooda Sandstone (FA4) are also similar to the mean ichnodisparity values for lower Palaeozoic marine facies, attesting to the fact that such habitats had long been well-established by the time of deposition. A slight anomaly is seen in the diminished ichnodiversity and ichnodisparity of FA3, but as this facies association bears evidence for estuarine deposition, and potential variability in marine and fluvial dominance (see Section 3), the depressed richness in trace fossils may be explainable by analogy with the depauperate tracemaker activity associated with brackish water conditions (e.g. Buatois et al. Reference Buatois, Mángano and Maples1997, Reference Buatois, Gingras, MacEachern, Mángano, Zonneveld, Pemberton, Netto and Martin2005; Dalrymple & Choi, Reference Dalrymple and Choi2007). Using direct sedimentological and ichnological evidence, compared with a global dataset, the Tumblagooda Sandstone can thus be considered to be transitional from both an environmental and an evolutionary perspective.
7. Conclusions
-
1. The Tumblagooda Sandstone was largely deposited in marine-influenced sedimentary environments, and no trace fossils occur in conclusively non-marine strata.
-
2. The formation provides an archetypal example of a marginal transitional environment around the time of the onset of arthropod terrestrialization, and acts as a window onto the marginal environments from which the very first true arthropod colonizers would have departed.
-
3. The unit sheds light on littoral ecosystems and organisms in the early stages of a profound interval of Earth system evolution. The spatially patchy variation in its ichnofauna and depositional environments attests that, by the Silurian, the littoral barrier between land and sea had a moderate richness of invertebrate fauna, and a modern-style, physically imparted variability in environment.
-
4. Outcrop geomorphology plays a significant and often overlooked role in constraining the observations that can be made about strata, affecting any conclusions which can be drawn about true diversity and disparity.
Acknowledgements
The authors would like to thank Ken McNamara and Roger Hocking for useful discussion, and Mike Paxman for his help with access to locations in Kalbarri National Park. Two anonymous reviewers are thanked for their helpful comments and critique of the manuscript. A.P.S. was supported by the Natural Environment Research Council (grant number NE/L002507/1).
Conflict of interest
The authors have no known conflicts of interest.


 Open access