




Introduction
Changes in temperature and precipitation influence many biological processes, including primary productivity, organismal growth, reproduction, and prey abundance (Valtonen et al. Reference Valtonen, Molleman, Chapman, Carey, Ayres and Roininen2013; Wolda Reference Wolda1978, Reference Wolda1988). Seasonal variation in these conditions leads to cyclical booms and busts in available resources, necessitating changes in behaviour or physiology to survive. Animals adapt to seasonal shortages in resources using different strategies, which can include migration and seasonal torpor (Fleming et al. Reference Fleming, Nuñez and Sternberg1993; Karr Reference Karr1976). Energy-intensive biological functions (e.g., tissue growth, reproduction) tend to correspond with seasons of high resource availability (Karr Reference Karr1976; Orr et al. Reference Orr, Ortega, Medellín, Sánchez and Hammond2016). In tropical systems, seasonal fruiting and flowering often peak during the dry season (van Schaik et al. Reference van Schaik, Terborgh and Wright1993) while insects are most abundant during the wet season (Wolda Reference Wolda1980). Seasonal ephemerality in insect abundance has been shown to influence foraging behaviour in bats (Kohles et al. Reference Kohles, Page, Wikelski and Dechmann2024). Some tropical forest systems have bimodal peaks in precipitation, such that there are two wet seasons, separated by a short dry period (Milton et al. Reference Milton, Windsor, Morrison and Estribi1982; van Schaik et al. Reference van Schaik, Terborgh and Wright1993).
Characterising temporal variation in ecological niches is important for understanding the structure and resilience of communities to environmental change (Vandermeer Reference Vandermeer1972). Conceptualised as an n-dimensional hypervolume (Hutchinson Reference Hutchinson1957), ecological niches are more practically defined by one or more axes of environmental tolerances or diet (Bearhop et al. Reference Bearhop, Adams, Waldron, Fuller and MacLeod2004; Vandermeer Reference Vandermeer1972). Using stable isotope measurements to infer niche breadth has been effective for discerning aspects of the diet patterns of cryptic species that are not possible with traditional methods, including stomach content or faecal analysis (Bearhop et al. Reference Bearhop, Adams, Waldron, Fuller and MacLeod2004; Newsome et al. Reference Newsome, del Rio, Bearhop and Phillips2007). Since the experimental study by DeNiro and Epstein (Reference DeNiro and Epstein1981), researchers have used stable nitrogen (δ 15N) isotope ratios in tissues to study diet and ecology of individuals (Anderson et al. Reference Anderson, Phillips, Shore, McGill, McDonald and Bearhop2009), populations (Hobson and Welch Reference Hobson and Welch1992) and communities (Layman et al. Reference Layman, Arrington, Montaña and Post2007). When the naturally occurring isotopes of nitrogen (14N/15N) are incorporated into tissues, a predictable discrimination occurs between the food source and tissue (Caut et al. Reference Caut, Angulo and Courchamp2009; Hobson and Clark Reference Hobson and Clark1992a). Discrimination factors and isotopic turnover, which is the rate at which isotope ratios of consumer tissues equilibrate to their diet, differ among species and tissues (Dalerum and Angerbjörn Reference Dalerum and Angerbjörn2005; Hobson and Clark Reference Hobson and Clark1992b; MacNeil et al. Reference MacNeil, Skomal and Fisk2005). Turnover rates in metabolically active tissues (e.g., blood, muscle) tend to be fast (MacNeil et al. Reference MacNeil, Skomal and Fisk2005) relative to inert tissues (e.g., hair, bone), which fix isotopes during formation and remain unchanged until tissue renewal (e.g., fur moulting; Fraser et al. Reference Fraser, Longstaffe and Fenton2013; Voigt et al. Reference Voigt, Matt, Michener and Kunz2003). Metabolically inert tissues thus ‘store’ isotope information and permit inference about past diet, while active tissues are more informative of recent diet (Cabanellas-Reboredo et al. Reference Cabanellas-Reboredo, Deudero and Blanco2009; Hobson and Clark Reference Hobson and Clark1992a; Voigt et al. Reference Voigt, Matt, Michener and Kunz2003).
Values of δ 15N have been used primarily to characterise trophic level, such that individuals that feed at higher trophic levels have higher values of δ 15N (Bearhop et al. Reference Bearhop, Adams, Waldron, Fuller and MacLeod2004; DeNiro and Epstein Reference DeNiro and Epstein1981). As nitrogen occurs primarily in proteins, there is little difference in isotopic discrimination among proteinaceous tissues, making δ 15N measurements useful for examining seasonal changes in trophic position (MacNeil et al. Reference MacNeil, Skomal and Fisk2005). Regardless of isotopic measurement, it is necessary to know tissue-specific isotope discrimination values for the organism of interest and to control for any changes in isotopic baseline that may occur spatially (Caut et al. Reference Caut, Angulo and Courchamp2009, Reference Caut, Angulo, Courchamp and Figuerola2010; Hobson et al. Reference Hobson, Schell, Renouf and Noseworthy1996).
Normally, inferences about temporal changes in diet are made by re-sampling the same metabolically active tissues over time (e.g., blood; Ogden et al. Reference Ogden, Hobson and Lank2004; Paxton et al. Reference Paxton, Kelly, Pletchet and Paxton2020) or sequentially sampling metabolically inactive tissues, provided the timing of growth is known (e.g., hair; Aliperti et al. Reference Aliperti, Kelt, Heady and Frick2017, Mirón et al. Reference Mirón, Herrera, Ramirez and Hobson2006; Popa-Lisseanu et al. Reference Popa-Lisseanu, Kramer-Schadt, Quetglas, Delgado-Huertas, Kelm and Ibáñez2015). However, analysing various tissues (which integrate dietary information over different time scales) from a single animal has the potential to provide insight into temporal variation in an individual’s diet on a scale that ranges from days to its entire lifespan (Bond et al. Reference Bond, Jardine and Hobson2016; MacNeil et al. Reference MacNeil, Skomal and Fisk2005). Though it is possible to sample some tissues using minimally invasive methods (e.g., skin), many tissues require terminal sampling (e.g., bone), which positions museum-preserved specimens as a unique opportunity to understand variability in diet through time.
Many bat species (Chiroptera) adapt their foraging behaviour in response to seasonal environmental change (Cisneros et al. Reference Cisneros, Fagan and Willig2015; Fleming et al. Reference Fleming, Nuñez and Sternberg1993; Genelhú et al. Reference Genelhú, Laurindo, Tahara, Oliveira and Gregorin2023; Shipley and Twining Reference Shipley and Twining2020). Although bats tend to be grouped into broad trophic guilds (frugivores, insectivores, nectarivores, piscivores, sanguinivores; Allen Reference Allen1939), most are omnivorous, and respond to seasonal availability of fruits, insects, nectar and other food sources (Clare and Oelbaum Reference Clare, Oelbaum, Russo and Fenton2023; Rex et al. Reference Rex, Czaczkes, Michener, Kunz and Voigt2010) and many tropical species traverse large areas in response to the phenology of resource abundance (Fleming Reference Fleming and Choe2019; Fleming et al. Reference Fleming, Nuñez and Sternberg1993; Hurme et al. Reference Hurme, Fahr, Eidolon, Eric-Moise, Hash, O’Mara, Richter, Tanshi, Webala, Weber, Wikelski and Dechmann2022). Frugivorous bats may synchronise lactation and weaning of young with peaks in fruit and nectar production (Kofron Reference Kofron1997; Pereira et al. Reference Pereira, Marques and Palmeirim2010) or switch between fruits and flowers as primary dietary resources based on availability (Marshall Reference Marshall1983). Insectivores will also synchronise reproductive cycles with insect abundance (Arango-Diago et al. Reference Arango-Diago, Castillo-Figueroa, Albarracín-Caro and Pérez-Torres2020). As such, it has been posited that omnivory evolved as a response to phenology of food resources and that this has contributed to the diversity of many taxa (Burin et al. Reference Burin, Kissling, Guimarães, Şekercioglu and Quental2016; Chubaty et al. Reference Chubaty, Ma, Stein, Gillespie, Henry, Phelan, Palsson, Simon and Roitberg2014, Marshall Reference Marshall1983; Rex et al. Reference Rex, Czaczkes, Michener, Kunz and Voigt2010). Trophic-level switching between the wet and dry seasons is one form of omnivory that may facilitate residency in tropical environments as an alternative to regional migration.
In this study, we assess temporal variation in diet among five species of tropical bats. As δ 15N turnover rates of several tissues for bat species have previously been established experimentally (Mirón et al. 2005, Roswag et al. Reference Roswag, Becker and Encarnação2015; Voigt et al. Reference Voigt, Matt, Michener and Kunz2003), we built models that simulate expected δ 15N tissue values based on foraging assumptions. These models enable us to identify when an isotopic signal of trophic-level switching is present in different tissues and how different we should expect δ 15N values of tissues to be, given reasonable assumptions of dietary variation. Additionally, the construction of predictive models under the assumption of no trophic switching allows assessment of whether patterns in real data are better explained by unstructured, random diet variation (i.e., individuals foraging randomly across trophic levels) or temporal variation in diet (i.e., seasonal differences in trophic level over time). We compared modelling outcomes to actual δ 15N values of various tissues to assess if there is any evidence of temporal variation in the diet of selected species across seasons. Species selected for this study vary in life history traits, including primary diet (i.e., fruits, insects) and dispersal capacity (i.e., wide-ranging, or narrow-ranging). We defined wide-ranging bats as species with records of long-distance movements based on marked individuals (e.g., Artibeus lituratus; Arnone et al. Reference Arnone, Trajano, Pulchério-Liete and de Passos2016; Laurindo and Gregorin Reference Laurindo and Gregorin2019; Mendes et al. Reference Mendes, Vieira, Oprea and Ditchfield2009), whereas narrow-ranging bats as those with no known records of long-distance movement (e.g., Carollia perspicillata; Cloutier and Thomas Reference Cloutier and Thomas1992; Fleming and Heithaus Reference Fleming and Heithaus1986; Mello et al. Reference Mello, Schittini, Selig and Bergallo2004). Both wide-ranging and narrow-ranging classifications were further informed by positive and negative correlations, respectively, of wing morphology (wing loading) and body size (Furey and Racey Reference Furey and Racey2016).
The goal of this study was to examine whether temporal variation in diet is detectable by sampling multiple tissues of varied and known metabolic rates of turnover. We restricted our focus to differences in δ 15N values among tissues because the fractionation of nitrogen (Δ15N) between diet and tissues is more consistent than other isotopic ratios, such as carbon (Dalerum and Angerbjörn Reference Dalerum and Angerbjörn2005; Vander Zanden et al. Reference Vander Zanden, Clayton, Moody, Solomon and Weidel2015). Although there is some variability in Δ15N among tissue types (e.g., Kurle et al. Reference Kurle, Koch, Tershy and Croll2014; Roth and Hobson Reference Roth and Hobson2000), protein source ultimately contributes more to δ 15N than diet-tissue fractionation alone (Robbins et al. Reference Robbins, Felicetti and Sponheimer2005). Low variation in δ 15N between tissues of an individual suggests a temporally consistent diet. We hypothesised that there would be detectable differences in δ 15N among tissues with short-and long-term turnover rates for the narrow-ranging frugivores (Bhat Reference Bhat1994; Mello et al. Reference Mello, Schittini, Selig and Bergallo2004), but negligible, if any, variation in δ 15N among tissues for the wide-ranging frugivore (Laurindo and Gregorin Reference Laurindo and Gregorin2019). We predicted that narrow-ranging phytophagous bats (Carollia perspicillata, Cynopterus sphinx) would shift to a higher trophic level (insect-based) during periods when preferred food resources were scarce and during times of greater metabolic demand due to reproduction (Orr et al. Reference Orr, Ortega, Medellín, Sánchez and Hammond2016). Conversely, wide-ranging frugivores (Artibeus lituratus) may be able to continue foraging for fruits more effectively over a wide geographic area, so we predicted that their tissues would not show evidence of δ 15N variation among tissues. For the insectivores examined, trophic level (as reflected by δ 15N in tissues) is unlikely to oscillate seasonally, regardless of foraging range, as these bats were traditionally considered to be obligate insect-feeders and unlikely to switch to a higher (vertebrate) or lower (plant) trophic level in seasons of preferred food scarcity (Clare and Oelbaum Reference Clare, Oelbaum, Russo and Fenton2023; Denzinger and Schnitzler Reference Denzinger and Schnitzler2013). However, seasonal shifts in insect availability may still necessitate local or regional migration (Fleming Reference Fleming and Choe2019), which may lead to geographic level differences in nitrogen baseline. Wide-ranging insectivores (Pteronotus alitonus) forage over long distances (Filippi-Codaccioni et al. Reference Filippi-Codaccioni, Beugin, de Vienne, Portanier, Fouchet, Kaerle, Muselet, Queney, Petit, Regis, Pons and Pontier2018), and so isotopic baseline shifts across feeding environments may be seen as differences in δ 15N values found in both short- and long-turnover tissues. For narrow-ranging insectivores (Hipposideros larvatus), we predicted that seasonality would not impact isotopic composition of nitrogen, thus δ 15N values would not differ between short- and long-turnover tissues. We undertook this modelling approach for two primary reasons: to identify the temporal windows in which diet shifts are detectable in different tissues and to quantify the probability that tissues are found to be different even when no diet change has occurred.
Methods
Sample collection
Tissue samples from 50 adult bats representing 5 species (Artibeus lituratus, Carollia perspicillata, Pteronotus alitonus, Hipposideros larvatus, Cynopterus sphinx; 5 male, 5 female samples per species) were obtained from the Royal Ontario Museum Mammalogy collection (Table 1). Specimens were collected between 1997 and 2007 on biodiversity survey trips with samples of each species captured at the same location within a 2-week period, therefore minimising the possibility that environmental factors could influence individual variation in isotope values. Species were selected to represent common frugivores and insectivores from the Neotropics and Paleotropics. In addition, an effort was made to ensure the inclusion of both narrow- and wide-ranging species assessed by wing morphology, body size, documented foraging ranges, records of long-distance movements, and recapture frequency (Table 1).
Overview of tropical bat species sampled with sample origin, primary diet and range of movement. Movement is broadly defined based on wing morphology, body size, nightly foraging range, and dispersal capacity. Key references were used to characterise movement capacity and diet. A full list of samples used, and capture information is reported in Supplement 1

Table 1. Long description
The table presents data on five tropical bat species, including Artibeus lituratus, Carollia perspicillata, Pteronotus alitonus, Hipposideros larvatus, and Cynopterus sphinx. It details their movement capacity, primary diet, origin of sample, and season of capture. The table has five rows for each species and five columns for species, movement capacity, primary diet, origin of sample, and season of capture. Artibeus lituratus has a wide movement capacity, primarily eats fruit, and samples were obtained from Iwokrama, Guyana during the dry season. Carollia perspicillata has a narrow movement capacity, primarily eats fruit, and samples were also obtained from Iwokrama, Guyana during the dry season. Pteronotus alitonus has a wide movement capacity, primarily eats insects, and samples were obtained from Kaieteur, Guyana during the wet season. Hipposideros larvatus has a narrow movement capacity, primarily eats insects, and samples were obtained from Guizhou, China during the wet season. Cynopterus sphinx has a narrow movement capacity, primarily eats fruit, and samples were obtained from Guangxi, China during the dry season. The table also includes references for each species.
For each specimen, a small (≈1 mg) sample of bone, hair, patagium (wing membrane), heart (muscle), spleen, liver, and kidney was subsampled. Bone, patagium, and hair were stored dry and at room temperature, whereas organ tissues (heart, liver, spleen, and kidney) were frozen in the field using liquid nitrogen (−196°C) and stored at −80°C in ultracold freezers at the museum. Hair was clipped from the dorsal surface of dried skin specimens, most sampled from the body near the folded wing, to minimise the impact of destructive sampling in the reference collection. Wing tissue was collected from the plagiopatagium of the wing, which was folded underneath each specimen. A bone fragment was sampled from the femur of each postcranial specimen; we used whole bone as there is likely little variation in nitrogen isotopic discrimination factors among collagen and mineral (Tomaszewicz et al. Reference Tomaszewicz, Seminoff, Ramirez and Kurle2015). Organ samples were temporarily stored in 70% ethanol for transport, and at −20°C until isotopic analysis one month later. Short-term storage in ethanol has been demonstrated to cause some offset in isotopic values for δ 13C, but δ 15N is largely not affected (Bugoni et al. Reference Bugoni, McGill and Furness2008; Javornik et al. Reference Javornik, Hopkins, Zavadlav, Levanič, Polak and Jerina2019; Olin et al. Reference Olin, Poulakis, Stevens, DeAngelo and Fisk2014).
Tissue analysis
Tissues were processed at the Environmental Isotope Lab (EIL) at the University of Waterloo, Ontario, Canada. Organ samples were air-dried and placed in a drying oven at 50°C overnight. Samples were ground or cut to homogenise and weighed in tin capsules. Samples of organs, hair and patagium of between 0.300–0.400 mg and whole bone samples of 0.500–1.00 mg were placed in a 4010 Elemental Analyzer (Costech Instruments, Valencia, CA) and combusted; this was coupled to a Delta Plus XL (Thermo, Bremen, Germany) continuous-flow isotope-ratio mass spectrometer (CFIRMS). Isotopic ratios are reported relative to those in AIR (δ 15N) and calibrated using within-run calibrated international standards [International Atomic Energy Agency] and in-house standards (Supplement 2). Low mass samples (3 patagium samples: P43720, P47801, P47827 had mass <0.100 mg) were analysed using a non-diluted CO2 protocol. All data presented have a maximum measurement error of ± 0.3 ‰ for δ 15N as assessed at EIL (corrected for normalisation and linearity) and are reported in Supplement 1.
Model construction and statistical analysis
All analyses were conducted in RStudio (R version 4.3.1) using base R with data visualisation using the tidyverse suite of packages (Wickham et al. Reference Wickham, Averick, Bryan, Chang, McGowan, François, Grolemund, Hayes, Henry, Hester, Kuhn, Pedersen, Miller, Bache, Müller, Ooms, Robinson, Seidel, Spinu, Takahashi, Vaughan, Wilke, Woo and Yutani2019). Using data from museum tissues of each species, we used one-way ANOVAs to assess statistical differences in δ 15N among the different tissue types, followed by post hoc TukeyHSD tests (α = 0.05). We made no quantitative comparisons among species.
We constructed predictive models to represent different seasonal trophic regimes and the effect these shifts would have on the concurrent isotopic values of each tissue type. Models selected a randomised δ 15N value for every ‘day’ of the simulation from a distribution of δ 15N values with an a priori assigned mean and standard deviation. The mean starting value for δ 15N was arbitrary and selected largely to have the values align with reasonable tissue values informed by data in this and other studies (e.g., Oelbaum et al. Reference Oelbaum, Fenton, Simmons and Broders2019). We used a standard deviation of 0.2‰. Tissue-specific isotopic turnover rates were assigned using data from Dalerum & Angerbjörn (Reference Dalerum and Angerbjörn2005; Supplement 2); when turnover rates for δ 15N were not reported for a particular tissue type, we used values for δ 13C (Supplement 2). For each tissue type, we modelled the tissue value at each ‘day’ as the value of an exponential accumulation/decay function taking as input the relevant previous days, determined by turnover time (Dalerum and Angerbjörn Reference Dalerum and Angerbjörn2005) as estimated for each tissue (Supplement 2). For our models, we assumed that Δ15N was consistent across tissues for all species; however, it should be noted that sex, diet quality, and body condition can affect Δ15N (Kurle et al. Reference Kurle, Koch, Tershy and Croll2014; Voigt and Matt Reference Voigt and Matt2004).
To model a dietary shift, the mean value of the δ 15N distribution that the model draws from shifts either by 2‰ or 4‰, representing a half-trophic level shift or a full trophic level shift in diet, respectively (Hobson and Wassenaar Reference Hobson and Wassenaar2008). For each model, we simulated 120 ‘years’ of 365 ‘days’ of foraging, with cyclical shifts in trophic level. After discarding the first 20 years as burn-in, we treated each of the remaining 100-year simulations as independent. We then used these 100 samples as a distribution of values to assess the probability of experimental outcomes. Detailed description of model construction and equations is given in Supplement 3.
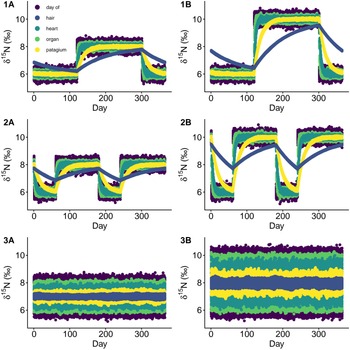
Model 1A has a 6-month period of 2‰ δ 15N above baseline, followed by a 6-month return to baseline. Model 1B is the same as model 1A, but with a 4‰ increase in foraging mean above baseline. Models 1A and 1B are used to assess the maximum amount of time that could pass after a diet change for which differences would be detectable in each tissue, and to illustrate the discordance between tissues as they each come to equilibrium with the ‘current’ diet. Models 2A and 2B illustrate the effect of more frequent dietary cycles; 4 months of higher trophic level foraging, 2 months of baseline, and then repeated. Models 3A and 3B are null conditions, wherein there is maximal day-to-day variation and no temporal structure. Model 3A is constructed by choosing from a high trophic (10‰) or low trophic (6‰) option each day, with equal probability and represents high levels of diet heterogeneity with no food preference or temporal structure. Model 3B is constructed as 3A, but with trophic options of 8‰ or 6‰, representing less extreme trophic variation in diet.
We assessed the probability of finding a false positive result (tissue differences with no temporal dietary changes) by sampling from models 3A and 3B. We randomly sampled 10 data points from each tissue 100 times from models 3A and 3B and performed ANOVAs to assess the probability that day-to-day heterogeneity in diet would falsely generate a seasonal signal in tissues. We report the percentage of cases where significance is achieved under models 3A (low heterogeneity) and 3B (high heterogeneity).
Ethics statement
All research was conducted in accordance with accepted standards for humane capture and handling of bats following guidelines of the American Society of Mammalogists (Sikes et al. Reference Sikes, Care and Committee2016) and approved by the Royal Ontario Museum Animal Care Committee. Collection and export permits were obtained from the governments of Guyana and China by the Royal Ontario Museum. This study was conducted on museum specimens not collected for the specific purpose of this study. A full list of specimens examined is included in Supplement 1.
Results
Model characteristics
Models 1A and 1B each demonstrate that heart and other organ tissues quickly approximate the current mean δ 15N of the daily diet. Median value of kidney, spleen, and liver reached 0.2‰ (= 1 standard deviation) below the 2‰ daily mean increase in 5 days, and in 6 days for the 4‰ increase (Figure 1; 1A, 1B). Heart (muscle) tissue reached this same point in 11 days at 2‰, and 14 days at 4‰. There was more of a substantial time-lag in the incorporation of δ 15N from the higher trophic level in patagium and hair (Figure 1; 1A, 1B). Patagium takes approximately 1–2 months to equilibrate to the ‘current’ diet, under both 2‰ (39 days) and 4‰ (52 days) conditions. Hair tissue almost never approximates ‘current’ diet, reaching within 1 standard deviation of the 2‰ daily mean in 177 days (with the return to the lower baseline occurring on day 180). With the 4‰ increase, hair tissue fails to reach equilibrium with the increased trophic level or the baseline trophic level under unimodal seasonal change conditions (Figure 1; 1A, 1B).
Predictive models using simulated nitrogen isotopic data tracking dietary variation in animal tissues over time. Model 1 (1A, 1B) includes a unimodal trophic shift with different values in A and B conditions. Model 2 (2A, 2B) includes a bimodal trophic shift with different values in A and B conditions. Model 3 (3A, 3B) represent systems with daily variation in trophic level with different magnitudes. Tissue turnover rates are a priori informed based on reported values from literature (Brewer et al. Reference Brewer, Rauch-Davis and Fraser2021; Dalerum and Angerbjörn Reference Dalerum and Angerbjörn2005; Vander Zanden et al. Reference Vander Zanden, Clayton, Moody, Solomon and Weidel2015). Each point represents a single value of the tissue or dietary input for the day of the model; there are 100 individual points represented per tissue type per day, representing independently generated daily mean values of diet.

Figure 1. Long description
The image contains six line graphs arranged in a 3x2 grid. Each graph represents a different model of nitrogen isotopic data tracking dietary variation in animal tissues over time. The x-axis of each graph represents days, ranging from 0 to 350. The y-axis represents delta 15 nitrogen percentage, ranging from 6 to 10. The graphs are color-coded to represent different tissue types: day of, hair, heart, organ, and patagium. Model 1 (1A, 1B) shows a unimodal trophic shift with different values in A and B conditions. Model 2 (2A, 2B) shows a bimodal trophic shift with different values in A and B conditions. Model 3 (3A, 3B) represents systems with daily variation in trophic level with different magnitudes. Each point on the graphs represents a single value of the tissue or dietary input for the day of the model, with 100 individual points represented per tissue type per day, indicating independently generated daily mean values of diet. The graphs illustrate how tissue turnover rates vary based on different conditions and models.
Models 2A and 2B represent bimodal and asymmetric seasonal shifts in diet, following typical seasonal patterns of precipitation of many tropical systems (Figure 1; 2A, 2B). Organ and heart tissues rapidly approximate the ‘current’ diet, while there is a greater lag for metabolically latent patagium and hair. The shorter 2-month windows allow barely enough time for the patagium values to approximate the current diet before the diet shifts again; however, it does reach ‘current’ conditions during the 4-month period. As conditions oscillate rapidly, hair becomes a less reliable predictor of ‘current’ diet under all circumstances other than in the unimodal model 1 (Figure 1; 2A, 2B).
Models 3A and 3B demonstrate that daily heterogeneity in diet is muted in tissues with a longer turnover time, regardless of the disparity in trophic levels (Figure 1; 3A, 3B). Randomly drawn ANOVAs from model 3A (moderate daily variation) show significant differences among tissues are achieved 10% of the time. For model 3B (high daily variation), there are significant differences among tissues in 8% of all cases.
Tissue analysis
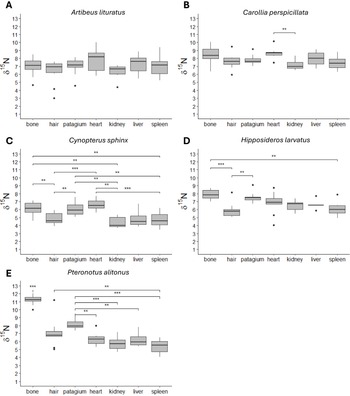
Significant differences in δ 15N were found among tissues of the narrow-ranging frugivores Carollia perspicillata (F(6,53) = 2.724, p = 0.022) and Cynopterus sphinx (F(6,52) = 10.010, p < 0.001) and both insectivores Hipposideros larvatus (F(6,46) = 5.067, p < 0.001), and Pteronotus alitonus (F(6,55) = 38.79, df =, p < 0.001). There were no significant differences in δ 15N among tissues for the wide-ranging frugivore Artibeus lituratus (Figure 2). Tukey HSD tests suggested that δ 15N of heart tissue was significantly higher than that of the kidney (p = 0.032) for C. perspicillata. For C. sphinx, heart and patagium δ 15N were significantly higher than liver (pheart = 0.015), kidney (pheart <0.001; ppatagium <0.001), spleen (pheart <0.001; ppatagium = 0.016) and hair (pheart <0.001; ppatagium = 0.021); there was no significant difference between heart and patagium (p > 0.999). Additionally, δ 15N of C. sphinx bone was significantly higher than hair (p = 0.02), kidney (p < 0.001) and spleen (p = 0.014). In H. larvatus, bone δ 15N was significantly higher than spleen tissue (p = 0.019), and both bone and patagium were significantly higher than hair (pbone <0.001; ppatagium = 0.005); there was no significant difference between hair and organ tissues (pkidney = 0.862; pliver = 0.756; pspleen = 0.997). Similarly, P. alitonius patagium had significantly higher δ 15N than organs (pheart = 0.002; pkidney <0.001; pliver = 0.002; pspleen <0.001); hair was also significantly higher δ 15N than spleen (p = 0.017). Bone had significantly higher δ 15N than all other tissues considered (all p-values <0.001; Figure 2).
Distribution of δ 15N values by tissue for (A) Artibeus lituratus (frugivore, wide-ranging), (B) Carollia perspicillata (frugivore, narrow-ranging), (C) Cynopterus sphinx (frugivore, narrow-ranging), (D) Hipposideros larvatus (insectivore, narrow-ranging), and (E) Pteronotus alitonus (insectivore, wide-ranging). Significant differences in δ 15N are indicated with asterisks, **p < 0.05, ***p < 0.01. There are no significant differences among tissue types for Artibeus lituratus.

Figure 2. Long description
The box-and-whisker plot displays the distribution of delta 15N values across different tissues for five bat species: Artibeus lituratus, Carollia perspicillata, Cynopterus sphinx, Hipposideros larvatus, and Pteronotus alitonus. The x-axis lists the tissues: bone, hair, patagium, heart, kidney, liver, and spleen. The y-axis represents the delta 15N values, ranging from 1 to 13. Each species has a separate subplot labeled A to E. Significant differences in delta 15N values are indicated with asterisks, with **p < 0.05 and ***p < 0.01. For Artibeus lituratus, there are no significant differences among tissue types. The plot shows variations in delta 15N values across different tissues and species, highlighting differences in dietary patterns and ecological niches. All values are approximated.
Discussion
We aimed to characterise seasonal variation in prey of different trophic levels for Neotropical and Paleotropical bats with a multi-tissue stable isotope analysis. Modelled data strengthened the inference by allowing for identification of false positives, and demonstrating an expected pattern of between-tissue variation in seasonal unimodal (Model 1), seasonal bimodal (Model 2), and aseasonal (Model 3) systems. Furthermore, by modelling expected isotopic values of tissues through time, we were able to constrain expectations of variation based on sampling timing with respect to potential diet shifts – after a long enough period of time, all signal of trophic switching is erased. We suggest that future work should pre-emptively model expectations for specific seasonal regimes, to time sampling efforts for the optimal predicted differences in tissues.
Overall, species that likely persist in their environments during seasonal shifts in resource availability (Hipposideros larvatus, Cynopterus sphinx) were found to have significant differences in δ 15N consistent with expectations of trophic-level switching. Our wide-ranging insectivore (Pteronotus alitonus) also demonstrated δ 15N variability among tissues, indicating probable seasonal dietary shifts. For these species, a trophic switching regime resembling Model 1 is most likely. We found no evidence of variation in δ 15N among tissues in wide-ranging Artibeus lituratus, and little variation for narrow-ranging Carollia perspicillata, suggesting that their diets are stable or aseasonal, with Model 3 being most likely. While we cannot rule out trophic switching altogether, even in species that show no tissue differences, based on the turnover times for the tissues involved, any trophic switching would have been sufficiently far in the past to be untraceable for any tissue (indicating a consistent diet for at least 6 months). We provide a full description of species ecologies and dietary patterns in relation to isotopic profiles in Supplement 4.
High dietary heterogeneity and no temporal structure cannot be completely ruled out for the species with significant differences in δ 15N; however, the likelihood that this null case would lead to the tissue differences found in some species examined is low. While ANOVAs performed on data from Model 3 suggest a false positive rate of 8–10%, we cannot capture the likelihood of patterns of variation between tissues, and we did not assess the probability of the null model producing patterns of significance such that multiple tissues are all different from one another. This case for seasonal patterns driving tissue differences is strengthened by comparing the variation in actual tissue values with the amount of variation expected under these high-heterogeneity conditions: i.e., the amount of variation observed is likely beyond what would be expected from year-round random dietary variation.
Ecological interpretation
Many species of phytophagous bats (particularly among Phyllostomidae) are known to feed on higher trophic level resources during certain times of the year (Pellón et al. Reference Pellón, Medina-Espinoza, Lim, Cornejo and Medellín2023, Rex et al. Reference Rex, Czaczkes, Michener, Kunz and Voigt2010; Willig et al. Reference Willig, Camilo and Noble1993), often corresponding to periods of increased metabolic demand tied to reproduction (Orr et al. Reference Orr, Ortega, Medellín, Sánchez and Hammond2016). Among Pteropodidae, feeding on insects is noted in some species, although records are often lacking; phytophagy and pollen do contribute significantly to protein intake for many pteropodid bats (Courts Reference Courts1998), and reproduction is often synchronised to periods of increased availability of preferred fruit and floral resources (Kofron Reference Kofron1997). Trophic-level switching is less common among insectivorous bats (e.g., Arango-Diago et al. Reference Arango-Diago, Castillo-Figueroa, Albarracín-Caro and Pérez-Torres2020), however, species often described as obligate insectivores have been noted to feed on plant matter (Daniel Reference Daniel1976; Frick et al. Reference Frick, Heady and Hayes2009; Ingala et al. Reference Ingala, Simmons, Wultsch, Krampis, Provost and Perkins2021) and occasionally vertebrates (Gual-Suarez and Medellín Reference Gual-Suárez and Medellín2021). Insectivores tend to be flexible in their consumption of insects to what is most available to each species in accordance with its echolocation and foraging strategy (Denzinger and Schnitzler Reference Denzinger and Schnitzler2013; Salinas-Ramos et al. Reference Salinas-Ramos, Herrera, León-Regagnon, Arrizabalaga-Escudero and Clare2015); therefore, while seasonal shifts in insect populations are more likely to influence the diets of these bat species than entirely switching their trophic guilds, the possibility remains for some species to be more flexible in their diets (Clare and Oelbaum Reference Clare, Oelbaum, Russo and Fenton2023).
Contrary to our prediction, we noted significant differences in δ 15N among tissues in insectivorous species Pteronotus alitonus and Hipposideros larvatus, which are less likely to be seasonally constrained in their diets than bats that rely on fruiting and flowering plants or are necessarily required to increase protein intake during reproduction. Although insects exhibit considerable seasonality in the tropics (Wolda Reference Wolda1978, Reference Wolda1980; Reference Wolda1988), insects are likely to never be limited (Egert-Berg et al. Reference Egert-Berg, Hurme, Greif, Goldstein, Harten, Herrera, Flores-Martínez, Valdés, Johnston, Eitan, Borissov, Shipley, Medellín, Wilkinson, Goerlitz and Yovel2018; Kohles et al. Reference Kohles, Page, Wikelski and Dechmann2024). However, in the Anthropocene, global insect declines may be leading to resource limitation for insectivorous animals, driving dispersal or reduction in populations (Sherry Reference Sherry2021). Omnivory may be a strategy for survival, and some insectivorous bats have been documented feeding on plant material, such as leaves, nectar, and fruit, but this is not frequently reported across taxa (Clare and Oelbaum Reference Clare, Oelbaum, Russo and Fenton2023). Notably, insectivory is not a monolith (Denzinger and Schnitzler Reference Denzinger and Schnitzler2013), and arthropods occupy multiple trophic guilds (Quinby et al. Reference Quinby, Creighton and Flaherty2020). Shifts in δ 15N observed in bat tissues may not necessarily reflect a shift away from insects, but perhaps between different taxa that occupy higher/lower trophic levels, or differences in what the insects are eating, irrespective of differences in bat prey selection (Quinby et al. Reference Quinby, Creighton and Flaherty2020). Some insect taxa are more abundant seasonally than others (Wolda Reference Wolda1978, Reference Wolda1980), and what is likely occurring is that insectivorous bats find reliable prey patches they can exploit if there are seasonal shortages, rather than selective foraging for particular types of insects (Kohles et al. Reference Kohles, Page, Wikelski and Dechmann2024). Significant differences in δ 15N between tissues in these species are unlikely to reflect shifts away from insect consumption.
Potential limitations
An important caveat to these conclusions of temporal shifts in resource use is that we have not included other intrinsic markers in these analyses, which may indicate changes in movement or foraging, other than in protein consumption and trophic level (Brewer et al. Reference Brewer, Rauch-Davis and Fraser2021). Nitrogen isotopes only quantify a single dimension of the n-dimensional niche, and thus only a single axis in which animals may change their diet. Multi-dimensional isotopic niche breadths have the potential to substantially shift in response to seasonal resource availability (Shipley and Twining Reference Shipley and Twining2020) in ways that we would not recover with these methods.
In addition to discrimination values between an animal’s diet and its tissues, another important factor to consider is environmental isotopic baselines. As isotopic ratios found in animal tissues ultimately are sourced from food availability, seasonal and temporal shifts in temperature and precipitation can drive seasonal environmental enrichment or depletion of δ 15N (Solomon et al. Reference Solomon, Carpenter, Rusak and Vander Zanden2008). Enrichment in δ 15N may be the result of differences in foraging behaviour driven by environmental change (Popa-Lisseanu et al. Reference Popa-Lisseanu, Kramer-Schadt, Quetglas, Delgado-Huertas, Kelm and Ibáñez2015). Spatial and geographic differences can also account for changes in isotopic baselines because differences in primary productivity between microclimates may affect the isotopic ratios in the animals that occupy them (Belle et al. Reference Belle and Cabana2020; Hobson et al. Reference Hobson, Ofukany, Soto and Wassenaar2012). It is worth considering the role of environmental isotopic baseline shifts (Anaya et al., Reference Anaya, García-Oliva and Jaramillo2007; Yokobe et al. Reference Yokobe, Hyodo and Tokuchi2018), however, in wet tropical ecosystems baselines do not change substantially with season, because even the ‘dry season’ is not dry enough to limit microbial processes and so there may be no appreciable changes in plant δ 15N values (Ometto et al. Reference Ometto, Ehleringer, Domingues, Berry, Ishida, Mazzi, Higuchi, Flanagan, Nardoto and Martinelli2006).
Conclusions
Seasonal shifts in the diets of bats have been noted across both ecosystems and continents, with different phenology of plants leading to seasonal fruiting and flowering peaks and availability of insects. Studies directly measuring diet using faecal or stomach content analysis in some of these species note that their diets seasonally change to reflect the availability of resources in their environment. Given with the low probability of incorrectly rejecting a reality consistent with model 3, we therefore argue that it is most likely that significant differences observed in this study of δ 15N between tissue types are representative of dietary shifts through time caused by seasonal shortages or abundances of various resources, rather than by shifting isotopic baselines alone.
Supplementary material
The supplementary material for this article can be found at https://doi.org/10.1017/S0266467426100583.
Acknowledgements
The authors thank Jacqueline Miller of the Royal Ontario Museum for assistance in accessing museum material, William Mark of the Environmental Isotope Lab, and Heidi Swanson and Brock Fenton for providing comments on this manuscript.
Funding statement
All funding was provided by the Natural Sciences and Engineering Research Council of Canada (Discovery Grant to HGB). No direct funding was obtained for this study.
Competing interests
The authors declare no competing interests in relation to this study.



 Open access

