


1. Introduction
Neutral atomic hydrogen (Hi) plays a crucial role in galaxy evolution by serving as the primary source of cold gas that fuels star formation. Traditionally, Hi observations using single-dish radio telescopes have provided global Hi data for large galaxy samples (e.g. the Arecibo Legacy Fast ALFA survey, ALFALFA; Giovanelli et al. Reference Giovanelli2005; Haynes et al. Reference Haynes2018), offering insights into how galaxies consume their gas content to sustain star formation (e.g. Saintonge & Catinella Reference Saintonge and Catinella2022, and references therein). For example, there is an inverse relation between a galaxy’s gas-to-stellar mass fraction and stellar quantities, such that early-type galaxies, typically more massive and bulge-dominated, tend to have lower gas mass fractions. The gas mass fraction correlates most strongly with star formation quantities, which indicates that gas-rich galaxies tend to be actively forming stars (e.g. Saintonge & Catinella Reference Saintonge and Catinella2022). However, Hi is converted into molecular gas in dense regions with surface densities exceeding about 10 $\text{M}_\odot\ \mathrm{pc}^{-2}$
(Martin & Kennicutt Reference Martin and Kennicutt2001; Bigiel et al. Reference Bigiel2008; Bigiel & Blitz Reference Bigiel and Blitz2012), becoming a more direct precursor to form stars in galaxies. Indeed, Hi extends well beyond a galaxy’s stellar disc – typically twice as far – and star formation in these outer Hi regions is less efficient than in the central galactic disc (Bigiel et al. Reference Bigiel2010b). The limited spatial resolution of single-dish telescopes has hindered our ability to resolve detailed Hi structures within galaxies, thus limiting our understanding of its role on similar scales with other galactic properties.
$\text{M}_\odot\ \mathrm{pc}^{-2}$
(Martin & Kennicutt Reference Martin and Kennicutt2001; Bigiel et al. Reference Bigiel2008; Bigiel & Blitz Reference Bigiel and Blitz2012), becoming a more direct precursor to form stars in galaxies. Indeed, Hi extends well beyond a galaxy’s stellar disc – typically twice as far – and star formation in these outer Hi regions is less efficient than in the central galactic disc (Bigiel et al. Reference Bigiel2010b). The limited spatial resolution of single-dish telescopes has hindered our ability to resolve detailed Hi structures within galaxies, thus limiting our understanding of its role on similar scales with other galactic properties.
Recent advancements in radio interferometry have provided the ability to study Hi properties with improved spatial resolution. For example, several studies have identified a close relation between Hi isodensity radius and Hi mass (e.g. Broeils & Rhee Reference Broeils and Rhee1997; Swaters et al. Reference Swaters, van Albada, van der Hulst and Sancisi2002; Wang et al. Reference Wang2016; Rajohnson et al. Reference Rajohnson2022). In particular, Wang et al. (Reference Wang2016) combined 15 different Hi interferometric surveys and demonstrated a remarkably low scatter of this relation. Using analytical Hi models, Stevens et al. (Reference Stevens2019) further linked these findings to the universal distribution of Hi in the outer regions of galaxies, typically described by a declining exponential function (Swaters et al. Reference Swaters, van Albada, van der Hulst and Sancisi2002; Wang et al. Reference Wang2014). However, studies have observed deviations from the universal distribution in inner Hi radial profiles, often showing flattened or damped Hi surface densities near the galactic centre (e.g. Swaters et al. Reference Swaters, van Albada, van der Hulst and Sancisi2002; Leroy et al. Reference Leroy2008; Bigiel et al. Reference Bigiel2010b; Wang et al. Reference Wang2014). They found that the central surface density of Hi varies widely, ranging from 1 to $\sim$
10
$\sim$
10 $\text{M}_\odot$
pc
$\text{M}_\odot$
pc $^{-2}$
. However, how other galaxy properties influence this variation remains unclear, mainly because of the small sample sizes. Despite this progress, understanding the variation of Hi content within galaxies on smaller scales has been challenging due to the limited availability of homogeneous large samples with spatially resolved Hi data.
$^{-2}$
. However, how other galaxy properties influence this variation remains unclear, mainly because of the small sample sizes. Despite this progress, understanding the variation of Hi content within galaxies on smaller scales has been challenging due to the limited availability of homogeneous large samples with spatially resolved Hi data.
Previous studies investigated spatially resolved Hi scaling relations, finding weak or no correlation between Hi surface density and star formation surface density on $\sim$
kpc scales for small samples of very nearby galaxies (e.g. Wong & Blitz Reference Wong and Blitz2002; Boissier et al. Reference Boissier, Prantzos, Boselli and Gavazzi2003; Bigiel et al. Reference Bigiel2008; Schruba et al. Reference Schruba2011; Watts et al. Reference Watts2023). When focusing on Hi within the optical radius, Wang et al. (Reference Wang2017) reported a very weak correlation between average Hi and SFR surface densities for galaxies from the Local Volume Hi Survey (LVHIS; Koribalski et al. Reference Koribalski2018), while Naluminsa et al. (Reference Naluminsa, Elson and Jarrett2021) found no correlation for galaxies from the Westerbork survey of Hi in Irregular and Spiral galaxies (WHISP; van der Hulst, van Albada, & Sancisi Reference van der Hulst, van Albada, Sancisi, Hibbard, Rupen and van Gorkom2001). To conduct a more extensive analysis, Wang et al. (Reference Wang2020) introduced a method to estimate the Hi mass within the optical radius from global Hi spectra, using the Hi mass-size relation and median Hi radial profiles derived from 168 spatially resolved Hi maps. Applying their technique to 447 late-type galaxies from the extended GALEX Arecibo SDSS Survey (xGASS; Catinella et al. Reference Catinella2018), they showed similar correlations in Hi mass fraction scaling relations but with a shallower slope and decreased scatter. However, their findings were based on estimates derived from unresolved data, which require further validation through observations.
$\sim$
kpc scales for small samples of very nearby galaxies (e.g. Wong & Blitz Reference Wong and Blitz2002; Boissier et al. Reference Boissier, Prantzos, Boselli and Gavazzi2003; Bigiel et al. Reference Bigiel2008; Schruba et al. Reference Schruba2011; Watts et al. Reference Watts2023). When focusing on Hi within the optical radius, Wang et al. (Reference Wang2017) reported a very weak correlation between average Hi and SFR surface densities for galaxies from the Local Volume Hi Survey (LVHIS; Koribalski et al. Reference Koribalski2018), while Naluminsa et al. (Reference Naluminsa, Elson and Jarrett2021) found no correlation for galaxies from the Westerbork survey of Hi in Irregular and Spiral galaxies (WHISP; van der Hulst, van Albada, & Sancisi Reference van der Hulst, van Albada, Sancisi, Hibbard, Rupen and van Gorkom2001). To conduct a more extensive analysis, Wang et al. (Reference Wang2020) introduced a method to estimate the Hi mass within the optical radius from global Hi spectra, using the Hi mass-size relation and median Hi radial profiles derived from 168 spatially resolved Hi maps. Applying their technique to 447 late-type galaxies from the extended GALEX Arecibo SDSS Survey (xGASS; Catinella et al. Reference Catinella2018), they showed similar correlations in Hi mass fraction scaling relations but with a shallower slope and decreased scatter. However, their findings were based on estimates derived from unresolved data, which require further validation through observations.
The Widefield ASKAP L-band Legacy All-sky Blind Survey (WALLABY; Koribalski et al. Reference Koribalski2020) can address this issue for the first time for a large sample of spatially resolved Hi detections in the local Universe. Conducted with the Australian Square Kilometre Array Pathfinder (ASKAP; Johnston et al. Reference Johnston2008; Hotan et al. Reference Hotan2021), WALLABY is expected to detect over 200 000 Hi sources across a significant part of the southern hemisphere out to redshifts of 0.08. The WALLABY pilot survey has already provided Hi source catalogues, images, and spectra of more than 2 000 Hi detections (Westmeier et al. Reference Westmeier2022; Murugeshan et al. Reference Murugeshan2024).
In this study, we use WALLABY to quantify variations in Hi content (mass and surface density) within the stellar disc of 995 galaxies and investigate the causes for these variations. This paper is structured as follows. In Sections 2 and 3, we introduce the Hi and optical data and outline the measurement of physical quantities. Section 4 describes our sample selection from WALLABY, and Section 5 presents our findings on Hi within stellar disc properties and their relation to stellar properties. Finally, in Section 6, we discuss our results in context with previous studies and conclude in Section 7. This paper uses the AB magnitude system and assumes a flat $\Lambda$
CDM model with
$\Lambda$
CDM model with $H_{0}=$
70 km s
$H_{0}=$
70 km s $^{-1}$
Mpc
$^{-1}$
Mpc $^{-1}$
(Planck Collaboration et al. Reference Collaboration2020).
$^{-1}$
(Planck Collaboration et al. Reference Collaboration2020).
2. Data
WALLABY provides a statistical sample of spatially resolved Hi data. The first pilot survey released Hi data observed towards the Hydra cluster, the NGC 4636 group and the Norma cluster (60 deg $^2$
each) (PDR1; Westmeier et al. Reference Westmeier2022). WALLABY then released the second pilot survey data observed towards the NGC 5044 group (120 deg
$^2$
each) (PDR1; Westmeier et al. Reference Westmeier2022). WALLABY then released the second pilot survey data observed towards the NGC 5044 group (120 deg $^2$
), the NGC 4808 group (30 deg
$^2$
), the NGC 4808 group (30 deg $^2$
), and the Vela cluster (30 deg
$^2$
), and the Vela cluster (30 deg $^2$
) (PDR2; Murugeshan et al. Reference Murugeshan2024). Among them, we use only data from the Hydra cluster, NGC 4636, NGC 5044, and NGC 4808 fields (272, 147, 1 326, and 231 Hi detections, respectively) since Norma and Vela fields are affected by strong continuum residuals. WALLABY provides source catalogues of Hi sources detected using the Source Finding Application 2 (SOFIA2; Westmeier et al. Reference Westmeier2021) and data products of each Hi source such as the Hi spectral line cube and Hi intensity map (moment 0), with a spatial and spectral resolution of 30 arcsec and 4 km s
$^2$
) (PDR2; Murugeshan et al. Reference Murugeshan2024). Among them, we use only data from the Hydra cluster, NGC 4636, NGC 5044, and NGC 4808 fields (272, 147, 1 326, and 231 Hi detections, respectively) since Norma and Vela fields are affected by strong continuum residuals. WALLABY provides source catalogues of Hi sources detected using the Source Finding Application 2 (SOFIA2; Westmeier et al. Reference Westmeier2021) and data products of each Hi source such as the Hi spectral line cube and Hi intensity map (moment 0), with a spatial and spectral resolution of 30 arcsec and 4 km s $^{-1}$
, respectively, at a sensitivity of 1.6 mJy per beam per 4 km s
$^{-1}$
, respectively, at a sensitivity of 1.6 mJy per beam per 4 km s $^{-1}$
channel. The mean rms noise levels are 2.0, 2.7, 1.8, and 1.9 mJy per beam for Hi detections in the Hydra cluster, NGC 4636, NGC 5044, and NGC 4808 fields, respectively. Detailed descriptions of WALLABY observations, data processing, and source finding can be found in Westmeier et al. (Reference Westmeier2022). Since WALLABY is an untargeted Hi survey, most detections are from gas-rich star-forming galaxies in the local Universe, i.e. z
$^{-1}$
channel. The mean rms noise levels are 2.0, 2.7, 1.8, and 1.9 mJy per beam for Hi detections in the Hydra cluster, NGC 4636, NGC 5044, and NGC 4808 fields, respectively. Detailed descriptions of WALLABY observations, data processing, and source finding can be found in Westmeier et al. (Reference Westmeier2022). Since WALLABY is an untargeted Hi survey, most detections are from gas-rich star-forming galaxies in the local Universe, i.e. z $\lesssim$
0.08 (e.g. see Figure 1 in Reynolds et al. Reference Reynolds2023).
$\lesssim$
0.08 (e.g. see Figure 1 in Reynolds et al. Reference Reynolds2023).
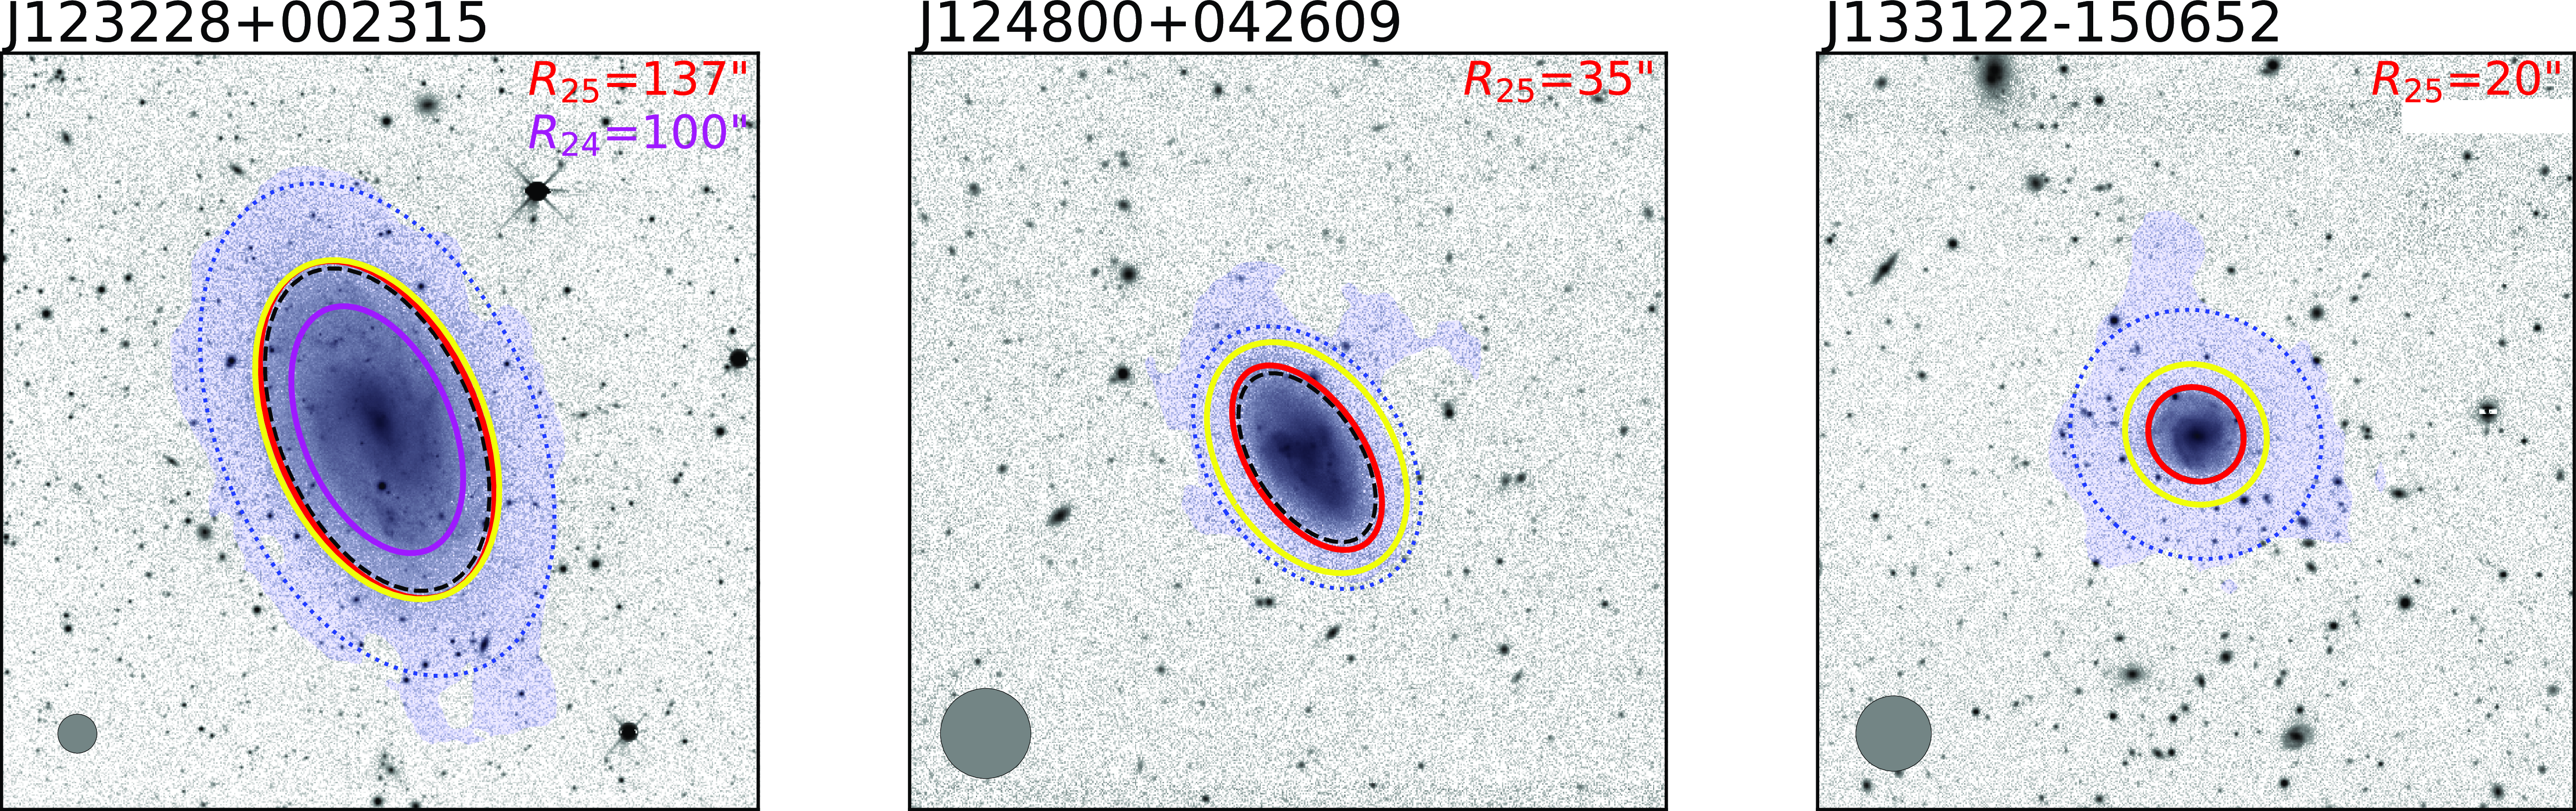
DECaLS i-band images overlaid with the stellar discs defined by $R_{\text{25}}$
(red solid ellipse),
$R_{\text{25}}$
(red solid ellipse), $R_{\text{24}}$
(magenta solid ellipse; shown only in the first panel), and
$R_{\text{24}}$
(magenta solid ellipse; shown only in the first panel), and $R_{\text{90%}}$
(black dashed ellipse) for galaxies with three different resolutions. The yellow solid ellipse represents the convolved stellar disc radius,
$R_{\text{90%}}$
(black dashed ellipse) for galaxies with three different resolutions. The yellow solid ellipse represents the convolved stellar disc radius, $R_{\text{25,c}}$
(see text for details). The blue-shaded region shows the Hi distribution, with the outer contour corresponding to an integrated Hi intensity of 0.4
$R_{\text{25,c}}$
(see text for details). The blue-shaded region shows the Hi distribution, with the outer contour corresponding to an integrated Hi intensity of 0.4 $\text{M}_\odot\ pc^{-2}$
, whereas the blue dotted circle indicates the Hi disc defined by
$\text{M}_\odot\ pc^{-2}$
, whereas the blue dotted circle indicates the Hi disc defined by $R_{\text{HI}}$
. The value of
$R_{\text{HI}}$
. The value of $R_{\text{25}}$
(and
$R_{\text{25}}$
(and $R_{\text{24}}$
in the first panel) is noted in the top-right corner of each panel. The filled grey circle in the bottom-left corner indicates the 30" WALLABY synthesised beam.
$R_{\text{24}}$
in the first panel) is noted in the top-right corner of each panel. The filled grey circle in the bottom-left corner indicates the 30" WALLABY synthesised beam.
As ancillary data, we use the Dark Energy Spectroscopic Instrument (DESI) Legacy Survey Data Release 10 (Dey et al. Reference Dey2019) to measure the stellar properties of WALLABY sources (e.g. optical radius, stellar mass, stellar surface density, and optical colour). It includes the Dark Energy Camera Legacy Survey (DECaLS) which provides the sky-subtracted Dark Energy Camera images in multiple optical bands covering both the northern and southern hemispheres (declination < 34 $^{\circ}$
) with a native pixel scale of 0.262 arcsec. We obtain g-band and i-band images using the DESI Legacy Imaging Surveys cutout service by adopting the centroid position of each Hi detection from the WALLABY catalogue and the size of the Hi intensity map as the input parameters.
$^{\circ}$
) with a native pixel scale of 0.262 arcsec. We obtain g-band and i-band images using the DESI Legacy Imaging Surveys cutout service by adopting the centroid position of each Hi detection from the WALLABY catalogue and the size of the Hi intensity map as the input parameters.
We exclude WALLABY Hi detections contaminated by nearby radio continuum sources and partial Hi detections, resulting in a sample of 1 656 galaxies out of 1 976 initial detections. We then visually inspect the g-band and i-band images of the remaining galaxies, selecting only those with no significant contamination from foreground sources or severe background artifacts, and a single optical counterpart. This narrowed our sample to 1 543 galaxies, 94% of which have a Hi signal-to-noise ratio greater than 5, with a minimum of 3.
3. Methodology
We derive stellar, global Hi, and Hi within stellar disc properties (e.g. sizes and masses) by conducting photometry on DECalS g-band and i-band images as well as Hi intensity maps. Instead of selecting an arbitrary stellar radius, we use two isophotal radii at surface brightness levels of 25 and 24 mag arcsec $^{-2}$
in the i-band (
$^{-2}$
in the i-band ( $R_{\text{25}}$
and
$R_{\text{25}}$
and $R_{\text{24}}$
, respectively). We measure the Hi mass within these two radii, calculate corresponding properties, and analyse whether and how trends or scatter change as we move from global measurements to those at smaller radii.
$R_{\text{24}}$
, respectively). We measure the Hi mass within these two radii, calculate corresponding properties, and analyse whether and how trends or scatter change as we move from global measurements to those at smaller radii.
3.1. Stellar properties
We conduct optical photometry using DECalS i-band as the primary reference and extend it to the g-band, as the i-band is less impacted by dust extinction and better reflects the stellar mass of galaxies. We measure $R_{\text{25}}$
and
$R_{\text{25}}$
and $R_{\text{24}}$
isophotal radii. Previous studies have shown that isophotal radii provide tighter scaling relations compared to radii enclosing a specific fraction of the total light, such as
$R_{\text{24}}$
isophotal radii. Previous studies have shown that isophotal radii provide tighter scaling relations compared to radii enclosing a specific fraction of the total light, such as $R_{\text{50%}}$
(the effective radius) and
$R_{\text{50%}}$
(the effective radius) and $R_{\text{90%}}$
(e.g. Saintonge & Spekkens Reference Saintonge and Spekkens2011; Hall et al. Reference Hall, Courteau, Dutton, McDonald and Zhu2012). The scatter in the stellar mass-size relation is known to be minimised when the isophotal radius is defined at a surface brightness of 24.7 mag arcsec
$R_{\text{90%}}$
(e.g. Saintonge & Spekkens Reference Saintonge and Spekkens2011; Hall et al. Reference Hall, Courteau, Dutton, McDonald and Zhu2012). The scatter in the stellar mass-size relation is known to be minimised when the isophotal radius is defined at a surface brightness of 24.7 mag arcsec $^{-2}$
in the r-band (Figure 8 in Sánchez Almeida Reference Sánchez Almeida2020). Our
$^{-2}$
in the r-band (Figure 8 in Sánchez Almeida Reference Sánchez Almeida2020). Our $R_{\text{25}}$
is effectively equal to
$R_{\text{25}}$
is effectively equal to $R_{\text{90%}}$
for the i-band in DECaLS imaging, with a mean
$R_{\text{90%}}$
for the i-band in DECaLS imaging, with a mean $R_{\text{90%}}$
/
$R_{\text{90%}}$
/ $R_{\text{25}}$
ratio of 0.97 and a standard deviation of 0.26 (see Fig. 1). This corresponds to a stellar surface density of 1.9
$R_{\text{25}}$
ratio of 0.97 and a standard deviation of 0.26 (see Fig. 1). This corresponds to a stellar surface density of 1.9 $\text{M}_\odot$
pc
$\text{M}_\odot$
pc $^{-2}$
assuming a mass-to-light ratio of 0.7, which is the average value for our parent sample (see Section 4). In contrast,
$^{-2}$
assuming a mass-to-light ratio of 0.7, which is the average value for our parent sample (see Section 4). In contrast, $R_{\text{24}}$
is closer to the radius at 25 mag arcsec
$R_{\text{24}}$
is closer to the radius at 25 mag arcsec $^{-2}$
in the B-band historically used to define the extent of the optical disc (e.g. Cortese et al. Reference Cortese2012).
$^{-2}$
in the B-band historically used to define the extent of the optical disc (e.g. Cortese et al. Reference Cortese2012).
We extract surface brightness profiles to measure $R_{\text{25}}$
and
$R_{\text{25}}$
and $R_{\text{24}}$
following the method described in Reynolds et al. (Reference Reynolds2023) but using DECaLS i-band images. In summary, we create a segmentation map to obtain parameters for ellipse fitting and mask sources other than the target galaxy. We make elliptical annuli and measure the local background level as the sigma-clipped mean image pixel units (ADU) between two ellipses outside the galaxy, i.e. the outermost ellipse and the ellipse with a major axis equal to 75% of that of the outermost ellipse, from the masked image. The mean local 3 sigma noise level of DECaLS i-band images corresponds to 25.3 mag arcsec
$R_{\text{24}}$
following the method described in Reynolds et al. (Reference Reynolds2023) but using DECaLS i-band images. In summary, we create a segmentation map to obtain parameters for ellipse fitting and mask sources other than the target galaxy. We make elliptical annuli and measure the local background level as the sigma-clipped mean image pixel units (ADU) between two ellipses outside the galaxy, i.e. the outermost ellipse and the ellipse with a major axis equal to 75% of that of the outermost ellipse, from the masked image. The mean local 3 sigma noise level of DECaLS i-band images corresponds to 25.3 mag arcsec $^{-2}$
. After local background subtraction, we measure the mean ADU within each annulus and convert it to surface brightness using
$^{-2}$
. After local background subtraction, we measure the mean ADU within each annulus and convert it to surface brightness using
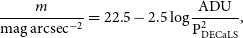 \begin{equation} \frac{m}{\mathrm{mag\, arcsec^{-2}}}=22.5-2.5\mathrm{\,log\frac{ADU}{P_{DECaLS}^2}},\end{equation}
where the DECaLS pixel scale ( $\mathrm{{P}_{DECaLS}}$
) is 0.262 arcsec per pixel. We define the stellar disc sizes as the semi-major axis of the isophotal ellipse where the i-band surface brightness is 25 or 24 mag arcsec
$\mathrm{{P}_{DECaLS}}$
) is 0.262 arcsec per pixel. We define the stellar disc sizes as the semi-major axis of the isophotal ellipse where the i-band surface brightness is 25 or 24 mag arcsec $^{-2}$
.
$^{-2}$
.
Using the masked and local background subtracted i-band and g-band images, we estimate the i-band ( $M_{\text{i,25}}$
and
$M_{\text{i,25}}$
and $M_{\text{i,24}}$
) and g-band magnitudes (
$M_{\text{i,24}}$
) and g-band magnitudes ( $M_{\text{g,25}}$
and
$M_{\text{g,25}}$
and $M_{\text{g,24}}$
) as the total magnitudes enclosed by the
$M_{\text{g,24}}$
) as the total magnitudes enclosed by the $R_{\text{25}}$
and
$R_{\text{25}}$
and $R_{\text{24}}$
elliptical apertures, respectively, and the asymptotic magnitude in the i-band (
$R_{\text{24}}$
elliptical apertures, respectively, and the asymptotic magnitude in the i-band ( $M_{\text{i,asymp}}$
) using the curve-of-growth (e.g. Muñoz-Mateos et al. Reference Muñoz-Mateos2015). The effective i-band radius (
$M_{\text{i,asymp}}$
) using the curve-of-growth (e.g. Muñoz-Mateos et al. Reference Muñoz-Mateos2015). The effective i-band radius ( $R_{\text{50\%}}$
) is estimated as the semi-major axis of the aperture enclosing half the flux corresponding to
$R_{\text{50\%}}$
) is estimated as the semi-major axis of the aperture enclosing half the flux corresponding to $M_{\text{i,asymp}}$
. The g-band and i-band magnitudes are corrected for galactic extinction from the Milky Way following the dust extinction law in Cardelli et al. (Reference Cardelli, Clayton and Mathis1989) with the extinction coefficients of
$M_{\text{i,asymp}}$
. The g-band and i-band magnitudes are corrected for galactic extinction from the Milky Way following the dust extinction law in Cardelli et al. (Reference Cardelli, Clayton and Mathis1989) with the extinction coefficients of $R_{v}=3.214$
and
$R_{v}=3.214$
and $1.592$
for the DECam g and i filters, respectively (Dey et al. Reference Dey2019).
$1.592$
for the DECam g and i filters, respectively (Dey et al. Reference Dey2019).
We estimate stellar masses using the relation given in Taylor et al. (Reference Taylor2011) as
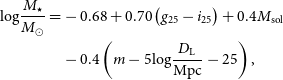 \begin{equation}\begin{split} \text{log}{\frac{M_{\star}}{M_{\odot}}}=&-0.68+0.70\left(g_{\text{25}}-i_{\text{25}}\right)+0.4M_{\text{sol}}\\ &-0.4\left(m-5\text{log}\frac{D_{\text{L}}}{\text{Mpc}}-25\right),\end{split}\end{equation}
where $g_{\text{25}}-i_{\text{25}}$
is the extinction-corrected colour measured within the
$g_{\text{25}}-i_{\text{25}}$
is the extinction-corrected colour measured within the $R_{\text{25}}$
elliptical aperture,
$R_{\text{25}}$
elliptical aperture, $M_{\text{sol}}$
= 4.52 is the absolute magnitude of the Sun in the i-band (Willmer Reference Willmer2018),
$M_{\text{sol}}$
= 4.52 is the absolute magnitude of the Sun in the i-band (Willmer Reference Willmer2018), $D_{\text{L}}$
is the luminosity distance which is taken as the local Hubble distance from the WALLABY source catalogueFootnote
a
(Westmeier et al. Reference Westmeier2022), and m is the apparent i-band magnitude. This relation is known to estimate the stellar mass-to-light ratio with a 1
$D_{\text{L}}$
is the luminosity distance which is taken as the local Hubble distance from the WALLABY source catalogueFootnote
a
(Westmeier et al. Reference Westmeier2022), and m is the apparent i-band magnitude. This relation is known to estimate the stellar mass-to-light ratio with a 1 $\sigma$
accuracy of
$\sigma$
accuracy of $\sim$
0.01 dex using only g- and i-band photometry (Taylor et al. Reference Taylor2011). The total stellar mass (
$\sim$
0.01 dex using only g- and i-band photometry (Taylor et al. Reference Taylor2011). The total stellar mass ( $M_\star$
) and stellar mass within
$M_\star$
) and stellar mass within $R_{\text{25}}$
(
$R_{\text{25}}$
( $M_{\star,R25}$
) are derived using m from
$M_{\star,R25}$
) are derived using m from $M_{\text{i,asymp}}$
and
$M_{\text{i,asymp}}$
and $M_{\text{i,25}}$
, respectively. Stellar masses measured within
$M_{\text{i,25}}$
, respectively. Stellar masses measured within $R_{\text{24}}$
are very similar (average
$R_{\text{24}}$
are very similar (average $M_{\star,R24}/M_{\star,R25}=0.91$
for our primary sample; see Section 4), thus for simplicity, we show our results only for
$M_{\star,R24}/M_{\star,R25}=0.91$
for our primary sample; see Section 4), thus for simplicity, we show our results only for $M_{\star,R25}$
. We derive the average stellar mass surface density as
$M_{\star,R25}$
. We derive the average stellar mass surface density as
 \begin{equation} \mu_{\star}=\frac{M_{\star}}{2\pi R_{50\%}^2}.\end{equation}
3.2. Global Hi and Hi within stellar disc properties
We study the Hi surface brightness distribution of the sample using WALLABY moment 0 (intensity) maps, which have been flux-corrected as described in Westmeier et al. (Reference Westmeier2022) and Murugeshan et al. (Reference Murugeshan2024). We extract radial Hi surface density profiles from the intensity maps to measure the Hi isodensity radius at 1 $\text{M}_\odot$
pc
$\text{M}_\odot$
pc $^{-2}$
(
$^{-2}$
( $R_{\text{HI}}$
) following the method described in Reynolds et al. (Reference Reynolds2023). In summary, we make elliptical annuli, using the parameters from the 2-dimensional Gaussian fitting to the Hi intensity map, binned by one-third of the WALLABY beam’s full-width half maximum (
$R_{\text{HI}}$
) following the method described in Reynolds et al. (Reference Reynolds2023). In summary, we make elliptical annuli, using the parameters from the 2-dimensional Gaussian fitting to the Hi intensity map, binned by one-third of the WALLABY beam’s full-width half maximum ( $\sim$
30"/3) along the major axis, and interpolate the average Hi surface density within each annulus to produce the radial profile. We measure
$\sim$
30"/3) along the major axis, and interpolate the average Hi surface density within each annulus to produce the radial profile. We measure $R_{\text{HI}}$
as the radius where the Hi surface density is 1 M
$R_{\text{HI}}$
as the radius where the Hi surface density is 1 M $_\odot$
pc
$_\odot$
pc $^{-2}$
from the profile. We do not apply inclination correction to the profile. The highly inclined galaxies (i.e. i > 80 degrees) correspond to 3.9% of our parent sample, and applying inclination correction for
$^{-2}$
from the profile. We do not apply inclination correction to the profile. The highly inclined galaxies (i.e. i > 80 degrees) correspond to 3.9% of our parent sample, and applying inclination correction for $R_{\text{HI}}$
does not change the interpretation of our results. Only when we analyse the shape of radial Hi surface density profiles in Section 6, we exclude highly inclined galaxies and use the inclination-corrected Hi profiles and deprojected Hi radius (
$R_{\text{HI}}$
does not change the interpretation of our results. Only when we analyse the shape of radial Hi surface density profiles in Section 6, we exclude highly inclined galaxies and use the inclination-corrected Hi profiles and deprojected Hi radius ( $R_{\text{HI,dep}}$
) where the Hi surface density is 1
$R_{\text{HI,dep}}$
) where the Hi surface density is 1 $\text{M}_\odot$
pc
$\text{M}_\odot$
pc $^{-2}$
from the inclination-corrected profile.
$^{-2}$
from the inclination-corrected profile.
We calculate the total Hi mass ( $M_{\text{HI}}$
) by integrating the total Hi flux from the Hi intensity map and converting it to Hi mass (Equation 48 in Meyer et al. Reference Meyer2017). To estimate the Hi mass within
$M_{\text{HI}}$
) by integrating the total Hi flux from the Hi intensity map and converting it to Hi mass (Equation 48 in Meyer et al. Reference Meyer2017). To estimate the Hi mass within $R_{\text{HI}}$
(
$R_{\text{HI}}$
( $M_{\text{HI,RHI}}$
) and within the stellar disc (
$M_{\text{HI,RHI}}$
) and within the stellar disc ( $M_{\text{HI,R25(24)}}$
), we use the Hi mass curve-of-growth profile, which represents the radial profile of the enclosed Hi mass within elliptical apertures. These apertures are defined based on the central position and position angle derived from the DECaLS i-band image, and the axis ratio is obtained from the Hi intensity map. For 86% of the sample, the separation between the Hi and optical centre position is less than 10". We adopt the optical centre for our analysis as it is more likely to provide an accurate reference.
$M_{\text{HI,R25(24)}}$
), we use the Hi mass curve-of-growth profile, which represents the radial profile of the enclosed Hi mass within elliptical apertures. These apertures are defined based on the central position and position angle derived from the DECaLS i-band image, and the axis ratio is obtained from the Hi intensity map. For 86% of the sample, the separation between the Hi and optical centre position is less than 10". We adopt the optical centre for our analysis as it is more likely to provide an accurate reference. $M_{\text{HI,RHI}}$
and
$M_{\text{HI,RHI}}$
and $M_{\text{HI,R25(24)}}$
are determined using the Hi mass curve-of-growth profile at
$M_{\text{HI,R25(24)}}$
are determined using the Hi mass curve-of-growth profile at $R_{\text{HI}}$
and
$R_{\text{HI}}$
and $R_{\text{25(24),c}}$
, where the subscript “c” indicates convolution with the 30" WALLABY synthesised beam to ensure consistent resolution between WALLABY and DECaLS. In detail, we generate a two-dimensional stellar image based on the i-band stellar surface brightness profile, then convolve this image with a Gaussian function representing the WALLABY synthesised beam. From the convolved image, we re-extract the stellar surface brightness profile and measure
$R_{\text{25(24),c}}$
, where the subscript “c” indicates convolution with the 30" WALLABY synthesised beam to ensure consistent resolution between WALLABY and DECaLS. In detail, we generate a two-dimensional stellar image based on the i-band stellar surface brightness profile, then convolve this image with a Gaussian function representing the WALLABY synthesised beam. From the convolved image, we re-extract the stellar surface brightness profile and measure $R_{\text{25(24),c}}$
. From this point onward, even if not explicitly stated, the Hi mass within stellar discs (
$R_{\text{25(24),c}}$
. From this point onward, even if not explicitly stated, the Hi mass within stellar discs ( $M_{\text{HI,R25(24)}}$
) and all related properties are assumed to be based on the optical radii convolved to WALLABY resolution.
$M_{\text{HI,R25(24)}}$
) and all related properties are assumed to be based on the optical radii convolved to WALLABY resolution.
Fig. 1 illustrates how the Hi content within the stellar disc is defined for galaxies with different resolutions. The red circle is the original stellar disc aperture based on $R_{\text{25}}$
and the yellow circle shows the convolved stellar radius used to measure the Hi mass enclosed within the stellar disc. As the angular size of the stellar disc decreases (from left to right), the difference between the red and yellow circles increases due to the beam-smearing effect.
$R_{\text{25}}$
and the yellow circle shows the convolved stellar radius used to measure the Hi mass enclosed within the stellar disc. As the angular size of the stellar disc decreases (from left to right), the difference between the red and yellow circles increases due to the beam-smearing effect.
As global Hi properties, we derive the global Hi mass fraction ( $f_{\text{HI}}$
) and the average Hi surface density within the Hi disc (
$f_{\text{HI}}$
) and the average Hi surface density within the Hi disc ( $\mu_{\text{HI,RHI}}$
) as
$\mu_{\text{HI,RHI}}$
) as
 \begin{align} f_{\text{HI}}=\frac{M_{\text{HI}}}{M_{\star}},\\[-8pt]\nonumber \end{align}
 \begin{align} \mu_{\text{HI,RHI}}=\frac{M_{\text{HI,RHI}}}{\pi R_{\text{HI}}^2}.\end{align}
We derive the Hi mass fraction and the average Hi surface density within $R_{\text{25}}$
(
$R_{\text{25}}$
( $R_{\text{24}}$
) as
$R_{\text{24}}$
) as
 \begin{equation} f_{\text{HI,R25(24)}}=\frac{M_{\text{HI,R25(24)}}}{M_{\star,R25(24)}},\end{equation}
 \begin{equation} \mu_{\text{HI,R25(24)}}=\frac{M_{\text{HI,R25(24)}}}{\pi R_{\text{25(24),c}}^2}.\end{equation}
4. Sample selection
After measuring Hi and stellar properties of 1 543 WALLABY galaxies, we carefully select our sample to ensure accurate measurements of the Hi mass within the stellar disc while maximising the number of available WALLABY galaxies. Measuring Hi properties within the stellar disc is meaningful only for galaxies with stellar discs larger than the radio beam, thus we exclude galaxies with stellar discs smaller than one beam. The parent sample consists of 995 galaxies with $R_{\text{25}}$
larger than half of the beam (
$R_{\text{25}}$
larger than half of the beam ( $R_{\text{25}}$
>15"). The primary sample is a subset of the parent sample, which includes 719 galaxies with
$R_{\text{25}}$
>15"). The primary sample is a subset of the parent sample, which includes 719 galaxies with $R_{\text{24}}$
>15". We also use ‘higher-resolution’ to refer to the subset of galaxies resolved by at least two beams within the stellar disc, defined by
$R_{\text{24}}$
>15". We also use ‘higher-resolution’ to refer to the subset of galaxies resolved by at least two beams within the stellar disc, defined by $R_{\text{25}}$
(348 galaxies) and
$R_{\text{25}}$
(348 galaxies) and $R_{\text{24}}$
(206 galaxies). In general, results related to
$R_{\text{24}}$
(206 galaxies). In general, results related to $R_{\text{25}}$
-based Hi within the stellar disc properties are presented using the parent sample, while
$R_{\text{25}}$
-based Hi within the stellar disc properties are presented using the parent sample, while $R_{\text{24}}$
-based properties are presented based on the primary sample, and statistics obtained for the primary sample only are presented where appropriate for comparison. Considering the potential uncertainty associated with marginal resolution, as shown in Fig. 1, we present our results using different colours or sizes to indicate the number of ASKAP beams along the major axis of the stellar disc (
$R_{\text{24}}$
-based properties are presented based on the primary sample, and statistics obtained for the primary sample only are presented where appropriate for comparison. Considering the potential uncertainty associated with marginal resolution, as shown in Fig. 1, we present our results using different colours or sizes to indicate the number of ASKAP beams along the major axis of the stellar disc ( $R_{\text{25(24)}}/15$
").
$R_{\text{25(24)}}/15$
").
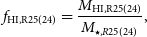
Fig. 2 shows the physical properties of 995 galaxies with $R_{\text{25}} \gt 15$
". We colour-code our galaxies from grey for galaxies with 15"<
$R_{\text{25}} \gt 15$
". We colour-code our galaxies from grey for galaxies with 15"< $R_{\text{25}}$
<30" to progressively darker colours for more spatially resolved galaxies. As expected, the galaxies with better-resolved discs are typically found at low redshifts (top left panel) and large stellar mass (top right panel). Our
$R_{\text{25}}$
<30" to progressively darker colours for more spatially resolved galaxies. As expected, the galaxies with better-resolved discs are typically found at low redshifts (top left panel) and large stellar mass (top right panel). Our $M_{\text{HI}}$
values tend to be higher than the medians for xGASS (Catinella et al. Reference Catinella2018; black diamonds), a stellar mass selected Hi survey that is not biased towards gas-rich systems, and generally fall below the fitted line from ALFALFA in Huang et al. (Reference Huang, Haynes, Giovanelli and Brinchmann2012; black dashed line), particularly at low stellar mass, because our sample excludes galaxies with poorer resolution at higher redshifts, which are often low stellar mass and Hi-rich. The bottom panels indicate that distributions of poorly-resolved and well-resolved galaxies overlap well in stellar mass and size or stellar mass and colour plane, and their correlations remain strong.
$M_{\text{HI}}$
values tend to be higher than the medians for xGASS (Catinella et al. Reference Catinella2018; black diamonds), a stellar mass selected Hi survey that is not biased towards gas-rich systems, and generally fall below the fitted line from ALFALFA in Huang et al. (Reference Huang, Haynes, Giovanelli and Brinchmann2012; black dashed line), particularly at low stellar mass, because our sample excludes galaxies with poorer resolution at higher redshifts, which are often low stellar mass and Hi-rich. The bottom panels indicate that distributions of poorly-resolved and well-resolved galaxies overlap well in stellar mass and size or stellar mass and colour plane, and their correlations remain strong.
Physical properties of our parent sample. Total Hi mass as a function of redshift (upper left) and the relations between stellar mass and total Hi mass (upper right), stellar radius (lower left), and colour (lower right). The black dashed line is the Hi-stellar mass relation derived by Huang et al. (Reference Huang, Haynes, Giovanelli and Brinchmann2012) and the black diamonds are the medians of the xGASS galaxies (Catinella et al. Reference Catinella2018). Galaxies are colour-coded from grey to darker colours by the number of beams along the major axis of the stellar disc ( $R_{\text{25}}$
/HWHM), where HWHM is the WALLABY beam’s half-width half maximum (=15").
$R_{\text{25}}$
/HWHM), where HWHM is the WALLABY beam’s half-width half maximum (=15").
5. Results
5.1. Global Hi vs. Hi within the stellar disc
Before examining how gas scaling relations change when excluding the outer Hi regions of galaxies, we first analyse the distribution of Hi mass and Hi surface density within $R_{\text{25}}$
and
$R_{\text{25}}$
and $R_{\text{24}}$
. The top row of Fig. 3 presents the distribution of Hi mass within the Hi disc (i.e. Hi with surface density above 1 M
$R_{\text{24}}$
. The top row of Fig. 3 presents the distribution of Hi mass within the Hi disc (i.e. Hi with surface density above 1 M $_{\odot}$
pc
$_{\odot}$
pc $^{-2}$
) and Hi mass within the stellar discs defined by
$^{-2}$
) and Hi mass within the stellar discs defined by $R_{\text{25}}$
and
$R_{\text{25}}$
and $R_{\text{24}}$
normalised by the total Hi mass.
$R_{\text{24}}$
normalised by the total Hi mass.
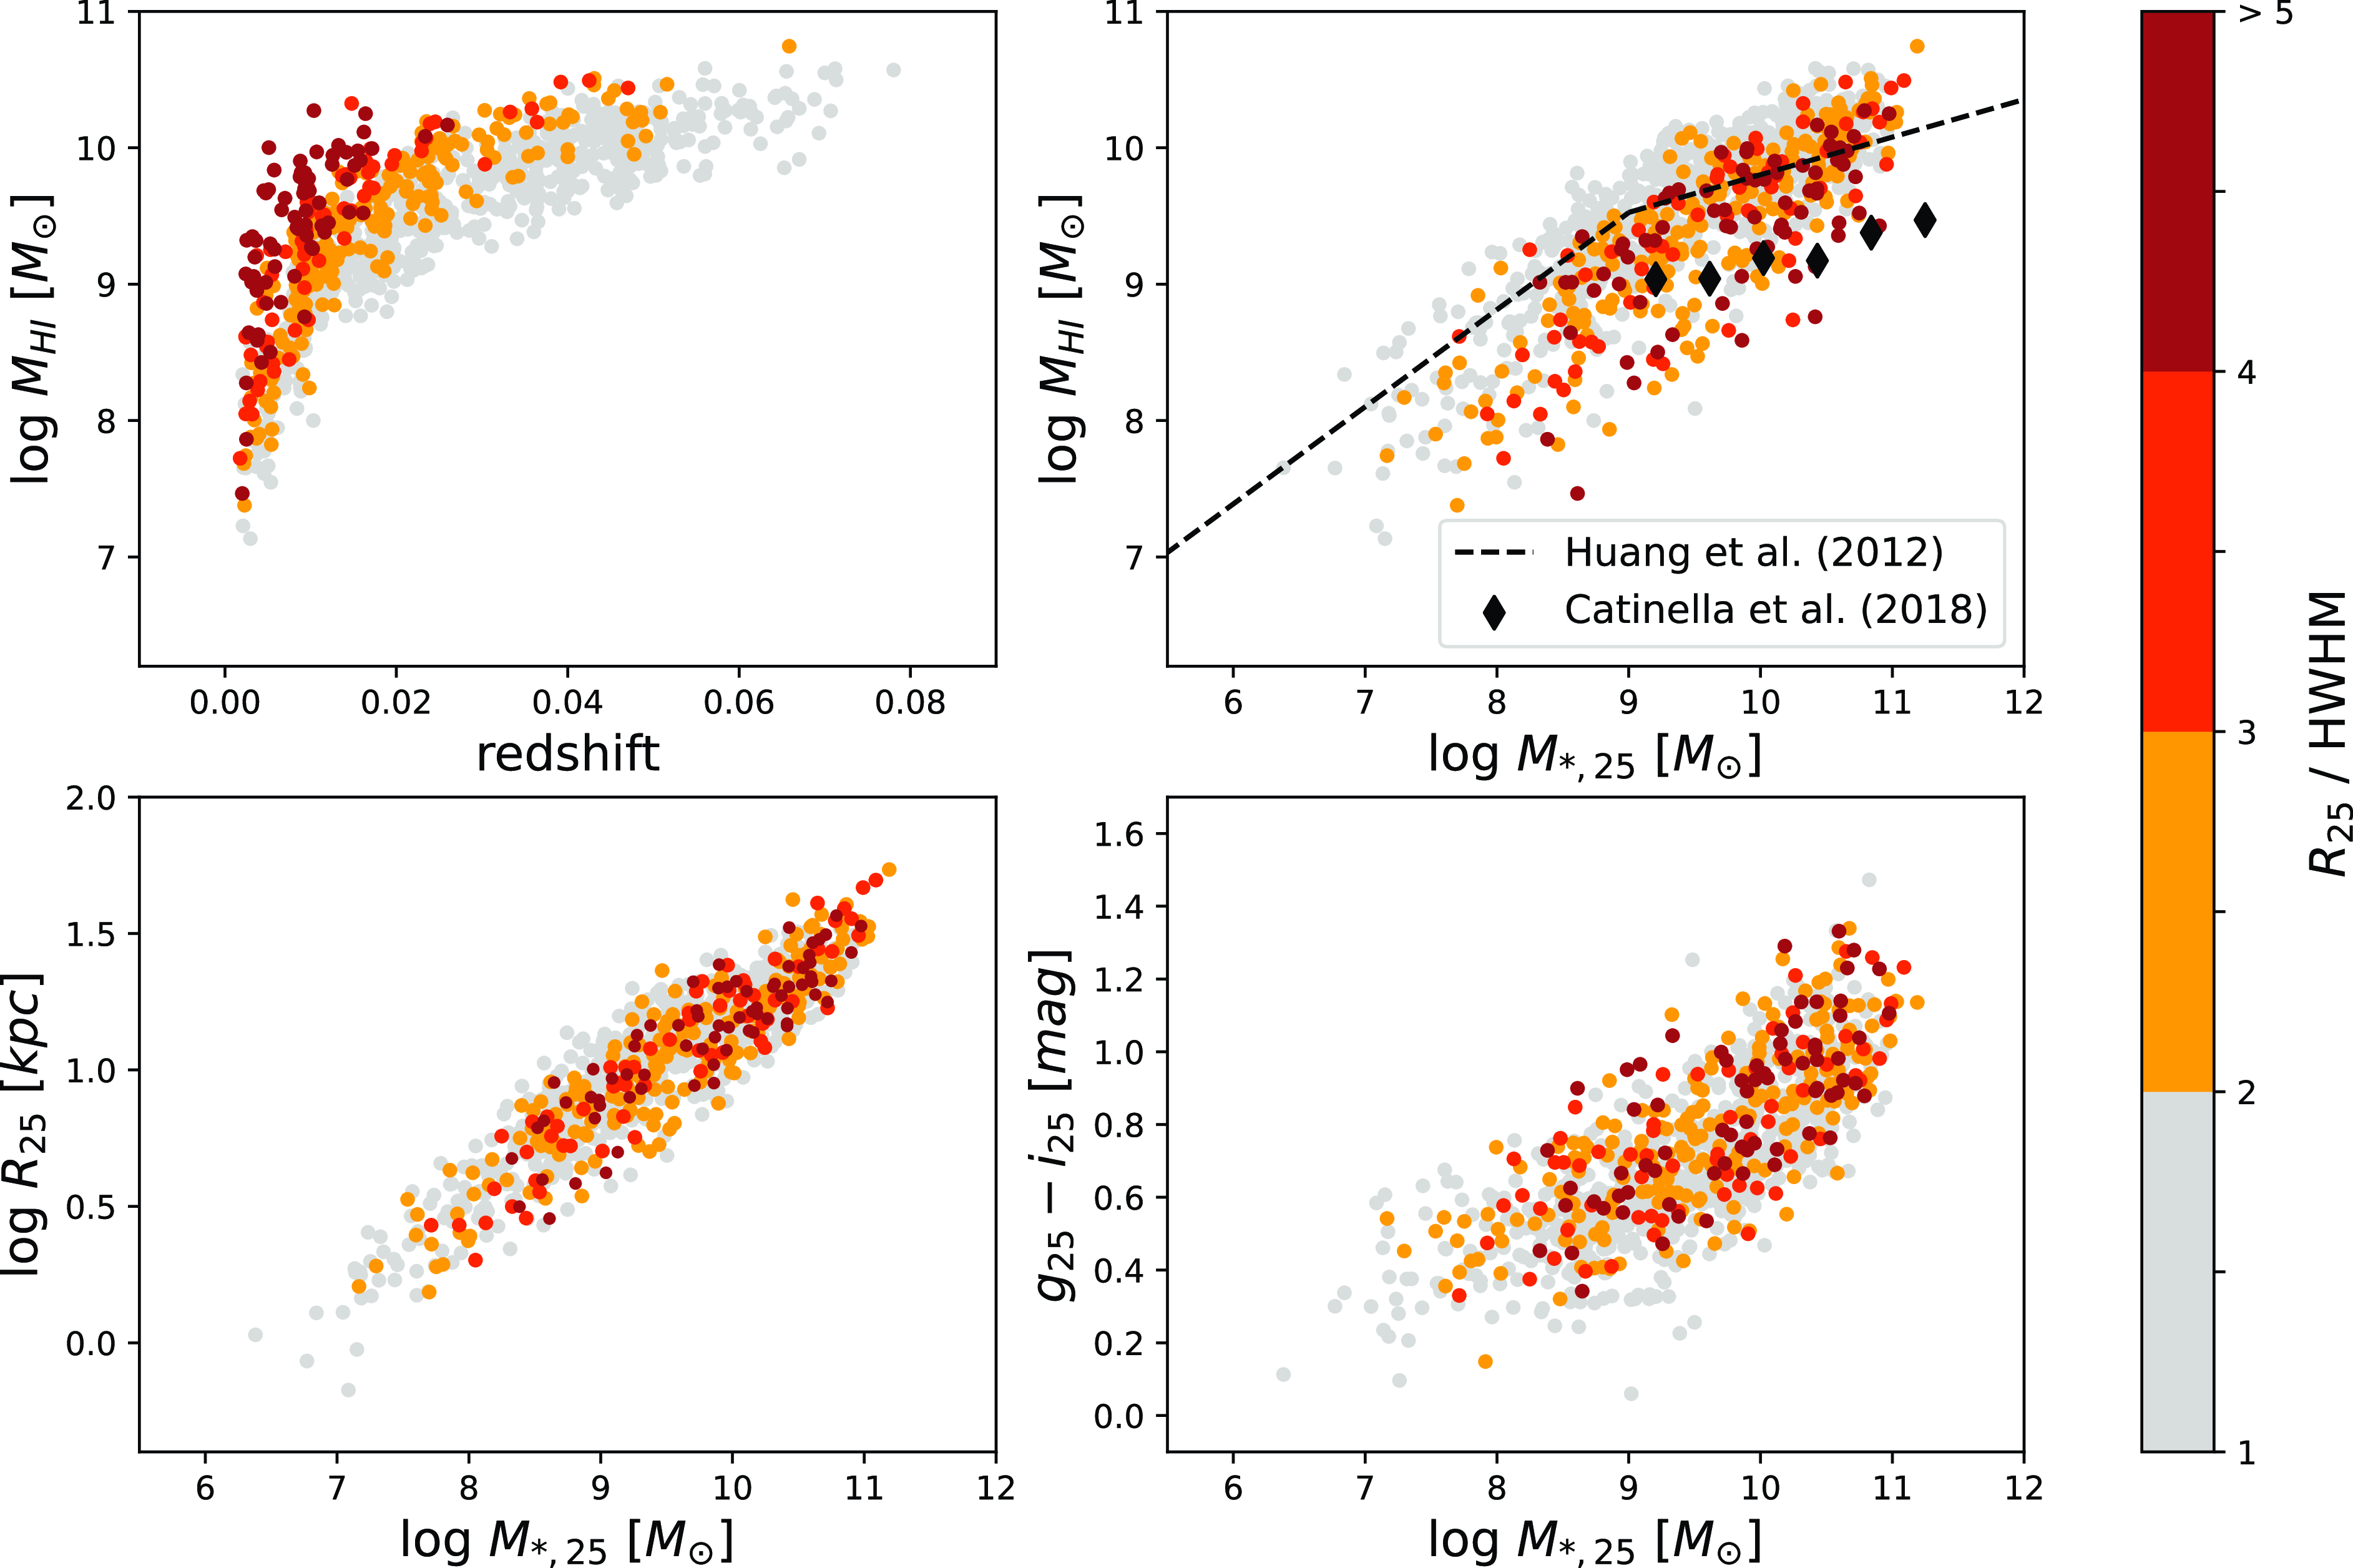
Histograms of Hi mass enclosed within $R_{\text{HI}}$
(a),
$R_{\text{HI}}$
(a), $R_{\text{25}}$
(b), and
$R_{\text{25}}$
(b), and $R_{\text{24}}$
(c) normalised by the total Hi mass. The bottom panels show the histograms of the average Hi surface densities within the same radii (d, e, and f). In all panels, grey and coloured distributions refer to full and higher-resolution samples, dashed lines indicate medians and whisker box plots show the median
$R_{\text{24}}$
(c) normalised by the total Hi mass. The bottom panels show the histograms of the average Hi surface densities within the same radii (d, e, and f). In all panels, grey and coloured distributions refer to full and higher-resolution samples, dashed lines indicate medians and whisker box plots show the median $\pm$
the interquartile range. Quantities involving
$\pm$
the interquartile range. Quantities involving $R_{\text{24}}$
are computed using the primary sample.
$R_{\text{24}}$
are computed using the primary sample.
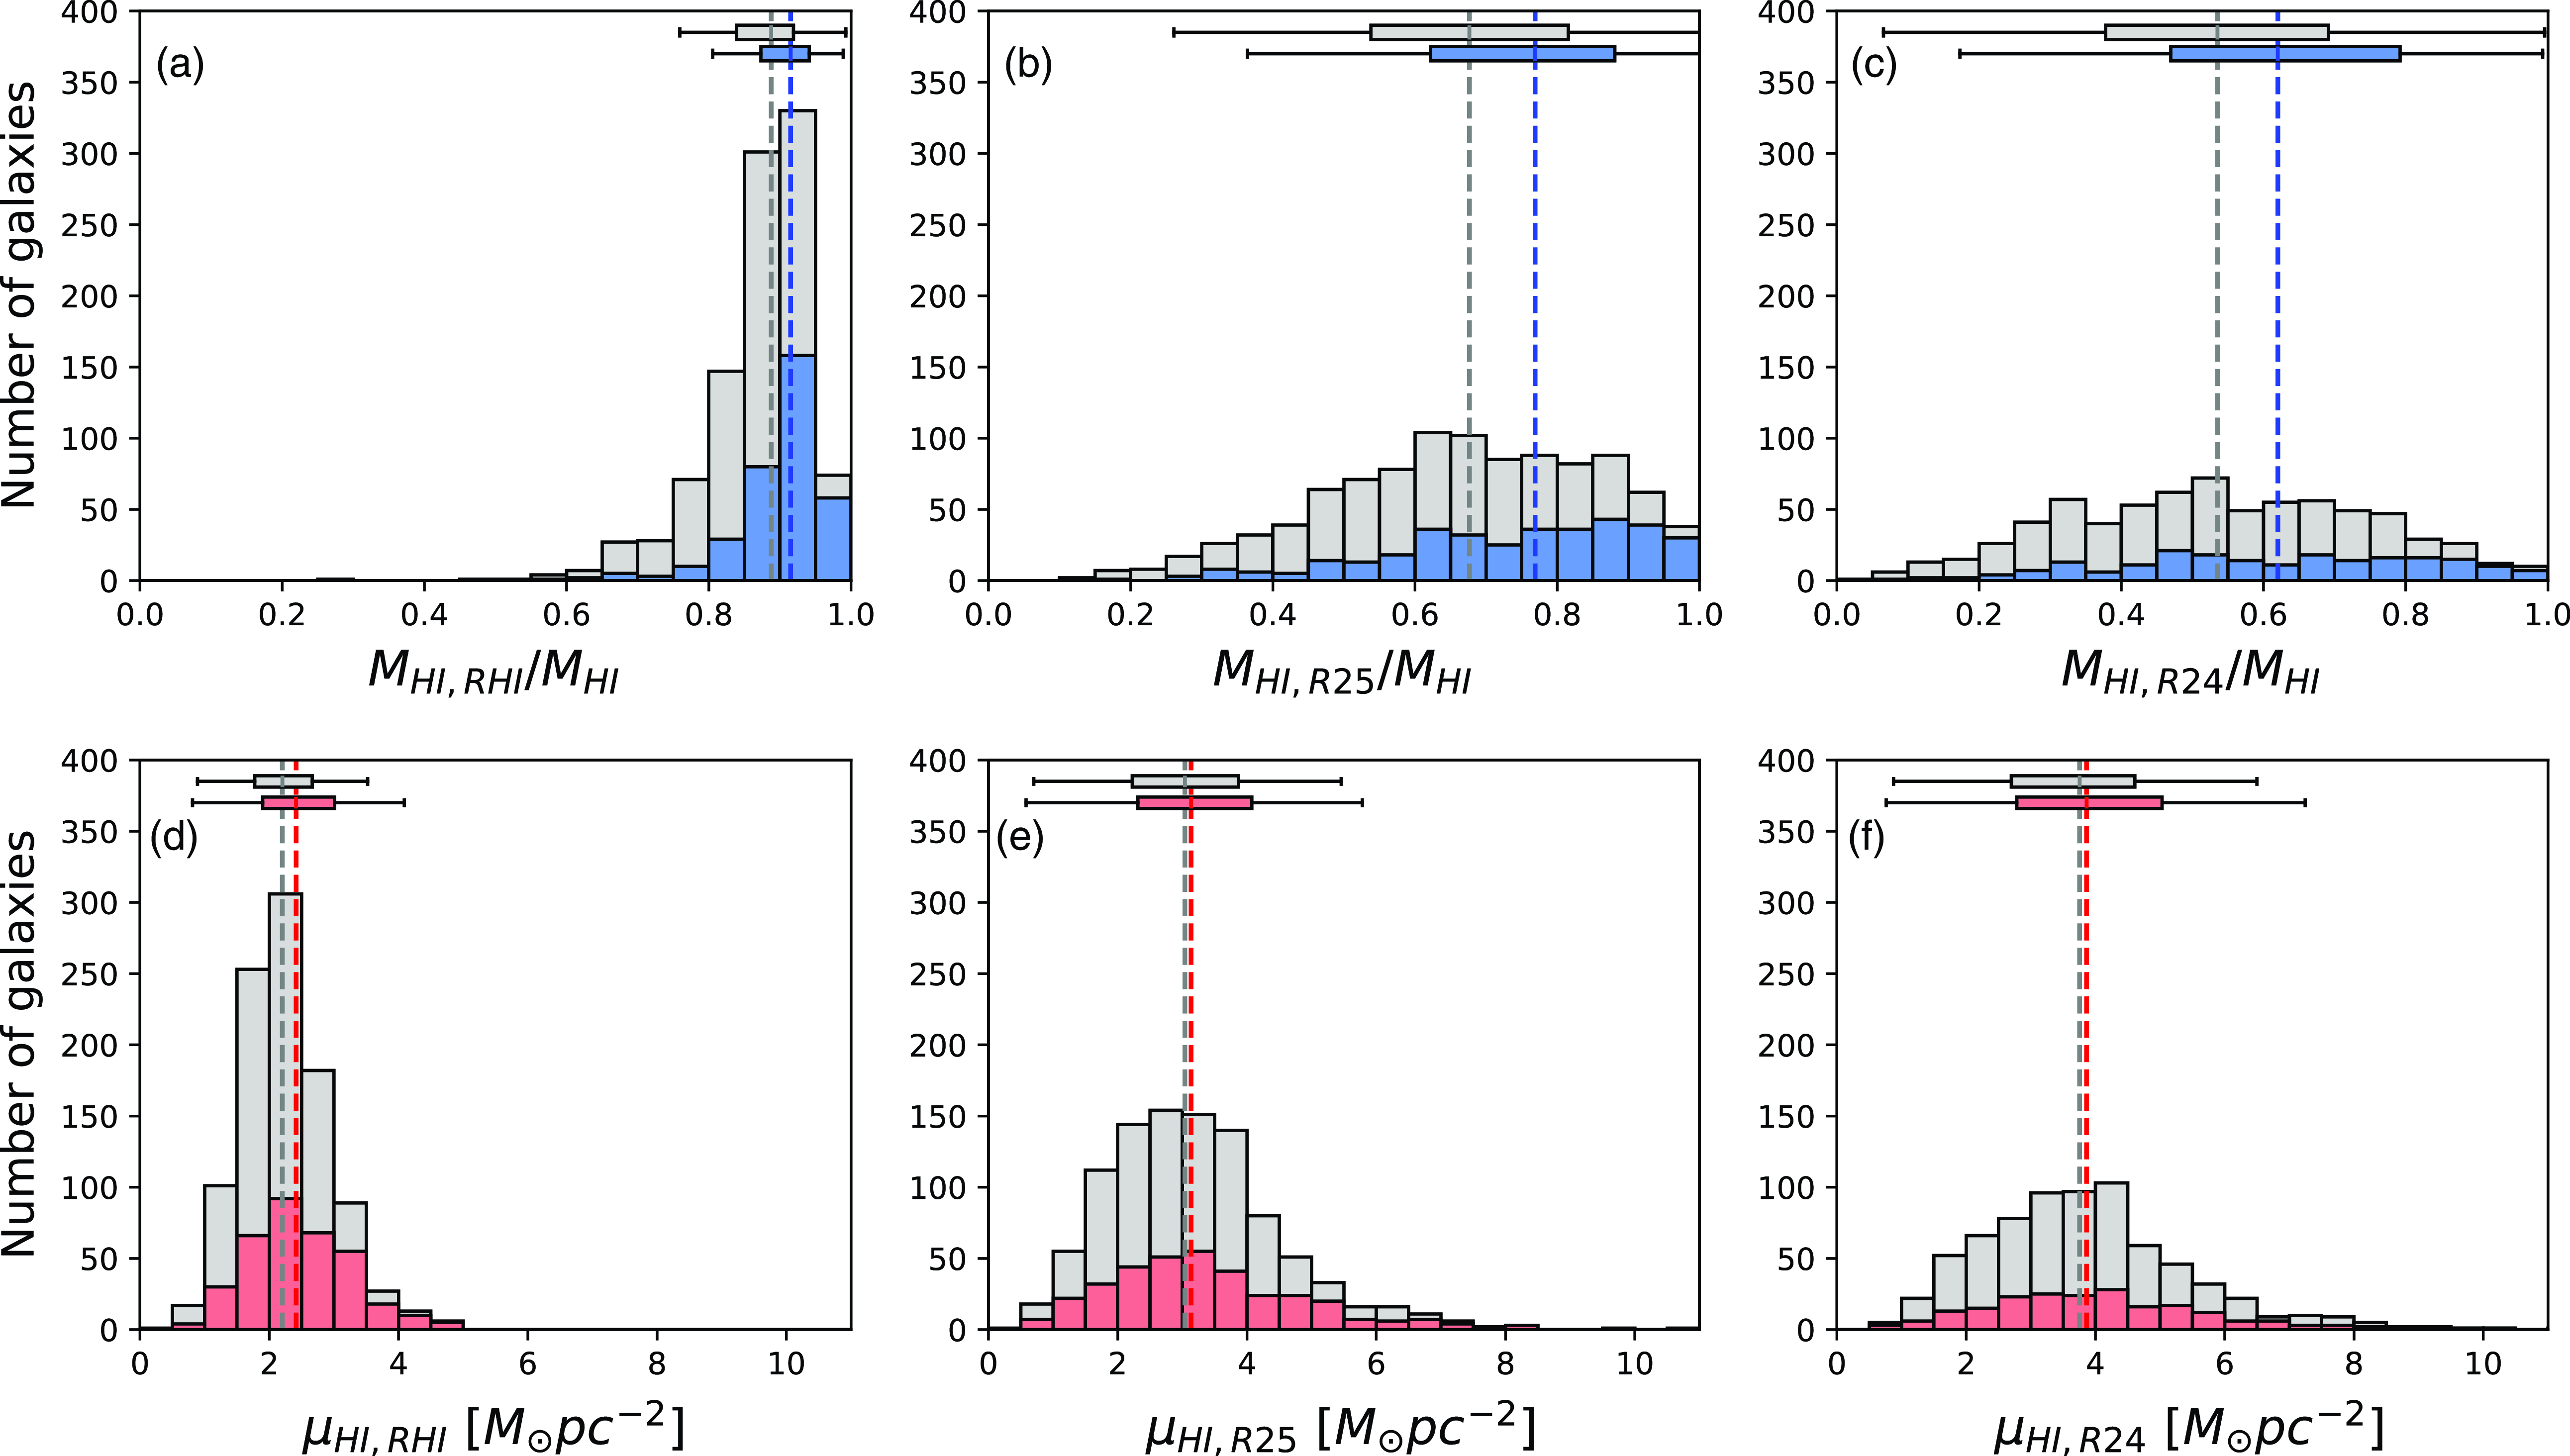
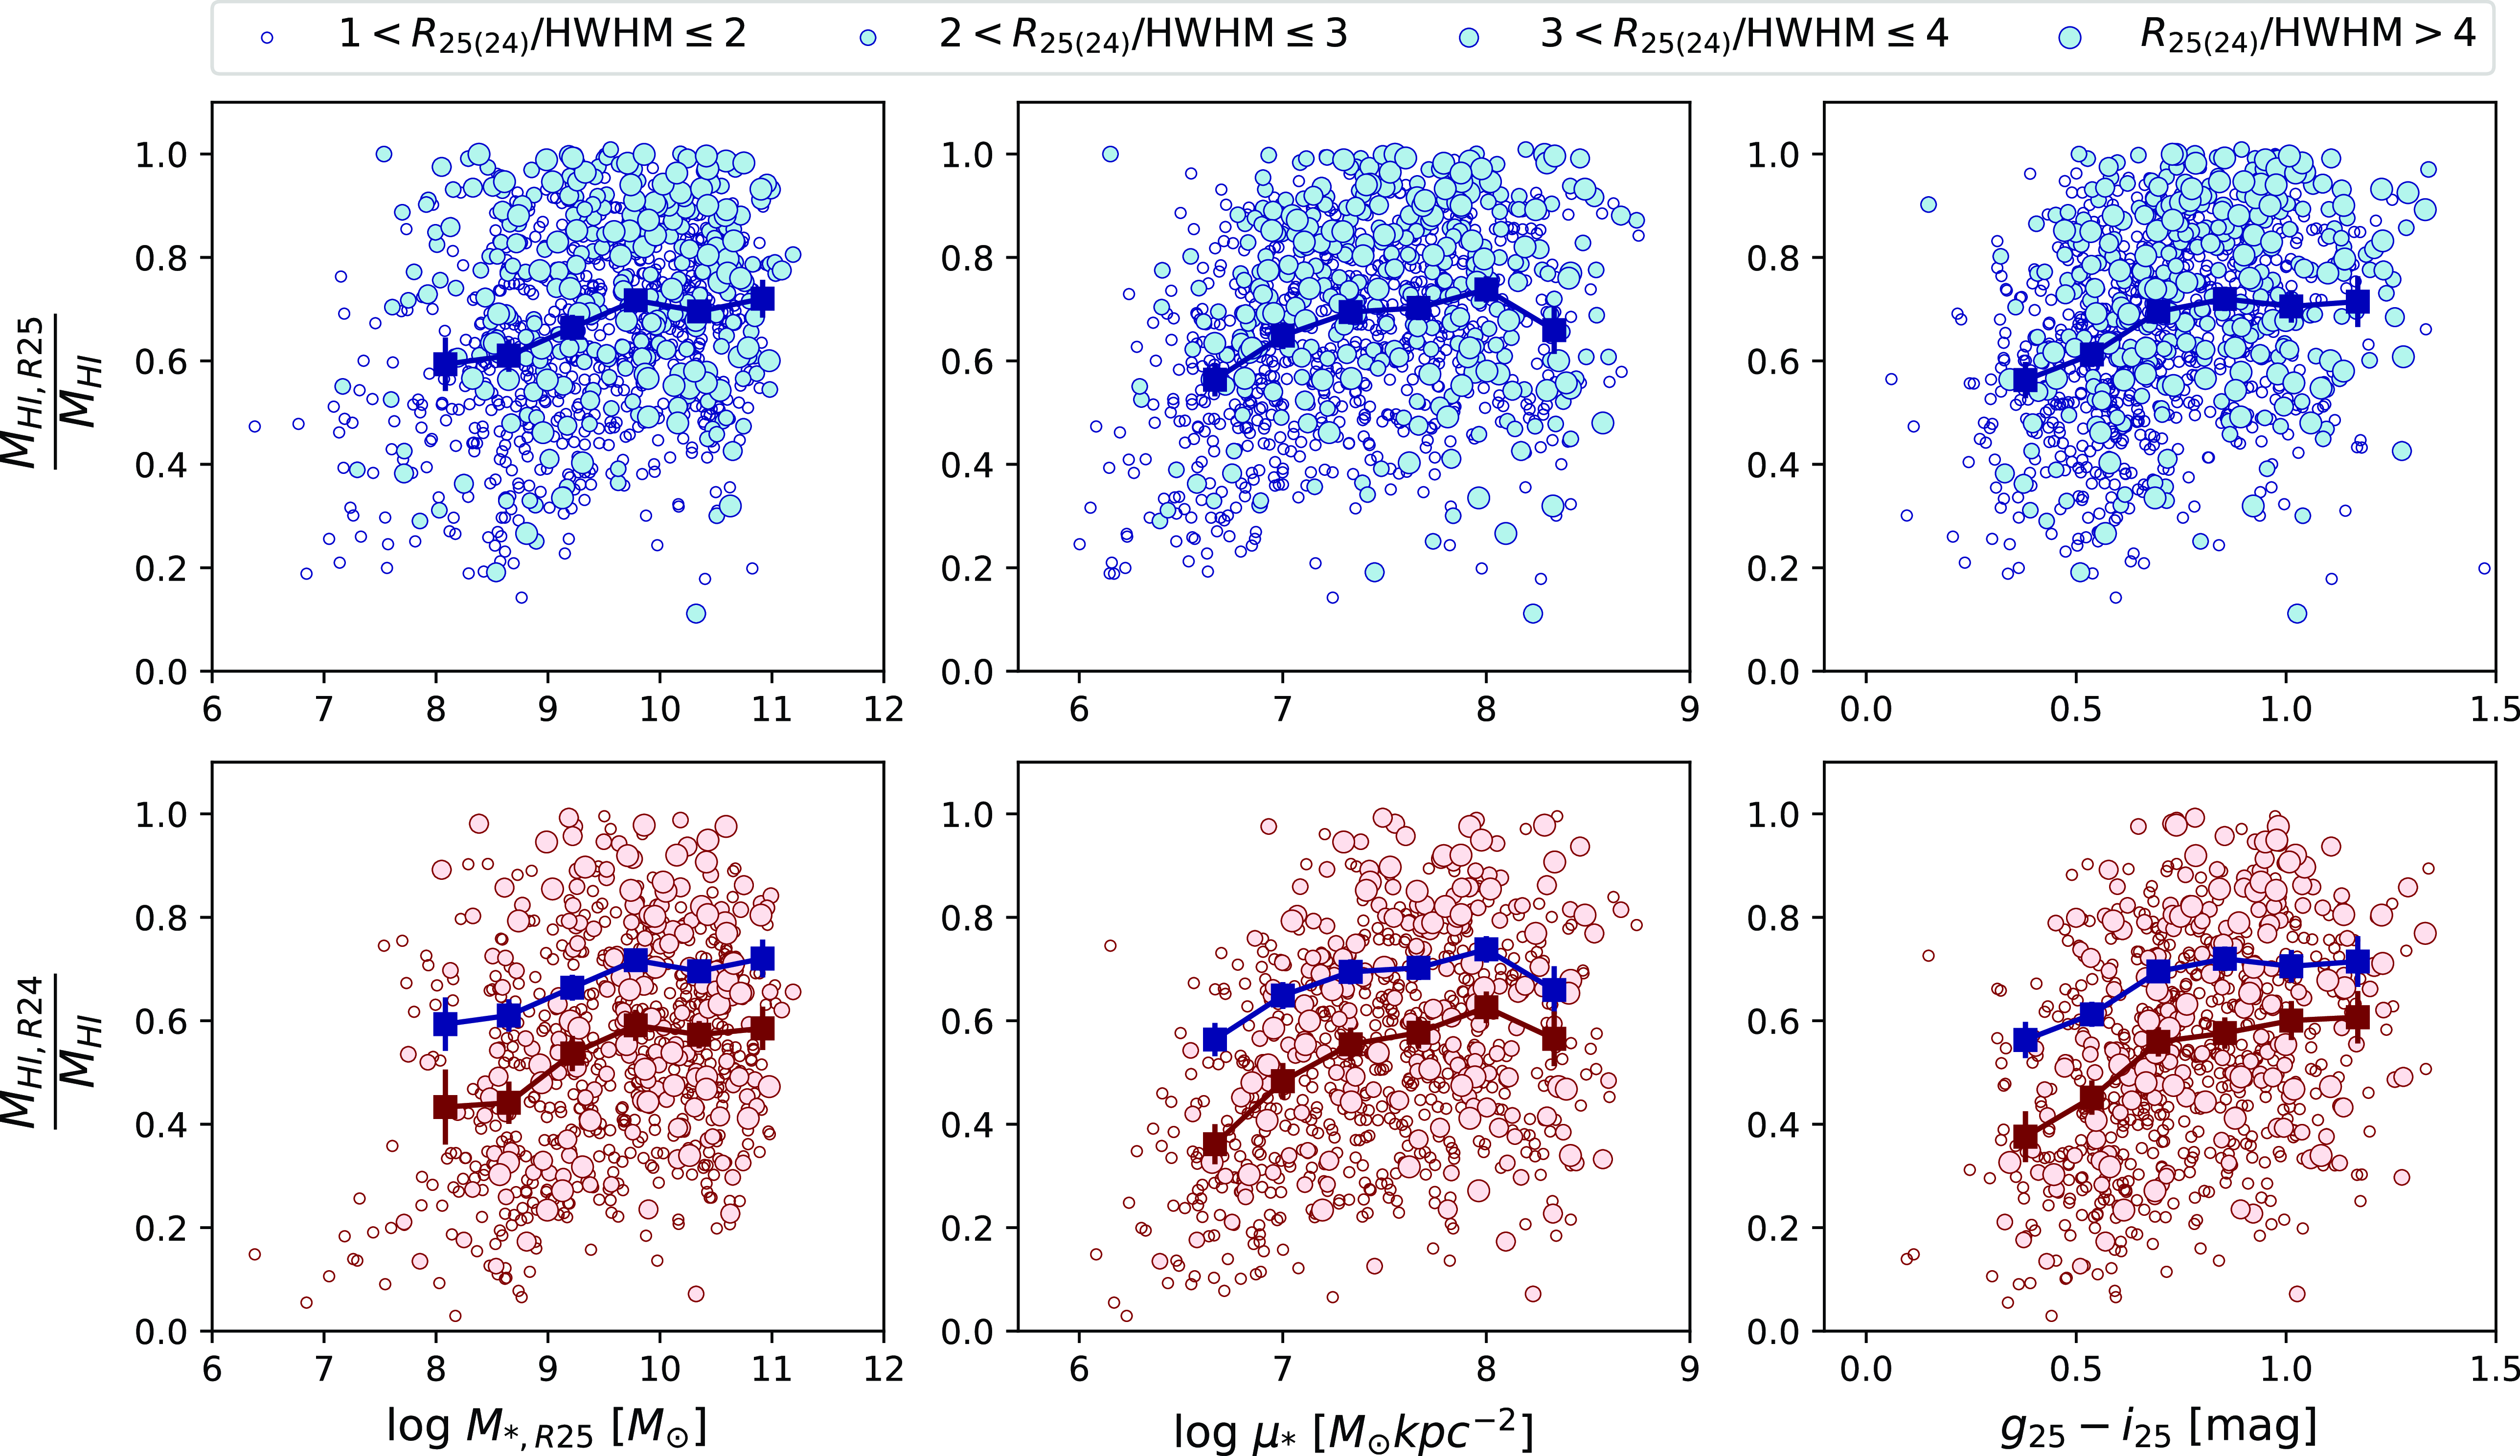
Scaling relations of the global Hi mass fraction (top row; $f_{\text{HI}}=M_{\text{HI}}/M_{\star}$
) and Hi mass fraction within
$f_{\text{HI}}=M_{\text{HI}}/M_{\star}$
) and Hi mass fraction within $R_{\text{25}}$
(middle row;
$R_{\text{25}}$
(middle row; $f_{\text{HI,R25}}=M_{\text{HI,R25}}/M_{\star,R25}$
) and
$f_{\text{HI,R25}}=M_{\text{HI,R25}}/M_{\star,R25}$
) and $R_{\text{24}}$
(bottom row;
$R_{\text{24}}$
(bottom row; $f_{\text{HI,R24}}=M_{\text{HI,R24}}/M_{\star,R24}$
) as a function of stellar mass (
$f_{\text{HI,R24}}=M_{\text{HI,R24}}/M_{\star,R24}$
) as a function of stellar mass ( $M_{ \star,R25}$
), stellar mass surface density (
$M_{ \star,R25}$
), stellar mass surface density ( $\mu_{\star}$
), and
$\mu_{\star}$
), and $g_{\text{25}}-i_{\text{25}}$
colour (columns from left to right, respectively) for the parent (top and middle rows) or primary samples (bottom row). The black squares represent the average of logs in each bin, with error bars indicating the standard error of the mean, which is smaller than the symbol size. The grey squares in the top row are replotted in the middle and bottom rows for comparison. The dotted lines show the linear regression fits and the scatter (i.e. the standard deviation along the y-axis from each fitted line) is shown in the top right corner of each panel. The scatter for the primary sample is provided in brackets. Galaxies are colour-coded as in Fig. 2, but resolutions are defined based on
$g_{\text{25}}-i_{\text{25}}$
colour (columns from left to right, respectively) for the parent (top and middle rows) or primary samples (bottom row). The black squares represent the average of logs in each bin, with error bars indicating the standard error of the mean, which is smaller than the symbol size. The grey squares in the top row are replotted in the middle and bottom rows for comparison. The dotted lines show the linear regression fits and the scatter (i.e. the standard deviation along the y-axis from each fitted line) is shown in the top right corner of each panel. The scatter for the primary sample is provided in brackets. Galaxies are colour-coded as in Fig. 2, but resolutions are defined based on $R_{\text{25}}$
for
$R_{\text{25}}$
for $f_{\text{HI}}$
and
$f_{\text{HI}}$
and $f_{\text{HI,R25}}$
(top and middle rows) and
$f_{\text{HI,R25}}$
(top and middle rows) and $R_{\text{24}}$
for
$R_{\text{24}}$
for $f_{\text{HI,R24}}$
(bottom row).
$f_{\text{HI,R24}}$
(bottom row).
Panel (a) shows that the fraction of the total Hi mass enclosed within $R_{\text{HI}}$
varies mostly from 0.8 to 1.0, with medians of 0.89 and 0.92 for the full and higher-resolution samples, respectively. This indicates that nearly 90% of the Hi has an (inclination uncorrected) average Hi surface density above 1 M
$R_{\text{HI}}$
varies mostly from 0.8 to 1.0, with medians of 0.89 and 0.92 for the full and higher-resolution samples, respectively. This indicates that nearly 90% of the Hi has an (inclination uncorrected) average Hi surface density above 1 M $_{\odot}$
pc
$_{\odot}$
pc $^{-2}$
. Galaxies with low fractions of Hi mass within
$^{-2}$
. Galaxies with low fractions of Hi mass within $R_{\text{HI}}$
possibly have disturbed Hi discs. Panels (b) and (c) reveal that the Hi content within the stellar disc is more broadly distributed than that within the Hi disc. On average, 68% of the Hi resides within
$R_{\text{HI}}$
possibly have disturbed Hi discs. Panels (b) and (c) reveal that the Hi content within the stellar disc is more broadly distributed than that within the Hi disc. On average, 68% of the Hi resides within $R_{\text{25}}$
(with individual variation from
$R_{\text{25}}$
(with individual variation from $\sim$
20% to 100%) and 54% within
$\sim$
20% to 100%) and 54% within $R_{\text{24}}$
(spanning a range from
$R_{\text{24}}$
(spanning a range from $\sim$
5% to 100%).
$\sim$
5% to 100%).
The bottom row of Fig. 3 presents the distributions of the average Hi surface density ( $\mu_{\text{HI}}$
) within the Hi and stellar discs. Comparing panels (d), (e), and (f) shows that the average Hi surface density within
$\mu_{\text{HI}}$
) within the Hi and stellar discs. Comparing panels (d), (e), and (f) shows that the average Hi surface density within $R_{\text{25}}$
and
$R_{\text{25}}$
and $R_{\text{24}}$
has a higher median value and a broader distribution than that within
$R_{\text{24}}$
has a higher median value and a broader distribution than that within $R_{\text{HI}}$
(for instance, the Kolmogorov–Smirnov test statistic between the grey distributions in panels d and e is 0.4). The median values of
$R_{\text{HI}}$
(for instance, the Kolmogorov–Smirnov test statistic between the grey distributions in panels d and e is 0.4). The median values of $\mu_{\text{HI}}$
within
$\mu_{\text{HI}}$
within $R_{\text{HI}}$
,
$R_{\text{HI}}$
, $R_{\text{25}}$
, and
$R_{\text{25}}$
, and $R_{\text{24}}$
are 2.2, 3.0, and 3.7
$R_{\text{24}}$
are 2.2, 3.0, and 3.7 $\text{M}_\odot\ pc^{-2}$
, respectively, for the full sample (grey). The distributions of
$\text{M}_\odot\ pc^{-2}$
, respectively, for the full sample (grey). The distributions of $\mu_{\text{HI}}$
within
$\mu_{\text{HI}}$
within $R_{\text{25}}$
and
$R_{\text{25}}$
and $R_{\text{24}}$
extend from 1 to
$R_{\text{24}}$
extend from 1 to $\sim$
6
$\sim$
6 $\text{M}_\odot$
pc
$\text{M}_\odot$
pc $^{-2}$
for the most part, whereas
$^{-2}$
for the most part, whereas $\mu_{\text{HI,RHI}}$
ranges mostly between 1 and
$\mu_{\text{HI,RHI}}$
ranges mostly between 1 and $\sim$
4
$\sim$
4 $\text{M}_\odot$
pc
$\text{M}_\odot$
pc $^{-2}$
. Few galaxies have average Hi surface density within
$^{-2}$
. Few galaxies have average Hi surface density within $R_{\text{25}}$
or
$R_{\text{25}}$
or $R_{\text{24}}$
greater than 9 M
$R_{\text{24}}$
greater than 9 M $_{\odot}$
pc
$_{\odot}$
pc $^{-2}$
, which is the approximate threshold where the conversion from atomic to molecular gas is known to occur (e.g. Martin & Kennicutt Reference Martin and Kennicutt2001; Bigiel et al. Reference Bigiel2008).
$^{-2}$
, which is the approximate threshold where the conversion from atomic to molecular gas is known to occur (e.g. Martin & Kennicutt Reference Martin and Kennicutt2001; Bigiel et al. Reference Bigiel2008).
In summary, we confirm the prominent variations of Hi properties within the stellar disc compared to global Hi properties using WALLABY galaxies, which has been suggested in previous studies (e.g. Leroy et al. Reference Leroy2008; Wang et al. Reference Wang2014; Eibensteiner et al. Reference Eibensteiner2024) but is now confirmed with a statistical number of galaxies. We investigate the causes for these broad variations in the following sections.
5.2. Hi scaling relations restricted to $R_{\text{25}}$
and
$R_{\text{24}}$
$R_{\text{25}}$
and
$R_{\text{24}}$


We examine here the impact of excluding the outer Hi regions on gas mass fraction scaling relations. Fig. 4 shows the relation between the Hi mass fraction and various stellar properties: stellar mass ( $M_{\star,R25}$
), stellar surface density (
$M_{\star,R25}$
), stellar surface density ( $\mu_{\star}$
), and optical colour (
$\mu_{\star}$
), and optical colour ( $g_{\text{25}}-i_{\text{25}}$
), comparing the global Hi mass fraction (
$g_{\text{25}}-i_{\text{25}}$
), comparing the global Hi mass fraction ( $f_{\text{HI}}$
; top row) and Hi mass fraction confined to
$f_{\text{HI}}$
; top row) and Hi mass fraction confined to $R_{\text{25}}$
(
$R_{\text{25}}$
( $f_{\text{HI,R25}}$
; middle row) and
$f_{\text{HI,R25}}$
; middle row) and $R_{\text{24}}$
(
$R_{\text{24}}$
( $f_{\text{HI,R24}}$
; bottom row). Note that we present the scaling relations as a function of
$f_{\text{HI,R24}}$
; bottom row). Note that we present the scaling relations as a function of $R_{\text{25}}$
-related stellar properties (e.g.
$R_{\text{25}}$
-related stellar properties (e.g. $M_{\star,R25}$
and
$M_{\star,R25}$
and $g_{\text{25}}-i_{\text{25}}$
) for convenience, but using
$g_{\text{25}}-i_{\text{25}}$
) for convenience, but using $R_{\text{24}}$
-related properties does not alter the results significantly. Squares represent the average of the logarithm of the Hi mass fraction, ensuring a minimum of 10 galaxies per bin. Error bars indicate the standard error of the mean but are smaller than the symbol size. Linear regression fits are included as dotted lines and the scatter (i.e. the standard deviation of the logarithm of the Hi mass fraction from the fit) is noted in the top-right corner of each panel. Table 1 provides details of the linear fit parameters, scatter, and the Pearson coefficient (
$R_{\text{24}}$
-related properties does not alter the results significantly. Squares represent the average of the logarithm of the Hi mass fraction, ensuring a minimum of 10 galaxies per bin. Error bars indicate the standard error of the mean but are smaller than the symbol size. Linear regression fits are included as dotted lines and the scatter (i.e. the standard deviation of the logarithm of the Hi mass fraction from the fit) is noted in the top-right corner of each panel. Table 1 provides details of the linear fit parameters, scatter, and the Pearson coefficient ( $\varrho$
). As in Fig. 2, galaxies are colour-coded by the number of beams along the stellar major axis, i.e.
$\varrho$
). As in Fig. 2, galaxies are colour-coded by the number of beams along the stellar major axis, i.e. $R_{\text{25}}/15$
" (
$R_{\text{25}}/15$
" ( $R_{\text{24}}/15$
" for
$R_{\text{24}}/15$
" for $f_{\text{HI,R24}}$
scaling relations), from grey to darker shades.
$f_{\text{HI,R24}}$
scaling relations), from grey to darker shades.
The global $f_{\text{HI}}$
scaling relations (top row) show the well-known trends of decreasing gas mass fraction for galaxies with higher stellar mass, higher stellar surface density, and redder colours. The trends do not change depending on the samples. The marginally resolved galaxies (grey dots) tend to have higher
$f_{\text{HI}}$
scaling relations (top row) show the well-known trends of decreasing gas mass fraction for galaxies with higher stellar mass, higher stellar surface density, and redder colours. The trends do not change depending on the samples. The marginally resolved galaxies (grey dots) tend to have higher $f_{\text{HI}}$
compared to better resolved ones (coloured dots) because they tend to be Hi-rich galaxies detected at high redshift (see Fig. 2).
$f_{\text{HI}}$
compared to better resolved ones (coloured dots) because they tend to be Hi-rich galaxies detected at high redshift (see Fig. 2).
The $f_{\text{HI,R25}}$
and
$f_{\text{HI,R25}}$
and $f_{\text{HI,R24}}$
scaling relations (middle and bottom rows, respectively) demonstrate trends similar to those of
$f_{\text{HI,R24}}$
scaling relations (middle and bottom rows, respectively) demonstrate trends similar to those of $f_{\text{HI}}$
, but with systematically lower Hi mass fractions. The
$f_{\text{HI}}$
, but with systematically lower Hi mass fractions. The $f_{\text{HI,R24}}$
scaling relations are highly similar to those of
$f_{\text{HI,R24}}$
scaling relations are highly similar to those of $f_{\text{HI,R25}}$
, but
$f_{\text{HI,R25}}$
, but $f_{\text{HI,R24}}$
has slightly lower Hi mass fractions because of their smaller Hi mass enclosed within
$f_{\text{HI,R24}}$
has slightly lower Hi mass fractions because of their smaller Hi mass enclosed within $R_{\text{24}}$
compared to
$R_{\text{24}}$
compared to $R_{\text{25}}$
. The differences between the average
$R_{\text{25}}$
. The differences between the average $f_{\text{HI}}$
(grey squares) and
$f_{\text{HI}}$
(grey squares) and $f_{\text{HI,R25}}$
(black squares in the middle panel) are consistent across the range of stellar properties (0.1–0.2 dex). Interestingly, compared to the global quantities, the
$f_{\text{HI,R25}}$
(black squares in the middle panel) are consistent across the range of stellar properties (0.1–0.2 dex). Interestingly, compared to the global quantities, the $f_{\text{HI,R25}}$
scaling relations show tighter correlations with decreased scatter (which is higher than its standard error) and higher (absolute) values of the Pearson coefficient for all stellar properties, but there is no further improvement when moving to
$f_{\text{HI,R25}}$
scaling relations show tighter correlations with decreased scatter (which is higher than its standard error) and higher (absolute) values of the Pearson coefficient for all stellar properties, but there is no further improvement when moving to $f_{\text{HI,R24}}$
. In particular,
$f_{\text{HI,R24}}$
. In particular, $f_{\text{HI,R25}}$
shows the strongest correlation and the largest decrease of scatter when plotted as a function of the stellar surface density (
$f_{\text{HI,R25}}$
shows the strongest correlation and the largest decrease of scatter when plotted as a function of the stellar surface density ( $\varrho = -0.87$
and
$\varrho = -0.87$
and $\Delta \sigma = 0.05$
). The higher-resolution subset shows similar trends, i.e. decreased scatter for
$\Delta \sigma = 0.05$
). The higher-resolution subset shows similar trends, i.e. decreased scatter for $f_{\text{HI,R25}}$
by 0.04, 0.06, and 0.03 for the stellar mass, stellar surface density, and colour, respectively, indicating that the trend is not significantly affected by either resolution or sample selection. The reduced scatter for all stellar properties suggests that the Hi mass fraction within the stellar disc is more strongly related to stellar properties than the global Hi mass fraction, which implies that examining Hi within stellar discs offers a clearer understanding of the relationship between Hi content and stellar properties.
$f_{\text{HI,R25}}$
by 0.04, 0.06, and 0.03 for the stellar mass, stellar surface density, and colour, respectively, indicating that the trend is not significantly affected by either resolution or sample selection. The reduced scatter for all stellar properties suggests that the Hi mass fraction within the stellar disc is more strongly related to stellar properties than the global Hi mass fraction, which implies that examining Hi within stellar discs offers a clearer understanding of the relationship between Hi content and stellar properties.
5.3. Hi mass and surface density within the stellar disc
In order to gain insights into what drives the decrease in scatter of the Hi scaling relations shown in Fig. 4, as well as the large variations in the fraction of total Hi mass and Hi surface density within $R_{\text{25}}$
and
$R_{\text{25}}$
and $R_{\text{24}}$
observed in Fig. 3, we now explore how these quantities depend on stellar properties.
$R_{\text{24}}$
observed in Fig. 3, we now explore how these quantities depend on stellar properties.
The Hi mass within $R_{\text{25}}$
(top row) and
$R_{\text{25}}$
(top row) and $R_{\text{24}}$
(bottom row) normalised by the total Hi mass is plotted as a function of stellar mass (
$R_{\text{24}}$
(bottom row) normalised by the total Hi mass is plotted as a function of stellar mass ( $M_{\star,R25}$
), stellar mass surface density (
$M_{\star,R25}$
), stellar mass surface density ( $\mu_{\star}$
), and
$\mu_{\star}$
), and $g_{\text{25}}-i_{\text{25}}$
colour (columns from left to right, respectively). Galaxies with stellar disc major axes between 1 and 2 beams (1 <
$g_{\text{25}}-i_{\text{25}}$
colour (columns from left to right, respectively). Galaxies with stellar disc major axes between 1 and 2 beams (1 < $R_{\text{25(24)}}$
/HWHM < 2) are shown as empty circles, while better resolved galaxies are indicated with larger filled circles. Resolutions are defined based on
$R_{\text{25(24)}}$
/HWHM < 2) are shown as empty circles, while better resolved galaxies are indicated with larger filled circles. Resolutions are defined based on $R_{\text{25}}$
for
$R_{\text{25}}$
for $M_{\text{HI,R25}}/M_{\text{HI}}$
(top row) and
$M_{\text{HI,R25}}/M_{\text{HI}}$
(top row) and $R_{\text{24}}$
for
$R_{\text{24}}$
for $M_{\text{HI,R24}}/M_{\text{HI}}$
(bottom row). The binned means are represented as squares with error bars that show the standard error of the mean. The means in the top row are replotted as the blue squares in the bottom row for comparison.
$M_{\text{HI,R24}}/M_{\text{HI}}$
(bottom row). The binned means are represented as squares with error bars that show the standard error of the mean. The means in the top row are replotted as the blue squares in the bottom row for comparison.
Parameters of the linear least-squares regression fits ( $y=ax+b$
), the scatter (
$y=ax+b$
), the scatter ( $\sigma$
), and Pearson correlation coefficients (
$\sigma$
), and Pearson correlation coefficients ( $\varrho$
) for the scaling relations of the global Hi mass fraction (
$\varrho$
) for the scaling relations of the global Hi mass fraction ( $f_{\text{HI}}$
) and Hi mass fraction within
$f_{\text{HI}}$
) and Hi mass fraction within $R_{\text{25}}$
(
$R_{\text{25}}$
( $f_{\text{HI,R25}}$
) for the parent sample and
$f_{\text{HI,R25}}$
) for the parent sample and $R_{\text{24}}$
(
$R_{\text{24}}$
( $f_{\text{HI,R24}}$
) for the primary sample (see Fig. 4). The
$f_{\text{HI,R24}}$
) for the primary sample (see Fig. 4). The $\sigma$
and
$\sigma$
and $\varrho$
for
$\varrho$
for $f_{\text{HI,R25}}$
for the primary sample are provided in brackets. The p-value of each Pearson correlation is close to zero.
$f_{\text{HI,R25}}$
for the primary sample are provided in brackets. The p-value of each Pearson correlation is close to zero.
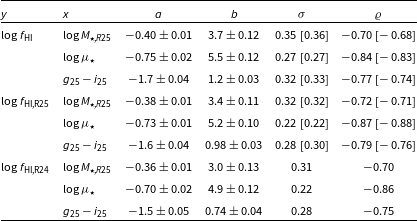
Fig. 5 shows the relation between the fraction of the total Hi mass enclosed within $R_{\text{25}}$
(top row) or
$R_{\text{25}}$
(top row) or $R_{\text{24}}$
(bottom row) plotted versus stellar mass, stellar surface density, and colour. Table 2 lists the Spearman coefficients (
$R_{\text{24}}$
(bottom row) plotted versus stellar mass, stellar surface density, and colour. Table 2 lists the Spearman coefficients ( $\varrho$
) for each stellar property. There are weak positive correlations between the fraction of Hi mass within
$\varrho$
) for each stellar property. There are weak positive correlations between the fraction of Hi mass within $R_{\text{25}}$
or
$R_{\text{25}}$
or $R_{\text{24}}$
and these stellar properties (
$R_{\text{24}}$
and these stellar properties ( $\varrho\sim 0.3$
), which are more pronounced in galaxies with lower stellar mass, lower stellar surface density, and bluer colours. The correlations are slightly stronger when
$\varrho\sim 0.3$
), which are more pronounced in galaxies with lower stellar mass, lower stellar surface density, and bluer colours. The correlations are slightly stronger when $M_{\text{HI}}$
is restricted to a smaller optical radius, i.e.,
$M_{\text{HI}}$
is restricted to a smaller optical radius, i.e., $R_{\text{24}}$
instead of
$R_{\text{24}}$
instead of $R_{\text{25}}$
(e.g. for the primary sample,
$R_{\text{25}}$
(e.g. for the primary sample, $\varrho$
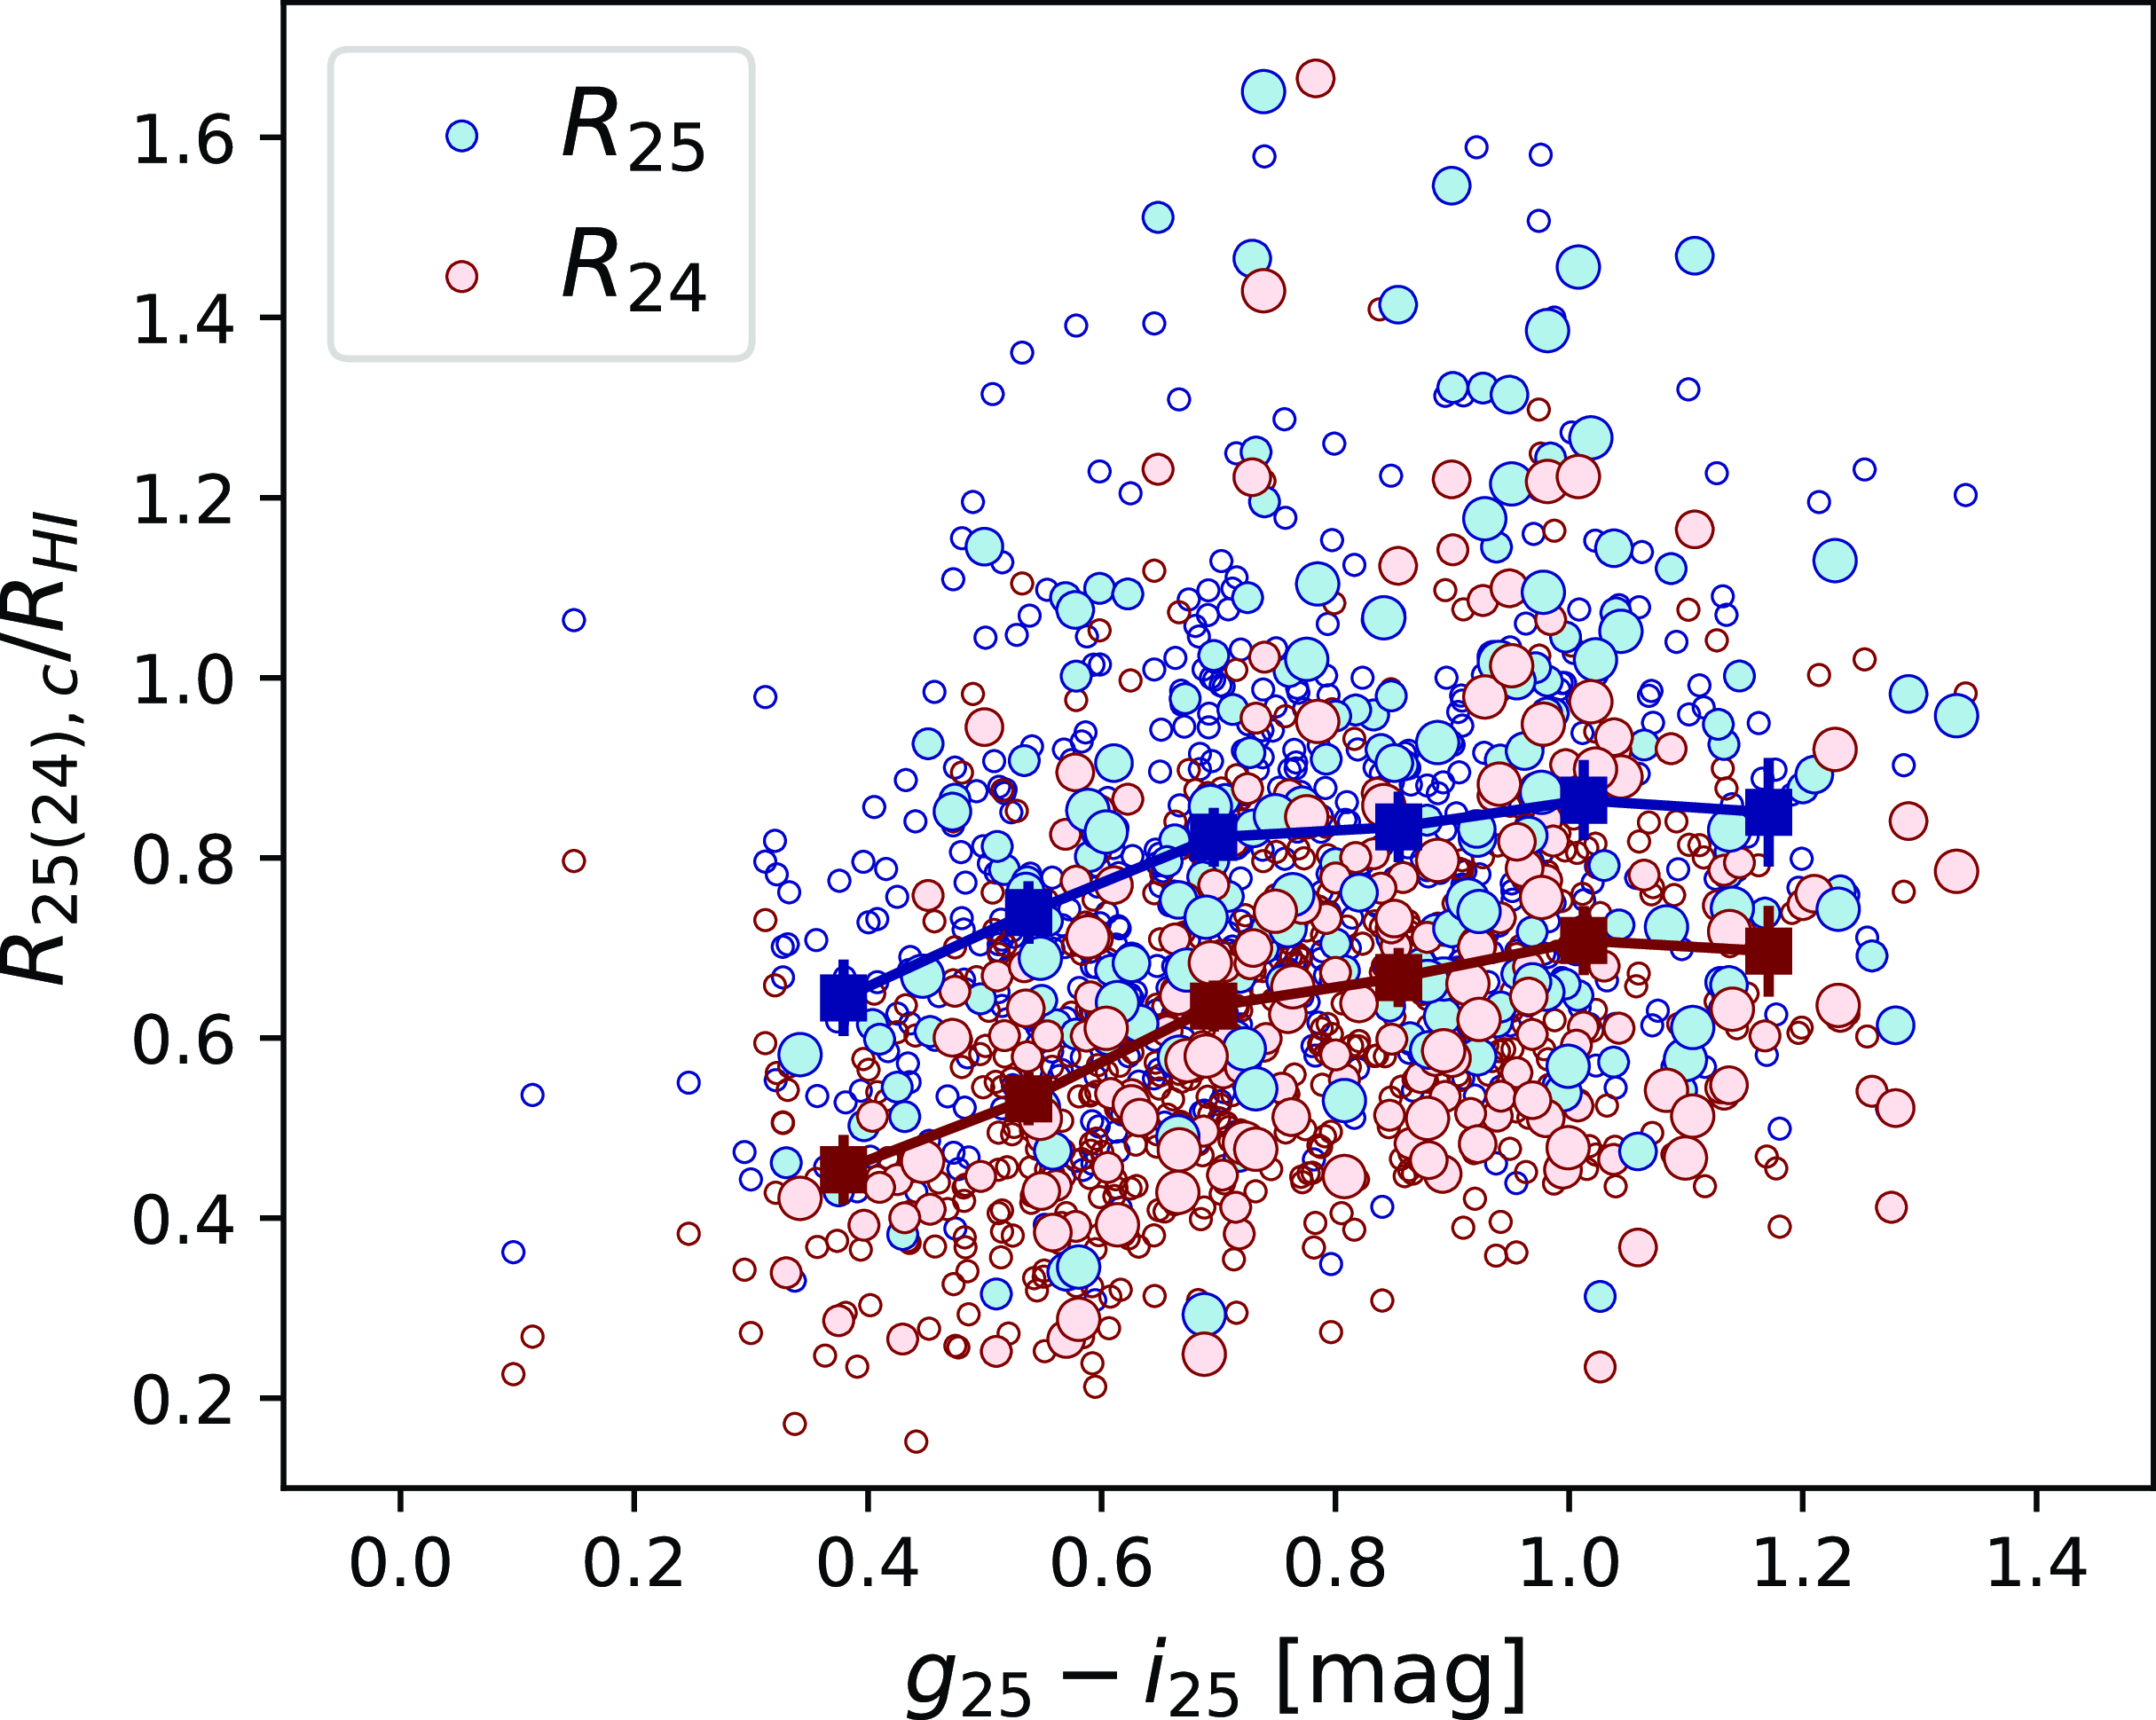
for colour increases from 0.19 to 0.33). The mild positive correlation with colour – strongest among the given stellar properties – suggests that bluer galaxies tend to have a smaller fraction of their Hi mass within their stellar discs. Given that Hi profiles typically exhibit exponential declines in their outer regions (e.g. Wang et al. Reference Wang2014; Wang et al. Reference Wang2025), this implies that bluer galaxies are likely to have more extended Hi discs relative to their stellar discs, a trend directly shown in Fig. 6. The
$\varrho$
for colour increases from 0.19 to 0.33). The mild positive correlation with colour – strongest among the given stellar properties – suggests that bluer galaxies tend to have a smaller fraction of their Hi mass within their stellar discs. Given that Hi profiles typically exhibit exponential declines in their outer regions (e.g. Wang et al. Reference Wang2014; Wang et al. Reference Wang2025), this implies that bluer galaxies are likely to have more extended Hi discs relative to their stellar discs, a trend directly shown in Fig. 6. The $R_{\text{25,c}}/R_{\text{HI}}$
values may appear higher than those reported in previous studies (e.g.
$R_{\text{25,c}}/R_{\text{HI}}$
values may appear higher than those reported in previous studies (e.g. $R_{\text{25}}/R_{\text{HI}}\sim$
0.5 in Wang et al. Reference Wang2013; Reynolds et al. Reference Reynolds2023), but this discrepancy is due to the use of
$R_{\text{25}}/R_{\text{HI}}\sim$
0.5 in Wang et al. Reference Wang2013; Reynolds et al. Reference Reynolds2023), but this discrepancy is due to the use of $R_{\text{25,c}}$
instead of
$R_{\text{25,c}}$
instead of $R_{\text{25}}$
, i.e., the median
$R_{\text{25}}$
, i.e., the median $R_{\text{25}}/R_{\text{HI}}$
is 0.54, consistent with the literature.
$R_{\text{25}}/R_{\text{HI}}$
is 0.54, consistent with the literature.
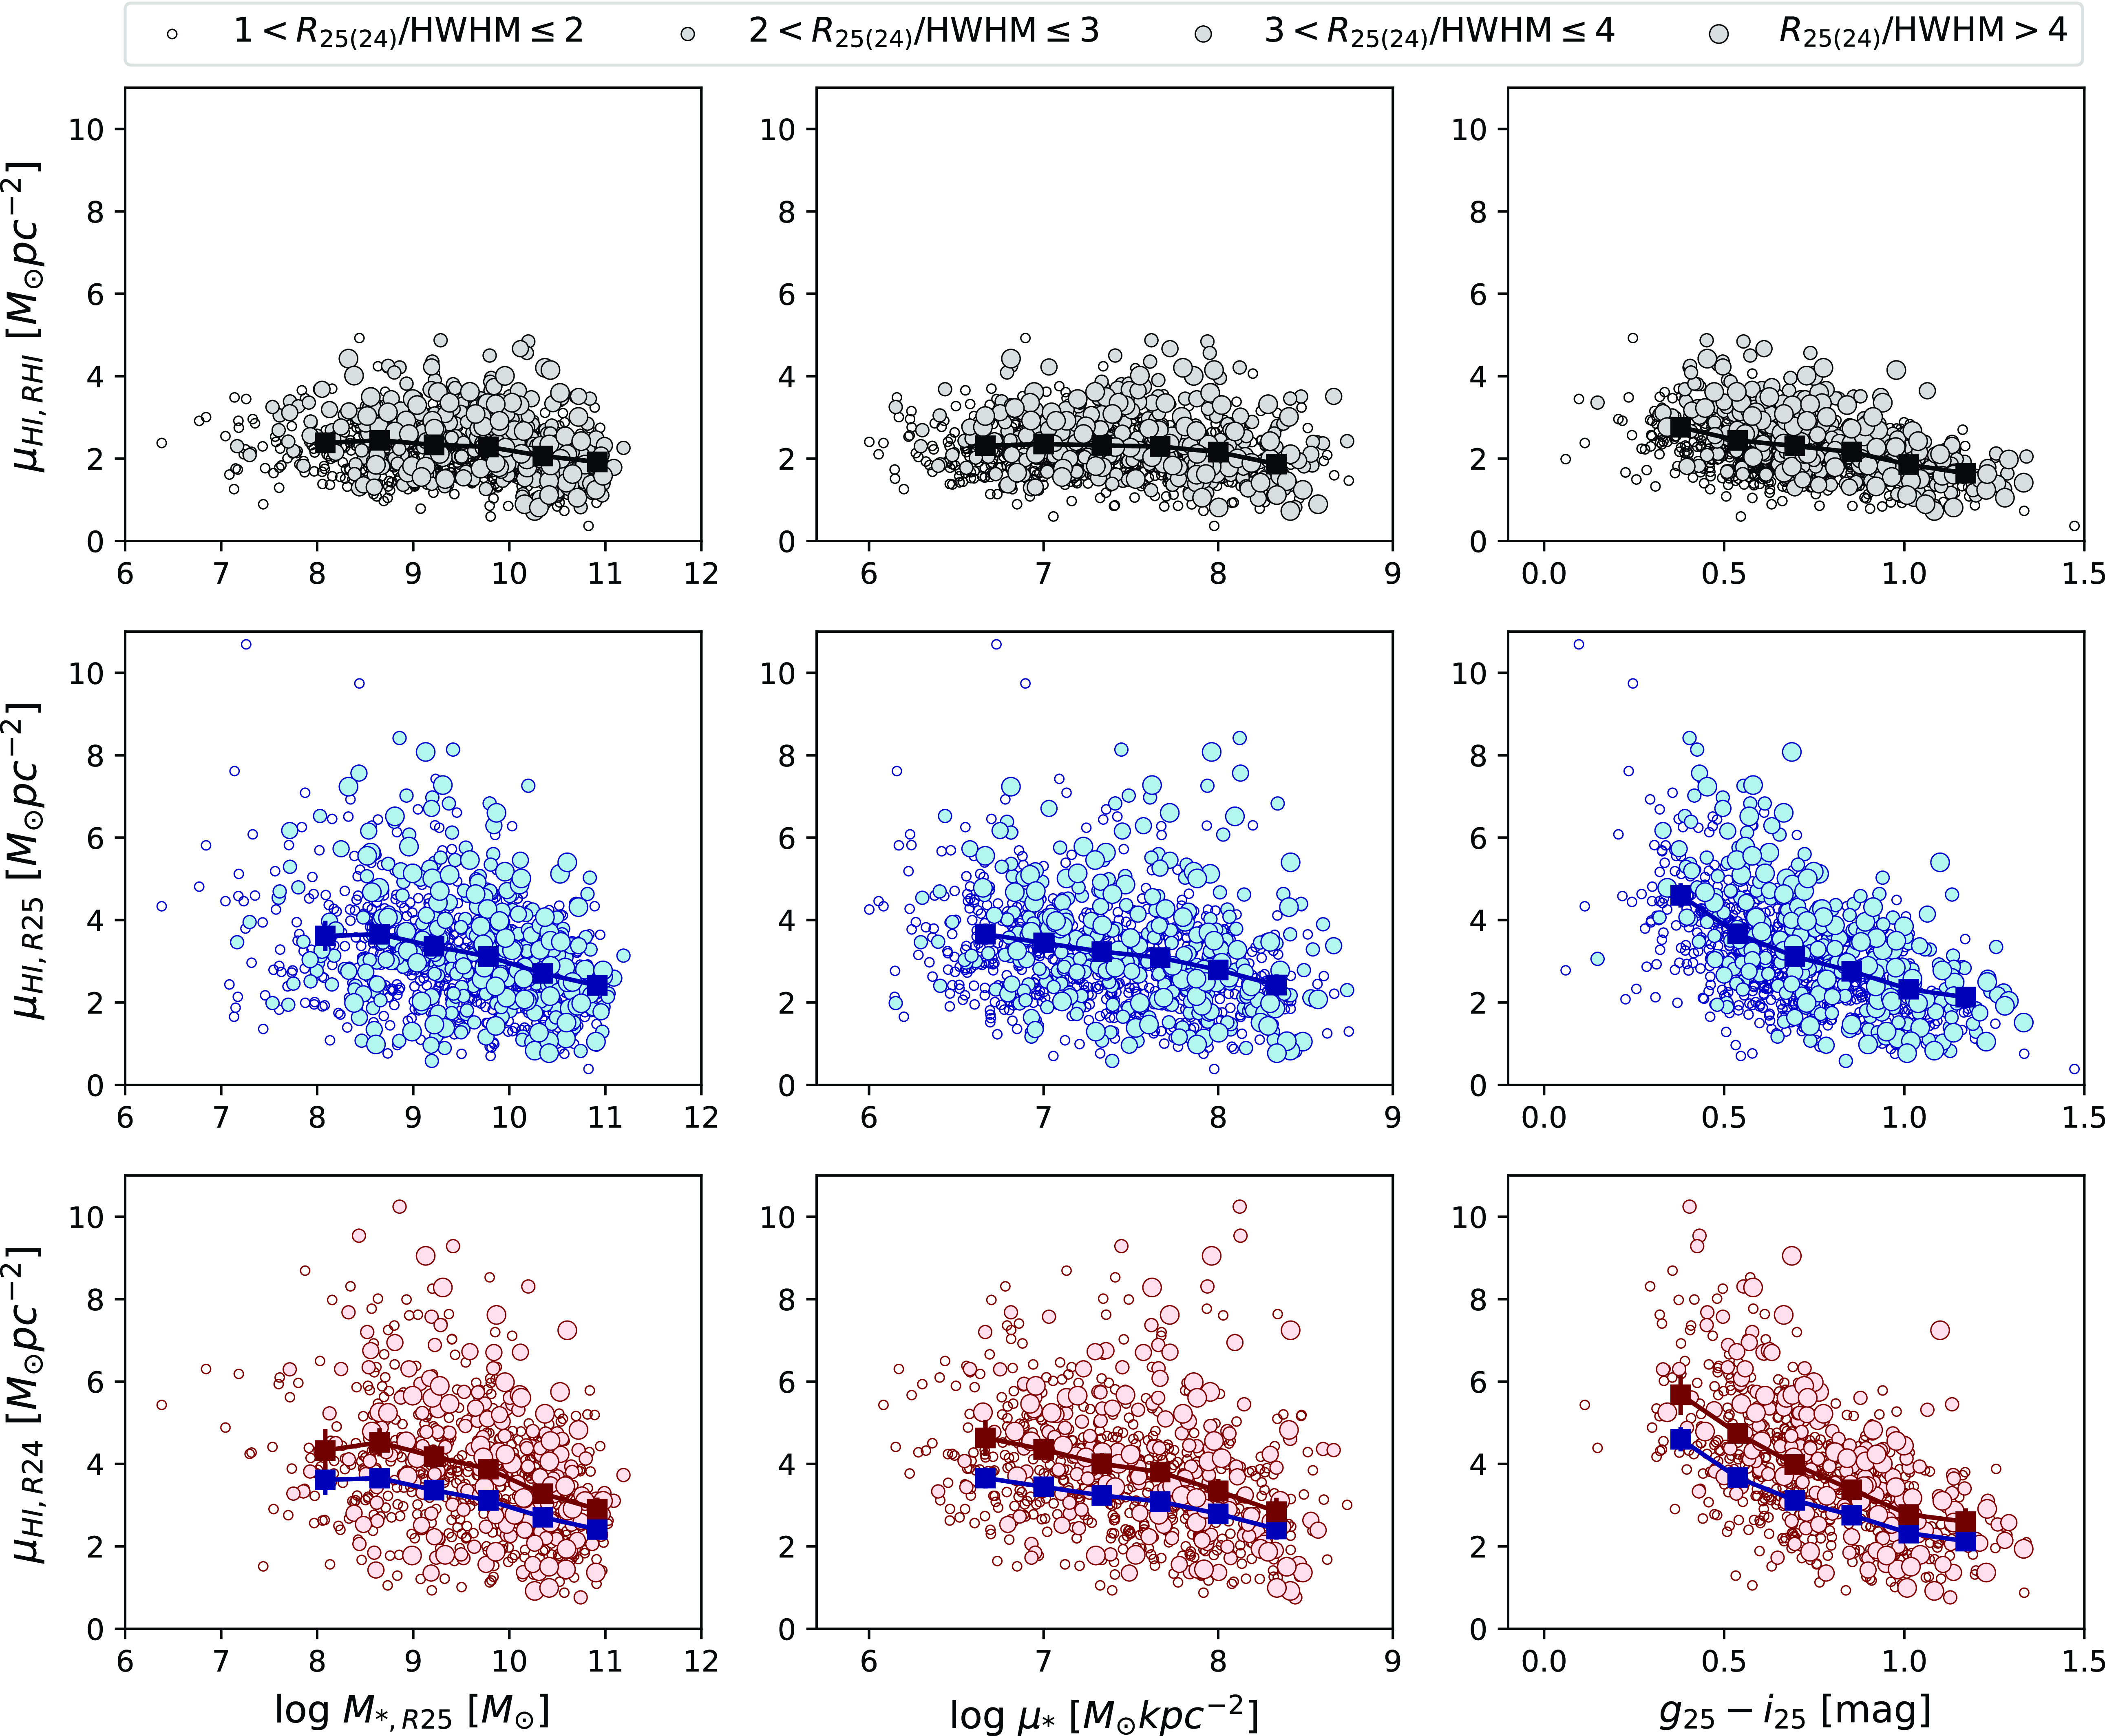
Similarly to Fig. 5, we investigate how the average Hi surface density within stellar discs ( $\mu_{\text{HI,R25(24)}}$
) relates to the stellar properties in Fig. 7. We present the average Hi surface density within the Hi disc (
$\mu_{\text{HI,R25(24)}}$
) relates to the stellar properties in Fig. 7. We present the average Hi surface density within the Hi disc ( $\mu_{\text{HI,RHI}}$
) scaling relations in the top row and those within stellar discs defined by
$\mu_{\text{HI,RHI}}$
) scaling relations in the top row and those within stellar discs defined by $R_{\text{25}}$
and
$R_{\text{25}}$
and $R_{\text{24}}$
in the middle and bottom rows, respectively, to compare the result from global Hi and Hi within stellar discs. The Spearman coefficients of each relation are shown in Table 2.
$R_{\text{24}}$
in the middle and bottom rows, respectively, to compare the result from global Hi and Hi within stellar discs. The Spearman coefficients of each relation are shown in Table 2.
We find a weak trend in the average Hi surface density within the Hi disc ( $\varrho\sim0.2$
), apart from a stronger dependence on colour (
$\varrho\sim0.2$
), apart from a stronger dependence on colour ( $\varrho = -0.42$
for the parent sample). Noticeable trends emerge for all stellar properties when the Hi is restricted to
$\varrho = -0.42$
for the parent sample). Noticeable trends emerge for all stellar properties when the Hi is restricted to $R_{\text{25}}$
and
$R_{\text{25}}$
and $R_{\text{24}}$
. Focusing on the average Hi surface density within
$R_{\text{24}}$
. Focusing on the average Hi surface density within $R_{\text{25}}$
first, its distribution is twice as broad as that within
$R_{\text{25}}$
first, its distribution is twice as broad as that within $R_{\text{HI}}$
(see also Fig. 3) and it shows stronger correlations with all stellar properties compared to that within
$R_{\text{HI}}$
(see also Fig. 3) and it shows stronger correlations with all stellar properties compared to that within $R_{\text{HI}}$
(
$R_{\text{HI}}$
( $\Delta\varrho = 0.07, 0.14,$
and
$\Delta\varrho = 0.07, 0.14,$
and $0.11$
with the stellar mass, stellar surface density, and colour, respectively, for the parent sample). The strongest correlation is with colour (
$0.11$
with the stellar mass, stellar surface density, and colour, respectively, for the parent sample). The strongest correlation is with colour ( $\varrho = -0.53$
for the parent sample), with a slightly steeper slope in the bluer colour regime.
$\varrho = -0.53$
for the parent sample), with a slightly steeper slope in the bluer colour regime.
Interestingly, these trends become more pronounced when $\mu_{\text{HI}}$
is further restricted to
$\mu_{\text{HI}}$
is further restricted to $R_{\text{24}}$
instead of
$R_{\text{24}}$
instead of $R_{\text{25}}$
(
$R_{\text{25}}$
( $\varrho$
increases by
$\varrho$
increases by $0.06, 0.05,$
and
$0.06, 0.05,$
and $0.06$
with the stellar mass, stellar surface density, and colour, respectively, for the primary sample). This indicates that bluer galaxies, which are likely to be more actively star-forming, tend to have higher Hi surface densities within the stellar disc. Moreover, this trend strengthens as we focus on the inner Hi region. Galaxies with high Hi surface density within the stellar disc (> 8
$0.06$
with the stellar mass, stellar surface density, and colour, respectively, for the primary sample). This indicates that bluer galaxies, which are likely to be more actively star-forming, tend to have higher Hi surface densities within the stellar disc. Moreover, this trend strengthens as we focus on the inner Hi region. Galaxies with high Hi surface density within the stellar disc (> 8 $\text{M}_\odot\ pc^{-2}$
) tend to be low mass galaxies with high stellar surface density and bluer colour, although their number is small. In other words, bluer galaxies have simultaneously higher HI surface densities within the stellar disc and more HI reservoir outside the stellar disc than redder systems.
$\text{M}_\odot\ pc^{-2}$
) tend to be low mass galaxies with high stellar surface density and bluer colour, although their number is small. In other words, bluer galaxies have simultaneously higher HI surface densities within the stellar disc and more HI reservoir outside the stellar disc than redder systems.
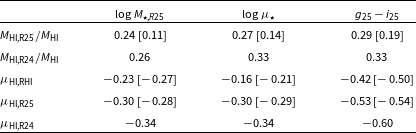
Spearman correlation coefficients for $M_{\text{HI,R25}}/M_{\text{HI}}$
,
$M_{\text{HI,R25}}/M_{\text{HI}}$
, $M_{\text{HI,R24}}/M_{\text{HI}}$
(see Fig. 5),
$M_{\text{HI,R24}}/M_{\text{HI}}$
(see Fig. 5), $\mu_{\text{HI,RHI}}$
,
$\mu_{\text{HI,RHI}}$
, $\mu_{\text{HI,R25}}$
, and
$\mu_{\text{HI,R25}}$
, and $\mu_{\text{HI,R24}}$
(see Fig. 7) as a function of
$\mu_{\text{HI,R24}}$
(see Fig. 7) as a function of $M_{ \star,R25}$
,
$M_{ \star,R25}$
, $\mu_{\star}$
, and
$\mu_{\star}$
, and $g_{\text{25}}-i_{\text{25}}$
for the parent and primary samples, corresponding to
$g_{\text{25}}-i_{\text{25}}$
for the parent and primary samples, corresponding to $R_{\text{25}}$
- and
$R_{\text{25}}$
- and $R_{\text{24}}$
-based properties, respectively. The coefficient for the primary sample is provided in brackets. The p-value of each Spearman correlation is close to zero.
$R_{\text{24}}$
-based properties, respectively. The coefficient for the primary sample is provided in brackets. The p-value of each Spearman correlation is close to zero.
The size of the stellar disc relative to the Hi disc ( $R_{\text{25,c}}/R_{\text{HI}}$
in blue circles and
$R_{\text{25,c}}/R_{\text{HI}}$
in blue circles and $R_{\text{24,c}}/R_{\text{HI}}$
in red circles) as a function of
$R_{\text{24,c}}/R_{\text{HI}}$
in red circles) as a function of $g_{\text{25}}-i_{\text{25}}$
colour. Markers are the same as in Fig. 5. Resolutions are defined based on
$g_{\text{25}}-i_{\text{25}}$
colour. Markers are the same as in Fig. 5. Resolutions are defined based on $R_{\text{25}}$
for
$R_{\text{25}}$
for $R_{\text{25,c}}/R_{\text{HI}}$
(blue circles) and
$R_{\text{25,c}}/R_{\text{HI}}$
(blue circles) and $R_{\text{24}}$
for
$R_{\text{24}}$
for $R_{\text{24,c}}/R_{\text{HI}}$
(red circles).
$R_{\text{24,c}}/R_{\text{HI}}$
(red circles).
The average Hi surface density within the Hi disc ( $\mu_{\text{HI,RHI}}$
; top row) and within the stellar disc (
$\mu_{\text{HI,RHI}}$
; top row) and within the stellar disc ( $\mu_{\text{HI,R25}}$
and
$\mu_{\text{HI,R25}}$
and $\mu_{\text{HI,R24}}$
; middle and bottom rows, respectively) as a function of stellar mass (
$\mu_{\text{HI,R24}}$
; middle and bottom rows, respectively) as a function of stellar mass ( $M_{\star,R25}$
), stellar mass surface density (
$M_{\star,R25}$
), stellar mass surface density ( $\mu_{\star}$
), and
$\mu_{\star}$
), and $g_{\text{25}}-i_{\text{25}}$
colour (columns from left to right, respectively). Markers are the same as in Fig. 5. Resolutions are defined based on
$g_{\text{25}}-i_{\text{25}}$
colour (columns from left to right, respectively). Markers are the same as in Fig. 5. Resolutions are defined based on $R_{\text{25}}$
for
$R_{\text{25}}$
for $\mu_{\text{HI,RHI}}$
and
$\mu_{\text{HI,RHI}}$
and $\mu_{\text{HI,R25}}$
(top and middle rows) and
$\mu_{\text{HI,R25}}$
(top and middle rows) and $R_{\text{24}}$
for
$R_{\text{24}}$
for $\mu_{\text{HI,R24}}$
(bottom row). The means in the middle row are replotted as the blue squares in the bottom row for comparison.
$\mu_{\text{HI,R24}}$
(bottom row). The means in the middle row are replotted as the blue squares in the bottom row for comparison.
6. Discussion
In normal star-forming galaxies, it is well known that Hi reservoirs extend beyond the inner regions where star formation takes place. This outer Hi is less involved in star formation and likely contributes to the large scatter observed in global scaling relations linking gas, stellar, and star formation properties, as well as to the long Hi depletion times reported in global studies (e.g. Catinella et al. Reference Catinella2018; Saintonge & Catinella Reference Saintonge and Catinella2022). With WALLABY we have, for the first time, measured the Hi content within the inner regions of galaxies for a statistical sample, allowing us to test some of these expectations. Instead of adopting an arbitrary stellar radius, we compared our results at two optical scales, $R_{\text{25}}$
and
$R_{\text{25}}$
and $R_{\text{24}}$
. These radii approximately correspond to
$R_{\text{24}}$
. These radii approximately correspond to $R_{\text{90%}}$
for the i-band in DECALS imaging and to the radius at 25 mag arcsec
$R_{\text{90%}}$
for the i-band in DECALS imaging and to the radius at 25 mag arcsec $^{-2}$
in the B-band, which has historically been used to define the optical disc (e.g. Cortese et al. Reference Cortese2012), respectively. For our analysis, we restricted the sample to galaxies with at least one ASKAP beam within
$^{-2}$
in the B-band, which has historically been used to define the optical disc (e.g. Cortese et al. Reference Cortese2012), respectively. For our analysis, we restricted the sample to galaxies with at least one ASKAP beam within $R_{\text{24}}$
(primary sample, 719 galaxies) or
$R_{\text{24}}$
(primary sample, 719 galaxies) or $R_{\text{25}}$
(parent sample, 995 galaxies).
$R_{\text{25}}$
(parent sample, 995 galaxies).
Our comparison of Hi scaling relations across global and smaller radii reveals the expected, systematic decrease in the Hi mass fraction ( $M_{\text{HI}}/M_{\star}$
) at fixed stellar properties, accompanied by a reduction in scatter – especially at fixed stellar surface density. The decrease in scatter is more pronounced when comparing global measurements to
$M_{\text{HI}}/M_{\star}$
) at fixed stellar properties, accompanied by a reduction in scatter – especially at fixed stellar surface density. The decrease in scatter is more pronounced when comparing global measurements to $R_{\text{25}}$
than when comparing
$R_{\text{25}}$
than when comparing $R_{\text{25}}$
to
$R_{\text{25}}$
to $R_{\text{24}}$
. These findings broadly align with some of the results presented by Wang et al. (Reference Wang2020), who estimated the Hi mass fraction within
$R_{\text{24}}$
. These findings broadly align with some of the results presented by Wang et al. (Reference Wang2020), who estimated the Hi mass fraction within $R_{\text{90%}}$
(i.e. the radius enclosing 90% of the total r-band flux from SDSS DR7; Abazajian et al. Reference Abazajian2009) based on spatially unresolved Hi data. They also found a reduced scatter for all given properties, with the largest decrease for the stellar surface density. Their relations became slightly shallower when the gas mass fraction was restricted to the stellar disc, while we found no significant changes in the slopes. This discrepancy could stem from variations in selected samples, encompassing different ranges of stellar populations, methodologies – such as observational-driven models used in their estimates versus our direct measurements – and definitions of the stellar disc.
$R_{\text{90%}}$
(i.e. the radius enclosing 90% of the total r-band flux from SDSS DR7; Abazajian et al. Reference Abazajian2009) based on spatially unresolved Hi data. They also found a reduced scatter for all given properties, with the largest decrease for the stellar surface density. Their relations became slightly shallower when the gas mass fraction was restricted to the stellar disc, while we found no significant changes in the slopes. This discrepancy could stem from variations in selected samples, encompassing different ranges of stellar populations, methodologies – such as observational-driven models used in their estimates versus our direct measurements – and definitions of the stellar disc.
Next, we quantified the distributions of Hi mass and average Hi surface density within $R_{\text{25}}$
and
$R_{\text{25}}$
and $R_{\text{24}}$
, noted the larger variation of these quantities compared to the global ones (Fig. 3), and explored their dependence on stellar properties (Figs. 5 and 7). This showed that the variation in Hi drives the most significant change in optical colour. Our main result is Fig. 7: the global Hi surface density is to first order independent of stellar mass and stellar surface density, and shows a slight dependence on colour. This indicates that bluer galaxies tend to have higher average Hi surface densities than redder galaxies across their Hi discs. When restricted to smaller radii, Hi surface densities start showing an anti-correlation with stellar mass and surface density, and the dependence on colour becomes stronger. In other words, the more outer Hi (which is not directly involved in star formation) is excluded by going to smaller radii, the stronger the correlation between Hi surface density and colour (a proxy for specific star formation) becomes. These findings are broadly consistent with Wang et al. (Reference Wang2017), who reported that Hi-rich galaxies tend to have higher average Hi surface densities within the optical disc, based on a sample of nearby LVHIS galaxies with optical radii larger than two beam sizes (i.e.,
$R_{\text{24}}$
, noted the larger variation of these quantities compared to the global ones (Fig. 3), and explored their dependence on stellar properties (Figs. 5 and 7). This showed that the variation in Hi drives the most significant change in optical colour. Our main result is Fig. 7: the global Hi surface density is to first order independent of stellar mass and stellar surface density, and shows a slight dependence on colour. This indicates that bluer galaxies tend to have higher average Hi surface densities than redder galaxies across their Hi discs. When restricted to smaller radii, Hi surface densities start showing an anti-correlation with stellar mass and surface density, and the dependence on colour becomes stronger. In other words, the more outer Hi (which is not directly involved in star formation) is excluded by going to smaller radii, the stronger the correlation between Hi surface density and colour (a proxy for specific star formation) becomes. These findings are broadly consistent with Wang et al. (Reference Wang2017), who reported that Hi-rich galaxies tend to have higher average Hi surface densities within the optical disc, based on a sample of nearby LVHIS galaxies with optical radii larger than two beam sizes (i.e., $\gtrsim$
2
$\gtrsim$
2 $\times$
40 arcsec).
$\times$
40 arcsec).
The median Hi surface density profiles ( $\Sigma_{\text{HI}}(r)$
) as a function of radius scaled by
$\Sigma_{\text{HI}}(r)$
) as a function of radius scaled by $R_{\text{25,c}}$
binned by colour. The sample only includes the better resolved galaxies with moderate inclination (
$R_{\text{25,c}}$
binned by colour. The sample only includes the better resolved galaxies with moderate inclination ( $R_{\text{25}}$
> 30" and i < 80 degrees). The range of each bin and the number of galaxies are shown in the upper right corner.
$R_{\text{25}}$
> 30" and i < 80 degrees). The range of each bin and the number of galaxies are shown in the upper right corner. $\Sigma_{\text{HI}}(r)$
in each bin are the blue, green, and red solid lines and the shaded regions show the 25th and 75th percentiles. The inclination is corrected using the axes ratio based on the i-band image. The median radial profile of 168 late-type galaxies as a function of
$\Sigma_{\text{HI}}(r)$
in each bin are the blue, green, and red solid lines and the shaded regions show the 25th and 75th percentiles. The inclination is corrected using the axes ratio based on the i-band image. The median radial profile of 168 late-type galaxies as a function of $R_{\text{HI}}$
from Wang et al. (Reference Wang2016) is presented as the black dashed line as a reference, which is scaled by the median ratio of
$R_{\text{HI}}$
from Wang et al. (Reference Wang2016) is presented as the black dashed line as a reference, which is scaled by the median ratio of $R_{\text{25,c}}$
to
$R_{\text{25,c}}$
to $R_{\text{HI,dep}}$
for galaxies with
$R_{\text{HI,dep}}$
for galaxies with $g_{\text{25}}-i_{\text{25}}$ $\leq$
0.67. The black shaded region is where
$\leq$
0.67. The black shaded region is where $R_{\text{25,c}}$
is smaller than 15".
$R_{\text{25,c}}$
is smaller than 15".
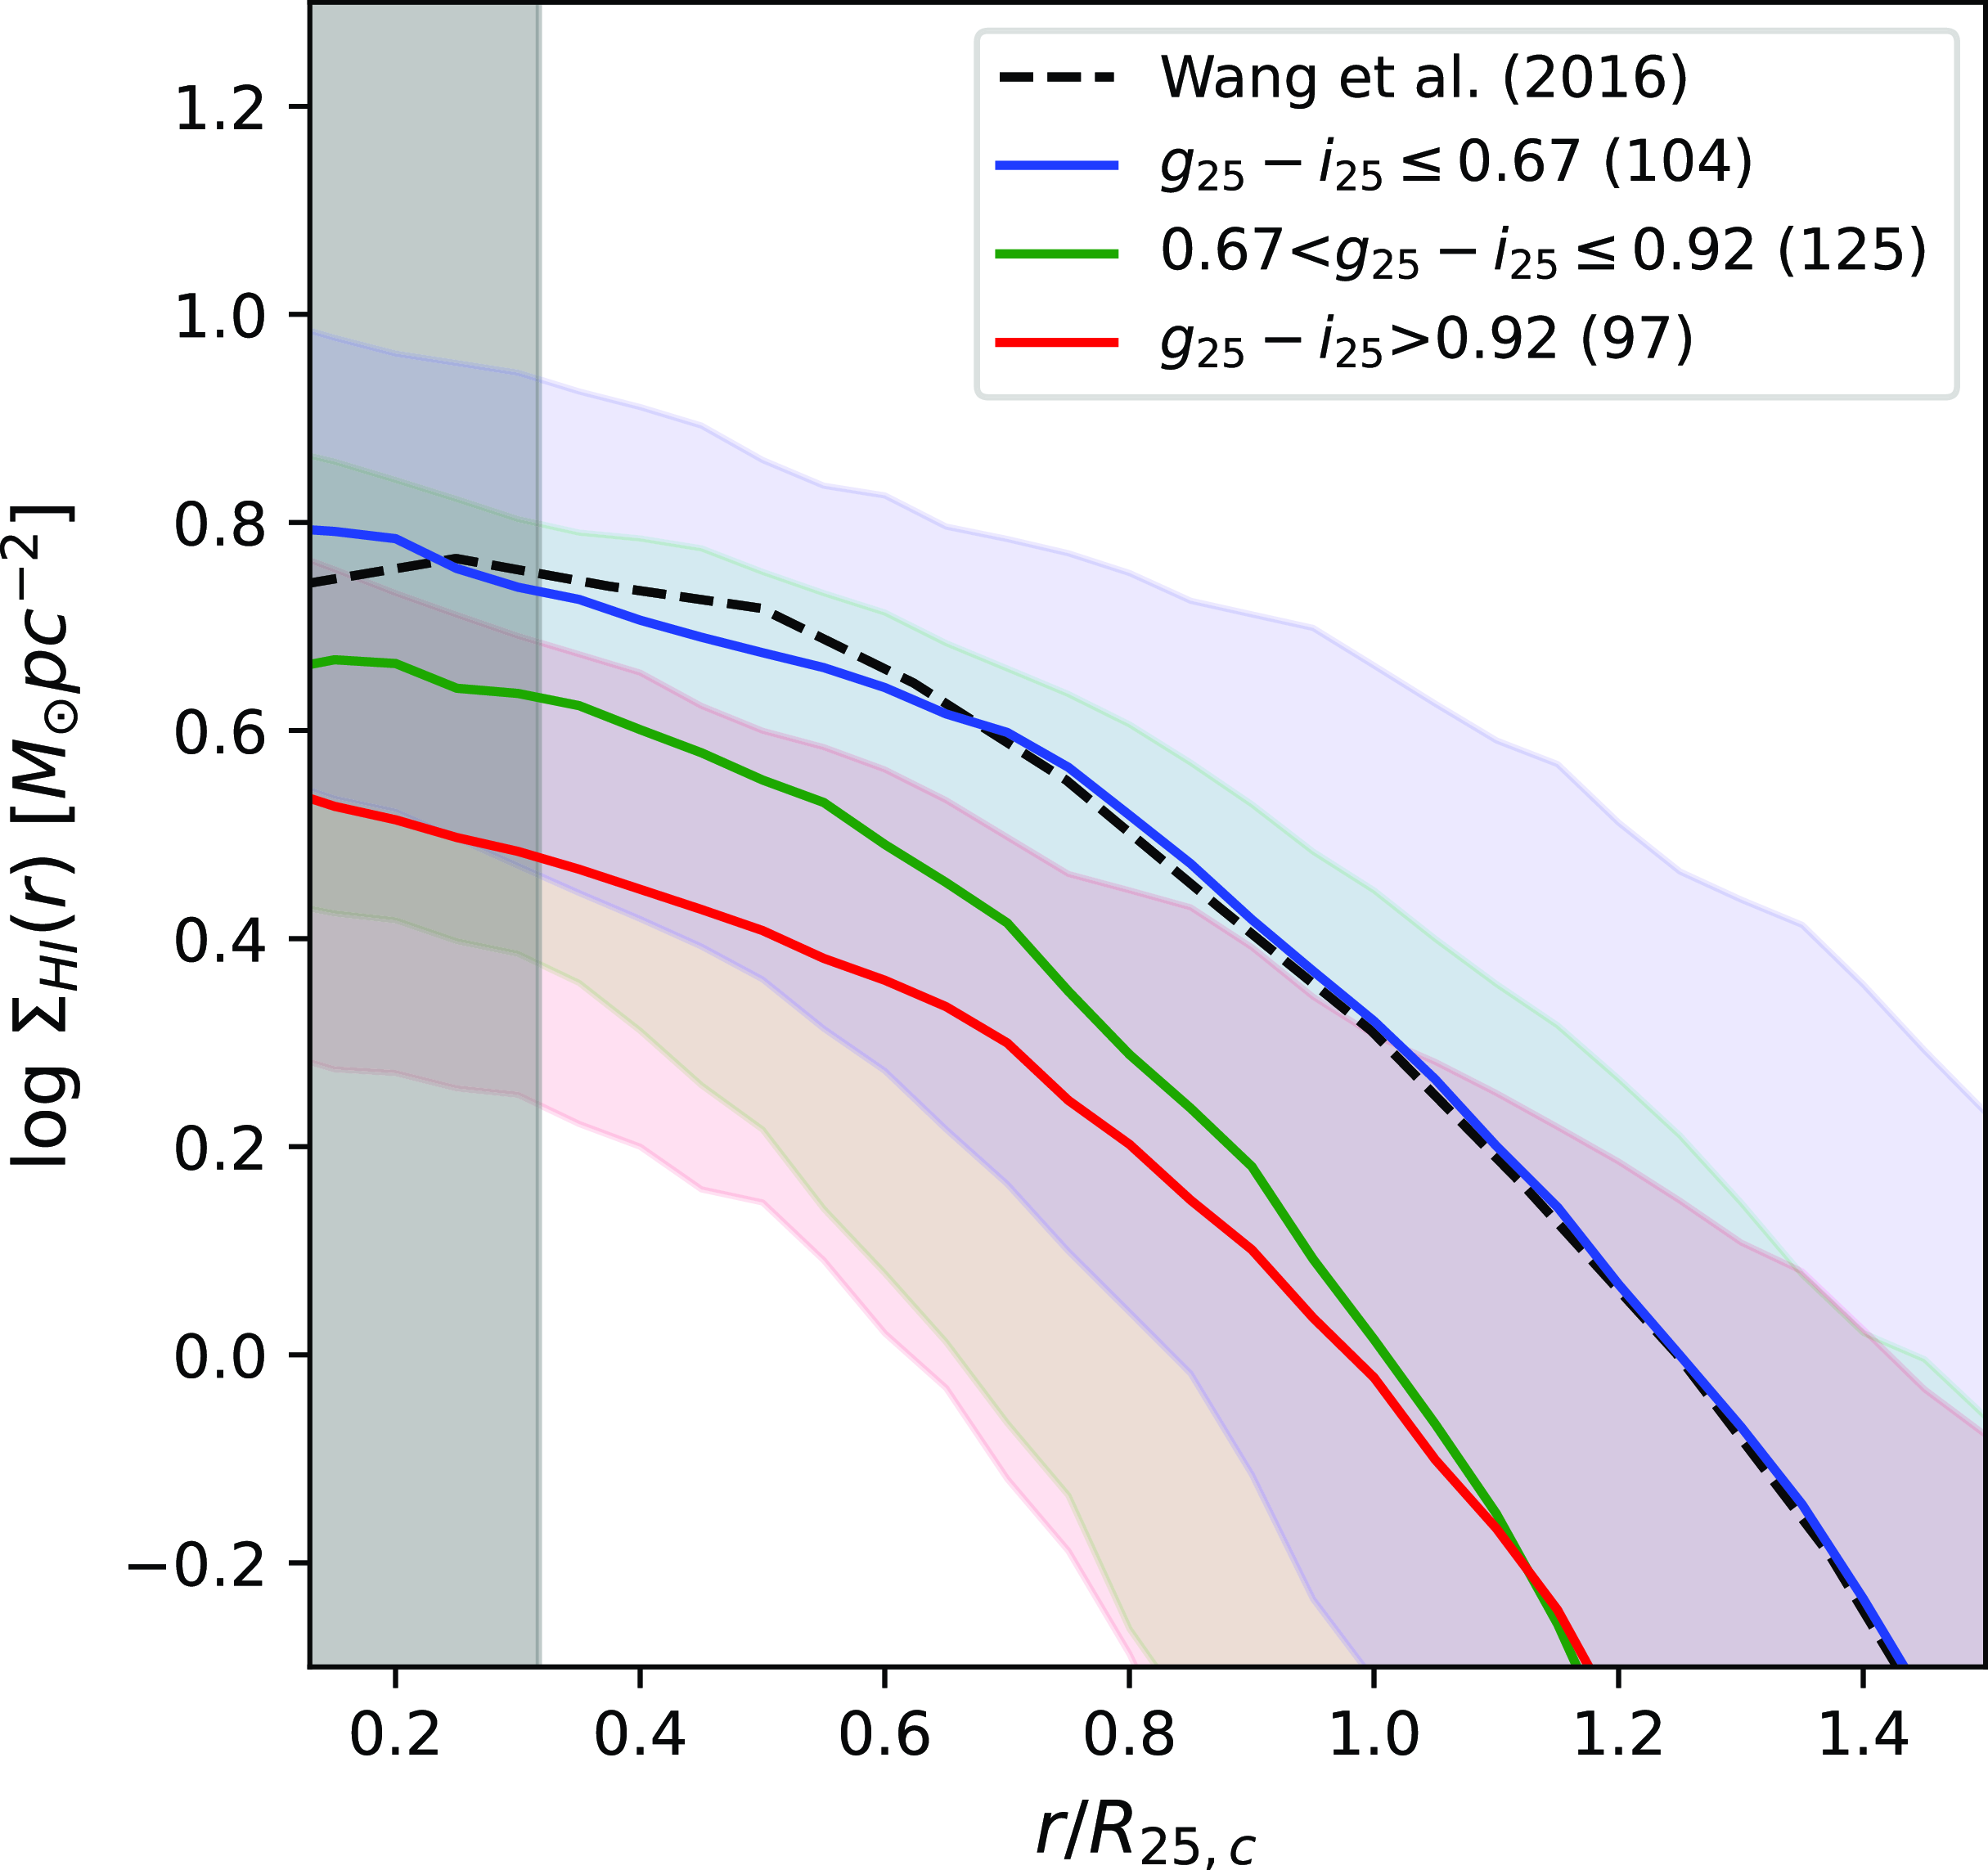
Here we further explore these findings by calculating radial Hi surface density profiles binned by colour. Fig. 8 presents the inclination-corrected median Hi surface density profiles ( $\Sigma_{\text{HI}}(r)$
) for a subset of 326 galaxies with
$\Sigma_{\text{HI}}(r)$
) for a subset of 326 galaxies with $R_{\text{25}}$
> 30" and inclination i < 80 degrees, scaled by
$R_{\text{25}}$
> 30" and inclination i < 80 degrees, scaled by $R_{\text{25,c}}$
. We note that, since deriving reliable radial Hi profiles for WALLABY galaxies is challenging (e.g. marginal resolution, high inclination; see Deg et al. Reference Deg2022), this figure is not meant to provide a robust quantification of these profiles, but to visually confirm our interpretation. As can be seen, bluer galaxies have systematically higher Hi surface densities both within the stellar disc and on global scales (as shown in Fig. 7) and have more extended Hi discs relative to their stellar discs (as shown in Figs. 5 and 6).
$R_{\text{25,c}}$
. We note that, since deriving reliable radial Hi profiles for WALLABY galaxies is challenging (e.g. marginal resolution, high inclination; see Deg et al. Reference Deg2022), this figure is not meant to provide a robust quantification of these profiles, but to visually confirm our interpretation. As can be seen, bluer galaxies have systematically higher Hi surface densities both within the stellar disc and on global scales (as shown in Fig. 7) and have more extended Hi discs relative to their stellar discs (as shown in Figs. 5 and 6).
This is not the first time that trends in radial Hi surface density profiles and the relative sizes of Hi and stellar discs depending on colour are reported. Wang et al. (Reference Wang2014) presented median Hi radial profiles by categorising 23 galaxies from the Bluedisk survey (Wang et al. Reference Wang2013) based on various Hi and stellar properties, identifying $NUV-r$
colour as the property showing the most significant variation. Our work confirms and quantifies these trends with a much larger sample, using a statistically significant number of galaxies with homogeneously measured Hi and stellar properties. Interestingly, the median Hi profile from Wang et al. (Reference Wang2016; black dashed line in Fig. 8), derived from spatially well-resolved observations of 168 spiral and dwarf galaxies, aligns closely with the median Hi profile of our galaxies in the blue bin.
$NUV-r$
colour as the property showing the most significant variation. Our work confirms and quantifies these trends with a much larger sample, using a statistically significant number of galaxies with homogeneously measured Hi and stellar properties. Interestingly, the median Hi profile from Wang et al. (Reference Wang2016; black dashed line in Fig. 8), derived from spatially well-resolved observations of 168 spiral and dwarf galaxies, aligns closely with the median Hi profile of our galaxies in the blue bin.
The strongest trends with colour suggest a closer connection between the inner gas reservoir and star formation activity in galaxies. The conversion of gas into stars plays an important role in the evolution of Hi discs. When the star formation rate surpasses the rate of gas inflow, the stellar disc grows while the gas disc diminishes relative to it. For instance, Wang et al. (Reference Wang2013) found negative correlations between the relative size of Hi disc and both the stellar mass and stellar surface density in Bluedisk galaxies. Reynolds et al. (Reference Reynolds2023) reported similar results, but found a stronger correlation with specific star formation rate (sSFR) ( $\varrho = 0.45$
) than with the stellar mass and stellar surface density (
$\varrho = 0.45$
) than with the stellar mass and stellar surface density ( $\varrho = -0.26$
and
$\varrho = -0.26$
and $-0.23$
, respectively) for WALLABY galaxies. Since bluer galaxies tend to have higher sSFR (e.g. Bigiel et al. Reference Bigiel2010a), their findings generally align with our observation of increasing
$-0.23$
, respectively) for WALLABY galaxies. Since bluer galaxies tend to have higher sSFR (e.g. Bigiel et al. Reference Bigiel2010a), their findings generally align with our observation of increasing $R_{\text{25,c}}/R_{\text{HI,dep}}$
from blue to red galaxies. This suggests that further gas replenishment may not be significant enough to alter these trends, which needs to be confirmed with the direct measurement of sSFR in a further study.
$R_{\text{25,c}}/R_{\text{HI,dep}}$
from blue to red galaxies. This suggests that further gas replenishment may not be significant enough to alter these trends, which needs to be confirmed with the direct measurement of sSFR in a further study.
Interestingly, previous studies of spatially resolved Hi scaling relations, based on modest galaxy samples, have shown that the strong correlation between Hi and SFR observed on global scales weakens or disappears at sub-kiloparsec scales (e.g. Wong & Blitz Reference Wong and Blitz2002; Boissier et al. Reference Boissier, Prantzos, Boselli and Gavazzi2003; Bigiel et al. Reference Bigiel2008; Schruba et al. Reference Schruba2011). For example, Schruba et al. (Reference Schruba2011), using 33 galaxies mostly from The Hi Nearby Galaxy Survey (THINGS; Walter et al. Reference Walter2008), found no correlation between Hi and SFR surface densities, even in Hi dominated regions. Similarly, Watts et al. (Reference Watts2023) reported weak correlations between Hi and stellar surface densities (which correlate with SFR surface densities, e.g. Morselli et al. Reference Morselli2020) for THINGS galaxies, with even weaker correlations for Virgo cluster galaxies (18 galaxies observed in the VLA Imaging of Virgo galaxies in Atomic gas survey, VIVA; Chung et al. Reference Chung, van Gorkom, Kenney, Crowl and Vollmer2009), highlighting significant variations between individual systems. On the other hand, Bacchini et al. (Reference Bacchini, Fraternali, Iorio and Pezzulli2019) suggested that using deprojected volume densities shows tighter correlations between Hi and SFR. These findings underscore the need for spatially resolved Hi studies for statistically significant galaxy samples, to better connect Hi gas reservoirs to star formation.
This study is based on a sample that is biased towards gas-rich galaxies and limited in spatial resolution. To account for the latter, we used different markers to indicate the number of beams along the stellar disc’s major axis and demonstrated that the observed correlations remain consistent across both the entire sample and the higher-resolution subset. Our sample also includes galaxies in dense environments, such as the Hydra cluster where environmental effects may influence their Hi content (e.g. Boselli & Gavazzi Reference Boselli and Gavazzi2006; Cortese, Catinella, & Smith Reference Cortese, Catinella and Smith2021). However, we find that the correlations in the fraction of total Hi mass and average Hi surface density within the $R_{\text{25}}$
disc scaling relations remain valid even after excluding galaxies with truncated Hi discs (i.e., 34 galaxies with
$R_{\text{25}}$
disc scaling relations remain valid even after excluding galaxies with truncated Hi discs (i.e., 34 galaxies with $R_{\text{HI}} \lt R_{\text{25}}$
). In conclusion, despite the limitations in spatial resolution and the presence of galaxies in dense environments, our key findings remain robust and highlight the importance of measuring the Hi content within the stellar disc to better understand its link with star formation.
$R_{\text{HI}} \lt R_{\text{25}}$
). In conclusion, despite the limitations in spatial resolution and the presence of galaxies in dense environments, our key findings remain robust and highlight the importance of measuring the Hi content within the stellar disc to better understand its link with star formation.
7. Conclusions
In this paper, we use WALLABY pilot data to quantify, for the first time, Hi mass fraction and average Hi surface density within the stellar disc, and their dependence on stellar properties, for a statistical sample of galaxies. We explore how gas scaling relations change as we move from global Hi measurements to those restricted to $R_{\text{25}}$
, and further to
$R_{\text{25}}$
, and further to $R_{\text{24}}$
. Our sample comprises 995 and 719 galaxies, with stellar discs defined by
$R_{\text{24}}$
. Our sample comprises 995 and 719 galaxies, with stellar discs defined by $R_{\text{25}}$
and
$R_{\text{25}}$
and $R_{\text{24}}$
, respectively, resolved by at least one WALLABY synthesised beam. Our findings are similar even if we limit our sample to galaxies with higher spatial resolution.
$R_{\text{24}}$
, respectively, resolved by at least one WALLABY synthesised beam. Our findings are similar even if we limit our sample to galaxies with higher spatial resolution.
-
• On average, about 68% of the Hi is found within the stellar disc defined by
$R_{\text{25}}$
(54% for
$R_{\text{24}}$
) for WALLABY galaxies. However, the fraction spans a wide range from
$\sim$
20% to 100%, with even greater variation observed for
$R_{\text{24}}$
. Similarly, the average Hi surface density within the stellar disc varies from 1 to 6
$\text{M}_\odot$
pc
$^{-2}$
. -
• The scatter of Hi mass fraction (
$M_{\text{HI}}/M_{\star}$
) within the stellar disc scaling relations decreases compared to global Hi for all stellar properties, consistent with the findings from spatially unresolved data in Wang et al. (Reference Wang2020). This suggests a closer connection between Hi within the stellar disc and the stars than with global Hi. -
• Notable trends in Hi scaling relations become apparent when the Hi measurements are restricted to the stellar discs. The strongest correlation is found with colour: bluer galaxies tend to have a lower fraction of their total Hi mass, and a significantly higher average Hi surface density, within their stellar discs than redder galaxies. These trends become more pronounced when the Hi is restricted to smaller radii, implying a stronger link between the inner Hi reservoirs and star formation.
-
• The variations in Hi properties within stellar discs can be attributed to systematic differences in the radial Hi surface density profiles. Bluer galaxies tend to have elevated Hi surface densities and larger Hi discs relative to their stellar discs than redder galaxies.


The WALLABY survey, despite its bias towards gas-rich galaxies and limited spatial resolution, enables us to conduct a statistical analysis that connects Hi and stars on the same spatial scale. Further research that includes star formation will be important for understanding how Hi consumption within the stellar disc, or Hi depletion time, differs from the global one and how it relates to galaxy properties. The full WALLABY survey will provide even more statistically significant insights with an increased number of spatially resolved galaxies.
Acknowledgement
This scientific work uses data obtained from Inyarrimanha Ilgari Bundara, the CSIRO Murchison Radio-astronomy Observatory. We acknowledge the Wajarri Yamaji People as the Traditional Owners and native title holders of the Observatory site. CSIRO’s ASKAP radio telescope is part of the Australia Telescope National Facility (https://ror.org/05qajvd42). Operation of ASKAP is funded by the Australian Government with support from the National Collaborative Research Infrastructure Strategy. ASKAP uses the resources of the Pawsey Supercomputing Research Centre. Establishment of ASKAP, Inyarrimanha Ilgari Bundara, the CSIRO Murchison Radio-astronomy Observatory and the Pawsey Supercomputing Research Centre are initiatives of the Australian Government, with support from the Government of Western Australia and the Science and Industry Endowment Fund.
WALLABY acknowledges technical support from the Australian SKA Regional Centre (AusSRC).
Parts of this research were supported by the Australian Research Council Centre of Excellence for All Sky Astrophysics in 3 Dimensions (ASTRO 3D), through project number CE170100013.
LC acknowledges support from the Australian Research Council’s Discovery Project funding scheme (DP210100337).
JW thanks support of research grants from Ministry of Science and Technology of the People’s Republic of China (NO. 2022YFA1602902), National Science Foundation of China (NO. 12073002, 12233001, 8200906879), and the China Manned Space Project.
KS acknowledges support from the Natural Sciences and Engineering Research Council of Canada.
The Legacy Surveys consist of three individual and complementary projects: the Dark Energy Camera Legacy Survey (DECaLS; Proposal ID #2014B-0404; PIs: David Schlegel and Arjun Dey), the Beijing-Arizona Sky Survey (BASS; NOAO Prop. ID #2015A-0801; PIs: Zhou Xu and Xiaohui Fan), and the Mayall z-band Legacy Survey (MzLS; Prop. ID #2016A-0453; PI: Arjun Dey). DECaLS, BASS and MzLS together include data obtained, respectively, at the Blanco telescope, Cerro Tololo Inter-American Observatory, NSF’s NOIRLab; the Bok telescope, Steward Observatory, University of Arizona; and the Mayall telescope, Kitt Peak National Observatory, NOIRLab. Pipeline processing and analyses of the data were supported by NOIRLab and the Lawrence Berkeley National Laboratory (LBNL). The Legacy Surveys project is honored to be permitted to conduct astronomical research on Iolkam Du’ag (Kitt Peak), a mountain with particular significance to the Tohono O’odham Nation.
NOIRLab is operated by the Association of Universities for Research in Astronomy (AURA) under a cooperative agreement with the National Science Foundation. LBNL is managed by the Regents of the University of California under contract to the U.S. Department of Energy.
This project used data obtained with the Dark Energy Camera (DECam), which was constructed by the Dark Energy Survey (DES) collaboration. Funding for the DES Projects has been provided by the U.S. Department of Energy, the U.S. National Science Foundation, the Ministry of Science and Education of Spain, the Science and Technology Facilities Council of the United Kingdom, the Higher Education Funding Council for England, the National Center for Supercomputing Applications at the University of Illinois at Urbana-Champaign, the Kavli Institute of Cosmological Physics at the University of Chicago, Center for Cosmology and Astro-Particle Physics at the Ohio State University, the Mitchell Institute for Fundamental Physics and Astronomy at Texas A&M University, Financiadora de Estudos e Projetos, Fundacao Carlos Chagas Filho de Amparo, Financiadora de Estudos e Projetos, Fundacao Carlos Chagas Filho de Amparo a Pesquisa do Estado do Rio de Janeiro, Conselho Nacional de Desenvolvimento Cientifico e Tecnologico and the Ministerio da Ciencia, Tecnologia e Inovacao, the Deutsche Forschungsgemeinschaft and the Collaborating Institutions in the Dark Energy Survey. The Collaborating Institutions are Argonne National Laboratory, the University of California at Santa Cruz, the University of Cambridge, Centro de Investigaciones Energeticas, Medioambientales y Tecnologicas-Madrid, the University of Chicago, University College London, the DES-Brazil Consortium, the University of Edinburgh, the Eidgenössische Technische Hochschule (ETH) Zurich, Fermi National Accelerator Laboratory, the University of Illinois at Urbana-Champaign, the Institut de Ciencies de l’Espai (IEEC/CSIC), the Institut de Fisica d’Altes Energies, Lawrence Berkeley National Laboratory, the Ludwig-Maximilians-Universität München and the associated Excellence Cluster Universe, the University of Michigan, NSF’s NOIRLab, the University of Nottingham, the Ohio State University, the University of Pennsylvania, the University of Portsmouth, SLAC National Accelerator Laboratory, Stanford University, the University of Sussex, and Texas A&M University.
BASS is a key project of the Telescope Access Program (TAP), which has been funded by the National Astronomical Observatories of China, the Chinese Academy of Sciences (the Strategic Priority Research Program ‘The Emergence of Cosmological Structures’ Grant # XDB09000000), and the Special Fund for Astronomy from the Ministry of Finance. The BASS is also supported by the External Cooperation Program of Chinese Academy of Sciences (Grant # 114A11KYSB20160057), and Chinese National Natural Science Foundation (Grant # 12120101003, # 11433005).
The Legacy Survey team makes use of data products from the Near-Earth Object Wide-field Infrared Survey Explorer (NEOWISE), which is a project of the Jet Propulsion Laboratory/California Institute of Technology. NEOWISE is funded by the National Aeronautics and Space Administration.
The Legacy Surveys imaging of the DESI footprint is supported by the Director, Office of Science, Office of High Energy Physics of the U.S. Department of Energy under Contract No. DE-AC02-05CH1123, by the National Energy Research Scientific Computing Center, a DOE Office of Science User Facility under the same contract; and by the U.S. National Science Foundation, Division of Astronomical Sciences under Contract No. AST-0950945 to NOAO.


 Open access