

INTRODUCTION
One of the most difficult unanswered questions regarding the influenza pandemic of 1918–1919 is why very heterogeneous mortality rates were seen in very similar populations [Reference Morens, Taubenberger and Fauci1, Reference Morens2]. Nearly identical military units operating in the same area had mortality rates varying by a factor of ⩾10 and mortality rates on the Pacific Islands differed by a factor of nearly 50 despite all apparently being susceptible to infection by the pandemic influenza virus [Reference Shanks, Hussell and Brundage3, Reference Shanks4]. Waves of influenza-like illness (ILI) that occurred in early 1918 resulted in much fewer deaths than the major wave that occurred in late 1918. The later wave is known from historical pathology specimens tested for surviving nucleic acids to have been caused by a H1N1 virus and resulted in the deaths of about 50 million people [Reference Taubenberger and Morens5]. A possible explanation for the differences in numbers of fatalities is that the wave occurring in early 1918 was caused by a different influenza virus than the lethal wave of late 1918. The question then is whether there are differences between the early and late waves of 1918 that can be documented as possible evidence that two separate viruses were involved.
Nearly a century after the events one has to work without direct physical evidence of the virus of the early wave of 1918. The early wave sickened many but killed very few persons even in crowded military recruit camps such that very little archived pathological material exists. What autopsy material that has been studied indicates is, at least in some cases, a virus very much like that recovered late in 1918 was present as early as May 1918 [Reference Sheng6]. In US Army recruit camps the early 1918 wave peaked in March and was gone by May such that the identity of the virus of the early 1918 wave remains unknown [Reference Brundage7].
Because the 1918 pandemic was unanticipated, reliable prospectively collected ILI morbidity information prior to the main pandemic mortality wave is rare, especially on an individual rather than group basis. Those data that do exist are inconsistent; some indicating that ILI earlier in 1918 gave substantial protection against illness during the main mortality wave in late 1918, and some indicating there was no protection against illness. The majority of studies, however, support the notion that ILI in early 1918 protected against mortality in late 1918–early 1919 [Reference Jordan8, Reference Opie EL9].
The very heterogeneous mortality rates overall might be explained by the geographically variable circulation of related H1N1 viruses resulting in incomplete cross-protection. The two populations in which we were able to identify adequate information to see how events of early 1918 might have affected mortality during late 1918 were the British Army in France and the US Army recruited from the two states of New York and Vermont. We aimed to determine the spatio-temporal characteristics of disease mortality across the battlefield in France in the British Army as well as the relationship of home town to disease mortality while in the US Army, to obtain insight into the dynamics of influenza-related deaths during 1918. We interpret our findings in the context of historical observations from 1918 to assess whether they support the existence of more than one influenza virus circulating in 1918.
METHODS
British Army
The primary sources of information used were a near-complete digitalized listing of all British sailors and soldiers who died in the First World War during 1914–1919, and the Commonwealth War Graves Commission (CWGC) ‘Debt of Honour Register’ (available online at http://www.cwgc.org/). Information available included name, rank, regimental number, date of death, and place of burial. Some cause-of-death information was available from another British Army database which identified those dying in combat, by accidental trauma and all other causes which was termed ‘died’ by those classifying the casualties at the time [Reference Bridger10]. British soldier deaths due to non-combat reasons (listed as ‘died’) who had known burials by the CWGC were collected from 1 January 1917 to 31 December 1918. Memorial wall listings were assumed to be ‘missing’ and not influenza deaths, because all disease deaths would have had a corpse. In addition, the same research team had previously collected detailed information on soldiers who had died of disease in the Australian Imperial Force (AIF) and the New Zealand Expeditionary Force (NZEF) who fought as part of the British Armies in France during 1916–1919 [Reference Shanks4]. Canadian, Indian and South African soldier deaths could not be classified by cause of death and are not included in this analysis. All identified British, Australian and New Zealand military deaths likely to be due to disease (accidental deaths were excluded but it is uncertain how complete such classification was at the time) had the grave sites located to the specific military cemetery in Belgium or France, which was plotted by geographical coordinates. Soldiers dying of disease in Western Europe were typically buried near the medical facility in which they died; repatriation of soldier remains to the UK was extremely unusual in the British Army. Geographical site of burial was then used as a surrogate for location at time of death, a proxy for location of exposure to the virus, which was available to the specific day of death.
US Army
Commemorative books listing all US soldiers and sailors dying during the First World War whose recorded home town was in Vermont or New York were digitalized [Reference Kincaid11, Reference Sheldon12]. These were the only two states with complete mortality lists for which we could locate individually named soldiers with their home address. Cause-of-death information was sufficient to distinguish combat or accidental trauma deaths from those due to disease. Disease deaths only were available from Vermont, whereas pneumonia/influenza deaths could be distinguished in New York. Most disease deaths in soldiers from Vermont were due to pneumonia/influenza. Home town was matched to county and closest currently identifiable geographical place name, and its longitude and latitude recorded.
British Army analysis
Determining the occurrence of epidemic signals in 1918
The statistical analysis was conducted in two stages. In the first, we used a model-based approach to determine the occurrence of an epidemic signal at a given cemetery in a given week between 1 January 1918 and 29 December 1918 (N = 52 weeks). A signal was defined as a ratio of the observed to the expected number of burials (i.e. the relative risk) ⩾1·0, with a probability of ⩾97·5%. The expected number of weekly burials was calculated as the average number of burials by week from 1 January 1917 to 31 December 1917 in each cemetery, during which relatively stable temporal variation in the number of burials occurred. To ensure a reliable estimate of the expected number of weekly burials, cemeteries were eligible for inclusion if a total of ⩾5 burials occurred during this period (N = 223 cemeteries).
Our estimate of the relative risk, derived from a spatio-temporal model, exploits information from the number of burials in the preceding week and the number of burials in neighbouring cemeteries. The model was constructed in a Bayesian framework using the statistical software WinBUGS v. 1·4 (Medical Research Council, Cambridge, UK and Imperial College London, UK). The number of burials Y in cemetery i, week j, was modelled using Poisson regression with a log link:
 $$Y_{ij} \sim {\rm Poisson}( {\mu _{ij}}),$$
 $$\log({\mu_{ij}} ) = \log({E_{ij}} ) + \log({{\rm R\,R}_{ij}} ),$$
where E ij is the expected number of burials, and RR ij is the relative risk, modelled as:
 $${\rm RR}_{ij} = \alpha + \beta Y_{i,j-1} + s_{ij} + u_{ij}, $$
where α is the intercept, β is a temporal autocorrelation (AR1) coefficient, s ij , representing spatially autocorrelated variation, is modelled using the principle of model-based geostatistics as [Reference Diggle13]:
 $$s_{ij} \sim {\rm MVN}\left( {0, \Sigma} \right),$$
 $$\sum \nolimits_{kl} = \sigma^2_s \exp({-\varphi d_{kl}} ),$$
where MVN is multivariate normal, k and l represent any pair of cemeteries, d is the separating distance between them and φ is the rate of decay of spatial autocorrelation; and u ij is a residual error term modelled as: u ij ~ Normal(0,σ 2 u ). The following non-informative prior distributions were used for the unknown model parameters: α ~ Uniform(–∞, ∞), a ‘flat’ prior; β ~ Uniform(–1,1); 1/σ 2 s ~ Gamma(0·01, 0·01) (note that in WinBUGS, the second parameter of the normal distribution is the precision, which is the inverse of the variance); 1/σ 2 u ~ Gamma(0·01, 0·01) and φ ~ Uniform(0·01, 100).
Parameter estimates were obtained using Markov-chain Monte Carlo simulation with Gibbs sampling. Values from the first 1000 iterations were discarded and the subsequent 10 000 values from the posterior distribution of each parameter were stored for analysis. Posterior distributions were summarized using the mean and the 2·5th and 97·5th percentiles, which provide the limits of the 95% credible interval (CrI). An epidemic signal was determined to have occurred if the 2·5th percentile of the posterior distribution of the relative risk for a given cemetery in a given week was >1·0. In other words, an epidemic signal was deemed to have occurred if it was >97·5% probable that the risk of mortality in a given location in a given week was greater than the overall average risk for the study area during the reference period (1 January 1917–31 December 1917).
Spatial smoothing of the epidemic signals to visualize wave fronts
The second stage of the analysis involved identifying the week in which the epidemic wave front passed the location of each cemetery. Two main waves were identified in the study period, an early wave (weeks 8–21), peaking around week 11 and a much larger, later one (weeks 35–51) peaking around week 42. A smaller wave was also identified preceding the large wave (weeks 22–34), peaking around week 27; but was not included in the final analysis due to a lack of evidence as to whether this constituted an earlier wave of ILI, or was part of the large wave. Two outcomes were investigated in the analysis: the number of the first week in which an epidemic signal occurred in each cemetery during the early wave; and the number of the first week in which an epidemic signal occurred in the large wave.
With the value of the first week in which an epidemic signal occurred as the outcome, generalized additive models were developed using the gam library in R statistical software v. 2·9·0 (R Foundation for Statistical Computing, Austria). These were Gaussian models with loess smoothing algorithms (with a span of 0·4 decimal degrees) applied to the values of the longitude and latitude of each cemetery. The generalized additive models were then used to predict the timing of the epidemic wave fronts at all locations in the study area.
US Army analysis
A kernel smoothing approach was used to map the ratio of the density of deaths due to disease (Vermont) or pneumonia/influenza (New York) to the density of combat deaths; the rationale being that combat deaths were assumed to be representative of the spatial distribution of the population at risk, and the resultant density ratio map was representative of the risk of death associated with the location of the soldier's home town. The ‘deaths due to disease:deaths due to combat’ ratio was introduced because it was not possible to develop consistent denominators estimating how many men had joined the military from any particular area smaller than a county. Combat deaths were therefore used as a surrogate denominator that would reflect the absolute number of men in the military from any particular town.
To create each input surface (densities of deaths due to disease and deaths due to combat), a Gaussian smoothing function with a fixed band width of 0·333 decimal degrees was used (which, at a latitude of 40·67° N equates to a distance on an east–west axis of 28·1 km; on a north–south axis, 0·333 decimal degrees equates to 37·1 km), and the number of deaths in each location was the value that was smoothed. The band width was chosen because it provided the best visual distinction between high- and low-risk areas; a higher band width smoothed out meaningful variation and a lower band width provided excessive detail on localized variation informed by a small number of deaths. No correction was made for edge effects. The resultant density surface of deaths due to disease was then divided by the density surface of deaths due to combat to create the density ratio map. This analysis was conducted using the Spatial Analyst extension of the Geographical Information System (GIS) software, ArcGIS v. 10 (ESRI, USA).
RESULTS
Figure 1a shows the sequential mortality map of soldiers likely to have died from influenza on the northern battlefield in France and Belgium during weeks 8–21 of 1918. The first areas seen to be involved when increased mortality was first discernible in early 1918 are along the actual fighting front near the trench lines. The large military logistical complex of Etaples, which was located on the English Channel at the mouth of the Seine river, was one of the last areas noted to have a mortality signal [Reference Oxford14]. Figure 1b is distinctly different. It shows the same type of mortality map of soldiers likely to have died from influenza for weeks 35–51 of 1918. In late 1918, the mortality wave first came from the south and moved northwards towards the mass of soldiers in the trenches. This was the opposite direction of the early 1918 wave. A secondary signal in late 1918 is seen around the city of Lille. The number of British soldiers dying weekly in 1918 is shown in Supplementary Figure S1.
Depiction of influenza mortality waves in the British Army, April–December 1918. The maps are based on weekly British non-combat mortality in France, with burial site used as a surrogate for place of death. Plotting the disease deaths likely to be due to influenza indicates how the infectious waves moved across the battlefield. (a) ‘Early wave’, weeks 8–21 of 1918, corresponding to 17 February to 25 May 1918. (b) ‘Late wave’, weeks 35–51 of 1918, corresponding to 25 August to 2 December 1918. (c) Cemetery sites and concentration of deaths analysed.

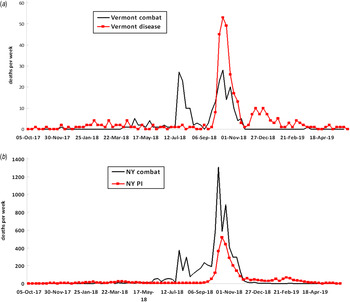
Plotting the home towns of soldiers who died from combat or disease in Vermont and New York in the US Army represented an entirely different variable. Here mortality during the late 1918 wave was measured as it related to where most of the soldiers were during the early 1918 wave but not at the time of their illness and death. Figure 2a shows the epidemic curves of the distribution of combat (234) and disease (347) deaths in Vermont, while Figure 2b shows combat (6997) and pneumonia/influenza (3349) deaths in New York. In Figures 3 and 4, the disease mortality rate by county is shown in both Vermont and New York. Relative to combat deaths, the overall number of disease deaths was much higher in Vermont than New York. Overall disease death ratios were higher in Vermont (3%) than in New York (1%). The densely populated counties in New York had lower disease mortality than the more sparsely populated counties. Having grouped the counties by population density (0–49, 50–99, 100–199, ⩾200 persons per square mile), the disease mortality rate was 50% lower in the most densely populated counties compared to the least densely populated counties (1·6% and 0·8%, respectively, overall test for trend P < 0·0001).
Epidemic curves showing weekly combat and disease deaths in US soldiers from Vermont and weekly combat and pneumonia/influenza (PI) deaths in soldiers from New York, 1917–1919.
Disease mortality rate by county in US soldiers from Vermont 1917–1919. PI, Pneumonia/influenza.

Pneumonia/influenza (PI) mortality rate by county in US soldiers from New York 1917–1919.

A combined map of New York and Vermont is given in Figure 5 showing combat deaths (Fig. 5a ), and influenza deaths (Fig. 5b ); mortality is concentrated distinctly in urban areas reflecting simple population density. Figure 5c shows that the density ratio of deaths due to disease and deaths due to combat has a higher ratio in more rural areas, the opposite of that seen in Figure 5(a, b). Despite a higher ratio in most rural areas, there was still much inconsistency, especially in the eastern section where some areas of low disease/combat ratios were seen. Figure 5 d shows the geographical points that were used to construct the mortality maps.
Kernel density maps of (a) combat deaths, (b) influenza deaths, (c) influenza/combat death density ratio map and (d) geographical points used for map construction.

DISCUSSION
Mapping data from various military groups during the 1918 influenza pandemic was an attempt to look for indications of the wave of ILI that occurred in early 1918 despite the fact that this early wave was not directly measured at the time due to its relative unimportance. When millions died in the late 1918 wave, it became critical to try to understand the relationship between the waves; were they the same or different viruses [Reference Shanks and Brundage15]? The early wave protected against death but not infection later in 1918 based on detailed individual prospective data from the Australian Army [Reference Shanks4]. Similar morbidity and mortality data were available from the two US military service academies. At Annapolis, where few midshipmen became ill during early 1918, 10 (0·47%) died of pneumonia/influenza, whereas at West Point, where one-third of the cadets became sick in early 1918, no one who was present during early 1918 died of influenza when the main pandemic wave arrived in late 1918 [Reference Shanks16]. Others have reported different findings using a wide variety of populations [Reference Barry, Viboud and Simonsen17]. After an exhaustive review of the information available in the 1920s, Jordan concluded ‘an attack of clinical influenza probably imparts some measure of protection over a period of a few months, but that after a year or more the presence of immunity in a sizable, previously affected population is difficult if not impossible to demonstrate’ [Reference Jordan8].
Data from the British Army in France were used to look for evidence of the wave of early 1918 because the army was large, had many disease deaths and unlike the US Army, soldiers dying of disease were buried near the area where they became sick. Using cemetery records of the CWGC, it was possible to distinguish distinct waves of the 1918 influenza pandemic. The early 1918 wave moved from the trenches in eastern France into the rear areas farther west, whereas the late 1918 wave moved from south to north. The findings are consistent with that described in the French Army, where the early wave began in the soldiers at the front in April and then moved into the general population [Reference Delater18]. This was reversed during the later wave which began in August in sailor recruits in the Mediterranean ports in the south and then moved north [Reference Shanks, Waller and Smallman-Raynor19]. Therefore, the current study does appear to describe what was reported to have occurred in 1918 in terms of the direction of influenza mortality movement [20].
The US Army was in a very different situation. At the time of the Armistice on 11 November 1918, the 4-million-strong US Army was roughly evenly split between those near the fighting in Europe and those training in the USA [21]. Combat deaths only occurred in Europe whereas the great majority of influenza/pneumonia deaths occurred in recruit training camps in the USA. Therefore those dying during combat had joined the military prior to mid-1918 due to the transit time required to arrive in Europe [Reference Vaughn and Palmer22]. All soldiers and their military units were in constant motion from their home towns to training camps to ports of embarkation, to arrival in Europe and then to be moved forward to the trenches in northern France. Because of the timing of the two waves, it can be reasonably concluded that men dying of influenza in late 1918 at US military training camps were very likely to have been in their home town in early 1918, while those in training in early 1918 were most likely to have already arrived in Europe [Reference Brundage7, Reference Vaughn and Palmer22]. Using these general assumptions and the knowledge that recruits from rural areas died at higher ratios than those from urban areas, one can interpret the maps shown of Vermont and New York. The epidemic curves in Figure 2 show combat mortality occurring intermittently in middle to late 1918 whereas there was a single mortality peak for disease at the time of the wave in late 1918. County-level maps (Figures 3 and 4) show geographical heterogeneity and suggest soldiers in rural areas died at high rates, which is similar to county maps from Sweden [Reference McSweeny23–Reference Karlsson, Nilsson and Pichler25]. Less populated areas such as most of Vermont show a higher ratio of disease to combat deaths than most areas of the more densely populated New York. One way to explain the heterogeneity across the two states is to assume that the influenza virus of the wave in early 1918 penetrated poorly into rural areas and patchily into some urban areas as was described in retrospect in the 1920s [Reference Jordan8, Reference Opie EL9].
The influenza virus was not discovered until 1933, limiting the observations that were possible during the First World War. Military records were used in the current study primarily because they were prospectively collected in large populations for administrative reasons and are thus unlikely to be biased. Clearly mortality during the 1918 influenza pandemic was multi-factorial, likely predominantly due to secondary bacterial pneumonia, but the overall heterogeneity suggests highly variable susceptibility in the population. One primary cause for such heterogeneity could be variable exposure to a related but not identical influenza virus early in 1918. Infection in early 1918 could have provided sub-heterotypic immunity that prevented death but not infection in late 1918. If the influenza viruses of the two waves were closely related, then one would have expected to see much less disease in those who became ill in early 1918 when the lethal virus became prominent in late 1918. In populations such as the Australian Army and US Officer Cadet Training Colleges where respiratory morbidity and mortality can be determined on an individual soldier basis, no cross-protection between waves for morbidity was seen [Reference Shanks4, Reference Shanks16].
We suggest that the most parsimonious explanation of the heterogeneous mortality rates in similar military units during the late 1918 wave of influenza was that more than one influenza virus was circulating in 1918. The differences in mortality rates in late 1918 would thus be explained by different recent experience with influenza virus from the early 1918 wave. The two waves created very different mortality patterns in the British Army in France in 1918. The sparing of soldiers who grew up in urban environments relative to their rural neighbours could be an indication that the urban soldiers had much greater recent exposure to respiratory pathogens especially influenza in early 1918 whereas no such immunity was obtained by soldiers living in rural areas. Besides difficulty in explaining the concentration of mortality in young adults of military age, the great heterogeneity of mortality outcomes in populations who were all susceptible to infection in late 1918 remains one of the great remaining enigmas of the influenza pandemic of 1918.
SUPPLEMENTARY MATERIAL
For supplementary material accompanying this paper visit http://dx.doi.org/10.1017/S0950268814002805.
ACKNOWLEDGEMENTS
The Global Emerging Infectious Disease and Response System (GEIS) which is part of the Armed Forces Health Surveillance Center (AFHSC) of the U.S. Department of Defense provided funding for this project. The authors thank Alison MacKenzie for extensive technical assistance and the many un-named military historians, medical librarians and archivists who have unselfishly provided data and ideas for this study.
The opinions expressed are those of the authors and do not necessarily reflect those of the Australian Defence Force or the US Department of Defense.
DECLARATION OF INTEREST
None.


