


Social media summary
Sustainability can be assessed by non-declining inclusive wealth, which refers to produced, human and natural capital.
1. Introduction
In September 2015, the United Nations General Assembly adopted the 2030 Agenda for Sustainable Development Goals (SDGs). These goals range from responsible consumption and production, improvements in well-being, quality education and health to the protection of global assets, including oceans and a stable climate. As such, governments need a measure to monitor and judge whether the development programmes they undertake meet the SDGs (Dasgupta et al., Reference Dasgupta, Duraiappah, Managi, Barbier, Collins, Fraumeni and Mumford2015). Even though gross domestic product (GDP) is viewed as a good measure of economic activity, GDP ignores social costs, environmental impacts and income inequality. Oleson (Reference Oleson2011) also argued that GDP needs to be replaced by an alternative indicator if one wishes to measure real economic growth and well-being. We need indicators that promote truly sustainable development (i.e., development that improves the quality of human life while living within the carrying capacity of the supporting ecosystems; Costanza et al., Reference Costanza, Kubiszewski, Giovannini, Lovins, McGlade, Pickett and Wilkinson2014).
Acknowledging the need for sustainability measurement, the United Nations University International Human Dimension Programme and United Nations Environment Programme (UNU-IHDP & UNEP, 2014) made use of the concept of inclusive wealth (IW), which is the social value (not dollar price) of all productive assets and measures the determinants of well-being. As such, sustainability can be defined as a positive change in human well-being that is represented by non-decreasing IW, which refers to human capital, produced capital and natural capital. This framework offers a theoretically consistent measure of wealth as a key to sustainability evaluation (Kurniawan & Managi, Reference Kurniawan and Managi2017).
One of the indices closest to IW that covers both market and non-market assets is the World Bank's genuine savings (GS), formally known as adjusted net savings, which keeps track of savings in produced, human and natural capital (Yamaguchi et al., Reference Yamaguchi, Islam and Managi2019). It was introduced by Pearce and Atkinson (Reference Pearce and Atkinson1993) and then adopted by Hamilton and Clemens (Reference Hamilton and Clemens1999) and Arrow et al. (Reference Arrow, Dasgupta, Goulder, Daily, Ehrlich, Heal and Walker2004). Following this line of thinking, the IW approach was utilized by many stakeholders for the measurement of sustainability progress (see Polasky et al., Reference Polasky, Bryant, Hawthorne, Johnson, Keeler and Pennington2015; Sato et al., Reference Sato, Tanaka and Managi2018; Tokimatsu et al., Reference Tokimatsu, Dupuy and Hanley2019; Yamaguchi et al., Reference Yamaguchi, Islam and Managi2019), while related studies (see Dasgupta, Reference Dasgupta2014; Duraiappah & Muñoz, Reference Duraiappah and Muñoz2012; Ikeda et al., Reference Ikeda, Tamaki, Nakamura and Managi2017; Kurniawan & Managi, Reference Kurniawan and Managi2019; Managi & Kumar, Reference Managi and Kumar2018) were structured around both market and non-market assets of all types of capital that contribute to well-being. In addition to cross-country studies, IW is also utilized to measure regional wealth and to assess sustainability development. For instance, Yamaguchi et al. (Reference Yamaguchi, Sato and Ueta2016) measured the sustainability of Japan after the tsunami disaster at Miyagi Prefecture in 2011. In another instance, Acar and Gultekin-Karakas (Reference Acar and Gultekin-Karakas2016) measured Turkey's sustainability development. Mota et al. (Reference Mota, Domingos and Martins2010) estimated Portugal's sustainability development, and Ollivier and Giraud (Reference Ollivier and Giraud2010) assessed the sustainability of Madagascar. The indicator that was used in all of these studies was very close to that of IW. This index is increasingly recognized as an indicator of sustainability (Yamaguchi & Managi, Reference Yamaguchi and Managi2017).
Such an approach that calculates the amount of capital represents the productivity of well-being. It considers intergenerational well-being as a measure of sustainable development. In this formulation, a society's economic development is sustainable at a point of time if its wealth at constant shadow prices is non-decreasing. A non-declining IW implies the possibility of non-declining human well-being.
On the other hand, Arrow et al. (Reference Arrow, Dasgupta, Goulder, Daily, Ehrlich, Heal and Walker2004) argued that total factor productivity (TFP) plays an important role in the assessment of sustainability development by using GS. Utilizing TFP as an adjustment can provide a closer approximation of the real contribution of technological innovation and efficiency to production, as well as other implicit capital types that are not yet considered in assessing GS. By utilizing capital and labour as inputs, Arrow et al. (Reference Arrow, Dasgupta, Goulder, Daily, Ehrlich, Heal and Walker2004) found that the contribution of TFP to the GS growth rate is between 6.33% for China and –0.40% for the Middle East/North Africa. Arrow et al. (Reference Arrow, Goulder, Mumford and Oleson2012) also found that the contribution varied from –2.12% in Venezuela to 2.71% in China.
However, previous studies on utilizing TFP as an adjustment to IW ignored the contribution of natural capital as an input for productivity changes (Kurniawan & Managi, Reference Kurniawan and Managi2017). Recently, several researchers found that natural capital made a significant contribution to cross-country efficiency changes. Measuring environmental efficiency (EE) not only assesses the current state of the environment, but also provides valuable information for the improvement of environmental policies in the future. Brandt et al. (Reference Brandt, Schreyer and Zipperer2017) reported that the failure to take natural capital into account tends to lead to an underestimation of productivity growth. Thus, various methods have been developed to measure EE across countries and within regions. For instance, Hoang and Nguyen (Reference Hoang and Nguyen2013) suggested that the material balance-based EE method is useful in analysing possible trade-offs between cost and environmental performance. However, much of the EE method provides relative measures, which is a necessary, but not sufficient condition for achieving sustainability. At the same time, significant data limitations need also to be overcome before the EE method can be used to monitor progress towards sustainable development. In addition, a study by Tang et al. (Reference Tang, Tang, Xiao, Ma and Bethel2017) found that EE has a significant effect on both environmental and non-environmental TFP. They found that there is significant effect of environmental regulations on China's TFP and economic development level.
To fill the gap that exists in incorporating natural capital into TFP as an adjustment of IW, this study considers natural capital, including oil capital gain and other conventional inputs in order to measure productivity. By considering these inputs, we can analyse how countries differ with respect to the effective utilization of their productive assets, and we can understand why the same productive base of a country could lead to an increase or decrease in aggregate output over time depending on productivity changes as a result of the ways in which resources are used. Some countries use their endowed capital efficiently with appropriate productivity changes and future-orientated stock consumption schemes, while others do not use their capital as efficiently as they should.
To achieve this, we used a deterministic non-parametric analysis called the Malmquist Productivity Index (MPI), which is based on data envelopment analysis (DEA). This methodology is widely used in the measurement of productivity (for reviews, see Coelli et al., Reference Coelli, Rao and Battese1998; Färe et al., Reference Färe, Grosskopf, Norris and Zhongyang1994; Kerstens & Managi, Reference Kerstens and Managi2012; Malik, Reference Malik2015; Tanaka & Managi, Reference Tanaka and Managi2013). According to Stern (Reference Stern2005), DEA is a linear programming technique that allows both the frontier and the distance from the frontier of each country to vary in every time period in an arbitrary manner. Therefore, MPI based on the distance function is suitable for assessing the relationship between multivariate inputs and outputs for 140 countries from 1990 to 2010. In addition, the measurement takes into account the efficiency of resources used and productivity changes.
This paper is organized by first providing an overview of the literature focusing on sustainability and wealth, highlighting previous empirical research on cross-country productivity and examining the evolution of the method, which adds to the contribution of this study. Section 3 describes the methodology and data. Section 4 presents empirical results and an efficiency decomposition. The final section draws conclusions and suggests possibilities for extending this research.
2. Empirical research
There are several empirical studies that provide evidence for sustainable development on the basis of the historical average or current level of GS. For instance, Hamilton and Clemens (Reference Hamilton and Clemens1999) calculated the average GS for the 1970s and 1980s and provided some single-year values for the 1990s across countries. In order to determine whether each country was sustainable or not, they based their assessment on the GS indicator (either positive or negative).
Furthermore, Neumayer (Reference Neumayer2000) remodified the GS calculation method of the World Bank by introducing an alternative approach to computing resource depletion. He estimated the GS rates and considered their average as a benchmark of the sustainable development of a country. Based on his study of the World Bank database, he concluded that many Sub-Saharan African, Northern African and Middle Eastern regions would be considered unsustainable, in spite of the fact that, in reality, they were making a progress. Thus, he suggested that future research should find a better method for computing the net depreciation of the natural resource stock. In addition, Scheffer et al. (Reference Scheffer, Brock and Westley2000) also analysed the value of the ecosystem to society. They demonstrated that it is possible to extend the GS model to environmental problems. Islam and Managi (Reference Islam and Managi2019) argued that natural capital, which comprises natural resources, including land, forest, minerals and fossil fuels, is important for sustainable development. This is because natural resources provide great benefits and significance, both explicitly and implicitly, which are crucial for promoting the progression of the economy and human welfare. The framework of sustainable development needs to expand its scope not only economically and socially, but also environmentally (Clémençon, Reference Clémençon2012). Therefore, natural capital can be considered as a core criterion of proponents of strong sustainability. The excessive use of natural capital may cause a decrease in sustainability. Depleting a type of natural capital and substituting it with another form of natural capital or with produced capital is not sustainable in the strong sense (Islam et al., Reference Islam, Yamaguchi, Sugiawan and Managi2019).
On the other hand, there are several studies that have indicated that population growth can have an effect on IW, which refers in these cases to GS. For instance, Hamilton and Atkinson (Reference Hamilton and Atkinson2006) posited that positive GS or IW values depend strongly on population growth rates. Thus, Yamaguchi (Reference Yamaguchi2014) suggested the need to consider the effect of the population age distribution in IW accounting. Furthermore, Mumford (Reference Mumford2016) focused on Asian countries and found that there is a strong relationship between growth in GDP per capita and IW per capita. Nonetheless, all of these studies excluded TFP in their measurements.
Previous studies, including Arrow et al. (Reference Arrow, Dasgupta, Goulder, Daily, Ehrlich, Heal and Walker2004) and the Inclusive Wealth Reports (UNU-IHDP & UNEP, 2012, 2014), have suggested that TFP plays an important role in assessing sustainability development according to the GS method. This is because sustainability can be assessed by non-declining GS, which refers to human-made capital, human capital, natural capital and other types of capital that are sources of human well-being (Sato et al., Reference Sato, Tanaka and Managi2018). The amount of GS is calculated based on the weighted summation of all types of capital using shadow prices. In their study, Arrow et al. (Reference Arrow, Dasgupta, Goulder, Daily, Ehrlich, Heal and Walker2004) used capital and labour as the inputs and GDP as the output. They adopted TFP by using the conventional method of calculating TFP and merged the TFP data on human capital and produced capital based on Collins and Bosworth (Reference Collins and Bosworth1996) and Klenow and Rodriguez-Clare (Reference Klenow and Rodriguez-Clare1997). The results indicated that the contribution of TFP per capita to genuine wealth is between –0.40% (Middle East/North Africa) and 6.33% (China). In addition, Arrow et al. (Reference Arrow, Goulder, Mumford and Oleson2012) found the contribution to be between –2.12% (Venezuela) and 2.71% (China). However, in both of these studies, the authors did not consider the contribution of natural capital as an input for productivity measures.
In any case, none of these studies attempted to make any adjustments to TFP regarding natural capital or even to consider natural capital as an explicit factor of input. According to Jorgenson and Griliches (Reference Jorgenson and Griliches1967), the adjustment of capital stock data reflects changes in capacity utilization (CU). For instance, Denison (Reference Denison1979) used the variation in capital share income, and Norsworthy et al. (Reference Norsworthy, Harper and Kunze1979) adjusted productivity by selecting intervals from which CU is believed to be nearly 1. Morrison (Reference Morrison1985) attempted to adjust productivity changes by dividing productivity growth by cost for a CU measure.
Such results indicate a divergence in cross-country productivity, wealth and adjustment of capital stock productivity. However, to date, there has been no cross-country TFP analysis that considers natural capital as an explicit factor of input and includes oil capital gain as an adjustment. Several studies found that oil price plays a significant role in economic and productivity measurement. For instance, a study by Hesary et al. (Reference Taghizadeh-Hesary, Yoshino, Abdoli and Farzinvash2013) found that oil-producing countries such as Iran and Russia benefit from oil price shocks. For oil-consuming economies, the effect is more diverse. Estrada and Hernández de Cos (Reference Estrada and Hernández de Cos2011) suggested that fluctuations in oil prices can significantly affect potential output. In this respect, Finn (Reference Finn2000) showed theoretically how, under certain conditions, a permanent increase in oil price lowers the equilibrium level of the capital stock in the long term.
Therefore, in this study, we provide a deeper analysis of how each input and output affects countries’ performance and sustainability development by using an unconventional TFP measurement. Besides considering natural capital as an explicit factor of input, we incorporate oil capital gain as an adjustment to TFP.
3. Methodology and data
3.1. IW measurement
Aggregated capital is a term for inclusive investment, a key indicator of IW. According to Arrow et al. (Reference Arrow, Dasgupta and Mäler2003), an economy enjoys sustainable development if and only if its IW is at a constant price or does not decline relative to its population. IW is a measure of intergenerational well-being, where the accumulation of wealth corresponds to sustained development and is a key to economic progress (Dasgupta, Reference Dasgupta2007). Thus, we can define IW at the time t as Wt, which includes produced, human and natural capital. This can be defined as:
 $$W\lpar t \rpar = Q\lpar t \rpar t + \;\mathop\sum\nolimits_{i} P_{i\;}\lpar t \rpar \;K_{i\;}\lpar t \rpar = P_{PC}PC\lpar t \rpar + \;P_{HC}HC\lpar t \rpar + P_{NC}NC\lpar t \rpar \comma \;$$
where Q(t) is the shadow price of the time asset (TFP in our case). Each P is a shadow price of the capital asset, defined as δWt/δC, where K is each capital, which is PC(t), HC(t) and NC(t) representing produced capital, human capital and natural capital at time t, respectively. Therefore, the total capital asset comprises the resource base that is calculated by using the marginal contribution of each asset type to social welfare, which is represented by the social (or shadow) price of all of the assets under evaluation. This present value is called an asset's shadow price. Hence, an economy's IW is the shadow value of its productive base, and inclusive investment, IW(t), is the shadow value of the net change in its productive base (Dasgupta, Reference Dasgupta2008). All capitals are evaluated on the basis of each of their own accounting prices in the current period. The IW should always be positive in order to be sustainable in the future, or at least not decline over a period of time; thus, the sustainability condition can be expressed as:
 $$IW\lpar t \rpar \ge 0\; {\rm for\ all}\,t\lpar {{\rm time}} \rpar . $$
3.2. TFP measurement
To measure cross-country productivity, we adopt the MPI as described by Coelli et al. (Reference Coelli, Rao and Battese1998) and Färe et al. (Reference Färe, Grosskopf, Norris and Zhongyang1994) as a measurement of TFP in order to investigate whether there is any change in wealth when mapping capital assets (human capital, produced capital and natural capital). This is because the MPI is suitable for assessing the relationship between inputs and outputs under the multivariate input inefficiency. By using the MPI, technological progress and the inefficiency of resource use can also be estimated. Therefore, the MPI can be considered as the most suitable index for achieving the objectives of this research.
When calculating TFP, we applied produced, human and natural capital as a separate unit, with each capital as an input and GDP as an output. Because of the multivariate inputs (produced, human and natural capital), we adopted the non-parametric frontier analysis of DEA in order to measure TFP. By using the distance function specification, our problem can be formulated as follows:
 $$T\lpar t \rpar \equiv \lcub {\lpar {x_t\comma \;y_t} \rpar \colon\; x_t\;can\;produce\;y_t} \rcub .$$
In this case,  $x = \lpar {x^1\comma \;\ldots x^M} \rpar \in R_ + ^M $ and $y = \lpar {y^1\comma \;\ldots y^N} \rpar \in R_ + ^N $ are the input and output vectors, respectively. The technology set is defined by Eq. (2), which consists of all feasible input vectors, xt, and output vectors, yt, at time t. According to Managi (Reference Managi2011), the estimation of efficiency relative to the production frontiers relies on the theory of distance or gauge functions. In economics, distance functions are related to the notion of the coefficient of resource utilization (Debreu, Reference Debreu1951) and to efficiency measures (Farrell, Reference Farrell1957). This distance function defined t as:
 $$d^t\lpar {y_t\comma \;x_t} \rpar = min\lcub {\delta\; \colon \lpar {x_t\comma \;y_t/\delta } \rpar \in T\lpar t \rpar } \rcub \comma \;$$
where δ is the maximal proportional amount to which y t can be expanded given technology T(t). DEA and the output-orientated function are used in order to estimate the distance function under constant returns to scale by solving the following optimization problem (Managi, Reference Managi2003):
 $$d_{T\lpar t \rpar }\lpar {x_t\comma \;y_t} \rpar = max_{\delta \comma \lambda }\delta $$
 $$s.t\;Y_t\lambda \ge \displaystyle{{y_i^t } \over \delta }$$
 $$X_t\lambda \le x_i^t $$
 $$\lambda \ge 0.$$
From Eq. (3), δ is the measure of efficiency for country i in year t, λ is an N × 1 vector of weights and Y t and inputs X t are the vectors of outputs y t and inputs x t. In order to estimate productivity over time, several distance functions are used for the input–output vector for period t + 1 and technology in period t. The MPI (M 0) for the output-orientated productivity index is as follows:
 $$M_0\lpar {y_t\comma \;x_t\comma \;y_{t + 1}\comma \;x_{t + 1}} \rpar = \;\left[{\displaystyle{{d_o^t \lpar {y_{t + 1\comma \;}x_{t + 1}} \rpar } \over {d_o^t \lpar {y_t\comma \;x_t} \rpar }}\;\times \;\displaystyle{{d_o^{t + 1} \lpar {y_{t + 1\comma }x_{t + 1}} \rpar } \over {d_o^{t + 1} \lpar {y_t\comma \;x_t} \rpar }}} \right]^{{1 \over 2}}.$$
In Eq. (4), d represents the geometric distance to the frontier, which can be decomposed into efficiency change (i.e., catching up to the frontier) and technological change (i.e., change in the production frontier) (Färe et al., Reference Färe, Grosskopf, Norris and Zhongyang1994). Based on this formula, a country on the frontier will perform better under the same resource constraints than a country that is further away from the frontier. The estimation of this is performed by using DEA, which is a non-parametric estimation method. M 0 can be divided into two components: efficiency change represents the first ratio, while technological change represents the second. Based on this formulation, we estimate the MPI and estimated IW as follows:
 $$f\colon \lcub {\;P_{PC}PC\comma \;\;P_{HC}HC\comma \;\;P_{NC}NC} \rcub \;\,IW.$$
In this estimation, it is possible for two countries to have different levels of sustainable development, even if they have similar levels of capital assets. This is due to the fact that sustainable development is dependent not only on how the countries use their capital assets, but also on their different saving rates. The MPI is reformulated as follows:
 $$M_0\lpar {GDP_{i\comma t}\comma \;PC_{i\comma t}\comma \;HC_{i\comma t}\comma \;NC_{i\comma t}\comma \;GDP_{i\comma t + 1}\comma \;PC_{i\comma t + 1}\comma \;HC_{i\comma \;t + 1}\comma \;NC_{i\comma t + 1}} \rpar .$$
 $$\eqalign{&= \left[{\displaystyle{{d^t\lpar {GDP_{i\comma t}\comma \;PC_{i\comma t + 1}\comma \;HC_{i\comma t + 1}\comma \;NC_{i\comma t + 1}} \rpar } \over {d^t\lpar {GDP_{i\comma t}\comma \;PC_{i\comma t}\comma \;HC_{i\comma t}\comma \;NC_{i\comma t}} \rpar }}\;}\right\cr& \left{\times \;\displaystyle{{d^{t + 1}\lpar {GDP_{i\comma t + 1}\comma \;PC_{i\comma t + 1}\comma \;HC_{i\comma t + 1}\comma \;NC_{i\comma t + 1}} \rpar } \over {d^{t + 1}\lpar {GDP_{i\comma t}\comma \;PC_{i\comma t}\comma \;HC_{i\comma t}\comma \;NC_{i\comma t}} \rpar }}} \right]^{{1 \over 2}}.}$$
Eq. (6) indicates the feasibility of producing goods with fewer inputs. Where d is the geometric distance to the production frontier, it represents the best available technology for the given inputs and output. The country under analysis in this research refers to i, which runs from 1 to 140 countries in our sample. This index is measured by the ratio between 2 years; thus, a value greater than 1 represents an improvement or otherwise in the TFP calculation. Using this index allows us to examine TFP's contribution to IW by country.
3.3. IW adjusted by TFP measurement
By using the new TFP results and based on the IW methodology, we estimated each country's IW-TFP Adjusted for the years 1990–2010. We did so by using the annual average of IW per capita and estimated the percentage change of TFP on the IW as the sustainability indicator. In order to estimate the IW-TFP Adjusted, we calculated the growth rate of IW per capita. We also followed the same process as Arrow et al. (Reference Arrow, Dasgupta, Goulder, Daily, Ehrlich, Heal and Walker2004) with the compromise of the use of TFP growth from Collins and Bosworth (Reference Collins and Bosworth1996), which was based on GDP output. According to the framework of sustainable development, the IW-TFP Adjusted should be maintained at a positive and non-declining state. The calculation is as follows:
 $$IW-TFP\;Adjusted = IW + TFP \comma \;$$
where IW-TFP Adjusted is the inclusive wealth adjusted with total factor productivity, IW is the inclusive wealth growth per capita and TFP is the total factor productivity growth.
Based on the TFP results from 1990 to 2010, we measured not only IWI-TFP Adjusted, but also how countries’ performance affected IW after three main factors were taken into consideration. Those three factors are as follows: (1) climate change, particularly the damage suffered as a result of increased atmospheric carbon; (2) TFP's contribution to multiple factors missing from economic growth; and (3) oil capital gains related to the change in oil prices, which may either increase or decrease a country's productivity value.
Based on the 2012 and 2014 Inclusive Wealth Reports (UNU-IHDP & UNEP, 2012, 2014), we refer to this adjusted figure as the Inclusive Wealth Index Adjusted (IWI Adjusted). We measured the change in wealth for 140 countries over 21 years on a per capita basis. In order to estimate the change in wealth, we calculated the average annual growth rates in wealth and population. According to the framework of sustainable development, the IWI Adjusted should remain positive and non-declining. The calculation is as follows:
 $$IWI\;Adjusted = IW + C + E + TFP\comma \;$$
where IWI Adjusted is the Inclusive Wealth Index Adjusted, IW is the inclusive wealth per capita, C is the carbon damage, E is the energy depletion (i.e., oil capital gain) and TFP is the percentage of TFP growth.
Based on the adjustment set forth above, the IWI Adjusted can have either a positive or a negative effect on countries’ IW. According to Nordhaus and Boyer (Reference Nordhaus and Boyer2000), climate change will benefit some countries, whereas others will experience a negative impact. In terms of oil price fluctuations, normally countries that are considered as oil producers will realize the advantages and positive changes in wealth compared to countries that depend on oil imports.
3.4. Data
For the sources of these data, we refer to the 2014 Inclusive Wealth Report published by UNU-IHDP and UNEP (2014). This dataset provides quantitative information on data for 140 countries from 1990 to 2010. As noted above, the accounting shadow balance sheet included as inputs here consists not only of produced capital and human capital, but also natural capital. To measure natural capital wealth, fossil fuels (oil, coal and natural gas), minerals (nickel, gold, silver, iron, lead, tin, zinc, phosphate, copper and bauxite), forest resources (timber and non-timber) and agricultural land (cropland and pastureland) are used. For human capital wealth, the calculation uses education attainment and the additional compensation over time as developed by Arrow et al. (Reference Arrow, Goulder, Mumford and Oleson2012). The BP Statistical Review of World Energy (BP, 2013) is used for the prices of coal, natural gas and oil. Equipment, machinery and road data are calculated for produced capital. In this research, we utilized GDP as an output. All capital wealth in this calculation is in millions, constant 2005 US dollars.
4. Empirical results
4.1. Total factor productivity
Based on the estimating procedure explained in Section 3, we estimated each country's TFP, efficiency change and technological change for the 21 years included in the dataset. The means of each country's TFP change, efficiency change and technological change from 1990 to 2010 are presented in Figure 1 and Table 1.
Average of total factor productivity (TFP) for 140 countries (1990–2010).

Ranking and summary of estimated total factor productivity (TFP).

Table 1 and Figure 1 show the TFP changes for the 140 countries from 1990 to 2010. The countries in Table 1 are presented in descending order based on the magnitude of TFP changes. Table 1 shows Singapore and China as the two countries with the highest TFP growth. Singapore shows a 10.0% average growth in TFP (caused by steady growth in efficiency) and a 10.0% growth in technological change. The high TFP growth of Singapore has contributed to its rapid economic development. According to Han (Reference Han2017), the rapid economic development of Singapore can be attributed to its technocratic strategy and its environmental policy, which have led to its international reputation as a model green city due to its remarkable expansion of green spaces and infrastructure. Australia, the UK, India and Japan demonstrated TFP growth rates of 0.5%, 3.2%, 0.8% and 0.5%, respectively. The unweighted average growth in TFP across the 140 countries was 0.7%.
Figure 2 shows the annual mean TFP change, technological change and efficiency change over the entire study period (1990–2010) for the 140 countries. On average, TFP values increased in many countries throughout the period of study. The worst TFP change during the study period was from 2008 to 2009 and is attributable to the global financial crisis. The greatest technological and efficiency changes were in 1992–1993 and 2002–2003, respectively.
Mean total factor productivity (TFP) change, efficiency change and technological change (1990–2010).

Table 2 shows the mean TFP change, efficiency change and technological change results based on the different regions from 1990 to 2010. It is clear that Asia demonstrated the greatest TFP growth (1.0%), followed by Latin America and the Caribbean (0.9%). North America showed the lowest (and decreasing) TFP, followed by Europe (0.1%).
Means of total factor productivity (TFP), efficiency change and technological change (1990–2010) based on regions.
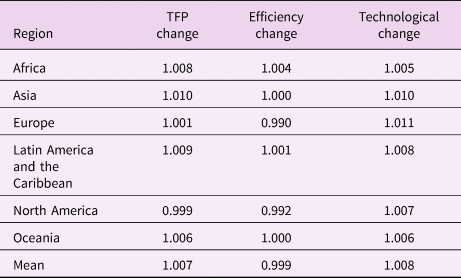
Figure 3 shows the cumulative TFP indices from 1990 to 2010 based on six regions. Asia clearly experienced the greatest cumulative growth, especially in 2010, followed by Africa, Latin America and the Caribbean. North America and Oceania were at the bottom, whereas Asia still experienced the greatest cumulative growth compared to global growth in TFP. According to Clémençon (Reference Clémençon1997), economic integration and free trade might have been the factors that further boosted the economic growth of Asian countries, especially in the Association of Southeast Asian Nations (ASEAN). Sonnenfeld and Mol (Reference Sonnenfeld and Mol2006) argued that the Asia-Pacific region is unquestionably one of the most economically dynamic areas in the world. For instance, countries such as China, India, Malaysia, Vietnam and Thailand demonstrated steady economic growth over the two decades, even while facing the financial crisis of the late 1990s.
Mean total factor productivity (TFP) change in six regions (1990–2010).

4.2. IW-TFP Adjusted
Using the results of the new TFP and based on the method described in Section 3, we estimated each country's IW-TFP Adjusted for 1990–2010. In this study, we used each annual per capita IW and estimated the percentage change in TFP on the IW as an indicator of sustainable development. We calculated the growth rate of per capita IW in order to estimate the IW-TFP Adjusted. We followed the same process as in Arrow et al. (Reference Arrow, Dasgupta, Goulder, Daily, Ehrlich, Heal and Walker2004) through the use of TFP growth from Collins and Bosworth (Reference Collins and Bosworth1996), which is based on GDP output. The results for the IW-TFP Adjusted are shown in Table 3.
Result of inclusive wealth with total factor productivity adjusted (IW-TFP Adjusted) per capita and percentage of change.

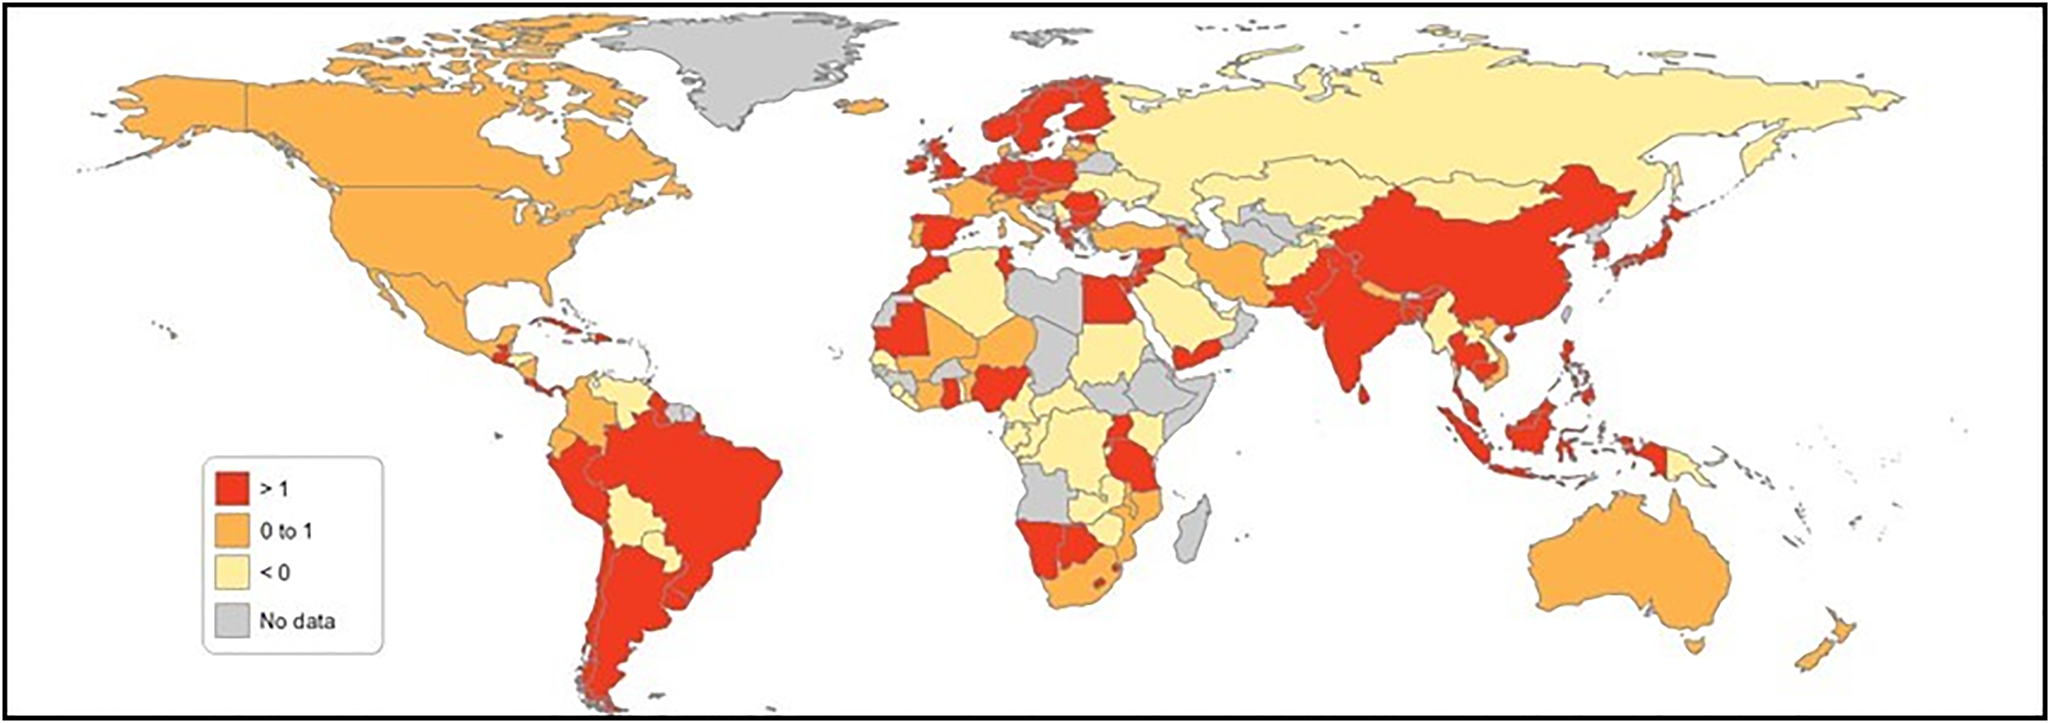
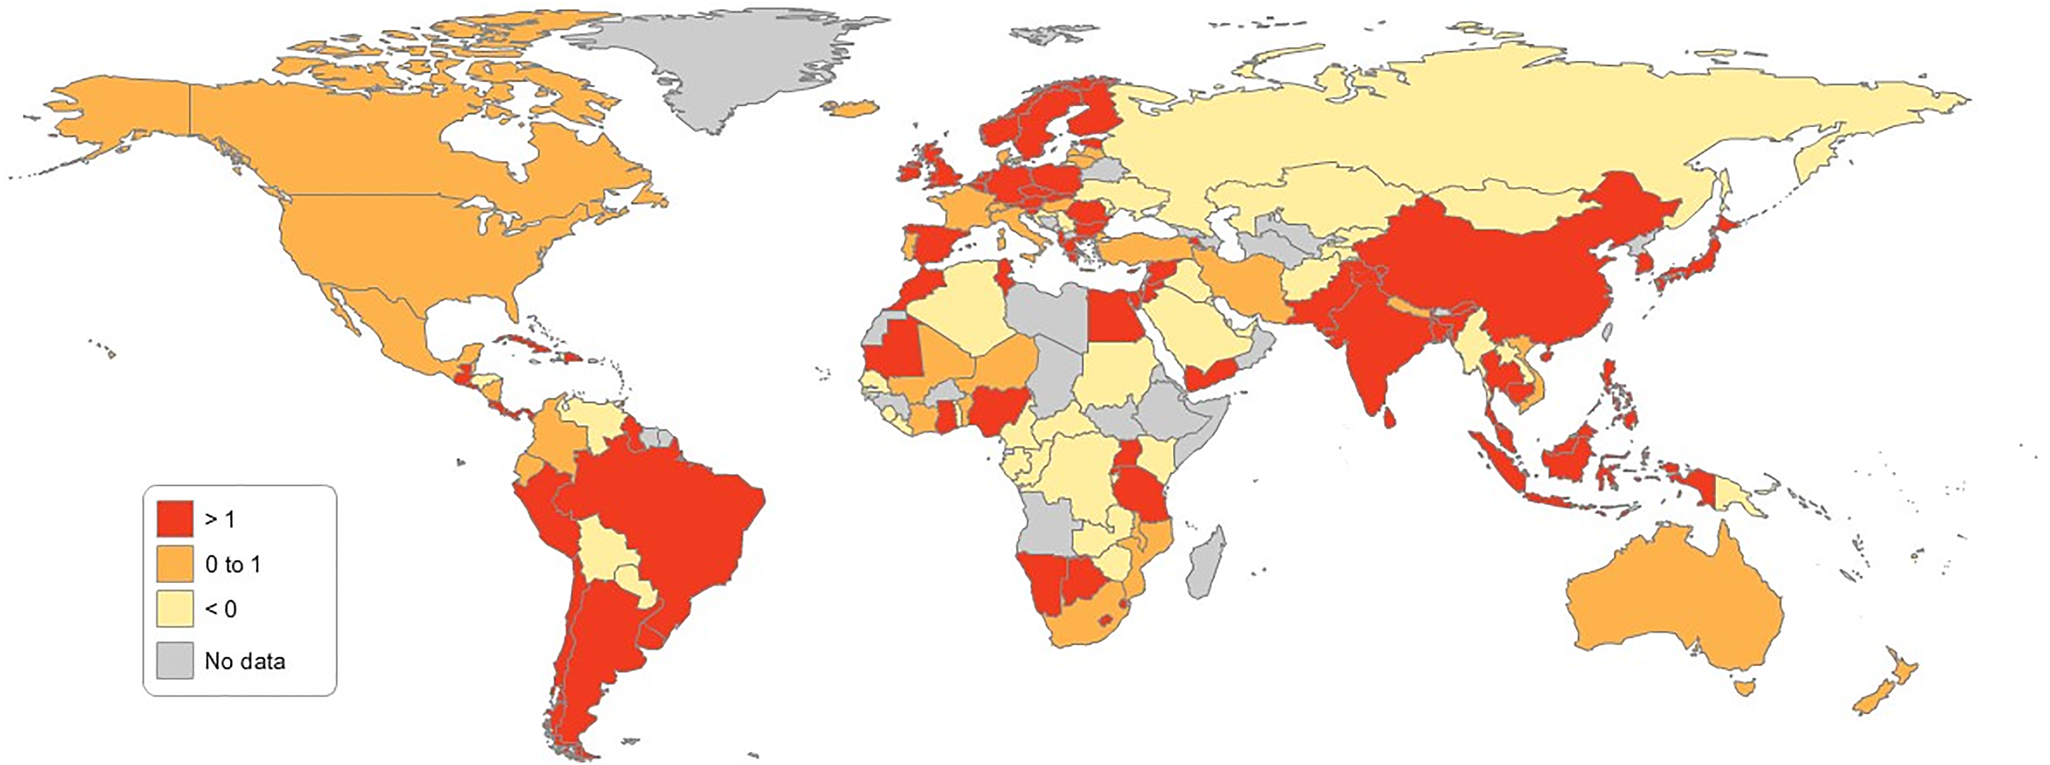
Table 3 shows the post-IW-TFP adjustment figures for the 140 countries over 21 years from 1990 to 2010. Table 3 demonstrates that among those 140 countries, 100 countries, representing 71% of nations, showed a positive IW-TFP Adjusted. Before adjustment, 85 countries demonstrated positive IW; after modification, 25 countries moved from the negative to the positive bracket, and only 10 nations experienced the reverse. Belize, Benin, Botswana, Cambodia, Colombia, Côte d'Ivoire, Ecuador, Ghana, Guyana, Indonesia, Iran, Malawi, Mali, Mozambique, Namibia, Nepal, Nicaragua, Niger, Nigeria, Peru, the Syrian Arab Republic, Tanzania, Trinidad and Tobago, Uganda and Yemen moved from negative to positive. Croatia, Gambia, Haiti, Jamaica, Kazakhstan, Kenya, Kyrgyzstan, the Russian Federation, Serbia and Ukraine moved from positive to negative. The movement of several countries from negative to positive positions proved that TFP can also be considered as one of the factors that has an impact on these results. Figures 4 and 5 show the percentages of growth rate (per capita) on IW before and after TFP adjustment.
Percentage of growth rate (per capita) on inclusive wealth before IW-TFP Adjusted.

Percentage of growth rate (per capita) on inclusive wealth after IW-TFP Adjusted.
4.3. IWI Adjusted
We also measured how countries’ performance was affected by three main factors (carbon damage, oil capital gains and TFP) that were taken into consideration for the adjustment. We refer to this new adjustment as IWI Adjusted and measure all of the countries in the sample on a per capita basis. We also calculated the annual average growth rate in wealth and population in order to estimate the change in wealth.
Before the new adjustment, 55 countries experienced negative growth per capita IW, representing almost 39% of the 140 countries in this study. A total of 85 out of the 140 countries showed a positive growth rate in wealth, representing almost 77% of the total sample. After adjusting three main factors (carbon damage, oil capital gains and the latest TFP results), the number of countries showing positive growth rates in wealth increased from 85 to 101. Twenty-seven countries moved from the negative to the positive bracket after the wealth adjustment. The following 11 countries moved from the positive to the negative bracket after all three factors were taken into consideration: Croatia, Gambia, Haiti, Jamaica, Kenya, Kyrgyzstan, Latvia, Portugal, the Russian Federation, Serbia and Ukraine. Of the 140 countries, 40 (almost 29%) remained in the negative bracket after the adjustment. These 40 countries were confronted by long-term issues related to sustaining their current consumption patterns.
Figures 6 and 7 show that the following 27 countries moved from the negative to the positive bracket after all three factors were adjusted: Algeria, Botswana, Cambodia, Colombia, Ecuador, Ghana, Guyana, Indonesia, Iran, Iraq, Kuwait, Malawi, Mali, Namibia, Nicaragua, Niger, Nigeria, Peru, Qatar, Saudi Arabia, Sudan, the Syrian Arab Republic, Trinidad and Tobago, Uganda, the United Republic of Tanzania, Venezuela and Yemen. Both Figures 6 and 7 show the percentages of growth rate (per capita) on IW before and after the three-component adjustment.
Percentage of growth rate (per capita) on inclusive wealth before IWI Adjusted.

Percentage of growth rate (per capita) on inclusive wealth after IWI Adjusted.
Among the three main factors, TFP had the largest contribution by moving 25 countries from the negative to the positive bracket after the energy depletion factor took oil capital gains into consideration. In the case of climate change, most of the countries in this study experienced a negative impact. Thus, TFP can be considered as one of the factors that significantly contributes to several countries’ movement from the negative to the positive bracket. Table 4 shows the results of TFP Adjusted per capita after three main factors were taken into consideration (as explained in Section 3.3) and its percentage change.
Results after total factor productivity adjusted (TFP Adjusted) per capita and percentage of change.

4.4. G7 countries
In this study, we also learned something about the major development economies of the G7 countries. There are seven countries in the G7: Canada, Japan, France, Germany, Italy, the UK and the USA. Figure 8 shows the wealth composition of the G7 countries from 1990 to 2010. Most of the G7 countries have human capital advantages that can be considered as major contributors to their TFP and economic growth. In the case of Canada, its natural capital represents the second-highest wealth contribution after human capital, representing 31% of Canada's IW. The UK's growth in productivity contributes more than its human capital. This success can be attributed to tougher competition in the product and labour markets, an increase in higher education and the faster adoption of information, communication and innovation policies (Aghion et al., Reference Aghion, Beesley, Browne, Caselli, Lambert, Lomax and van Reenen2013).
Percentage of wealth composition of the G7 countries (1990–2010).
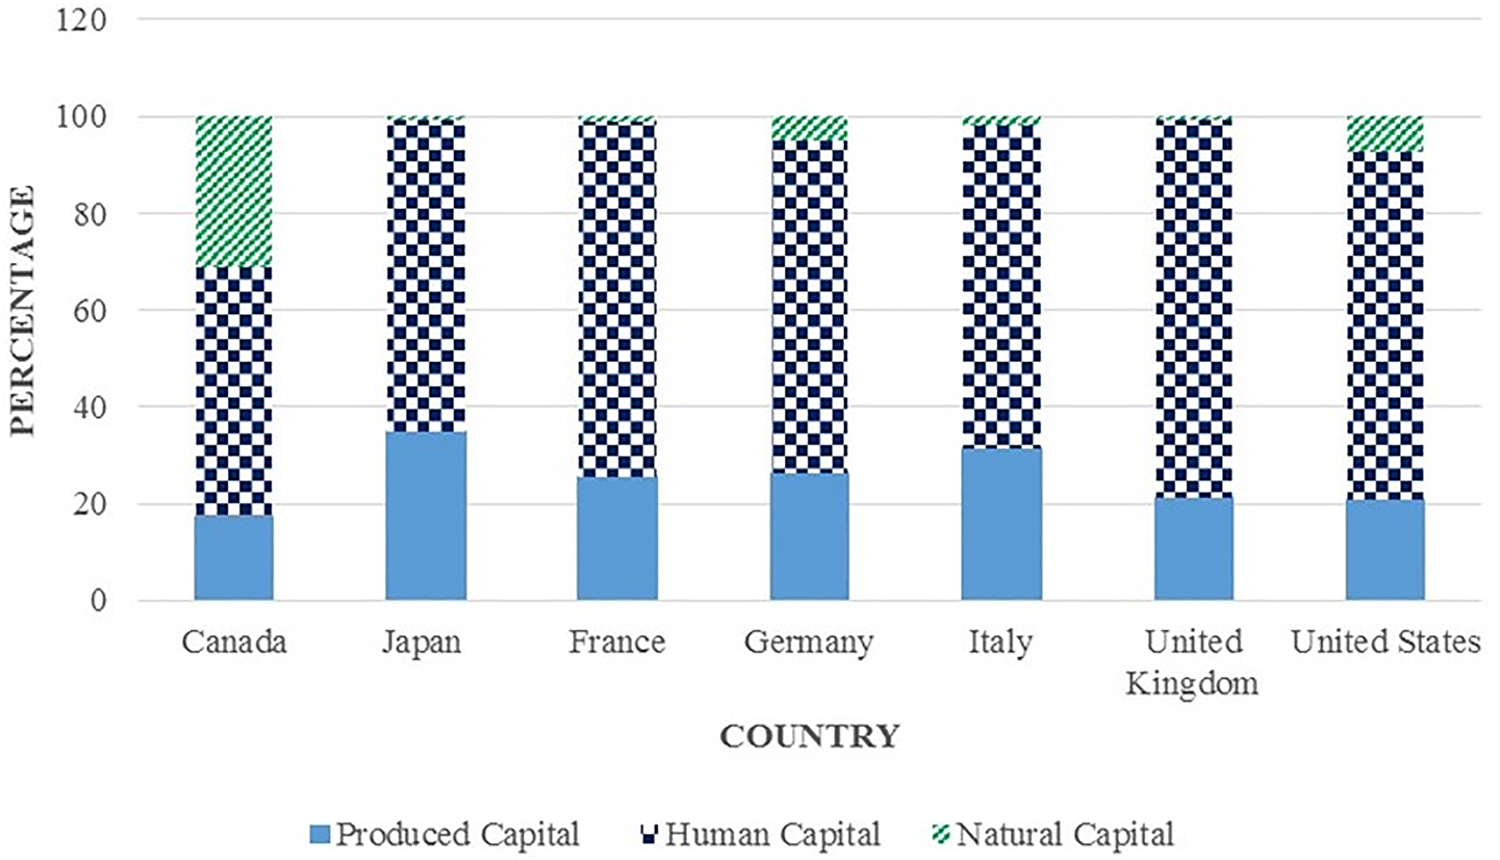
The combination of human and produced capital in Japan has supported its growth and efficiency increase in other components throughout the study period. This is due to the fact that labour productivity in Japan after 1995 has been attributed to a compositional shift in the labour market to increase the amount of higher-quality labour due to a greater demand for higher education (Chun et al., Reference Chun, Tsutomu, Pyo and Konomi2015). The UK has the highest amount of human capital in the G7 at 78% of total wealth, followed by France at 73%. Therefore, human capital is the foremost contributor to the IW growth rates for all of the G7 countries. On average, human capital contributed to 68% of overall IW, whereas produced capital contributed to 25% and natural capital contributed to 7% if we look at all of the G7 countries as a single group.
The TFP growth of the G7 countries has undergone a powerful revival since 1990, as is depicted in Figure 9. The TFP growth rate, which considers natural capital as an input, shows that the UK's TFP growth rate pattern has increased. The UK's TFP growth based on IW in 1990–1991 occur as rapidly as France and Germany, but its progress continued from 1992 to 2010. Although France and Germany started the 20-year period ahead of the UK, the UK finished ahead by 2010. The trend in TFP growth among the G7 countries since the mid-1990s has attracted significant attention because labour productivity growth represents an important factor in economic growth stability (Jablanovic, Reference Jablanovic2012).
Total factor productivity (TFP) growth of the G7 countries (1990–2010).
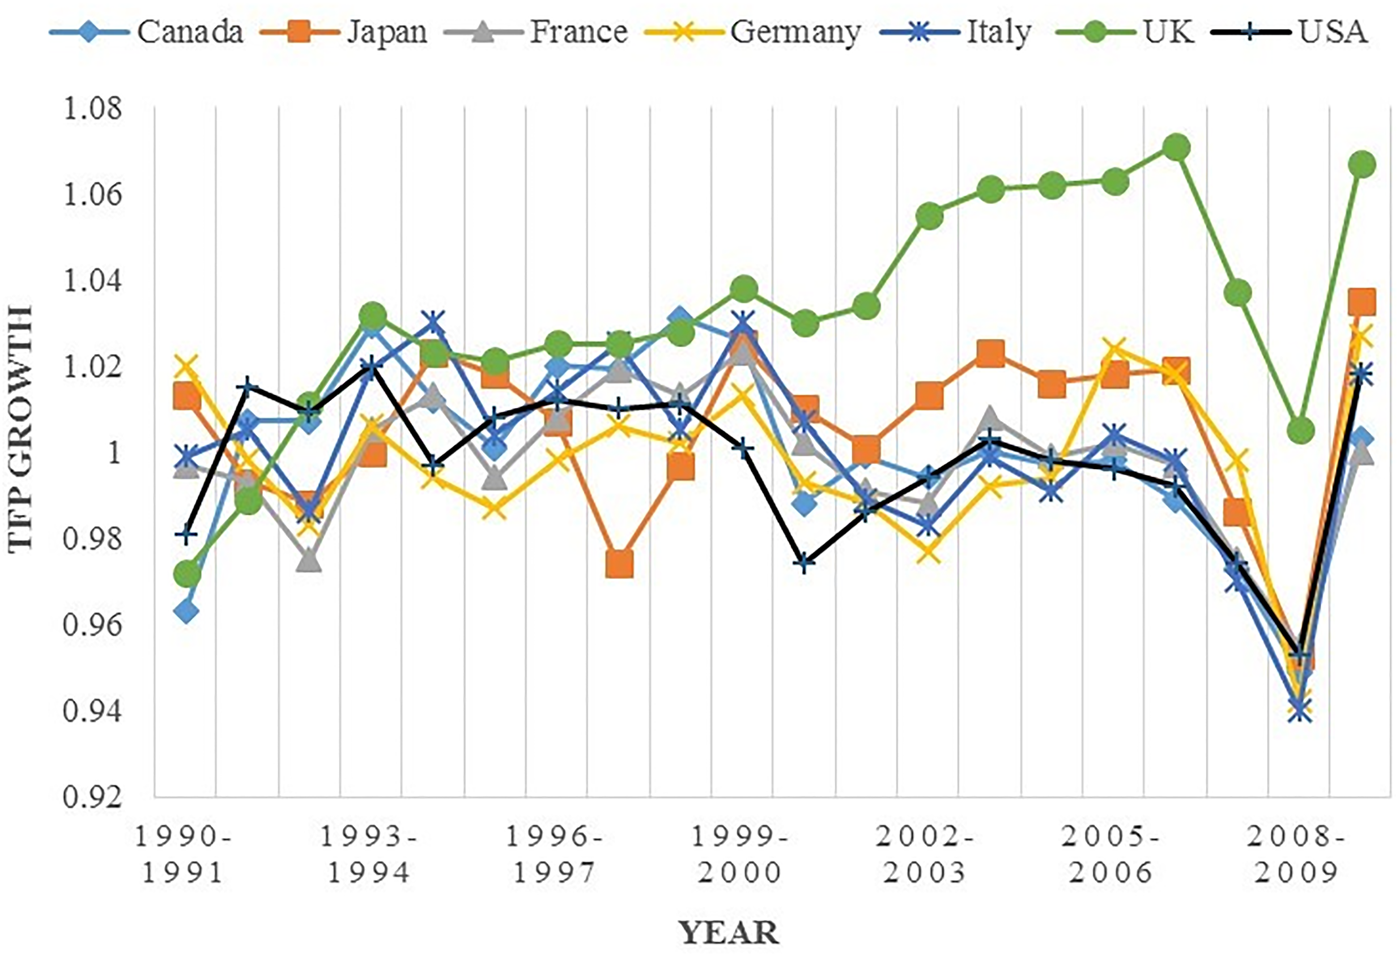
The UK's TFP growth exceeded that of the USA from 1992. Although the entire G7 suffered during the financial crisis of 2008–2009, the UK continued to enjoy the greatest TFP growth in the G7. From 2005 to 2010, TFP growth for most of the G7 countries was slowed considerably by the global financial and economic crisis of 2008–2009. Recovery from the Great Recession of 2007–2009 by the USA, Japan, Canada and the four European economies of the G7 has been slow and irregular (Jorgenson & Khuong, Reference Jorgenson and Vu2013). The Asian currency and financial crises of 1997 and 1998 affected Japan's TFP growth more than that of the other G7 countries because Japan is the only Asian country in the G7. Japan recovered from the Asian financial crisis, and in 1999, Japan's TFP growth was greater than that of France, Germany and the USA. Japan's TFP growth was revived from 2000 to 2010, and Italy showed the weakest performance during the global crisis.
5. Conclusion
This study has combined the concept of IW, including natural capital, as an input with an adjustment of oil capital gain in productivity measurement. We utilized the MPI in order to measure cross-country productivity accounting during the 1990–2010 study period.
The TFP results from using GDP as an output and IW (human, produced and natural capital) as an input showed significantly different results from conventional residual-type or GDP production function-type TFP calculations among the 140 countries. The growth in TFP also depends on the contribution of two components, namely countries’ efficiency change and technological change. Meanwhile, natural capital, including oil capital gain related to the change in oil prices, is significant in influencing the productivity value of a country.
In this study, for most countries, we found that the contribution of human and produced capital is greater and contributes more to productivity than the contribution of natural capital from 1990 to 2010. However, the loss of natural capital is not high enough to compensate for both human and produced capital. Therefore, it is suggested, for example, that countries investing in natural capital should compensate for human capital development and non-renewable natural capital depletion and return to a sustainable agenda. For instance, in the Russian case, there was a significant link between global oil prices and the productivity output of the Russian economy. It is suggested that countries such as Russia need to reduce the dependence of their economy on the global trade environment, especially oils or fuels, in order to achieve sustainable development.
This study also presents several important findings for economic policy evaluation and planning. In general, a country must target not only GDP growth as a primary policy objective, but also move towards incorporating IW into the measurement of TFP for a country's sustainable development that is striving to improve the citizens’ ‘well-being’. This finding suggests that IW is useful in assessing sustainable development. For future studies, more sophisticated research with an expanded dataset is needed, such as research that includes more countries, years and factors (e.g., renewable energy stock and health in human capital).
Acknowledgements
IAJ received scholarship support from the Malaysian Ministry of Higher Education (MoHE) and Universiti Teknikal Malaysia Melaka (UTeM) throughout the study period.
Author contributions
IAJ and SM developed the concept and design of the study. IAJ conducted the study, participated in the data collection, analysed and interpreted the data and wrote the manuscript. IAJ and SM critically revised and edited the draft of the manuscript. All authors have read and approved the final version of the manuscript.
Financial support
This work was funded by the Grant-in-Aid for Specially Promoted Research (26000001) by the Japan Society for the Promotion of Science. We also thank the Japanese Ministry of the Environment for financial support through the Environment Research and Technology Development Fund (S-14, S-15, S-16) and Policy Research of Environmental Economics FY2018–2020.
Conflict of interest
None.
Ethical standards
This research and article complies with Global Sustainability's publishing ethics guidelines.


 Open access