


Introduction
In recent years, Universal Basic Income (UBI) has featured in public and political debates as a way to reform welfare states. Intending to provide an unconditional income to all citizens, the policy managed to attract attention from journalists (Perkiö et al., Reference Perkiö, Rincón and van Draanen2019) and policy makers (Browne and Immervoll, Reference Browne and Immervoll2017; Perkiö, Reference Perkiö2020) in various counties. In conjunction with this newfound attention, pilot projects have been conducted in various developed democracies, including Finland (De Wispelaere et al., Reference De Wispelaere, Halmetoja and Pulkka2018) and the United States (Baker et al., Reference Baker, Martin-West, Samra and Cusack2020). The debate surrounding UBI has also featured prominently in the Netherlands: after an initial wave of attention in the early 1980s (Groot and van der Veen, Reference Groot, van der Veen, van der Veen and Groot2000), a second discussion erupted in the period 2014-2016 (see Bregman, Reference Bregman2014), culminating in a number of experiments with unconditional social assistance (Groot et al., Reference Groot, Muffels and Verlaat2019; van der Veen, Reference van der Veen2019).
In spite of the apparent appeal, however, UBI faces a political stalemate that seems hard to overcome. The momentum for UBI policy is met with resistance from both publics and politics on the way to its implementation. The Swiss referendum to implement a UBI was comfortably rejected (Liu, Reference Liu2020), and the experiments with unconditional social assistance in Finland and the Netherlands seem to have had little impact on the political coalition surrounding UBI, especially on the national level (but see Roosma, Reference Roosma2022).
On the surface, this lack of support seems difficult to understand. UBI policy has been heralded as “beyond left and right” (Reed and Lansley, Reference Reed and Lansley2016) because it could unite the three central fractions in welfare politics (see Schwander and Vlandas, Reference Schwander and Vlandas2020): UBI would protect workers from capitalist exploitation, while increasing individual freedom and promoting work and social participation. Some have argued that the guaranteed income security provided by UBI strengthens the bargaining power of workers versus employers (Wright, Reference Wright2006; see also van der Veen and van Parijs, Reference van der Veen and van Parijs1986). Others have made the case for UBI as a libertarian policy that affords “real freedom” from the work obligation (van Parijs, Reference van Parijs1991; Fromm, Reference Fromm1966). Others still have taken a position of social investment, arguing that UBI stimulates sustainable employment and other valuable social activities by removing work disincentives from the existing system of social security (e.g. Friedman, Reference Friedman2013; see also Perkiö, Reference Perkiö2020). A content analysis of tweets (Gielens et al., Reference Gielens, Roosma and Achterberg2022) shows that these three frames are also central controversies in the Dutch UBI debate. From the ‘beyond left and right’ perspective, the applications of these strands of ideology to UBI policy implies “support across the political spectrum, from right and left, from pro-marketeers as well as social democratic interventionists” (Reed and Lansley, Reference Reed and Lansley2016; see also Barry, Reference Barry1996:3; Torry, Reference Torry2016:168; Purdy, Reference Purdy, Widerquist, Noguera, Vanderborght and De Wispelaere2013:483). Its advocates consequently argue that UBI has “unique potential (…) as the basis for a coalition of supporters from left and right” (Murray, Reference Murray2008).
Others have been more skeptical, arguing that these three policy goals – security, freedom and efficiency – are not always complementary, refering to distinct and even incompatible policy proposals (e.g. Chrisp and Martinelli, Reference Chrisp and Martinelli2019; De Wispelaere, Reference De Wispelaere2016; De Wispelaere and Stirton, Reference De Wispelaere and Stirton2004). For example, these authors argue that, depending on the level of the grant, replacement of existing benefits and the funding mechanism, UBI policy can either increase income security and ‘decommodify’ work, or inversely, retrench the welfare state and strengthen activating work incentives. The existence of different interpretations of UBI policy also explains why UBI has been opposed in the past by an unlikely coalition of trade unions (e.g. Vanderborght, Reference Vanderborght2006) and liberal-conservatives (Groot and van der Veen, Reference Groot, van der Veen, van der Veen and Groot2000:200). De Wispelaere and Stirton (Reference De Wispelaere and Stirton2004) have referred to the coexistence of multiple interpretations as “many faces” perspective on UBI. In this paper we analyze the coalitional structure of the UBI debate on Dutch Twitter, contributing to the literature in two ways. First, analyzing discursive coalitions provides a nuanced descriptive account of UBI support amongst the (Twitter) publics and political parties – i.e. what arguments unites and divides proponents and opponents. Twitter is not representative of the overall political debate, but constitutes a unique amalgamation of influencers from the public, politics and media. As such, the analysis complements narrative accounts that reflect on coalitional aspects of the UBI debate (e.g. Groot and van der Veen, Reference Groot, van der Veen, van der Veen and Groot2000; Sloman, Reference Sloman2018; Vanderborght, Reference Vanderborght2006) and representative survey studies on the public legitimacy of UBI (e.g. Roosma and Van Oorschot, Reference Roosma and Van Oorschot2020; Busemeyer and Sahm, Reference Busemeyer and Sahm2021; Rincón et al., Reference Rincón, Vlandas and Hiilamo2022, Stadelmann-Steffen and Dermont, Reference Stadelmann-Steffen and Dermont2020). Second, in identifying these coalitions, the analysis accounts for the different interpretations of UBI policy that may feature in the debate. Framing studies already show that frames regarding security, freedom and efficiency are employed in newspaper articles (e.g. Perkiö, Reference Perkiö2020; Perkiö et al., Reference Perkiö, Rincón and van Draanen2019; Steensland, Reference Steensland2008) and even in the debate at hand (Gielens et al., Reference Gielens, Roosma and Achterberg2022). However, the focus on individual frames ignores the relation between frames, i.e. what combinations of frames are endorsed or opposed by the same actors. Even though many frames feature in the discussion, we do not know to what extent they are used in conjunction – as suggested by the ‘beyond left and right’ thesis – or in isolation – as implied by the ‘many faces’ interpretation. Similarly, we do not know which frames unite and divide proponents and opponents. To these ends, we specifically aim (a) to identify the substantive positions of proponents and opponents in the UBI debate, and (b) to connect these substantive positions to their endorsement by political elites.
Based on this outline we draw up some contrasting expectations regarding the coalitional structure of the UBI debate, presented in Table 1. The coalitional structure of the debate can be understood in two ways. First, discussants may agree substantively on their position towards UBI. UBI is ‘beyond left and right’ if discussants tend to combine socialist, liberal and social investment perspectives on UBI. UBI has ‘many faces’ when discussants tend to endorse some perspectives but not others. Second, the endorsement of positions by political representatives indicates a potential political alliance with respect to UBI. In this sense, UBI is ‘beyond left and right’ if political representatives from various party families endorse the same substantive position. UBI has ‘many faces’ when political representatives are divided between positions along party lines.
We employ discourse network analysis (Leifeld Reference Leifeld2017) to model frames and actors in a UBI debate on Dutch Twitter. The method is designed specifically to combine the analysis of frames and actors, by connecting actors based on how strongly they agree or disagree across various arguments. It allows us to measure substantive positions for individual participants, and cluster participants based on the similarity of their arguments. We opt for Twitter because UBI went ‘viral’ on Twitter several times, preceding extensive traditional media coverage and the “basic income inspired” trust experiments (see Groot et al., Reference Groot, Muffels and Verlaat2019). Twitter is also a particularly political medium, with many politicians attending and contributing to discussions. In spite of (or perhaps because of) being a selective and elite group of people, the most recent Dutch discussion on UBI took place especially on Twitter.
In the remainder of this paper we first elaborate the context of the Dutch UBI debate, after which we present the data and methods used in this analysis. Next, in the results section we discuss the identified positions and the political elites endorsing them. We find a proponent coalition that adopts a substantive position ‘beyond left and right’, which is endorsed almost exclusively by (green-)leftist political elites. Opponents feature both (socialist) leftist and rightist elites, and despite substantial disagreement they are united by their dedication to the work obligation and their concern over higher income taxes. The substantively cross-partisan substantive position of proponents has not attracted a cross-partisan coalition of political actors.
The Dutch UBI debate in context
The involvement of political elites in the Dutch Twitter debate should be placed both in the context of contemporary welfare coalitions and the history of UBI debate in the Netherlands. As in many other European countries, contemporary welfare coalitions in the Netherlands revolve around social investment and active labour market policies (Hemerijck, Reference Hemerijck2018; Gilbert, Reference Gilbert2002). These policies intend to enable and incentivize labour market participation, on the one hand through childcare services and education and on the other hand by emphasizing the responsibility of citizens to contribute in the form of paid employment or caring tasks (Verhoeven and Tonkens, Reference Verhoeven and Tonkens2013). This new ‘participation’ welfare was established primarily by liberal-led coalitions since the turn of the century, although these policies have been backed by both conservative and labour parties as well. The social investment turn can be considered a welfare compromise, because enabling policies mainly cater to the new middle classes and the employers collective, while simultaneously appealing to the pro-work values of the working classes (Gingrich and Häusermann, Reference Gingrich and Häusermann2015:52-5). Still, the parties differ in their emphasis of welfare aspects, which relates to their historical role in the welfare debate. Leftist parties still value providing minimum income protection for the poorest in society, while liberal and conservative parties have taken responsibility for protecting the welfare state against financial collapse (Green-Pedersen, Reference Green-Pedersen2001).
The political support for the UBI proposal is situated within this broader landscape of ‘old’ and ‘new’ welfare politics. First, we note that UBI policy has never been a flagship proposal of any mainstream political party, but was instead repeatedly brought to the political agenda by activists and policy experts. UBI policy was extensively discussed during the 1980s (Groot and van der Veen, Reference Groot, van der Veen, van der Veen and Groot2000), when the radical food labour union (Voedingsbond FNV) and the national scientific advisory board (WRR) launched UBI proposals to reform social security. The most recent wave of attention was driven by fringe journalism and amplified by Twitter audiences. Based on the work of publicist Rutger Bregman (Reference Bregman2013, Reference Bregman2014), the future affairs program Tegenlicht (2014, 2015) aired three documentaries on Dutch national broadcast television, two of which became trending topics on Dutch Twitter. These documentaries proposed UBI policy because it would (a) provide income security in the face of automation, (b) allow the working poor to invest in education, childcare, and basic goods, while (c) increasing happiness, social trust, and reducing poverty stress (for an extensive discussion see Gielens et al., Reference Gielens, Roosma and Achterberg2022).
Political parties have responded to these UBI proposals in both waves fairly consistently (Groot and van der Veen, Reference Groot, van der Veen, van der Veen and Groot2000). Evangelical radicals, the Green Left and Liberal Democrats (D66) have shown sympathy towards UBI proposals, but their endorsement may be seen as “cheap support” (De Wispelaere, Reference De Wispelaere2016:132). These parties have dedicated some words in support of UBI in their political manifestos, but have not shown the capacity or commitment to build coalitions to implement UBI. Labour parties and unions have rejected the UBI proposals after considerable discussion, fearing that the policy would erode workers’ rights and trigger a spiralling increase of wages and prices. The conservative (CDA) and liberal (VVD) parties have either ignored or opposed these proposals, chiefly because it would erode the work ethic and defies the contribution principle underlying existing social security.
However, in the most recent wave of attention, the reluctance towards UBI on the national level was countered with an enthusiasm from local political elites (Roosma Reference Roosma2022). In response to the attention for UBI and the call for experimenting with such policy, a dozen Dutch municipalities initiated experiments with unconditional social assistance. It seems the public enthusiasm for UBI came at the right time: the decentralization of social assistance benefits from the national to the municipal level came with financial struggles, and some municipal councils doubted the effectiveness of activating incentives (Groot et al., Reference Groot, Muffels and Verlaat2019). While these experiments were “inspired” by the UBI discussion (p. 280), they were framed as ‘trust experiments’ to avoid the political controversy surrounding UBI policy. The trust experiments investigated whether removing ‘stick-and-carrot’ incentives attached to social assistance benefits would improve the well-being of social assistance beneficiaries and their chance of finding a job.
Data and methods
In the following section we first present our sampling and data collection strategy. After a brief discussion of the content analysis underpinning our analysis, we elaborate the analytical procedure used to identify substantive positions. Note that this project was subjected to ethical review, please see the acknowledgements for details.
Data collection
Tweets are gathered by entering the key word ‘basic income’ (‘basisinkomen’) in the Twitter search engine. This term is almost exclusively used to refer to UBI, also including variations such as ‘universal basic income’.Footnote 1 To ensure capturing the full discussion, up to nine replies to every initial tweet were gathered using the Twitter API. We decided to stop here because the number of ninth reply tweets is already negligible (1.1 percent of tweets) and the discussion tends to become redundant or off-topic.
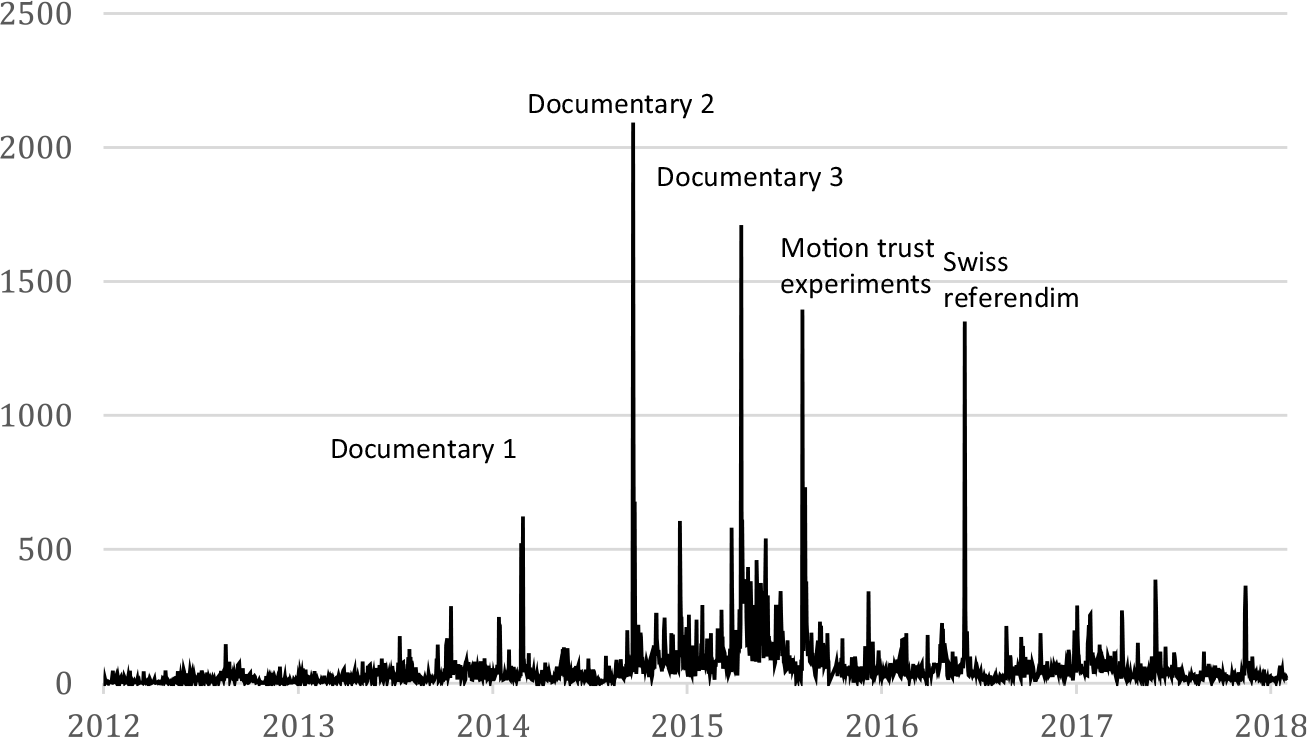
For this analysis, we purposively selected all tweets posted on three essential days (see Figure 1): the airing of the second documentary (2014-09-21), third documentary (2015-04-12) and the day of the announcement of the trust experiments (2015-08-05), amounting to a total of 5128 tweets sent by 1369 unique actors. These three events attracted the most attention from our Twitter audience and thereby illustrate their primary importance for the broader discussion. A random sample of days would ignore the event-centered nature of (social) media, where some days are simply more important than others for particular policy debates. The three selected days are also the most relevant because they are the three major events in the Dutch context. The first documentary is relatively marginally discussed: only the second and third documentaries became trending topics on Dutch Twitter. The last event regards the Swiss referendum which occurs outside the Dutch policy context. This purposive sample thus reflects the major initial response to the most influential media events surrounding UBI policy in the Netherlands.
We have gathered the Twitter usernames of political representatives from PolitwoopsFootnote 2, a website dedicated to storing tweets from Dutch politicians in case they are deleted. This list includes representatives in all levels of government, most notably the parliament and municipal councils. We also include ex-representatives, since they are likely to still be influential in the political arena. For clarity, only parties are included that are also represented on the national level. A cross-reference shows that 49 political representatives contributed to the UBI debate during the sampled time period, among which 17 green-left (GL), 9 socialist (SP), 6 progressive-liberal (D66), 6 conservatives (CDA), 5 labour (PvdA), 5 liberal (VVD) and 1 special interest party (50plus). Political elites sent a total of 203 tweets, and are slightly more active than most other users: the median of tweets sent per active elite is 2 (mean is 2.24), while the remaining 1308 active users most often send only 1 tweet per active user (mean is 3.84).
In order to assess the involvement of political parties in the UBI debate, we compared their engagement with their (national) party activity during the 2010 parliamentary elections (see Appendix D). We see that the conservative parties (CU and SGP) and the far-right party (PVV) do not engage at all in the UBI debate. This is somewhat surprising considering the history of political support amongst conservative parties (Groot and van der Veen, Reference Groot, van der Veen, van der Veen and Groot2000) and the relatively high levels of support for UBI policy amongst the Dutch conservative constituency (Gielens et al., Reference Gielens, Roosma and Achterbergunder review). Liberals (VVD), conservatives (CDA) and labour (PvdA) are proportionally underrepresented in the UBI debate compared to their engagement in the election campaign. The greens (GL) and socialists (SP) are overrepresented. Socialists stand out especially due to their relatively large number of tweets sent: they wrote 44.3 percent of the total elite tweets sent in the UBI debate, and post much more frequently in the UBI debate compared to other elites in the election campaign.
Content analysis
The unit of observation in our study is a claim (i.e. a positive or negative reference to a concept) made by an actor. To identify these claims, an extensive content analysis preceded this analysis (Gielens et al., Reference Gielens, Roosma and Achterberg2022; see also Krippendorff, Reference Krippendorff2018), wherein we developed and refined a coding scheme containing 56 unique concepts. An overview and example of each concept is provided in Appendix A.
Claims have been coded in terms of concept and position regarding that concept (proposing or refuting that argument, or taking a neutral stance towards an argument). For each tweet, we coded up to three concepts (and corresponding positions). For example, consider the tweet “a #basicincome grants freedom of choice; stimulates creativity and entrepreneurship”Footnote 3 . This tweet contains two concepts – freedom and entrepreneurship – and each concept is referred to positively. Inversely, the claim that basic income “discourages saving (=becoming independent)”Footnote 4 negatively refers to the concept of freedom. When no argument could be discerned, tweets were coded into a number of miscellaneous categories (e.g. argument is unclear, asking a question, spam, unrelated, tweet is part of a series, emotional expression without argument).Footnote 5
We assessed the reliability of the final coding scheme by means of intercoder reliability. The sample was constructed using a stratified random sample: for each category (including the miscellaneous category) we randomly selected 9 tweets, amounting to a total of 414 tweets (7.3% of the full sample). Two coders agreed on 96.7% of labels. Correcting for agreement by chance yields an average reliability of κ=.430 across categories. For an extensive discussion of the procedures we refer the reader to Gielens et al. (Reference Gielens, Roosma and Achterberg2022).
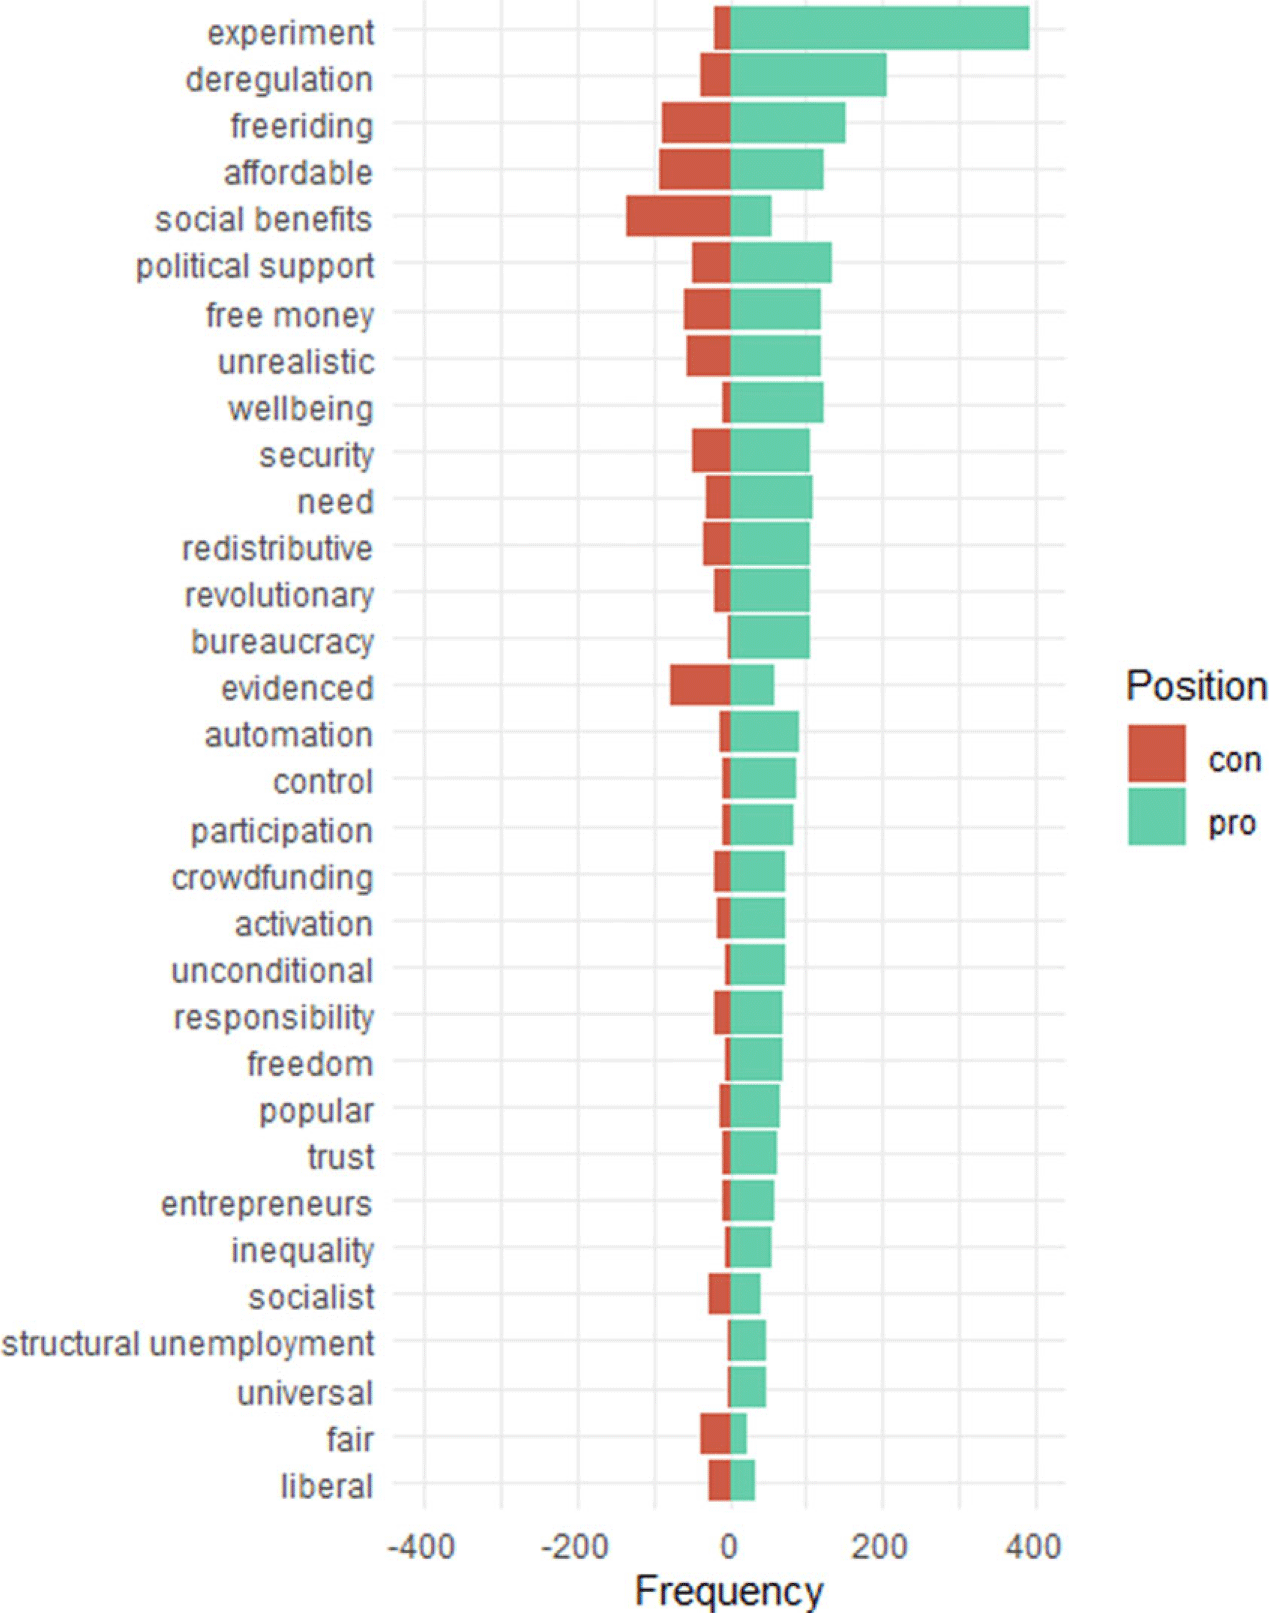
The occurrence frequency of each concept is presented in Figure 2. The most popular (or controversial) concepts featuring in the discussion regard the call to experiment with UBI, using UBI as a tool to deregulate the welfare system, the freeriding objection (people will become lazy etc.) and the question of UBI’s affordability (who will pay for it). Very rarely used arguments, with less than one percent of total mentions, are excluded from the plot.
Discourse network analysis
To identify discursive positions in the debate, we employ discourse network analysis (Leifeld, Reference Leifeld2017) in conjunction with a clustering algorithm (Traag and Bruggeman, Reference Traag and Bruggeman2008). Discourse network analysis models policy debates as networks, wherein a clustering procedure – also known as community detection – assigns participants that tend to agree to the same coalition. We only provide a short overview of the method here. For the technical details of the procedure we refer the reader to Appendix B.
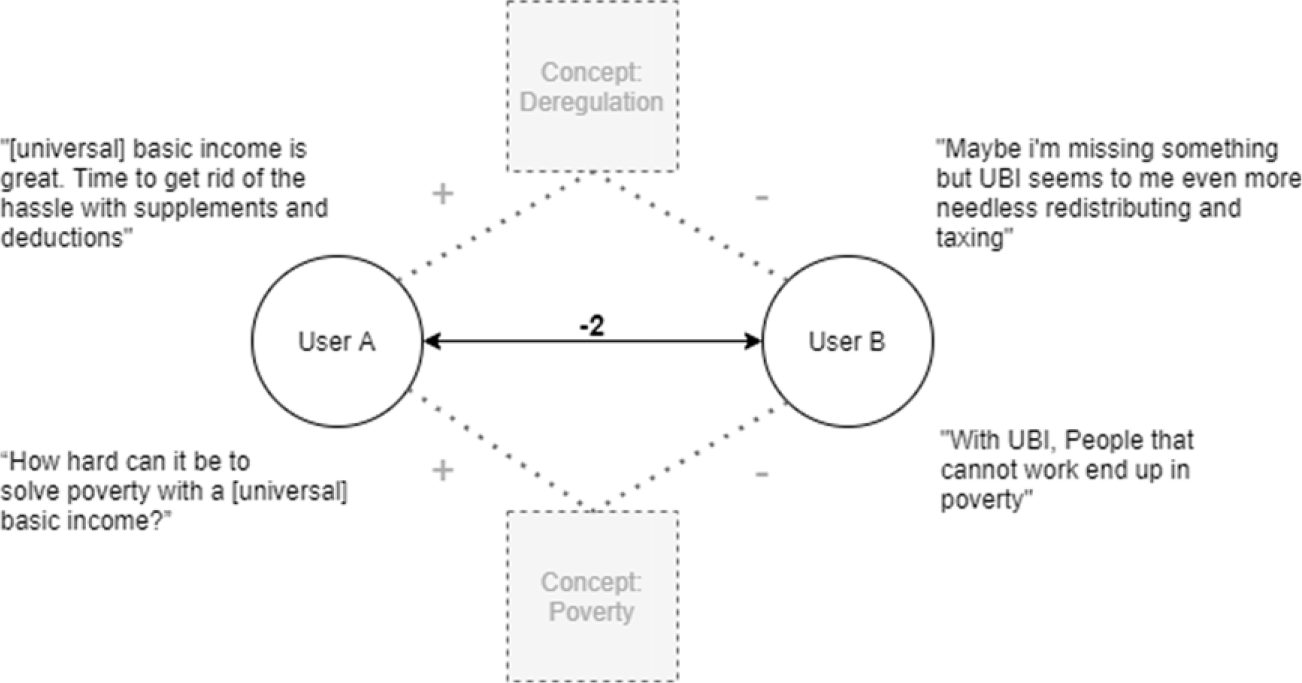
First, we construct a network of agreement relations between participants in the debate. From the content analysis we know which arguments participants adopt, and whether they agree or disagree with these arguments. Positive relations indicate that participants tend to agree on the same arguments. Inversely, negative relations indicate disagreement between participants. The more concepts people (dis)agree on, the stronger the connection. Figure 3 shows an example of a disagreement relation.
Number of tweets per day mentioning (or replying to tweets mentioning) basic income.
Occurrence frequency per concept.
To identify discursive positions in the UBI debate, we cluster participants using spin-glass community detection (Traag and Bruggeman, Reference Traag and Bruggeman2008). Participants that tend to agree are assigned to the same cluster, while participants that tend to disagree are assigned to a different cluster. A perfectly modular network would have only positive relations within clusters and negative relations between clusters, with a corresponding modularity of Q=1. In practice, we search for the optimal clustering, minimizing disagreement within clusters and agreement between clusters. When the clusters are assigned, we can recover the discursive position of each cluster by plotting the argument frequencies (see Figure 1) per cluster. It is also easy to see which politicians belong to which cluster.
Results
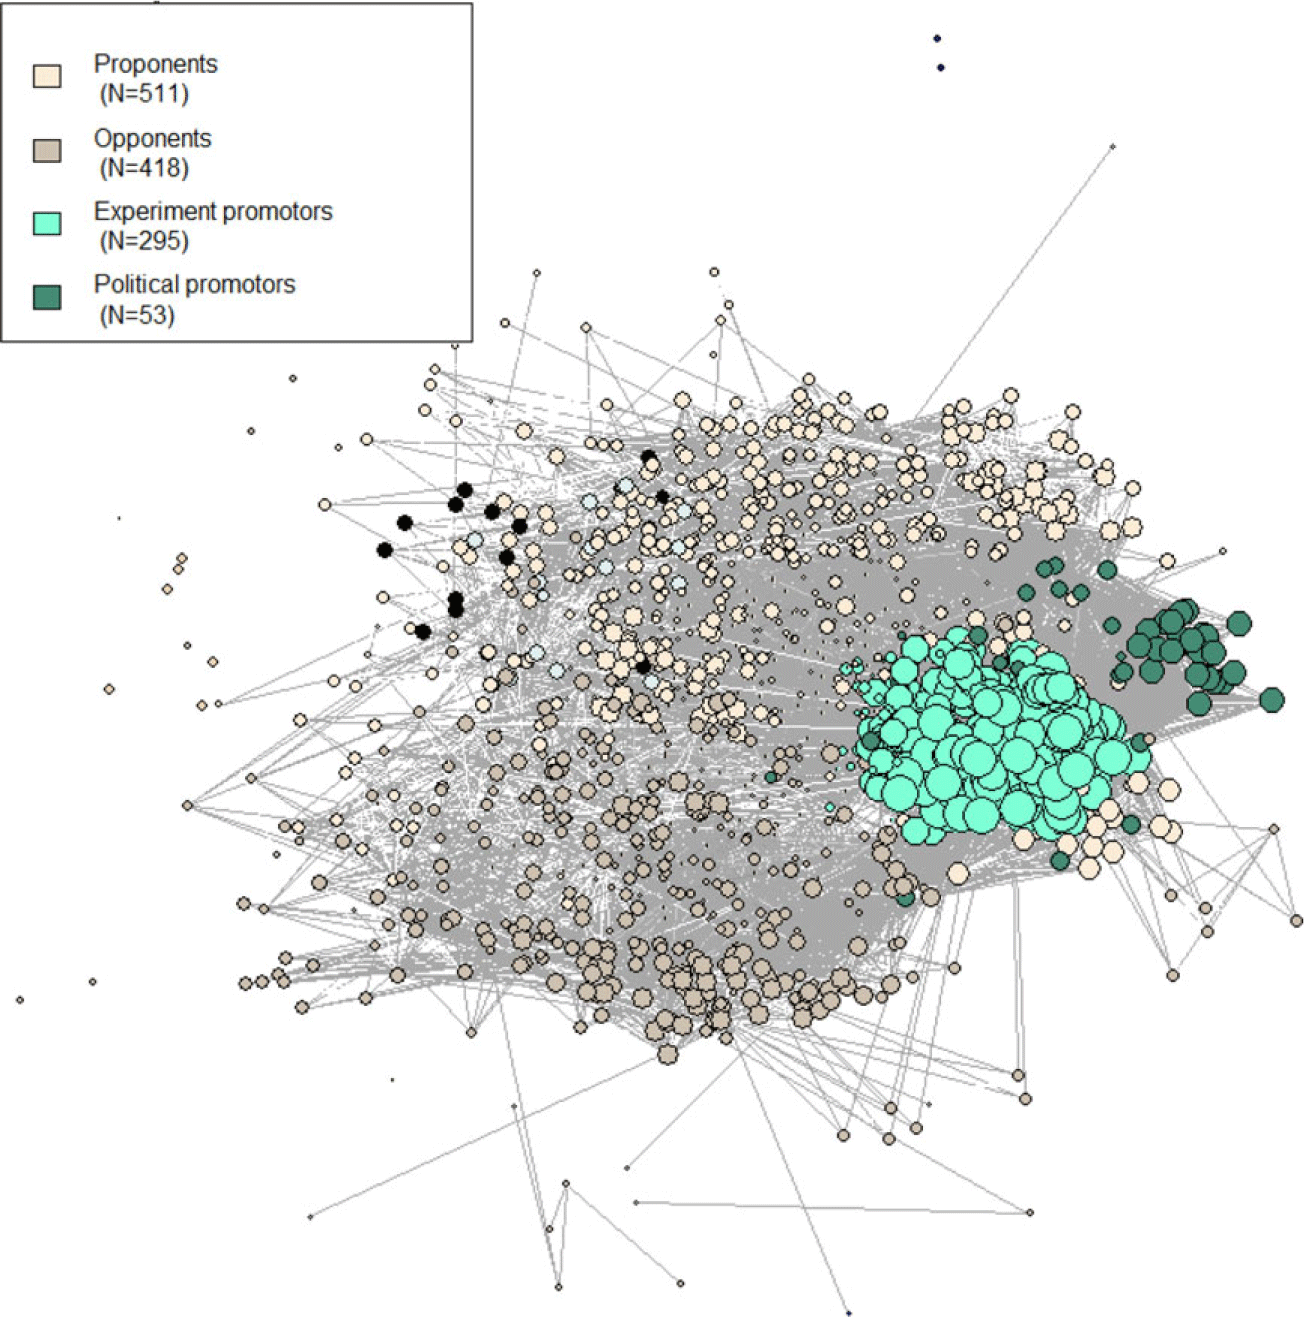
We find 4 large clusters in the UBI debate on Dutch Twitter: proponents, opponents, experiment promoters and political promoters.Footnote 6 The structural topology and clustering of the actor agreement network is presented in Figure 4. The experiment promotors and political promotors are the most cohesive groups, due to their lack of engagement with substantive arguments. In addition, regardless of their disagreement, the polarization of opponents and proponents is not extreme: there appears to be a gradient where some agreement between them exists. In the remainder of this section we first discuss the substantive position of these clusters and a short note on the development of the debate between the three timepoints, followed by the centrality of arguments in the debate. Finally, we explore which political party representatives endorse these positions.
Example connection in an actor network based on the underlying argument references.
The clustered actor network.
Our analysis points to three main findings. First, while UBI proponents endorse a UBI that is ‘beyond left and right’, both proponents and opponents are ambivalent towards the redistributive implications of UBI policy (e.g. De Wispelaere, Reference De Wispelaere2016; De Wispelaere and Stirton, Reference De Wispelaere and Stirton2004). Second, we find that UBI proponents have turned to social investment discourse, with arguments on activating the unemployed and removing work disincentives being remarkably central to the debate (see also Perkiö, Reference Perkiö2020). Third, the political coalition surrounding UBI seems very stable. Political elites proposing UBI are predominantly (green-)left, while liberal and conservative parties in opposition and the socialist party divided in support for UBI (see also Steensland, Reference Steensland2008).
Substantive positions
To gain a proper understanding of the positions in the debate we first discuss the argument frequencies of each cluster, presented in Figure 5. Green cells indicate agreement in a cluster with respect to an argument, white cells indicate silence or ambivalence, and red cells indicate disagreement. Note that while chosen for its simplicity, this method does not distinguish between a lack of ties (no references) and ambivalent ties (an equal or near-equal amount of positive and negative references). Both are shaded towards white in the heatmap. To show which arguments are ambivalent, the positive and negative references are separated in Appendix C.
Discursive positions of each cluster.
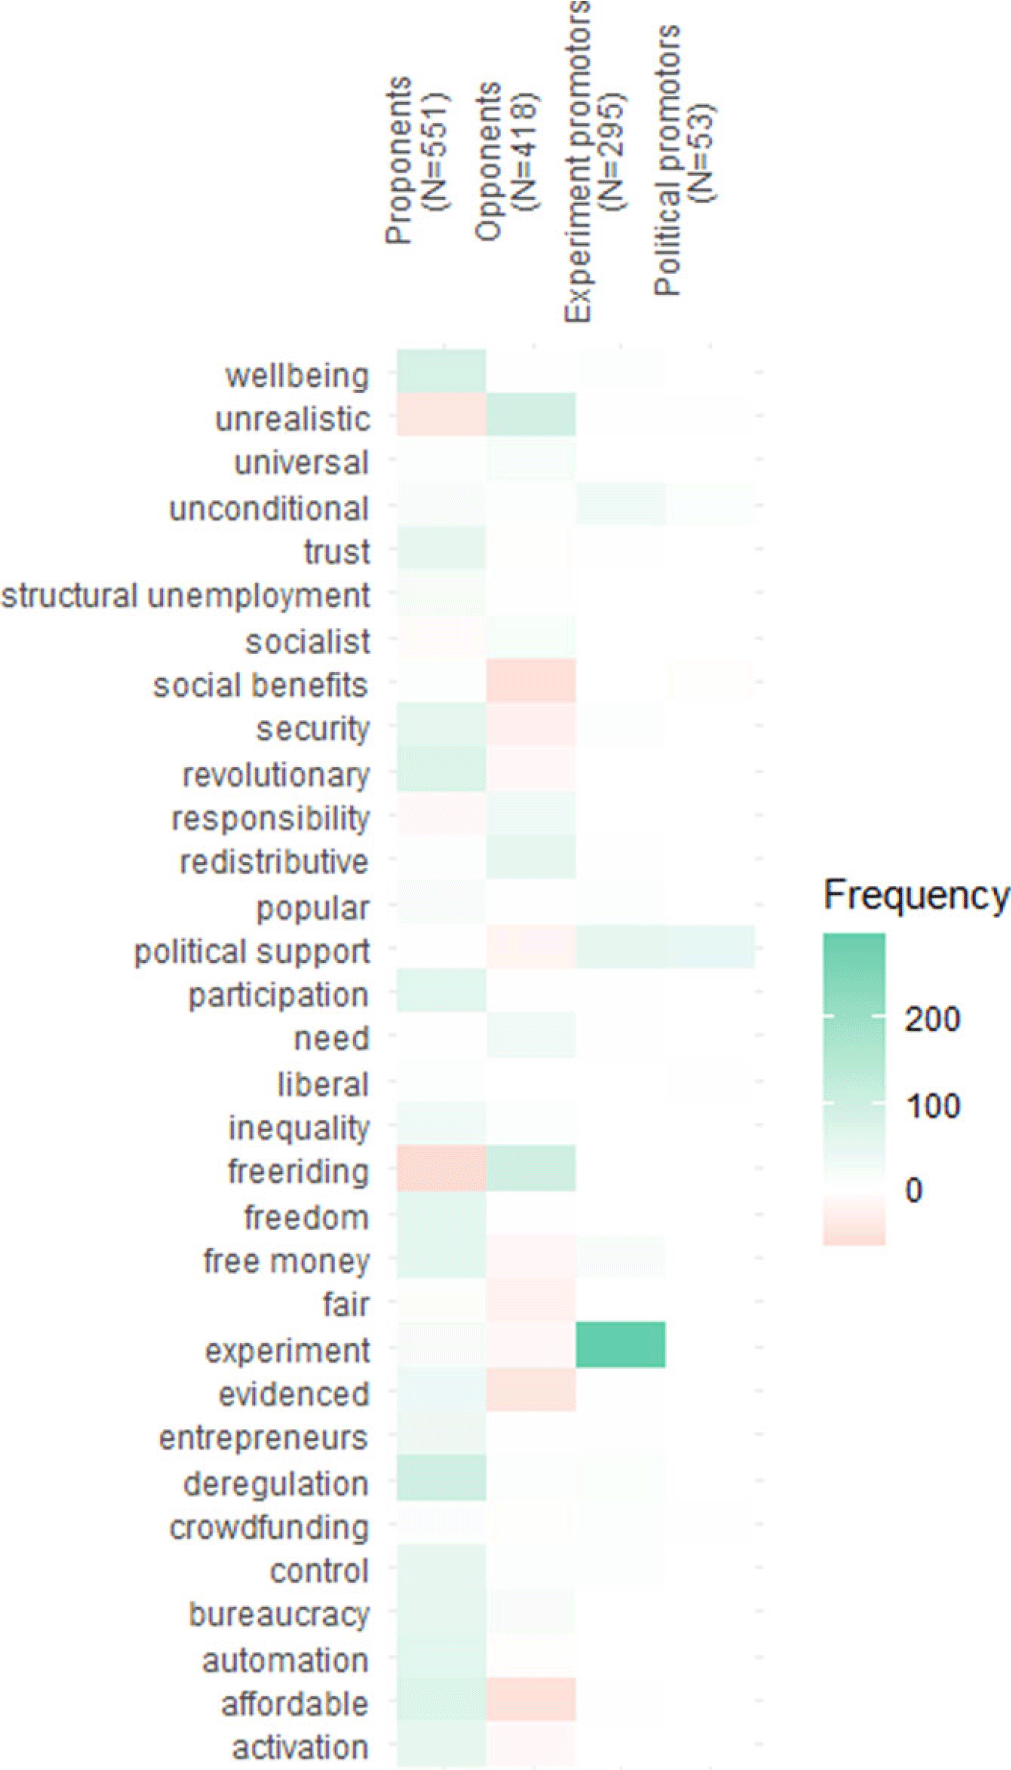
The largest cluster (N=511) consists of proponents, who combine elements from socialist, liberal and social investment discourse (e.g. Schwander and Vlandas, Reference Schwander and Vlandas2020). The position is perhaps best summarized by the idea that UBI “makes people more entrepreneurial, happier and healthier”Footnote 7. The egalitarian aspect of this position is anchored in the “income security”Footnote 8 that UBI must provide. Moreover, the unconditionality of UBI – conceptualized as freedom from “wage slavery”Footnote 9 – is thought to divert the basis of social relations away from work, towards a “more social society”Footnote 10. This transition is supposed to be facilitated by the automation of labour. Its liberal aspect entails that UBI would reduce bureaucratic complexityFootnote 11 by “replacing all benefits”Footnote 12 and “abolishing minimum wage laws”Footnote 13, while “increasing labour productivity”Footnote 14. A social investment component is found in the efficiency and activating aspects of UBI. UBI is supposed to activate the unemployed, “stimulating people to work on the side”Footnote 15 by removing “negative incentives”Footnote 16 or “barriers to work”Footnote 17and allowing them to perform unpaid work in a true “participation society”Footnote 18. In the same vein, proponents reject the claim that UBI will lead to freeriding behaviour. We note the tension between wanting to incentivize labour market participation (see also Friedman, Reference Friedman2013) and the freedom from forced paid employment (e.g. van Parijs Reference van Parijs1991). Regardless, we find that proponents tend to combine these arguments into a single proponent position.
Appendix C additionally shows that proponents are ambivalent towards the redistributive aspect of UBI policy. Proponents are divided as to whether UBI is retrenching the welfare state (regarding the arguments ‘liberal’ and ‘need’) or expanding current welfare provision (regarding the arguments ‘redistributive’ and ‘socialist’). The question of ‘who pays and who benefits’ is often left unaddressed by proponents of UBI policy: hiding the redistributive implications behind a “veil of vagueness” (De Wispelaere Reference De Wispelaere2016:136) has been a strategy to unite rightists and leftist proponents. Here we show, however, that avoiding the redistributive question also opens a window to generate doubt and divide proponents.
The second largest cluster (N=418) is composed of UBI opponents. Their discursive position contains both leftist and rightist critiques, and shares the vision that UBI is unrealistic and unfair to the working population. Both leftist and rightist opponents believe in work as a moral responsibility. The leftist opposition finds that “you should contribute to society if you can, and be rewarded for it”Footnote 19. The rightist opposition similarly contends that “income is generated by working and not by doing nothing”Footnote 20. Moreover, the leftist and rightist opposition is united by their lack of faith in the feasibility of the proponent proposal. UBI is deemed “utopian”Footnote 21 and “unaffordable”Footnote 22, and the evidence from earlier pilots is considered unconvincing. The opposition thus opposes UBI from a pro-work perspective, and is united by their lack of faith in its feasibility.
In spite of this unity we also find substantive disagreement amongst opponents. Leftists and rightists oppose a different interpretation of UBI, as shown by the contradicting arguments endorsed by opponents. For example, the opposed socialist elites argue that UBI is “an invention of liberals”Footnote 23 that provides an income “below the poverty line”Footnote 24, where especially those unable to work would be worse off. Rightist political elites oppose the supposed redistributive effects: “free money doesn’t exist”Footnote 25, because eventually “you and I will pay for it”Footnote 26. The opposed conservatives in our dataset are concerned that UBI attracts immigrantsFootnote 27, which in turn erodes support for UBIFootnote 28. Their different view on what UBI is supposed to achieve is also expressed in the ambivalence towards the deregulatory aspect of UBI (see Appendix C). We infer that those opposing welfare state retrenchment endorse the deregulation argument, while those opposing welfare state expansion reject the deregulation argument.
The third cluster (N=295) is focused almost exclusively on promoting UBI experiments. In the first instance they promote the call for experimenting with UBI that featured in the first discussion-triggering documentary. For instance, “especially for all mayors: change the TV channel to #tegenlicht and watch the episode on [UBI]. Pilot site wanted!”Footnote 29. Later, these people share news items regarding the experiments with unconditional social assistance inspired by UBI: “municipalities want a pilot with [UBI]”Footnote 30 and “experiment with social assistance ‘without conditions’ in Utrecht”Footnote 31 . The experiment cluster does not contribute to the debate substantively, but the intention behind promoting these experiments seems generally to create political momentum and draw positive attention to UBI.
Finally, a related small cluster (N=53) addresses politicians and discusses the political momentum for UBI. These political promoters initially actively recruit politicians to advocate UBI. For example: “which political party dares to include this [UBI] in their programFootnote 32” and “where has the enthusiasm of #d66 [progressive-liberals] gone? Go: on the political agenda”Footnote 33. Later, this cluster of actors continues to monitor the political momentum, with notices such as “motion accepted to investigate [UBI]”Footnote 34. Similar to the promotors of experiments, these actors try to draw positive attention to UBI by promoting particular news items, rather than substantively arguing in favour of UBI.
A short reflection on the development of the UBI debate across the three timepoints is also in order. We have included the actor graph and corresponding substantive positions in Appendix E. A temporal comparison shows that the proponents’ positions on the first day are separated between a more liberal UBI focussed on deregulation and affordability (cluster 1) and a more egalitarian UBI focussed on freedom and well-being (cluster 4). These groups merge into one proponent cluster on the second and third days, suggesting that the framing broadened and unified in later episodes of discussion. The second day features a cluster (cluster 6) particularly devoted to discussing UBI as the solution to structural unemployment due to automation. These ‘defenders’ of the utopia propagated by Bregman (Reference Bregman2014) are rather few and detached from the broader discussion at this point. The third day features a particularly strong discussion of experiments and political support (which makes sense as the munici trust experiments are announced on this day) and a relatively strong opponent offensive (they seem to become active in an attempt to discredit or stop these experiments). The proponents are relatively disorganized on this last day of debate.
In sum, even though proponents combine both socialist, libertarian and social investment arguments particularly in later stages of the debate, speculation surrounding the redistributive implications of UBI remain a source of ambivalence amongst both proponents and opponents. Opponents frame UBI policy both as a form of welfare retrenchment and expansion, while proponents do not take a unified position towards these counterarguments. The schism between the liberal and egalitarian interpretations of UBI (e.g. De Wispelaere Reference De Wispelaere2016; De Wispelaere and Stirton Reference De Wispelaere and Stirton2004) thus seems driven primarily by inverse redistributive concerns amongst socialist and liberal opponents.
Central and peripheral arguments
To find out which arguments dominate the UBI debate on Dutch Twitter, we turn to the concept network in Figure 6. Arguments in the center of the graph are used in conjunction with many other arguments, or in other words, central arguments are discussed by a wide variety of actors. The connections are colored according to which group of actors tends to connect them: connections are green when proponents tend to co-adopt two arguments, and red when opponents do so. The colors thus reflect the framing efforts of proponents and opponents, showing where the substantive discussion between proponents and opponents meet (see also Leifeld and Haunss, Reference Leifeld and Haunss2012:398).
Concept network of the UBI debate on Dutch Twitter.
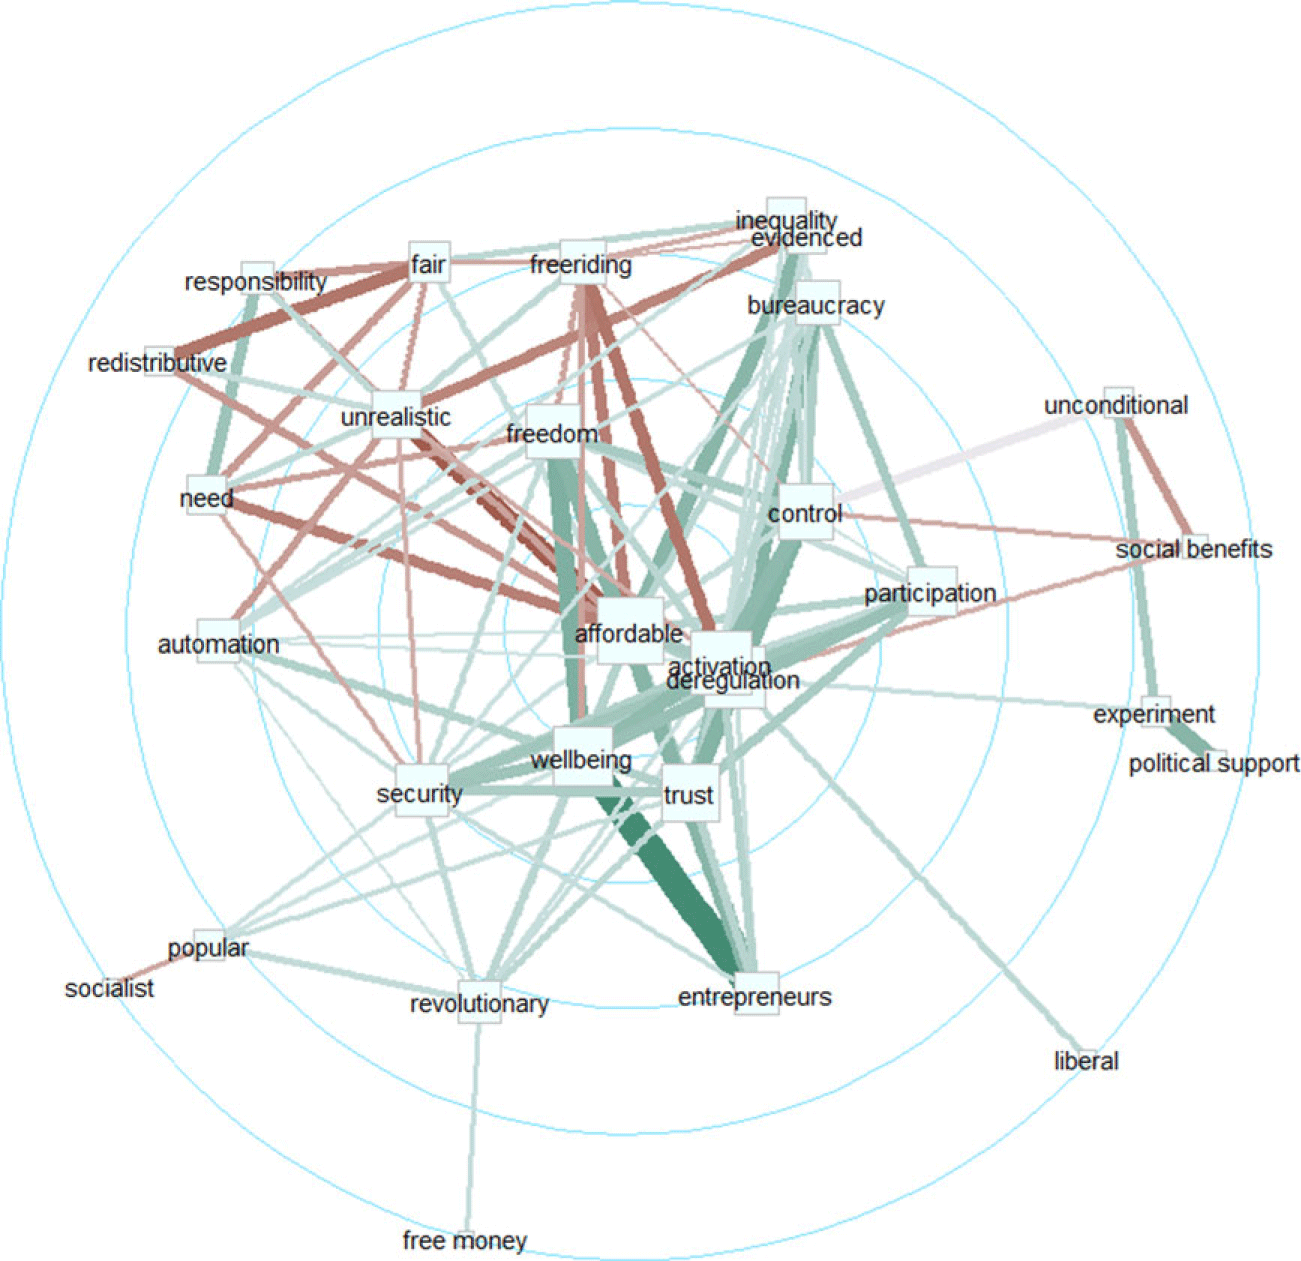
The concept networks point to three interesting findings. First, the affordability of UBI is the most central concern in the debate. Proponents defend the affordability of UBI especially by linking it to the savings introduced by deregulation: “it would provide huge savings in disappeared bureaucracy” Footnote 35 and “the gains are in savings on the civil service” Footnote 36 . Opponents centrally dismiss UBI unaffordable and unrealistic. Neither proponents nor opponents convincingly dominate the concept of affordability, which points to a discursive stalemate regarding this central argument. The centrality of affordablity further emphasizes the importance of the redistributive implications of UBI to the discussion.
Second, we find that a number of arguments related to social investment are especially central to the proponent position: activation of the unemployed, deregulating the system of social security, and to a lesser exent encouraging unpaid participation, and a less distrustful attitude towards welfare recipients. These arguments – activation, deregulation, participation, wellbeing and trust – are predominantly connected by proponents. Whereas earlier episodes of debate were more centered around emancipation of workers and women as well as redistributive justice (e.g. Groot and van der Veen, Reference Groot, van der Veen, van der Veen and Groot2000; Steensland, Reference Steensland2008), the current case for UBI policy has focussed on social investment discourse (see also Perkiö Reference Perkiö2020).
Third, the concept network suggests that proponents built a more coherent case in favour of UBI than opponents did against UBI. The wide-ranging arguments used by proponents are central and strongly interconnected, which shows that many proponents endorse or oppose these arguments conjointly, which is “a sign of a well-integrated discourse coalition” (Leifeld and Haunss, Reference Leifeld and Haunss2012:399). Thus, the proponent case for a UBI that is ‘beyond left and right’ seems to have been made coherently. Moreover, a number of the green lines between opponent arguments – particularly surrounding the lack of realism – indicates that proponents are actively and substantively refuting counterarguments. Conversely, opponents are particularly focussed on arguing that UBI is unaffordable and unrealistic, mainly by claiming it is insufficient to care for the needy and encourages freeriding behaviour.
Actor endorsement
Finally, we explore which political elites endorse the discursive positions formed on Dutch Twitter. The wide range of arguments used to endorse UBI suggests that the policy proposal is indeed ‘beyond left and right’. If this is truly the case, however, we would also expect to see both leftist and rightist politicians endorsing the proponent position. The cross-tabulation in Table 2 shows the distribution of political representatives for each discursive position. We find first that the proponent position is predominantly backed by the (green) left and opposed by liberals and conservatives. Of all elites endorsing the proponent position, 47 per cent is green left, compared to only 7 per cent amongst opponents. Similarly, 13 per cent of proponent elites belong to the labour party, while none of the labour elites are opposed. Socialists are a large fraction of the proponents (27 per cent) but are equally well-represented amongst opponents (29 per cent). Socialists are also significantly underrepresented amongst the experiment promotors. Rightists and conservatives are mostly opposed to UBI. Compared to the null distribution, opponent elites are significantly less likely to be green-left (7 per cent) and significantly more likely to be liberal (36 per cent). The conservatives are also relatively strongly represented amongst opponents (21 per cent), but also seem to be calling for experimenting with UBI (17 per cent). The one conservative on the proponent side actually has a substantively neutral stance towards UBI: “I understand the macro-perspective on UBI. But I don’t yet see the difference with social assistance”Footnote 37. Democrat elites play a largely passive role in the debate, being mostly active as political promotors (33 per cent).
Preliminary expectations

Political elites endorsing each substantive position
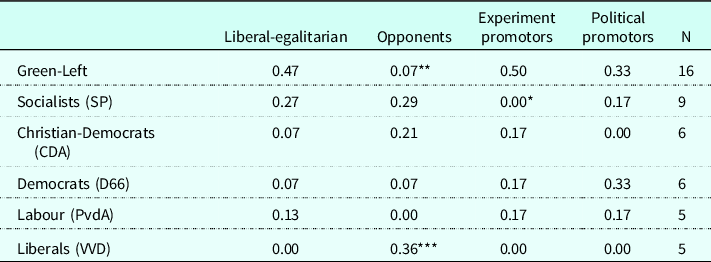
Note: Column percentages are reported in cells. Overall differences are significant (two-sided) based on Fisher’s Exact test (p=.013) and the Strasser-Weber Independence test (p=.008). Significant cell deviations from the null distribution are derived from adjusted Pearson residuals. Cells that deviate more that 1.96 standard deviations from the expected cell value are considered significant. *p<.05; **p<.01; ***p<.001.
In sum, the political alignments seem to be mostly similar to previous episodes of discussion (Groot and van der Veen, Reference Groot, van der Veen, van der Veen and Groot2000). The green-left is still overrepresented amongst proponents (see also Perkiö Reference Perkiö2020), while liberal and conservatives are opposed, and the socialist party remains divided on the issue (e.g. Vanderborght, Reference Vanderborght2006; Schwander and Vlandas, Reference Schwander and Vlandas2020). The UBI debate develops primarily by changing frames while the political coalitions endorsing these frames remain stable (see also Steensland, Reference Steensland2008).
Conclusion
In this work we explored the discursive tension surrounding UBI proposals by analyzing a policy debate on Dutch Twitter. Using discourse network analysis (Leifeld Reference Leifeld2017), we identified the substantive positions towards UBI displayed by a Twitter audience, described the centrality of arguments in the debate, and investigated which political elites endorse these positions. We find first that the well-known schism between the liberal and egalitarian interpretations of UBI – constituting its ‘many faces’ (De Wispelaere, Reference De Wispelaere2016; De Wispelaere and Stirton, Reference De Wispelaere and Stirton2004) – is driven primarily by ambivalence towards its redistributive implications amongst opponents as well as proponents. Moreover, we find a turn towards social investment frames amongst UBI advocates (see also Perkiö Reference Perkiö2020), who argue centrally that UBI activates the unemployed and removes work disincentives from existing social security systems. This change in framing, however, seems to have little visible impact on the coalition formation among political elites. Green-left political elites remain overrepresented among proponents, while liberal and conservatives are opposed, and the socialist party remains divided on the issue.
These findings confirm that, at least in the Dutch case, presenting UBI as ‘beyond left and right’ divides the political left without generating support from liberal-conservatives. Substantively, proponents on Twitter make a truly cross-partisan case for UBI policy, as is also the case in much scholarly work (e.g. Reed and Lansley, Reference Reed and Lansley2016; see also Barry, Reference Barry1996:3; Torry, Reference Torry2016:168; Purdy, Reference Purdy, Widerquist, Noguera, Vanderborght and De Wispelaere2013:483). However, this position has not led liberal or conservative elites to openly support the UBI proposal, at least on Twitter. Inversely however, framing UBI as ‘beyond left and right’ elicits suspicion amongst socialist elites, who fear that UBI would amount to welfare retrenchment (De Wispelaere, Reference De Wispelaere2016; De Wispelaere and Stirton, Reference De Wispelaere and Stirton2004). Furthermore, and perhaps more importantly, the ambivalence towards the redistributive implications of UBI policy also generates doubts amongst proponent audiences. The lack of clarity regarding the redistributive implications of UBI policy thus fuels the cross-partisan opposition and undermines the unity of the proponent coalition. In an age of “permanent austerity” (Pierson Reference Pierson2002), the redistributive justice of UBI policy is clearly a policy aspect that cannot be ignored.
The social investment turn in UBI discourse also provides suggestions on why the policy proposal has led to experiments with unconditional social assistance in the Netherlands and other Western countries (Perkiö, Reference Perkiö2020; van der Veen, Reference van der Veen2019). On the surface, the UBI debate on Dutch Twitter seems to be a shock to welfare state discourse in the Netherlands: it challenges the foundation of the welfare state by proposing to provide ‘welfare without work’. These ideas are core to the postproductivist ideals found in the works of e.g. Offe and van Parijs (Reference Offe and van Parijs2013) and Gorz (Reference Gorz, Widerquist, Noguera, Vandeborght and Wispelaere2013) and many others. That such a radical proposal commands attention in the Netherlands speaks to the work of Goodin (Reference Goodin2001), who identified the Netherlands as the most postproductivistic country in Europe. In practice, however, the core of the UBI debate on Dutch Twitter is very much in line with the established welfare discourse: to ensure employment participation and manage the increasingly costly welfare system. The higher educated and left-leaning Twitter audience seems to have played a role in bringing the social investment frames to the foreground. Municipal politics leveraged the momentum surrounding UBI to experiment with positive incentives and a trust towards welfare recipients (Groot et al., Reference Groot, Muffels and Verlaat2019, Roosma, Reference Roosma2022). As the discussion on UBI evolves, it seems that the policy proposal manages to reach political agendas by downplaying its more radical elements. When we view UBI as a social investment policy – perhaps best labelled as the ’middle road’ (see also Jordan, Reference Jordan2012) – it makes sense that popular support for UBI policy is unrelated to automation risk (Busemeyer and Sahm, Reference Busemeyer and Sahm2021) and that the policy gained media attention in spite of public preferences for targeted and conditional variants (e.g. Stadelmann-Steffen and Dermont, Reference Stadelmann-Steffen and Dermont2020: Rincón et al., Reference Rincón, Vlandas and Hiilamo2022).
The use of Twitter for analysing a policy debate also comes with its limitations. First, the debate under observation cannot be taken as representative of the overall political debate. The arguments that we find and the coalitions that emerge from them are to some extent altered by the users involved and the dynamics of the platform. Twitter users are not representative of the general population (e.g. Barberá and Rivero, Reference Barberá and Rivero2015), with the political left being somewhat overrepresented on Dutch Twitter (Wieringa et al., Reference Wieringa, Gorzeman, van Geenen and Schäfer2018) and those engaging in political debates are more likely to be male and higher educated (van Klingeren et al., Reference van Klingeren, Trilling and Möller2021). Moreover, social media have distinct logics (van Dijck and Poell, Reference van Dijck and Poell2013) that influence coalition formation. Twitter debate is influenced by algorithms, influencers and audience amplification dynamics (Zhang et al., Reference Zhang, Wells, Wang and Rohe2018) that foreground some arguments over others. The coalition formation that we identified should therefore be seen as at least partly particular to Twitter, meaning that the coalition formation may differ in e.g. parliamentary debates or newspaper discussions.
The UBI debate on Dutch Twitter also invites reflection on the phenomenon and role of online policy debates. This study shows considerable and complex online public engagement with UBI policy, which seemingly encouraged policymakers to pursue experiments with unconditional welfare (see also Groot et al., Reference Groot, Muffels and Verlaat2019). This involvement of online audiences in policy processes is not unique. An increasing number of case studies shows that online publics incidentally mobilize in relation to a range of policy agendas, be it internet regulations (Schünemann et al., Reference Schünemann, Steiger and Stier2015; Benkler et al., Reference Benkler, Roberts, Faris, Solow-Niederman and Etling2015), education policy (Supovitz et al., Reference Supovitz, Daly and Del Fresno2018; Schuster et al., Reference Schuster, Jörgens and Kolleck2021), climate change (Schünemann, Reference Schünemann2020) or health policy (e.g. Bridge et al., Reference Bridge, Flint and Tench2021) among others. As most of these studies imply some effect on the policy process, this phenomenon has strong potential implications for deliberative theory (Shirky, Reference Shirky2008; Benkler, Reference Benkler2006; cf. Hindman, Reference Hindman2008) and the policy process (e.g. Zahariadis, Reference Zahariadis2019; Sabatier and Weible, Reference Sabatier and Weible2019). Our understanding of popular influence on public policy would greatly benefit from bringing together the study of online policy debates in a single conceptual framework – especially in relation to online protests (e.g. Barberá et al., Reference Barberá, Jost, Nagler, Tucker and Bonneau2015), online amplification and agenda setting dynamics (e.g. Zhang et al., Reference Zhang, Wells, Wang and Rohe2018; Russell Neuman et al., Reference Russell Neuman, Guggenheim, Mo Jang and Bae2014) and the structure of online networks (Himelboim et al., Reference Himelboim, McCreery and Smith2013). We see an opportunity to apply these strands of literature to the study of online policy debates, helping us to elaborate how online policy debates shape public policy formation. A systematic review of the study of online policy debates integrates and complements existing case studies, and may eventually elucidate and consolidate channels for stronger democratic participation in the policy process.
Supplementary material
To view supplementary material for this article, please visit https://doi.org/10.1017/S0047279422000976
Acknowledgements
This publication is part of the project “unravelling the basic income debate” with project number 406.18.531 of the research talent programme which is financed by the Dutch Research Council (NWO). The project was subjected to ethical review by the Ethics Review Board at Tilburg University 2 and approved under reference RP583.
Competing interests
The authors declare none.


 Open access