

INTRODUCTION
Japan has been free from rabies since 1958, except for one introduced human case from Nepal in 1970 and two introduced human cases from the Philippines in 2006 [Reference Takahashi-Omoe1]. The last local human case of rabies occurred in 1956, while the last domestic animal case occurred in a cat in 1957. Under the Rabies Prevention Law enforced since 1950, Japan has a strict regimen for the importation of dogs and cats from countries and territories throughout the world. An old regimen consisting of rabies vaccination, a waiting period of 30–180 or 30–365 days (depending on the type of vaccine used in the country of origin) and a 14-day quarantine upon arrival in Japan was in place until October 2004. In response to a sharp increase in puppies being imported from Southeast Asia since the early 2000s, the government of Japan adopted a new import regimen in November 2004 for dogs and cats and other designated animals at risk of rabies infection including raccoons, foxes and skunks. The new regimen consists of identification of the animal with a microchip, a two-time rabies vaccination (not necessary for dogs and cats from designated rabies-free regions including Australia, New Zealand, Fiji, Guam, Hawaii, Iceland), neutralizing antibody titration test and a waiting period of 180 days [Reference Takahashi-Omoe1, Reference Kamakawa2]. In addition, this new regimen allows those animals that do not meet the aforementioned requirements to be imported into Japan if they are quarantined for 180 days at the airport or port upon arrival. According to the quantitative risk assessment by Kamakawa et al. [Reference Kamakawa2], this regimen reduced the risk of rabies introduction into Japan by 25- to 70-fold compared to the previous regimen.
Importation of pets into Japan is mainly through the Animal Quarantine Service (AQS) and there are over 8000 dogs and cats imported each year. Apart from this importation through AQS, there is also a considerable number of dogs and cats (over 1100) imported into Japan each year through the United States Force Japan (USFJ).
Quantitative risk assessment (QRA) has been widely used to provide scientific evidence for policy decisions relating to rabies at both national and international levels [3–Reference Jones5]. This study aims to quantitatively assess the risk of rabies introduction into Japan through the international importation of dogs and cats, with particular emphasis on evaluating the effectiveness of the current import regimen. The risk is quantified as (i) the probability of infection in a single dog or cat imported into Japan; (ii) the annual probability of importing at least one infected dog or cat into Japan; and (iii) the number of years until the introduction of a rabies case into Japan. The results of this study will be useful in informing science-based decisions should the current import regimen in Japan be amended in the future.
MATERIAL AND METHODS
Risk pathways
A stochastic scenario tree model was developed based on Goddard et al. [Reference Goddard4] with specific re-parameterization to accommodate the situation in Japan. In this model, a total of 14 risk pathways through which rabies may enter Japan were identified (Fig. 1). Pathways 1–12 represent the risk of rabies introduction associated with the international importation of dogs and cats into Japan through AQS, while pathways 13 and 14 represent a simplified entry pathway associated with the importation of dogs and cats through USFJ based on the assumption that all animals would undergo a quarantine of 180 days.
Scenario trees showing the 14 risk pathways of rabies introduction into Japan. (a) Rabies introduction through importation via the Animal Quarantine Service (AQS) assuming the animal is infected before first vaccination. (b) Rabies introduction through importation via AQS assuming the animal is infected during the waiting period. (c) Rabies introduction through importation via United States Force Japan assuming the animal is infected before quarantine.
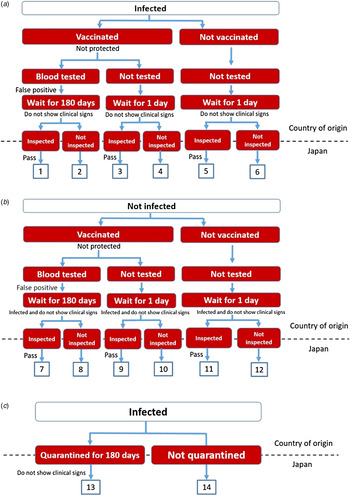
Pathway 1. A rabies-infected animal is selected; it is vaccinated but not protected (i.e. antibody level does not rise); neutralizing antibody titration test reveals a false-positive result; the animal does not show clinical signs after the 180-day waiting period and upon arrival in Japan; it passes the inspection by an animal health official of AQS and is released into Japan, resulting in entry of one rabies case.
Pathway 2. The same as pathway 1 except that the animal is not inspected by an AQS official upon arrival in Japan. This scenario is used to test the effect of smuggling. It is assumed that custom inspection will be avoided in situations where the animal deliberately or inadvertently becomes a stowaway in the traveller's luggage.
Pathway 3. This is used in scenario analysis to test the effect of non-compliance of the owner or smuggling. In this scenario, the animal is vaccinated but not protected, and the owner provides forged documents in an attempt to avoid the testing of antibody level and the 180-day waiting period; as a result, the waiting period is assumed to be 1 day as a worst-case scenario; the animal then passes the inspection and is released into Japan.
Pathway 4. The same as pathway 3 except that the animal is not inspected; this pathway is also used in scenario analysis to test the effect of smuggling.
Pathway 5. The same as pathway 3 except that the owner/breeder also forges the documentation for vaccination (i.e. the imported animal is not vaccinated against rabies).
Pathway 6. The same as pathway 5 except that the animal is not inspected; this scenario is used to test the effect of non-compliance of the personnel.
Pathways 7–12. Serves as the counterpart of pathways 1–6, respectively; these pathways assume that a healthy animal is being selected from the start, but is infected with rabies during the waiting period and does not show clinical signs upon arrival.
Pathway 13. Besides importation through AQS, there are also a substantial number of dogs and cats imported into Japan through USFJ (Fig. 2). Since the compliance level in USFJ is uncertain due to limited data, the following risk pathway is assumed: a rabies-infected animal, without vaccination and testing of antibody level, arrives in Japan and undergoes a quarantine period of 180 days at the USFJ facility; it does not show clinical signs during the quarantine and is released afterwards, resulting in entry of one rabies case. This is considered the most likely pathway due to the unanticipated nature of military service and so it is assumed that the service member would have very limited time to prepare for the necessary import procedures.
Pathway 14. This is used to test the effect of non-compliance of USFJ personnel by modelling the scenario where an animal without complete documentation is not subject to the mandatory 180-day quarantine.
Probability that an animal from a subregion (s) is incubating rabies (P I,s ). The number of rabies cases was assumed to be zero (hence a zero P I,s ) for the following subregions: Australia/New Zealand, Melanesia, Micronesia and Polynesia.

Country groupings
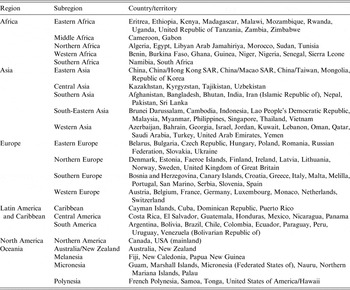
A total of 147 countries/territories with exportation of dogs and/or cats into Japan during 2010–2013 were included in the model, which are grouped into six regions with 22 subregions (Table 1).
List of countries/territories (a total of 147) with exportation of dogs and/or cats through AQS and/or USFJ into Japan during 2010–2013
Parameter estimation
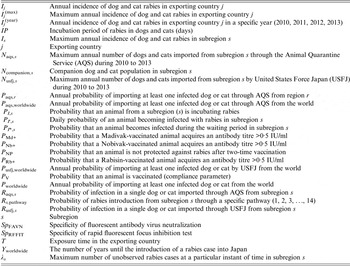
An alphabetical list of parameters and quantities used in the current model is shown in Table 2.
An alphabetical list of parameters and quantities used in the model
Incubation period of rabies in dogs and cats (IP)
This was modelled using a lognormal distribution with a mean of 35 days and a standard deviation of 36·8 days based on estimates described in Goddard et al. [Reference Goddard4].
Probability that an animal from a subregion (s) is incubating rabies (PI,s) (Fig. 2)
This probability was estimated based on the maximum annual incidence (I (max)) of dog and cat rabies in each exporting country (j) during 2010 to 2013 [6, 7]:
 $$I_j^{\left( {{\rm max}} \right)} = \max \left( {I_j^{\left( {2010} \right)}, I_j^{\left( {2011} \right)}, I_j^{\left( {2012} \right)}, I_j^{\left( {2013} \right)}} \right),$$
 $$ I_s = \mathop \sum \limits_j I_j^{\left( {{\rm max}} \right)}. $$
The maximum annual incidence was considered for two reasons: first, incidence provides a direct estimate of the probability or risk of a disease [Reference Thrusfield8] and second, the effect of under-reporting would be taken in account by considering the maximum number of cases. The maximum number of unobserved rabies cases at a particular instant of time was calculated by multiplying I
s
with the mean of the incubation period ( $\overline {IP} $
) and dividing the product by 365. Assuming new rabies cases follow a Poisson process, a gamma distribution was used to describe the uncertainty of the Poisson mean [Reference Vose9]:
$\overline {IP} $
) and dividing the product by 365. Assuming new rabies cases follow a Poisson process, a gamma distribution was used to describe the uncertainty of the Poisson mean [Reference Vose9]:
 $$\lambda _s = {\rm Gamma}\left( {\left( {I_s \times \displaystyle{{\overline {IP}} \over {365}}} \right) + 1,1} \right).$$
Finally, P I,s is given by dividing λ s with the companion dog and cat population in the corresponding subregion (N companion,s ) based on international databases [7, 10]. The P I,s estimated for each subregion is assumed to be representative of all the countries within the subregion taking into account the effect of incomplete or unavailable data on rabies cases and/or companion animal population for individual country.
Probability that an animal becomes infected during the waiting period (PI*)
For each subregion, this probability was given by:
 $$P_{I{^\ast}, s} = 1 - \left( {1 - P_{I^{\prime},s}} \right)^T, $$
where T is the exposure time of 210 days (30-day interval between vaccinations + 180-day waiting period) and P I′,s is the daily probability of an animal becoming infected with rabies given by:
 $$\displaystyle{{{\rm Gamma}\left( {I_s + 1,1} \right)} \over {365 \times N{\rm companion},s}}.$$
The estimates for P I,s are presented in Fig. 2. The number of rabies cases was assumed to be zero for the following rabies-free countries/regions recognized by AQS: Australia, New Zealand, Fiji, Guam, Hawaii and Iceland; hence the P I for the regions Australia/New Zealand, Melanesia, Micronesia and Polynesia was assumed to be zero.
Probability that an unprotected animal passes the neutralizing antibody titration test (P ST+ )
This was calculated using data in Cliquet et al. [Reference Cliquet11] and the methodology in Goddard et al. [Reference Goddard4]. Two serological tests, fluorescent antibody virus neutralization (FAVN) and the rapid fluorescent focus inhibition test (RFFIT) were included and their specificities (Sp FAVN and Sp RFFIT) were estimated to be Beta (124·8, 1·1248), having mean value of 0·99% and 90% prediction interval (PI) of 0·973–0·999, and Beta (92·97, 5·132), having mean value of 0·948 and 90% PI 0·906–0·979, respectively. P ST+ was given by:
 $$1 - \displaystyle{{Sp_{{\rm FAVN}} + Sp_{{\rm RFFIT}}} \over 2}. $$
The mean value of P ST+ was estimated to be 0·031 (90% PI 0·014–0·053).
Probability that the animal is not protected against rabies after two-time vaccination (P NP )
The AQS follows the international standard of World Organization for Animal Health (OIE) and test results of antibody level must be >0·5 IU/ml to be regarded satisfactory [Reference Takahashi-Omoe1]. Therefore, P NP was calculated based on this cut-off using the method described in Goddard et al. [Reference Goddard4] which combines the data of four vaccination studies [Reference Bahloul12, Reference Kallel13, Reference Minke14, Reference Sihvonen15]. Three rabies vaccines, Rabisin (Rb), Madivak (Md) and Nobivak (Nb), were considered and P NP was given by:
 $$\displaystyle{{\left( {1 - P_{{\rm Rb} +}} \right)^2 + \left( {1 - P_{{\rm Md} +}} \right)^2 + \left( {1 - P_{{\rm Nb} +}} \right)^2} \over 3}.$
The mean P NP was estimated to be 0·056 (90% PI 0·017–0·11). For animals that are infected with rabies before vaccination (pathways 1–4), the P NP was assumed to be 1.
Probability that an infected animal does not show clinical signs upon arrival in Japan (P NCS )
For pathways 1 and 2, the animal was assumed to be infected immediately before vaccination and this probability was estimated to be 0·0061 by calculating the probability that the incubation period is longer than the exposure time:
 $$P_{{\rm NCS}} = P\left( {IP \gt T} \right),$$
where T is the exposure time of 210 days.
For pathways 7 and 8, infection was assumed to occur any time during the waiting period and this probability was estimated to be 0·16 given by:
 $$P_{{\rm NCS}} = \displaystyle{{\mathop \sum \nolimits_{t = 1}^T P\left( {IP \gt t} \right)} \over T},\; $$
where T is 210 days.
For pathway 13, the P NCS is estimated to be 0·0098 based on a T of 181 days (1 day for arrival and a 180-day quarantine). For other pathways used in scenario analysis where the waiting period is assumed to be 1 day, P NCS was estimated to be 0·9999.
Compliance parameters
These included three probabilities: probability that an animal is vaccinated (P V), probability that an animal is serologically tested (P ST) and probability that an animal is inspected by an AQS officer (P C); they were set as 1 in the baseline model, and were decreased to 0·9 (90% compliance) and 0·8 (80% compliance) in the scenario analysis. It was assumed that owners who do not vaccinate their animal would also not take the animal for serological testing and so parameter P ST was always set to 0 for pathways 5, 6, 11 and 12.
Probability that an animal passes the inspection by AQS officer (P C+ )
This probability was set as 1 in both the baseline model and scenario analysis assuming that all animals not showing clinical signs of rabies or accompanied with forged documentation would be able to pass the inspection.
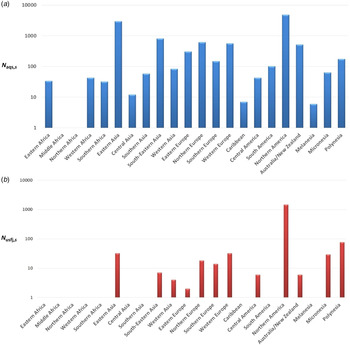
Annual number of dogs and cats imported from each subregion through AQS and USFJ (N aqs,s and N usfj,s)
The maximum annual number of importations during 2010–2013 was chosen in order to calculate the risk for the worst-case scenario (Fig. 3).
Maximum annual number of dogs and cats imported to Japan during 2010–2013 through (a) the Animal Quarantine Service and (b) United States Force Japan from each subregion, denoted as N aqs,s and N usfj,s , respectively.
Risk estimation and model outputs
The formulas for the probability of rabies introduction through each risk pathway [for each subregion (s)] are:
Pathway 1: R s,1 = P I,s × P V × P NP × P ST × P ST+ × P NCS × P C × P C+
Pathway 2: R s,2 = P I,s × P V × P NP × P ST × P ST+ × P NCS × (1 − P C)
Pathway 3: R s,3 = P I,s × P V × P NP × (1 − P ST) × P NCS × P C × P C+
Pathway 4: R s,4 = P I,s × P V × P NP × (1 − P ST) × P NCS × (1 − P C)
Pathway 5: R s,5 = P I,s × (1 − P V) × (1 − P ST) × P NCS × P C × P C+
Pathway 6: R s,6 = P I,s × (1 − P V) × (1 − P ST) × P NCS × (1 − P C)P C+
Pathway 7: R s,7 = (1 − P I,s ) × P V × P NP × P ST × P ST+ × P I*,s × P NCS × P C × P C+
Pathway 8: R s,8 = (1 − P I,s ) × P V × P NP × P ST × P ST+ × P I*,s × P NCS × (1 − P C)
Pathway 9: R s,9 = (1 − P I,s ) × P V × P NP × (1 − P ST) × P I*,s × P NCS × P C × P C+
Pathway 10: R s,10 = (1 − P I,s ) × P V × P NP × (1 − P ST) × P I*,s × P NCS × (1 − P C)
Pathway 11: R s,11 = (1 − P I,s ) × (1 − P V) × (1 − P ST) × P I*,s × P NCS × P C × P C+
Pathway 12: R s,12 = (1 − P I,s ) × (1 − P V) × (1 − P ST) × P I*,s × P NCS × (1 − P C)
Pathway 13: R s,13 = P I,s × P NCS × P C × P C+
Pathway 14: R s,14 = P I,s × (1 − P C).
The probability of infection in a single dog or cat imported from each subregion was calculated by summing up the R s,i of pathways from 1 to 12 (for AQS) and of pathways 13 and 14 (for USFJ):
 $$R_{{\rm aqs},s} = \mathop \sum \limits_{i = 1}^{12} R_{s,i}, $$
 $$R_{{\rm usfj},s} = \mathop \sum \limits_{i = 13}^{14} R_{s,i.} $$
The annual risk was calculated as the annual probability of importing at least one infected dog or cat into Japan. First, the annual probability of rabies introduction from subregion s was calculated by taking into account the N aqs,s and N usfj,s , respectively:
 $$P_{{\rm aqs},s} = 1 - \left( {1 - R_{{\rm aqs},s}} \right)^{N_{{\rm aqs},s}}, $$
 $$P_{{\rm usfj},s} = 1 - \left( {1 - R_{{\rm usfj},s}} \right)^{N_{{\rm usfj},s}}. $$
The annual probability of rabies introduction for each region was then given as:
 $$P_{{\rm aqs},r} = 1 - \mathop \prod \limits_s^{} \left( {1 - P_{{\rm aqs},s}} \right),$$
 $$P_{{\rm usfj},r} = 1 - \mathop \prod \limits_s^{} \left( {1 - P_{{\rm usfj},s}} \right).$$
Finally, the annual probability of rabies introduction through the importation of dogs and cats worldwide via AQS and USFJ, respectively, was calculated:
 $$P_{{\rm aqs},{\rm worldwide}} = 1 - \mathop \prod \limits_r^{} \left( {1 - P_{{\rm aqs},r}} \right)$$
 $$P_{{\rm usfj},{\rm worldwide}} = 1 - \mathop \prod \limits_r^{} \left( {1 - P_{{\rm usfj},r}} \right)$$
These two probabilities were combined to give a final probability representing the risk of rabies introduction into Japan through the importation of dogs and cats worldwide via both AQS and USFJ:
 $$P_{{\rm worldwide}} = 1 - \left( {1 - P_{{\rm aqs},{\rm worldwide}}} \right)\left( {1 - P_{{\rm usfj},\; {\rm worldwide}}} \right).$$
The number of years until the introduction of a rabies case into Japan was then estimated:
 $$Y_{{\rm worldwide}} = {\rm} 1/P_{{\rm worldwide}}. $$
Model implementation
The model was developed in @Risk version 6.3 (Palisade, USA) within Microsoft Excel 2013, and was run with 50 000 iterations using Latin Hybercube sampling for each simulation. Results of model outputs are presented as: mean (5th percentile, 95th percentile).
Sensitivity and scenario analyses
To assess the effect of uncertainty in the current model, sensitivity analysis was performed using Spearman's correlation coefficient to rank all model input parameters according to their contributions to the variance of model output Y worldwide. Scenario analysis was performed to assess the effect of changes in selected input parameters summarized in Table 3.
List of scenarios that were tested in scenario analysis and the modified parameter values under each scenario

* The P
NP for this scenario is given by $\displaystyle{{\left( {1 - P_{{\rm Rb} +}} \right) + \left( {1 - P_{{\rm Md} +}} \right) + \left( {1 - {\rm P}_{{\rm Nb} +}} \right)} \over 3}$
.
$\displaystyle{{\left( {1 - P_{{\rm Rb} +}} \right) + \left( {1 - P_{{\rm Md} +}} \right) + \left( {1 - {\rm P}_{{\rm Nb} +}} \right)} \over 3}$
.
RESULTS
Risk quantification
The lists of model outputs for each subregion and region are shown in Table 4, and Supplementary Tables S1 and S2. For the probability of infection in a single dog or cat imported into Japan, the R aqs,worldwide is estimated to be 1·62 × 10−9 (90% PI 5·76 × 10−12–7·14 × 10−9), while the R usfj,worldwide is estimated to be 4·04 × 10−9 (90% PI 1·74 × 10−9–3·39 × 10−9), giving a R worldwide of 2·16 × 10−9 (90% PI 6·65 × 10−11–6·48 × 10−9). For the annual probability that at least one infected dog or cat is imported into Japan, the P aqs,worldwide is 2·02 × 10−5 (90% PI 5·15 × 10−6–4·65 × 10−5), while the P usfj,worldwide is 5·45 × 10−6 (90% PI 4·51 × 10−6–6·51 × 10−6), giving a P worldwide of 2·57 × 10−5 (90% PI 1·06 × 10−5–5·22 × 10−5). In terms of the number of years until the introduction of a rabies case, Y aqs,worldwide is 78 034 (90% PI 21 479– 194 204), while Y usfj,worldwide is 185 762 (90% PI 153 500– 221 892), giving an overall Y worldwide of 49 444 (90% PI 19 170– 94 641).
Number of years until the introduction of a rabies case into Japan (Y) from each subregion or region

AQS, Animal Quarantine Service; USFJ, United States Force Japan.
Values are presented as: mean (5th percentile, 95th percentile); ×10n refers to multiplying by 10 n . There was no import of dogs or cats into Japan during 2010–2013 from the following subregions: Middle Africa and Northern Africa (via AQS); Eastern Africa, Middle Africa, Northern Africa Western Africa, Central Asia, Southern Asia and South America (via USFJ). The number of rabies cases was assumed to be zero for the following subregions: Australia/New Zealand, Melanesia, Micronesia and Polynesia. The Y S for all these subregions were therefore assumed to be zero.
Sensitivity analysis
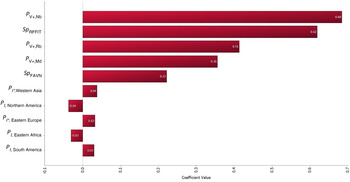
The results of the sensitivity analysis are shown in Figure 4. The top-five most correlated parameters include P V+,Nb, Sp RFFIT P V+,Rb, P V+,Md and Sp FAVN.
Tornado graph illustrating the results of sensitivity analysis. All model input parameters are ranked by Spearman's correlation coefficient according to their contributions to the variance of model output Y worldwide. The 10 most correlated input parameters are shown in this figure. The top-five most correlated parameters include P V+,Nb, Sp RFFIT P V+,Rb, P V+,Md and Sp FAVN.
Scenario analysis
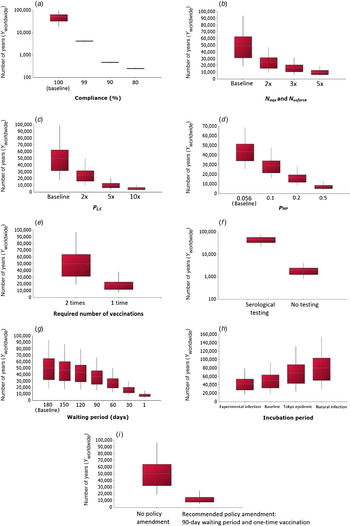
The effect of different scenarios on the number of years until the introduction of a rabies case (Y worldwide) was investigated and results are shown in Figure 5. From this analysis, it was concluded that non-compliance would significantly increase the risk of rabies introduction, with Y worldwide decreasing to 249 (90% PI 231–268) years with a 80% compliance level (Fig. 5a ). Increases in the number of imports and rabies cases would also increase the risk of rabies introduction respectively as Y worldwide is reduced to 9878 (90% PI 3771–18 723) years with a fivefold increase in the import level (Fig. 5b ) and to 5030 (90% PI 1845–10 051) years with a tenfold increase in the number of cases (Fig. 5c ). The scenario where rabies vaccines with poor efficacy are used in the exporting country (which may represent less-developed countries) was tested and Y worldwide was predicted to decrease to 7015 (90% PI 3590– 12 457) years if the efficacy falls to 50% (Fig. 5d ). In addition, if the required number of rabies vaccination is changed from two times to one time due to policy amendment, Y worldwide would decrease to 18 453 (90% PI 7608–37 553) years (Fig. 5e ). If the compulsory serological testing were to be ceased, there would be a large increase in risk of rabies introduction as Y worldwide was estimated to be 1971 (90% PI 811–4004) years (Fig. 5f ). The risk of rabies introduction would also increase as the waiting period is shortened as, with a 1-day waiting period, Y worldwide was estimated to be 7996 (90% PI 3963–14 566) years (Fig. 5g ). The impact of using different probability distributions for the incubation period was also assessed (Fig. 5h ); the risk of rabies introduction would decrease with the use of a shorter incubation period, e.g. Y worldwide would increase to 68 224 (90% PI 24 492– 131 171) years with an incubation period of lognormal (27·3, 20·2) estimated from the 1947–1954 Tokyo epidemic [Reference Tojinbara16]. This is because the probability that the infected animal does not show clinical signs upon arrival in Japan (P NCS) would decrease as the incubation period is shortened. For the final scenario analysis (Fig. 5i ), under the policy amendment recommended by the authors, i.e. a 90-day waiting period and one-time vaccination, the risk of rabies introduction would only increase fourfold with Y worldwide decreasing to 12 314 (90% PI 4971–24 350) years.
Scenario analysis depicting the effects of tested scenarios on the number of years until the introduction of a rabies case Y worldwide. For each box-whisker plot, the white dotted line indicates the mean; the length of the box indicates the interquartile range; the whiskers indicate the 5th and 95th percentiles, respectively. For panels (a) and (f) a base-10 log scale was used for the y axis. For panel (d), a fixed value of 0·056 was used as the baseline.
DISCUSSION
The risk of rabies introduction into Japan through the importation of dogs and cats worldwide identified in this study is very low. The number of years until the introduction of a rabies case (Y worldwide) is especially large when compared to the results of similar QRA performed by others such as the UK which estimated 211 (90% PI 177–247) years [Reference Goddard4] and Taiwan which estimated 1822 years (median, 5th percentile is 473 years) [Reference Weng17]. This difference is considered to be due to Japan's stricter policy requiring two-time vaccination (hence a smaller P NP) and a lower importation level (four times lower when compared with the value included in the UK model). Both UK and Taiwan have a strict import regimen resembling that of Japan. Taiwan's regimen additionally requires a 21-day quarantine upon arrival and a second serological testing. The results from Goddard et al. 2012 were estimated according to the European Union Pet Movement Policy (EUPMP), which was implemented in 2012. Compared to the previous UK Pet Travel Scheme (PETS), the EUPMP has a shorter waiting period (it was shortened from 180 days to 21 days for EU and listed countries or 3 months for unlisted countries) and the requirement of serological testing restricted only to unlisted countries.
In terms of the number of dogs and cats imported via AQS and USFJ (Fig. 3), the total N aqs,s is 11 445, while the total N usfj,s is 1690 which is 6·8-fold lower. The USA (mainland) from the subregion North America is the highest exporter contributing to 41% of the total N aqs,s and 86% of the total N usfj,s (the N aqs and N usfj from USA is 4362 and 1458, respectively). Eastern Asia (mostly from China, Republic of Korea and Taiwan) is the second highest exporter (N aqs is 2979) contributing to 26% of the total N aqs ,s . In terms of the probability that an imported animal is incubating rabies (Fig. 2), the P I,s is highest for Middle Africa with a mean of 3·44 × 10−4 (90% PI 2·68 × 10−4–4·88 × 10−4). Nonetheless, there was no importation of dogs and cats from this subregion during 2010–2013. The P I,s is lowest for Western Europe with a mean of 3·51 × 10−8 (90% PI 4·44 × 10−9–9·00 × 10−8). In terms of the overall annual probability of rabies introduction, the P aqs,worldwide is highest for Southeastern Asia with a mean of 5·95 × 10−6 (1·47 × 10−6–1·4 × 10−5), while the P aqs,usfj is highest for North America with a mean 3·56 × 10−6 (90% PI 2·68 × 10−6–4·55 × 10−6).
Illegal importation or smuggling of animals is a serious issue which could greatly compromise a country's import regimen in preventing the introduction of diseases and its effect on the risk of rabies entry has been evaluated in various QRA [Reference Goddard4, Reference Jones5, Reference Weng17, Reference Ramnial18]. The impact of smuggling or non-compliance was assessed in the current model by considering the probability of vaccination (P V), serological testing (P ST) and border control (P C), and the result indicates that the risk of rabies introduction into Japan would increase 12-fold with even a rate of 1% non-compliance (Fig. 5a ). Because there are numerous routes by which an animal could be smuggled into Japan, it is difficult to estimate the exact degree of smuggling activity; by assuming non-compliance levels of 1–20%, the result of our scenario analysis could be overestimating the actual risk of smuggling. Nonetheless, this analysis is essential in highlighting the importance of continuing professional training of personnel in border control.
Moreover, scenario analysis demonstrated that the introduction of serological testing into the import regimen since 2004 is effective in reducing the risk of rabies introduction into Japan by 22-fold (Fig. 5f ), agreeing with the results in Kamakawa et al. [Reference Kamakawa2]. The waiting period, on the other hand, could be reduced to between 90 and 150 days without considerably increasing the risk of rabies introduction (Fig. 5g ). Indeed, if the waiting period is 90 days, the risk of rabies introduction is only increased 1·3-fold. The reduction in waiting period has been a topic in import policy because of animal welfare issues and also the potential encouragement of smuggling activities [Reference Goddard4, Reference Jones5, Reference Weng17]. Although it is difficult to measure the relationship between the strictness of the import regimen and the level of smuggling activities, there is the potential for policy amendment to promote compliance. Indeed, under the recommended policy amendment with a 90-day waiting period and single vaccination (Fig. 5i ), the risk of rabies introduction is still very low and would only increase fourfold with Y worldwide decreasing to 12 314 (90% PI 4971–24 350) years. Since even a 1% non-compliance could greatly increase the risk under the current rabies prevention system in Japan, any change in policy that might promote compliance would be advantageous. The recommended policy amendment, which describes a relaxation of the current system, does not markedly increase the risk of rabies introduction into Japan. However in reality, perhaps counterintuitively, there is a possibility that this risk could actually be reduced due to the policy amendment leading to increased compliance.
The incubation period (IP) distribution of rabies is a fundamental input variable commonly used in QRA. Tojinbara et al. [Reference Tojinbara16] have recently estimated an IP of lognormal (27·3, 20·2) based on the 1947–1954 Tokyo epidemic. In the current model, the IP distribution of lognormal (35, 36·8) combines the results of experimentally infected animals [Reference Fekadu19–Reference Bingham22] and naturally infected animals or naturally acquired cases [23–Reference Fooks26]. Data from experimentally infected animals would yield a shorter IP of lognormal (23·7, 15); it is expected that these animals were challenged with a high viral dose and so they manifested clinical signs much quicker than infected animals in real life, in which case the IP estimated using these data is an underestimation of the true IP. On the other hand, data from naturally infected animals or naturally acquired cases would yield a longer IP of lognormal (39·7, 41·9) but there is uncertainty relating to these data as it is not known when the animals were infected. Therefore, a scenario analysis using these different IP distributions was performed and it indicates that the risk of rabies introduction would decrease with a shorter incubation period (Fig. 5h ).
In terms of the risk associated with importation of rabies from the United States of America (mainland), our study estimated a Y aqs of 542 167 years (median) which is 110 times longer than the result in Kamakawa et al. [Reference Kamakawa2] which is 4932 years (median). This big difference is mainly due to the effect of re-parameterization for example the probability that the animal is infected during waiting period (P I*,s ) and the specificities of FAVN and RFFIT (Sp FAVN and Sp RFFIT), thereby highlighting the importance of continued scientific research for improved parameter estimation.
In QRA it is good practice to perform sensitivity analysis to assess the uncertainty in the model because uncertainty reflects lack of precise knowledge of the input variables and could be reduced in future risk assessment with further research [Reference Thrusfield8, 27]. In the current model, sensitivity analysis was performed using Spearman's rank correlation and it indicates that uncertainty is largely attributed to input variables related to vaccine efficacy and the specificity of the serological test, i.e. P V+,Nb, Sp RFFIT P V+,Rb, P V+,Md and Sp FAVN (Fig. 4). This result suggests that further studies on the efficacies of rabies vaccine and serological test used in exporting countries could benefit the parameterization and scientific accuracy of future QRA.
Finally, the annual probability of rabies introduction through the importation via USFJ (mean P usfj,worldwide is 5·45 × 10−6) is only 3·7-fold lower than the risk through the importation via AQS (mean P aqs,worldwide is 2·02 × 10−5). It was concluded that this risk must not be overlooked and further QRA would help reduce the uncertainty of the results in this study. In the current model, the parameters used for this risk pathway are largely based on the assumption that all animals imported via USFJ would undergo a quarantine of 180 days. Detailed information including the actual implementation of the import regimen in USFJ and the level of compliance are warranted for a more accurate risk assessment.
CONCLUSION
The risk of rabies introduction into Japan through the importation of dogs and cats is very low. The current import regimen will maintain this level of risk, even if the import level and rabies prevalence in the world increase considerably in the future. However, non-compliance or smuggling activities could substantially increase the risk of rabies introduction. The immense potential for policy amendment to promote compliance is demonstrated in various scenario analyses highlighting that the waiting period and the required number of vaccination could be reduced. Nonetheless, serological testing should not be ceased. These evidence-based recommendations would guide policy decisions strengthening the current rabies prevention system in Japan.
SUPPLEMENTARY MATERIAL
For supplementary material accompanying this paper visit https://doi.org/10.1017/S0950268816002995.
ACKNOWLEDGEMENTS
This study was conducted as part of Research on Emerging and Re-emerging Infectious Diseases and Immunisation, supported by the Health and Labour Sciences Research Grants of the Ministry of Health Labour and Welfare (grant number H25-Shinko-Shitei-004). Input from the Animal & Plant Health Agency (APHA) was financially supported by Defra, Scottish Government and Welsh Government as part of the UK National Reference Laboratory for rabies (project SV3500).
DECLARATION OF INTEREST
None.


