


Serum procalcitonin (PCT) is frequently measured in patients with signs or symptoms of bacterial infection and is often elevated in patients with bacterial pneumonia (bPNA) and septic shock. Reference Schuetz, Christ-Crain and Müller1 PCT is a glycoprotein produced by thyroid parafollicular C cells Reference Morgenthaler, Struck, Fischer-Schulz, Seidel-Mueller, Beier and Bergmann2 as part of the proinflammatory response of the innate immune system, Reference Becker, Nylén, White, Müller and Snider3 and it is upregulated in response to inflammatory cytokines released during bacterial infections. Reference Melendi, Laham and Monsalvo4 PCT level may be a useful marker of bacterial infection, both diagnostically and prognostically, particularly in patients with pneumonia and sepsis. Reference Müller, Becker and Schächinger5,Reference Müller, Harbarth and Stolz6 Additionally, prospective studies have demonstrated the utility of PCT monitoring as part of clinical algorithms to guide decisions around initiation and de-escalation of antibiotic therapy in patients presenting with bacterial pneumonia and sepsis. Reference Soni, Samson and Galaydick7,Reference Townsend, Adams and Galiatsatos8 PCT testing has generally been found to reduce overall antibiotic exposure without increasing adverse events. Reference Broyles9,Reference Schuetz, Briel and Christ-Crain10
Recent studies have found a correlation between elevated PCT level and disease severity in patients admitted with severe coronavirus disease (COVID-19). Reference Hu, Han, Pei, Yin and Chen11–Reference Chen, Zhou and Dong19 However, PCT elevation tends to be higher in those who have a coexisting bacterial infection, and low serum PCT may identify patients at lower risk for bacterial coinfection and adverse outcomes. Reference Fabre, Karaba and Amoah20,Reference Atallah, Warren and Roberts21 Bacterial coinfections in patients with COVID-19 are rare, with an estimated incidence of <10%. Reference Langford, So and Raybardhan22–Reference Lansbury, Lim, Baskaran and Lim24 Nevertheless, many patients with COVID-19 receive antibiotic therapy, and ∼25% receive broad-spectrum antibiotics, Reference Langford, So and Raybardhan25–Reference Goncalves Mendes Neto, Lo and Wattoo27 which increases the risks for antimicrobial resistance and for antimicrobial-associated adverse events.
In this single-center, retrospective, observational study of patients hospitalized with COVID-19, we sought to characterize the natural course of serum PCT levels during hospitalization for COVID-19, to assess its relationship to coexisting bacterial pneumonia, and to better understand how serum PCT is used in clinical decision making around antimicrobial use for COVID-19 patients.
Methods
We conducted a retrospective observational study of patients hospitalized at Michigan Medicine between March 1, 2020, and October 31, 2021. The study was approved by the Michigan Medicine Institutional Review Board (no. HUM00205658). We included patients aged ≥18 years with a positive test for SARS-CoV-2 and a serum PCT level obtained within 48 hours of hospital presentation. A structured query was used to retrospectively extract patient demographic and comorbidity data, as well as information on initiation of antibiotics. Patients were excluded if they were being treated with antibiotics for a nonpulmonary, coexisting, bacterial infection on admission, it they were being treated with only azithromycin for a COPD exacerbation, or if they had a pre-existing diagnosis of cystic fibrosis with positive respiratory cultures. Prophylactic antibiotics were not counted in the analysis of antibiotic treatments. For patients started on an antibiotic, the presence of bacterial pneumonia was determined through retrospective chart review using criteria proposed by Karaba et al., Reference Karaba, Jones and Helsel28 with patients classified as having proven, probable, possible, or no bPNA based on clinical, laboratory, radiographic, and microbiologic criteria obtained within the first 48 hours of hospital presentation (Supplementary Table 1 online). Reference Karaba, Jones and Helsel28
Baseline patient characteristics were summarized as number and percentage for categorical variables and as median (interquartile range or IQR) for continuous variables. Categorial variables were compared using χ Reference Morgenthaler, Struck, Fischer-Schulz, Seidel-Mueller, Beier and Bergmann2 tests, and continuous variables were compared using Wilcoxon rank-sum tests. Associations between PCT level and covariates with antibiotic initiation and antibiotic duration utilized logistic regression models and negative binomial models, respectively, controlling for baseline confounders. Because death or hospital discharge may have skewed results regarding antibiotic duration, a sensitivity analysis was conducted for antibiotic duration, which utilized a Cox proportional hazards model with patients censored at the time of death or hospital discharge if this event occurred during their antibiotic course. The association between PCT and covariates with the number of antibiotic classes and their associated antibiotic risk class that patients were exposed to were also assessed using logistic regression models. Antibiotic risk classifications can be found in Supplementary Table 2 (online). Reference Baggs, Jernigan, Halpin, Epstein, Hatfield and McDonald29–Reference Isaac, Scher and Djukovic32
Secondary outcomes considered included length of stay and survival time. A 2-sided P < .05 was considered statistically significant for all tests. A detailed explanation of statistical analyses can be found in Supplementary Material section 1 (online). The statistical analysis was completed using SAS version 9.4 software (SAS Institute, Cary, NC).
Results
Demographics and overall antimicrobial use
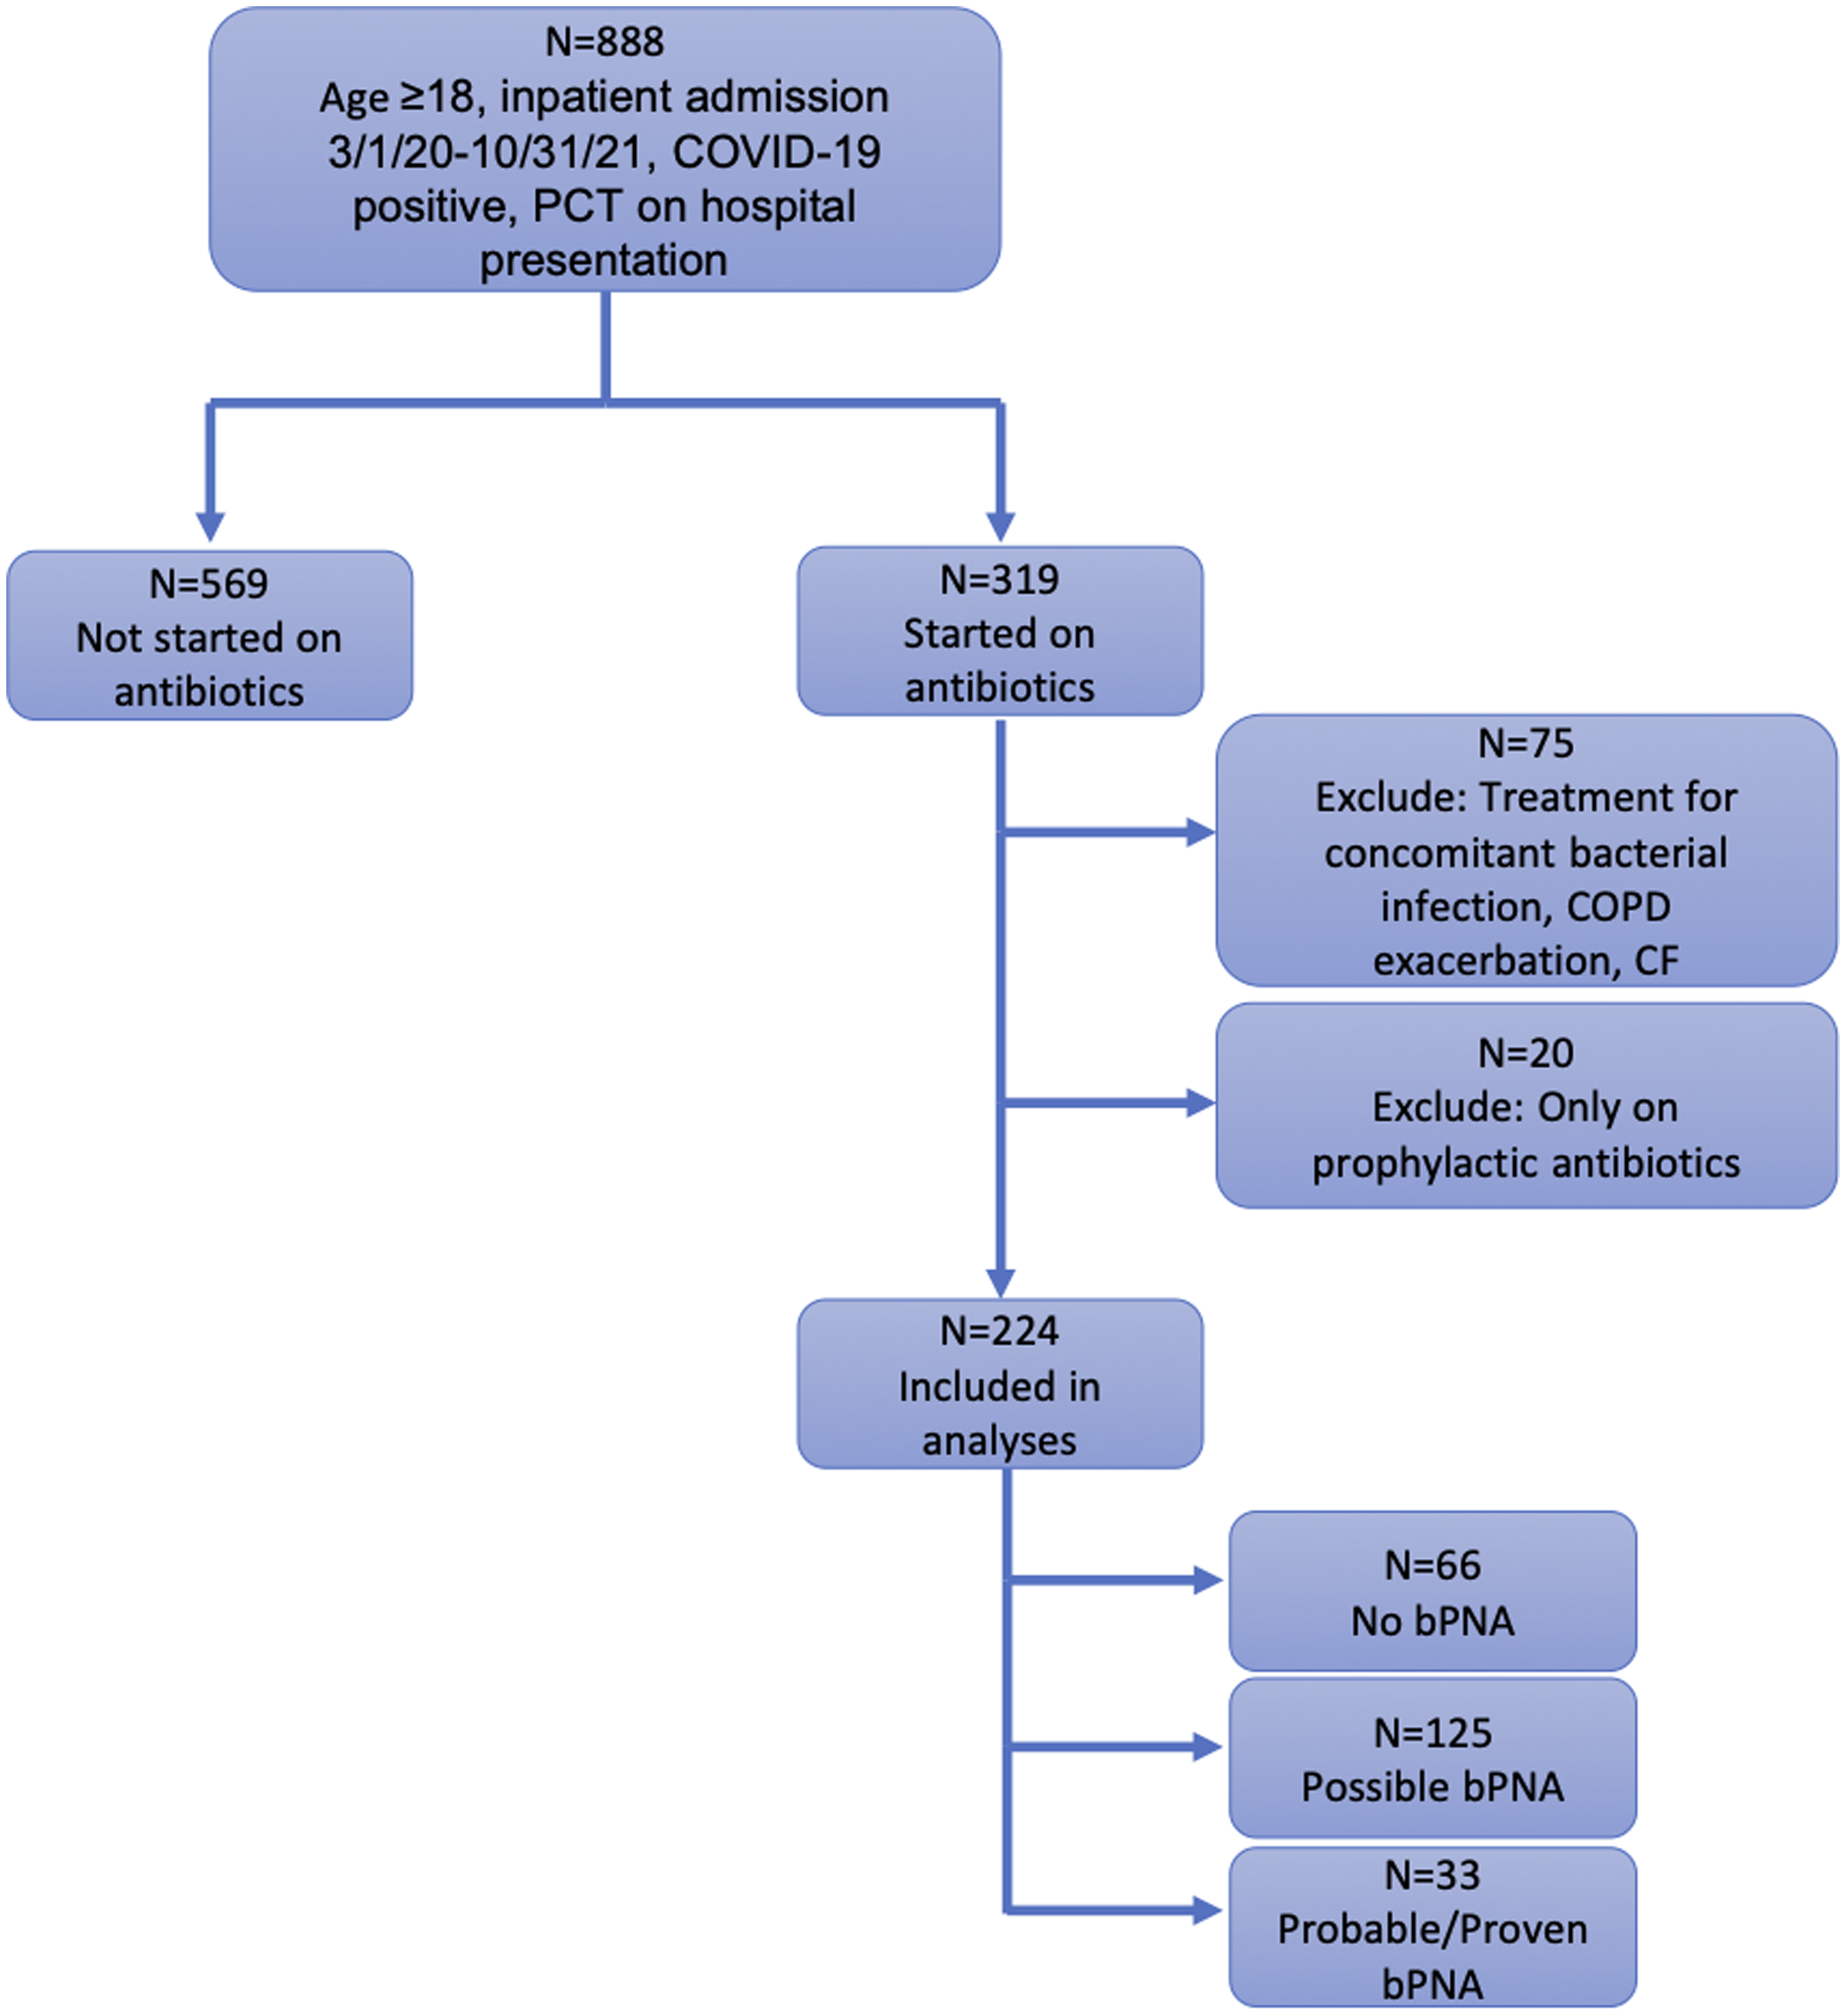
In total, 793 patients hospitalized between March 1, 2020, and October 31, 2021, met inclusion criteria; 224 (28.2%) were initiated on antibiotics and 569 (71.8%) were not started on antibiotics. Of those started on antibiotics, 33 (14.7%) had proven or probable bPNA, 125 (55.8%) had possible bPNA, and 66 (29.5%) had no bPNA (Fig. 1). The median age of patients was 62 years (IQR, 52–72), 322 (40.6%) were female, and median-weighted Elixhauser comorbidity index was 17 (IQR, 6–30). Patients started on antibiotics had higher weighted Elixhauser scores (22 vs 17; P <.001) and were more likely to have comorbid hypertension (80.4% vs 68.9%; P = .001) or diabetes (53.6% vs 38.1%; P < .001). Additionally, patients were more likely to be started on antibiotics earlier in the pandemic; those who received antibiotics were admitted a median of 239 days from the beginning of the pandemic versus 381 days for those not started on antibiotics (P < .001) (Table 1).
Flow diagram of study population.
Baseline Patient Characteristics

Note. HIV/AIDS, human immunodeficiency virus/acquired immunodeficiency syndrome.
a Median (IQR) displayed for continuous variables; no. (%) displayed for categorical variables
b P values for difference between antibiotic vs no-antibiotic groups.
Procalcitonin measurement frequency and initial values versus antibiotic use
On average, patients had a mean of 2.6 (SD, ±3.7) serum PCT measurements; this mean was 4.1 (SD, ±5.2) if they were receiving antibiotics versus 2.0 ± 2.6 if they were not receiving antibiotics (rate ratio [RR], 2.09; 95% confidence interval [CI], 1.82–2.39; P < .001). Of those started on antibiotics, patients with possible bPNA had the greatest number of PCT measurements, with an average of 5.0 (SD, ±6.1) PCT results. The odds of receiving antibiotics increased by a factor of 1.27 (95% CI, 1.20–1.33; P < .001) for every 50% increase in initial PCT level. Furthermore, 68.5% of those not started on antibiotics had an initial PCT ≤0.25 ng/mL versus 29.0% of those initiated on antibiotics (Table 2). After controlling for potential confounders, initial PCT was still positively associated with antibiotic initiation (odds ratio [OR], 1.23; 95% CI, 1.17–1.30; P < .001). Antibiotic use declined further into the COVID-19 pandemic, with decreased odds of antibiotic initiation (OR, 0.93; 95% CI, 0.92–0.95; P < .0001) every additional 2 weeks of the pandemic. A weighted Elixhauser score was also significantly positively associated with antibiotic initiation (OR, 1.01; 95% CI, 1.00–1.03; P < .001) (Table 3).
Frequency of PCT measures and initial PCT values
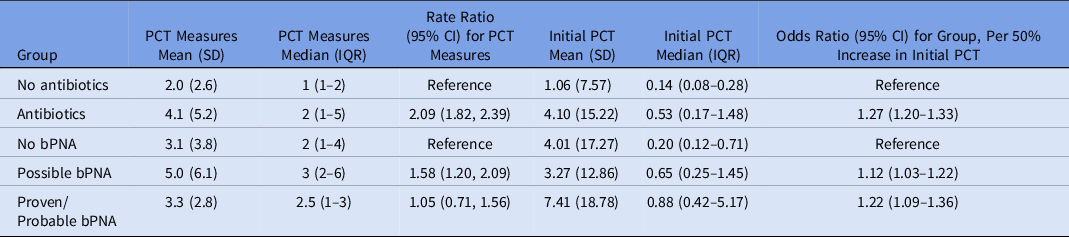
Note. PCT, procalcitonin; SD, standard deviation; IQR, interquartile range; CI, confidence interval; bPNA, bacterial pneumonia.
Multivariable Logistic Regression and Negative Binomial Models of Covariate Associations With Antibiotic Initiation (n = 793) and Antibiotic Duration (n = 224)

Note. PCT, procalcitonin; OR, odds ratio; CI, confidence interval; RR, rate ratio; bPNA, bacterial pneumonia.
Procalcitonin, pneumonia, and antibiotic exposure: Duration of therapy and number of antibiotic classes
Among patients receiving antibiotics, the initial median PCT level was 0.20 (IQR, 0.12–0.71) for those with no bPNA, 0.65 (IQR, 0.25–1.45) for those with possible bPNA, and 0.88 (IQR, 0.42–5.17) for those with probable or proven bPNA. These data correspond to odds ratios of 1.12 (95% CI, 1.03–1.22) for possible bPNA versus no bPNA and 1.22 (95% CI, 1.09–1.36) for probable or proven bPNA versus no bPNA for every 50% increase in PCT (Table 2). Although patients with no bPNA had lower initial PCT levels, 50% had at least 1 PCT measurement that was >0.25 ng/mL.
Antibiotic duration demonstrated a similar trend with respect to the bPNA group, with a median antibiotic duration of 3 days (IQR, 2–8) for patients with no bPNA, 7 days (IQR, 4–14) for patients with possible bPNA, and 9 days (IQR, 6–26) for patients with probable or proven bPNA. Patients with no bPNA and initial PCT level >0.25 ng/mL had significantly longer mean antibiotic durations (ie, 9.8 ± 11.5 days) than those with no bPNA and initial PCT ≤0.25 ng/mL (ie, 4.8 ± 7.1 days; P = .006). Similarly, patients with possible bPNA and PCT >0.25 ng/mL had significantly longer antibiotic durations (ie, 12.8 ± 15.4 days) than those with possible bPNA and initial PCT ≤0.25 ng/mL (ie, 7.6 ± 8.6 days; P = .01). We did not detect a significant difference in antibiotic duration based on initial PCT for those with probable or proven bPNA: 17.9 ± 17.4 vs 18.5 ± 13.7 for PCT ≤0.25 ng/mL vs PCT> 0.25 ng/mL, respectively (P = .68) (Fig. 2). On multivariable analysis, initial PCT, percentage change in daily PCT, and bPNA group were all independently associated with duration of antibiotic therapy, with rate ratios for days of antibiotic therapy of 1.04 (95% CI, 1.01–1.08; P = .008) for initial PCT level, 1.03 (95% CI, 1.01–1.05; P = .007) for percentage change in daily PCT, and 1.51 (95% CI, 1.23–1.84; P < .0001) for bPNA (Table 3).
Initial procalcitonin values by bacterial pneumonia (bPNA) group and median antibiotic duration. The line graph shows the percentage of patients in each bacterial pneumonia group with low initial procalcitonin values. This percentage decreases as the likelihood of a bacterial infection increases. The side-by-side bar chart shows antibiotic durations by initial procalcitonin value for each bacterial pneumonia group. Antibiotic durations were generally higher for those with initially elevated procalcitonin and for those with a bacterial infection. Note the small N (N = 4) for probable or proven bPNA with low initial procalcitonin values, likely skewing the duration for this group. The difference in antibiotic durations for probable or proven bPNA with low initial procalcitonin values versus high initial procalcitonin values is nonsignificant.

Patients with probable or proven bPNA were exposed to a larger number of antibiotic classes, with an average of 4.2 (SD, ±1.8) classes received, compared to 3.5 (SD, ±1.7) for those with possible bPNA and 3.0 (SD, ±1.7) for those with no bPNA. The most prescribed antibiotic class was vancomycin (n = 168, 75.0%), followed by a β-lactam or lactamase inhibitor (n = 166, 74.1%). Nearly all patients received an antibiotic classified as high risk (n = 217, 96.9%) (Table 4). The association of antibiotic classes with bPNA group remained significant after controlling for potential baseline confounders, with a rate ratio for number of antibiotic classes of 1.17 (95% CI, 1.04–1.31; P = .009) when going from no bPNA to possible bPNA to probable or proven bPNA. Initial PCT level and percentage changes in daily PCT were not significantly associated with the number of classes of antibiotics that patients received (Table 5).
Number of Antibiotic Classes Received and Antibiotic Risk Class Exposure by bPNA Group (n = 224)

Note. bPNA, bacterial pneumonia; SD, standard deviation.
Multivariable Associations of Covariates With Number of Antibiotic Classes (n = 224)

Note. bPNA, bacterial pneumonia; RR, rate ratio; CI, confidence interval; PCT, procalcitonin.
The results of secondary outcome analyses are shown in Supplementary Tables 3 and 4 (online). In the sensitivity analysis for antibiotic duration, the associations identified in the initial multivariable analysis remained significant (Supplementary Table 5 online).
Discussion
In this retrospective study of 793 patients hospitalized at Michigan Medicine with COVID-19, serum PCT levels were notably elevated, but elevations were more pronounced in patients with bacterial coinfection. Antibiotics were started in >25% of patients, even if bacterial coinfection was not present. Initial serum PCT level correlated with the decision to initiate antibiotics; lower initial PCT levels were associated with lower likelihood of antibiotic initiation. Of those not started on antibiotics, 68.5% had an initial PCT level ≤0.25 ng/mL, whereas only 29.0% of patients started on antibiotics had initial PCT level ≤0.25 ng/mL. Patients with no bPNA but with an elevated initial PCT level were often initiated on antibiotics due to concern for a suspected infection, which was later not confirmed, at which point antibiotics were often discontinued. These occurrences are demonstrated in our data by the longer antibiotic durations in patients with probable or proven bPNA compared to those with no bPNA. Both initial PCT level and the trend in PCT level over time were associated with the duration of treatment. PCT-level associations with both treatment initiation and duration were independent of bPNA status and comorbidities.
The prognostic and diagnostic use of PCT in patients presenting with COVID-19 pneumonia has garnered much interest as has its utility in antibiotic decision making in this population. Normally, PCT levels increase within hours of bacterial infection, Reference Müller, White, Nylén, Snider, Becker and Habener33 with a rapid decrease following response of the bacterial infection to antimicrobial therapy, Reference Gilbert34 and levels usually remain low in viral infections. Reference Müller, Becker and Schächinger5 The elevations of PCT in patients with COVID-19 have been hypothesized to be due to either bacterial coinfections in patients with severe disease or neutrophilia in the absence of bacterial infection. Reference Heer, Mandal and Kho35 Because COVID-19 has resulted in significant morbidity and mortality during the course of the pandemic, with >514 million cases and >6 million deaths reported globally as of May 2022, 36 and the considerable overlap between the symptoms of COVID-19 and bacterial pneumonia, PCT measures may add additional information to aid in antimicrobial stewardship.
Observational studies exploring PCT-guided antibiotic prescribing aimed at curbing the use of unnecessary antibiotics in patients with COVID-19 have shown that patients with low serum PCT values received fewer days of antibiotic therapy and suggest that antibiotics can be safely withheld in patients with low serum PCT levels. Reference Powell, Howard and Llewelyn37–Reference Williams, Mair and de Silva41 Conversely, PCT testing in patients with COVID-19 may result in the unnecessary use of antibiotics because PCT levels may be elevated despite the absence of bacterial coinfection. Reference Fabre, Karaba and Amoah20
Our results are consistent with recent research and demonstrate that, despite the low prevalence of bacterial coinfection at presentation, patients with COVID-19 may have elevated PCT levels leading to longer courses of antibiotics, particularly “high-risk” antibiotics. This finding contrasts with Michigan Medicine clinical guidelines for the use of PCT in clinical decision making, which state that PCT level should not be used to extend treatment duration in the setting of clinical stability and should not be used in isolation to decide whether antibiotics should be started.
Michigan Medicine guidelines recommend a threshold of PCT level of >0.25 ng/mL to indicate that bacterial infection is likely. Because COVID-19 can raise the PCT level in the absence of bacterial coinfection, this threshold may need to be increased when assessing the probability of bacterial coinfection with COVID-19. In a retrospective analysis, Fabre et al Reference Fabre, Karaba and Amoah20 compared receiver operator characteristic (ROC) curves for the prediction of bacterial community acquired pneumonia using clinical criteria and PCT cutoff points of ≥0.25 ng/mL versus ≥0.5 ng/mL, and they did not detect a significant difference between these 2 cutoff values. Reference Fabre, Karaba and Amoah20 In a cohort of COVID-19 patients who had admission blood or respiratory cultures, Relph et al Reference Relph, Russell and Fairfield42 reported that patients with any positive culture had higher median admission PCT levels, but PCT data performed poorly as a diagnostic test based on ROC analysis. Reference Relph, Russell and Fairfield42 Although our study was meant to be descriptive as opposed to predictive, we constructed an ROC curve using our data for illustrative purposes. It suggested possible discriminatory utility using a PCT cutoff of ≥0.25 ng/mL for proven or probable bPNA, with an area under the ROC curve of 0.72 (95% CI, 0.65–0.78), but we did not detect a significant increase in diagnostic accuracy using higher PCT cutoff values. Future prospective studies are needed to determine whether higher PCT cutoff values would be more likely to predict bacterial coinfection in COVID-19 patients.
As a retrospective observational study, our results are potentially biased by unobserved confounding variables not controlled for in our analyses. Other baseline patient characteristics that differed by antibiotic initiation, including race, hypertension, diabetes, and weighted Elixhauser score, were controlled for by inclusion in the multivariable model selection algorithm. Additionally, our data set spans ∼18 months of the pandemic when vast changes in the understanding of COVID-19 and its corresponding treatments emerged. Although we attempted to account for this by including time as a covariate in our models, residual confounding from the effects of this varying knowledge is possible, and we did not have the granular data on specific changes in practice across the different periods of the pandemic to explore this further. Furthermore, our analysis is correlational not causal. Although we identified an association between serum PCT trends and antibiotic initiation and duration, we were unable to determine whether PCT causally drove treatment decisions. Future prospective studies are needed to determine whether PCT data can be used to safely make decisions around antibiotic treatment for bacterial infection in COVID-19 patients, including when to start or stop antimicrobial therapy in patients with an elevated PCT level but no other signs or symptoms of bacterial coinfection.
Supplementary material
For supplementary material accompanying this paper visit https://doi.org/10.1017/ice.2022.262
Acknowledgements
Financial support
No financial support was provided relevant to this article.
Conflicts of interest
Dr Rao is supported in part by an investigator-initiated grant from Merck & Co. He has consulted for Seres Therapeutics and Summit Therapeutics. All other authors report no conflicts of interest relevant to this article.


 Open access