

Introduction
There are more than 30,000 recorded trapping pits or pitfalls in the Swedish National Heritage Board's database for archaeological sites and monuments (FMIS, n.d.). These can be roughly divided into two types, based on their local context. Pitfalls for wolves are found all over Sweden, often solitary and located close to historic settlements. A second type of pitfall, found in the northern Swedish boreal forests and mountainous regions, is instead attributed to elk or reindeer hunting. These trapping pits are usually located at a distance from known settlements and are placed in systems consisting of tens or even hundreds of pits, stretching for several kilometres.
To contextualize the trapping pit systems (Figure 1) and gain an understanding of their contribution to wider societal and economic systems, it is important to establish a reliable chronology for their time of construction. Apart from the fact that pitfall hunting was prohibited in Sweden in 1864 (Magnusson & Segerström, Reference Magnusson and Segerström2009: 13), the general chronology is not yet fully understood. Several pitfalls have been dated to the Stone Age (8000–1800 bc) as well as to the Bronze Age (1800–400 bc), but the most intensive period for pitfall hunting has long been assumed to have been during the Viking Age (ad 750–1050; Hvarfner, Reference Hvarfner and Hvarfner1965: 326; Hansson & Rathje, Reference Hansson and Rathje1999: 24; Ramqvist, Reference Ramqvist2007: 169; Sjöstrand, Reference Sjöstrand2011: 57–63). During this period products extracted from trapped animals, such as furs, would have been important commodities, and their redistribution and sale would have served to connect the northern hunting grounds to the marketplaces of southern Scandinavia. Some scholars have studied the distribution of trapping pits as a proxy for identifying the areas that were most intensively exploited for hunting during the Iron Age (Lindholm & Ljungkvist, Reference Lindholm and Ljungkvist2016), while others have used them to illustrate the importance of hunting and fur trade in Viking Age society (see, for example, Ramqvist, Reference Ramqvist2007: 174–76). The most comprehensive study so far of the chronology of trapping pits is based on a compilation of radiocarbon dates up to 1995 (Ramqvist, Reference Ramqvist2007: 166–73; see detailed discussion below). This study, however, only covers part of the wide geographical area where the pitfall systems are present. Since 1995, numerous additional radiocarbon samples have been analysed and new methods of statistical processing have been developed.
Besides stone settings and mounds, pitfalls are probably the best-known prehistoric features among Scandinavian school children and the general public. However, the broad idea is that they belong to hunter-gathering societies of the Stone Age (drawing by Folke Hennius, 2018).

The main objective of this article is to present an elaborated chronology of Swedish trapping pit systems for elk and reindeer hunting. This is achieved by updating Ramqvist's work on radiocarbon samples analysed over the last twenty years, and adding a large number of samples from dated pitfalls in Norway, in total about 370 samples. In addition, all available samples are calibrated using OxCal 4.3 and statistically analysed to create summarized calibration curves as well as Kernel Density Estimation (KDE) plots and modelling. The database and the statistical analysis result in an improved statistical control and an enhanced chronology of pitfalls in Sweden. In addition, the improved chronology makes inter-regional comparison possible, helping to estimate regionally variable intensity in hunting over time, which can be further contextualized by a comparison with chronologies of other types of resource exploitation in northern Scandinavia.
A Short Introduction to Natural and Human Geography in Northern Sweden
About 60–70 per cent of Sweden is covered in boreal forest, a biome dominating the northern two-thirds of the country (Figure 2). The Scandinavian boreal forest is a westward continuation of the Russian taiga (SNA, 1990: 13, 24, 25). Most of the cultivated farmland is located in the southern third of the country, where most excavated remains of prehistoric settlements are located. For long periods of prehistory, northern Sweden was inhabited by groups whose subsistence was based on hunting and gathering. Around the turn of the first millennium, there are indications of increased cultivation of arable lands along the Baltic coast, along the rivers connecting the Baltic with the Scandinavian mountain ridge, and around larger lakes in the interior, at a time when sedentary settlements and burial customs comparable to southern Sweden evolved. Although these settlements were sedentary and present a clear agricultural signature, their function was most probably that of trade hubs, stimulating hunting and the exploitation of resources from the interior (Baudou, Reference Baudou1995: 115; Ramqvist, Reference Ramqvist2001: 2). During the Late Roman Iron Age (ad 200–400) and the Migration period (ad 400–550) especially, some of these sites evolved into regional centres. They include the hillfort at Mjälleborgen close to Storsjön in Jämtland, and settlements with large burial mounds closer to the Baltic coast, for example at Gene (Ångermanland), Trogsta (Hälsingland), and Högom (Medelpad). The richly furnished burial chamber of Högom includes finds originating from both western and south-eastern Europe. During the Migration period, it is thus possible to discuss the emergence of regional chiefdoms in the area, probably profiting from trade in iron, furs, and other non-agrarian products (Baudou, Reference Baudou1995: 125–38; Ramqvist, Reference Ramqvist1983, Reference Ramqvist1992, Reference Ramqvist2001: 17–18, Reference Ramqvist and Hemmendorff2012: 40–42). At the beginning of the seventh century, a major societal reorganization took place, with a decline in both agrarian production and pasture, including the re-location of settlements, and an end to the erection of large mounds over the burials of the ruling leaders in the region. These changes, however, are not associated with a decline in population but rather with a reorganization of society and the establishment of several new settlements. One such example is Arnäsbacken, which is the northernmost settlement site with Late Iron Age (ad 550–1050) mounds of the southern type discovered so far (Baudou, Reference Baudou1995: 124; Ramqvist, Reference Ramqvist1998: 131).
Map showing the provinces of Sweden, as well as important sites and regions mentioned in the text. The trapping pit systems (yellow) recorded in the Swedish National Heritage Board database (FMIS, n.d.) are concentrated in northern Sweden, with the highest frequency in the province of Jämtland. Background map was created using ArcGIS® software by Esri. ArcGIS® and ArcMap™ are the intellectual property of Esri and are used herein under licence. Copyright © Esri. All rights reserved. For more information about Esri® software, please visit www.esri.com. Fastighetskartan markdata vektor © Lantmäteriverket.

Such a large area is of course very diverse, and several regional divisions can be suggested for the Iron Age, based on the archaeological remains (see, for example, Baudou, Reference Baudou1995: 53, 115–16; Ramqvist, Reference Ramqvist2007). The northern part, sometimes called northern Norrland (roughly corresponding to the provinces of Lappland, Norrbotten, and Västerbotten), is characterized in the Late Iron Age (ad 550–1050) by bear burials, sacrificial depositions of metal, small seasonal fishing camps along the coast, and the presence of specific types of settlement remains in the inland (stalotomter) with rounded hut constructions (Baudou, Reference Baudou1995: 29; Ramqvist Reference Ramqvist2007: 154–60). Even though south Scandinavian artefacts are found, especially along the coast, the major cultural influences are from the circumpolar area in northern Norway or eastward in Finland and Russia (Baudou, Reference Baudou1995: 145). The southern region, i.e. central and southern Norrland, corresponds, approximately, to the provinces of Jämtland, Härjedalen, Ångermanland, Medelpad, Hälsingland, and Gästrikland. It had clear cultural connections with southern Sweden and above all Norway (Baudou, Reference Baudou1995: 115–17). Here we find the highest concentrations of trapping pit systems, especially in the area around Lake Storsjön in Jämtland. Trapping pit systems are also present in the nearby provinces of Dalarna and Värmland, with a few examples even further south. The highest frequency of trapping pit systems coincides with the so-called hunting ground burials, suggesting that they are related (Ramqvist, Reference Ramqvist2007: 160–65). This type of stone setting looks similar to settings found close to settlements in the Iron Age, but as the name suggests, they are found in forested areas, with no apparent connection to habitation areas. The burials are often interpreted as associated with people involved in hunting and iron production, as well as other types of resource exploitation and crafts in the forested areas (Wehlin, Reference Wehlin and Carlsson2016: 219–20, 239, 245).
Hunting with Trapping Pits
The use of pits in game hunting is a globally widespread technique (see, for example, Hvarfner, Reference Hvarfner and Hvarfner1965: 319 with references). The main principle is straightforward: the hunters dig pits in locations where animals migrate or in channelling terrain, aiming to make the animals fall into the pits and become trapped (see Figure 3). Scandinavian historical and ethnological sources give us a wide variety of animals hunted in pitfalls. Aside from elk, reindeer, and wolf, it also included bear and fox (Ekman, Reference Ekman1983: 25, 45, 76, 105, 141). For this article, which focuses on the chronology of the pitfalls systems in northern Sweden, the prey is of minor importance and will not be further discussed, beyond traditional interpretations that the pits were used in hunting elk and reindeer.
Recorded pitfalls from Älvros in the province of Härjedalen (in blue). There are twenty recorded pits in the area, continuing outside the cleared area. On the other side of the river, on the left, there are additional pitfall systems, with in total around fifty trapping pits over a distance of 2.5 km. (Photograph: Daniel Löwenborg, Uppsala University, with permission from Lantmäteriverket.)

The elk (Alces alces) is the largest terrestrial mammal in Europe. In prehistoric times, it was probably present all over the forested area, as indicated by numerous petroglyphs in the north (Sjöstrand, Reference Sjöstrand2011: 211). In the eighteenth and nineteenth centuries, intensive hunting made it a rare sight (Ekman, Reference Ekman1922: 13). Historically, these hunts were conducted in many different ways: besides pitfalls, dogs were used, as well as bait hunting on skis, stalking, trapping, etc. (Ekman, Reference Ekman1983: 38–40, 44).
The reindeer inhabiting Sweden today are domesticated reindeer (Rangifer tarandus tarandus). They were probably already introduced in the middle of the first millennium ad (Aronsson, Reference Aronsson1991: 102; Bergman, Reference Bergman2018: 68, with references) and slowly replaced the wild reindeer (Rangifer tarandus), which today only exist in small populations in Norway and Finland. The closely related forest reindeer (Rangifer tarandus fennicus) is no longer found in Sweden, but it once spread over large parts of the Scandinavian peninsula, with a southern border in Dalarna. Wild reindeer became extinct in Sweden in the nineteenth century, but the transition from reindeer hunting to domesticated reindeer is complicated, and wild reindeer were probably exposed to heavy hunting pressure at the time the first domesticated reindeer were introduced. This hunting was conducted, for example, through bait hunting, stalking, or using domesticated reindeer as decoys, in addition to pitfalls (Ekman, Reference Ekman1983: 11, 17–28).
In Scandinavia, pitfalls for elk and wild reindeer are features still visible in the landscape, as steep depressions, around 2–4 m in diameter and up to 2.5 m deep, sometimes surrounded by an earthen bank. Occasional finds of structural elements such as wood linings around the sides of the pit, stakes, or a smaller, squared bottom compartment to lock the legs of the captured animals in position have been identified. The pits were covered by branches and twigs that broke under the weight of the animals. Screens, fences, or rows of stones between the pits may have helped to direct the animals towards the trap (see, for example, Jacobsen, Reference Jacobsen1989: 118–20). There has also been some discussion of whether pitfall hunting should be regarded as a passive hunting method, where the pits were checked every now and then to see if animals had fallen in, or whether it was an active hunt, where the animals were chased towards the pits (Hansson & Rathje, Reference Hansson and Rathje1999: 25–27).
Previous Chronologies Proposed for Pitfalls
As stated in the introduction, the most comprehensive study so far of the chronology of pitfalls was that of Per H. Ramqvist, published in 2007. The study was based on a database initially constructed in 1995 (Ramqvist, Reference Ramqvist2000, Reference Ramqvist2007: 166–73). In the study, the author compiled excavation reports concerning pitfalls and systematically evaluated the available radiocarbon samples to create a chronology. From 540 excavated pitfalls, dated by some 130 radiocarbon determinations, Ramqvist extracted ninety-eight radiocarbon samples which he used for his analysis, excluding some, but not all, samples where the context of the sample was unclear (Ramqvist, Reference Ramqvist2000: 7; Reference Ramqvist2007: 1, 68–69). Ramqvist's study includes pitfalls from the nine northern provinces of Gästrikland, Hälsingland, Härjedalen, Jämtland, Medelpad, Ångermanland, Västerbotten, Norrbotten, and Lapland, although the pitfalls have a larger geographical distribution in the boreal forest, including Värmland and Dalarna, as well as a few examples further south.
Ramqvist's analysis was used to outline a chronology of pitfall hunting in northern Sweden. It states that few pitfalls can be dated to the Mesolithic or Neolithic periods (8000–1800 bc), and claims a more widespread introduction of pitfalls in the middle of the Bronze Age (1800–400 bc), after which time there was a constantly growing number of constructed pits. Furthermore, Ramqvist concludes that there was a significant increase in the number of pitfalls around the turn of the first millennium. In his view, this increase occurred simultaneously with, and was owed to, the establishment of sedentary settlements in the area, as described above. A second significant expansion in the number of pitfalls took place at the end of the Vendel period or beginning of the Viking Age in the eighth century, most probably due to the establishment of the first Scandinavian marketplaces. In the Late Viking and early medieval periods (around ad 1000 onwards), when urban centres in Russia became prominent in trade, the quantity of Scandinavian pitfalls declined, never to become substantial again (Ramqvist, Reference Ramqvist2007: 169–71, 174).
There are two major weaknesses in Ramqvist's study. The first and most important is that the author did not calibrate the results of the radiocarbon analyses, which may lead to a biased interpretation of the chronology. According to Ramqvist, the age of the samples dated to periods before the turn of the first millennia bc/ad should be regarded as slightly older, while the samples with values after that should be somewhat younger. The second weakness is that Ramqvist's study is based on a selection of the samples available at the time. Unfortunately, the selection process and the reasons for not including all samples are not apparent in the publication, making it difficult to assess the results (Ramqvist, Reference Ramqvist2007: 166–73).
Towards a Refined Chronology of the Pitfalls
In the following section, a more refined chronology of the trapping pit systems in forested northern Sweden is presented. This will not only be used as a general chronology for pitfalls, but also to further distinguish regional differences within this vast area. In comparison to Ramqvist's study, there are several important differences to be noted.
First, in comparison to Ramqvist's qualitative method, the approach applied in the current study is quantitative, including all dated pitfalls available to the author. The new database incorporates almost four times as many radiocarbon dates. The additional samples have been retrieved from pitfalls excavated in Sweden over the last twenty years, and the database also includes the provinces of Dalarna and Värmland, as well as dated trapping pits from Norway. The total comes to about 370 radiocarbon samples. Even if certain samples can be considered dubious, the sheer quantity of samples will contribute to the identification of chronological trends and all dated samples are included in the analysis. Although the updated database is substantial, it should be acknowledged that more samples (but probably only a small quantity) could be found if a more thorough search was to be made in museum archives.
Second, the samples have been calibrated using OxCal 4.3.2 to create summarized calibration curves as well as KDE plots and models. A sum distribution, resulting in a superposition of all the calibrated distributions, is probably the most common method of dealing with large sets of radiocarbon determinations. However, due to the number of samples, the calibration process, and the uncertainty of measurement, this method results in excessive noise, blurring a picture in which fluctuations are significant (Bronk Ramsey, Reference Bronk Ramsey2017: 1809–11). There are different ways to reduce this noise, for example by using various types of Kernel Density Estimations. The KDE method is one of the most widely used non-parametric methods for estimating underlying distributions of discrete data points and the method is increasingly being applied to the analysis of large sets of radiocarbon samples. KDE modelling is introduced in OxCal version 4.3.2. The method is described in detail by Bronk Ramsey (Reference Bronk Ramsey2017) and applied by, for example, Pilø et al. (Reference Pilø, Finstad, Bronk Ramsey, Martinsen, Nesje and Solli2018).
To establish chronologies for pitfalls and trapping pit systems is a difficult task. There are rarely any functional or spatial relationships to other types of features nearby, and the use of radiocarbon dating requires extensive consideration of the context of the sample. An oft-used method is to take samples from the original ground level that had been covered by the soil dug when the pit was constructed. A problem associated with this method is the risk of merely dating any unspecific time before the construction of the pit. Another method of sampling for radiocarbon is to take wood from preserved construction elements if such are found. One question to pose for such sampling is whether it dates the initial construction, the time of use, or the collapse of the pit. Unfortunately, the lifespan of a trapping pit and how long it could be maintained is, so far, unknown. An additional set of problems associated with dating concerns the pitfall systems themselves. Even if apparently systematic, pits placed in long rows do not necessarily have to belong to the same chronological phase; instead they could represent pits dug over a long period (see, for example, Hansson & Rathje, Reference Hansson and Rathje1999: 24, with references).
Sample contexts associated with pit structures are generally difficult to define and there are numerous source critical issues associated with radiocarbon dates from pitfalls and trapping pit systems. The radiocarbon samples used for this study have been retrieved over an extensive period. They have been collected from many different excavations, conducted for different purposes and using different methods. Moreover, the development of radiocarbon analysis techniques means that samples have been subject to different kinds of analyses. A further problem is that the excavation reports, from which the dates for the present study have been retrieved, do not always state the sampling methods used, nor do they always discuss source-critical issues, for example the internal age of the sample material. Taphonomic issues, as well as the relationship between the radiocarbon date, the dated event, and the archaeological process have been discussed extensively (see, for example, Waterbolk, Reference Waterbolk1971; Bronk Ramsey, Reference Bronk Ramsey2008; or Millard, Reference Millard2014). When using a diverse empirical material based on radiocarbon samples from pitfalls, it is necessary to evaluate it carefully and acknowledge the dangers of systematic biases in the outcome. It is important to recognize that the main data for the present study relies on the judgement and opinions of field archaeologists who conducted the excavations and on information submitted in their reports.
When studying pitfalls, as stated above, we should be aware that these features often lack a relationship to surrounding archaeological features, and that there is rarely any prior information concerning their chronological distribution, except for the radiocarbon samples themselves. In the KDE modelling, however, there is no need for formal priors, which in the case of pitfalls, makes it more useful than other Bayesian approaches. Even if the results might look similar to the ‘Sum distribution’ function in OxCal, the underlying calculation differs considerably; to create the Kernel Density distribution, the Markov Chain–Monte Carlo (MCMC) method is used to arrange the samples in a probable order. In the following, two different types of KDE analysis are applied: KDE_plot and KDE_model. If KDE_plot is not combined with other Bayesian models, the distributions tend to be over-dispersed and blur the underlying signal. In contrast to this method, the KDE_model overlaps the first and last sampled event by ninety-five per cent, and thus creates more compressed curves. Tests on simulated data have shown that the greatest advantages of KDE analyses arise when dealing with multi-modal distributions (Bronk Ramsey, Reference Bronk Ramsey2017). Since KDE analysis is less sensitive to short-lived fluctuations, this will further reduce the impact from individual unreliable samples in the dataset.
The KDE analysis will not process out issues with sampled material or taphonomy and the only discrimination of samples in the study is that of the calculation process itself. Later samples with too great a standard deviation are automatically discarded from calculations. The patterns emerging from the analysis of the pitfalls have several weaknesses and cannot be confirmed in detail, but the outcome in terms of chronology shows an interesting pattern, correlating with sequences published elsewhere, and these patterns are well worth discussing. This correlation could be taken as an argument that KDE analysis is applicable for identifying the general chronological trends of pitfall construction on the Scandinavian peninsula.
Results
Before looking at the details, the general curve from the KDE modelling, including all samples from Sweden, will be discussed (Figure 4). The analysis suggests that pitfalls were probably in use from the Mesolithic onwards, with an oscillating but increasing curve up to the Middle Ages. At the beginning of the Bronze Age (around 1800–1600 bc), or perhaps somewhat earlier, the KDE model suggests a first significant increase, peaking around the beginning of the Pre-Roman Iron Age (around 400 bc). In the centuries around the turn of the first millennium, the curve shows a significant decrease in pitfalls. According to the KDE model, a second increase in the number of dated pitfalls starts at the end of the Roman Iron Age (around ad 400), with a peak in the Vendel period (around ad 650). The curve drops in the Viking period (ad 750–1050) but peaks again in the early Middle Ages (around ad 1050). From the thirteenth or fourteenth century, the number of pitfalls declines rapidly.
Kernel Density Estimation modelling including all samples from Sweden, as well as samples divided into northern and southern regions. The underlying grey curve is the summarized distribution curve. Note that the x-axis to the left uses a different scale for the different regions. Samples analysed using KDE_modelling in OxCal 4.3.2.
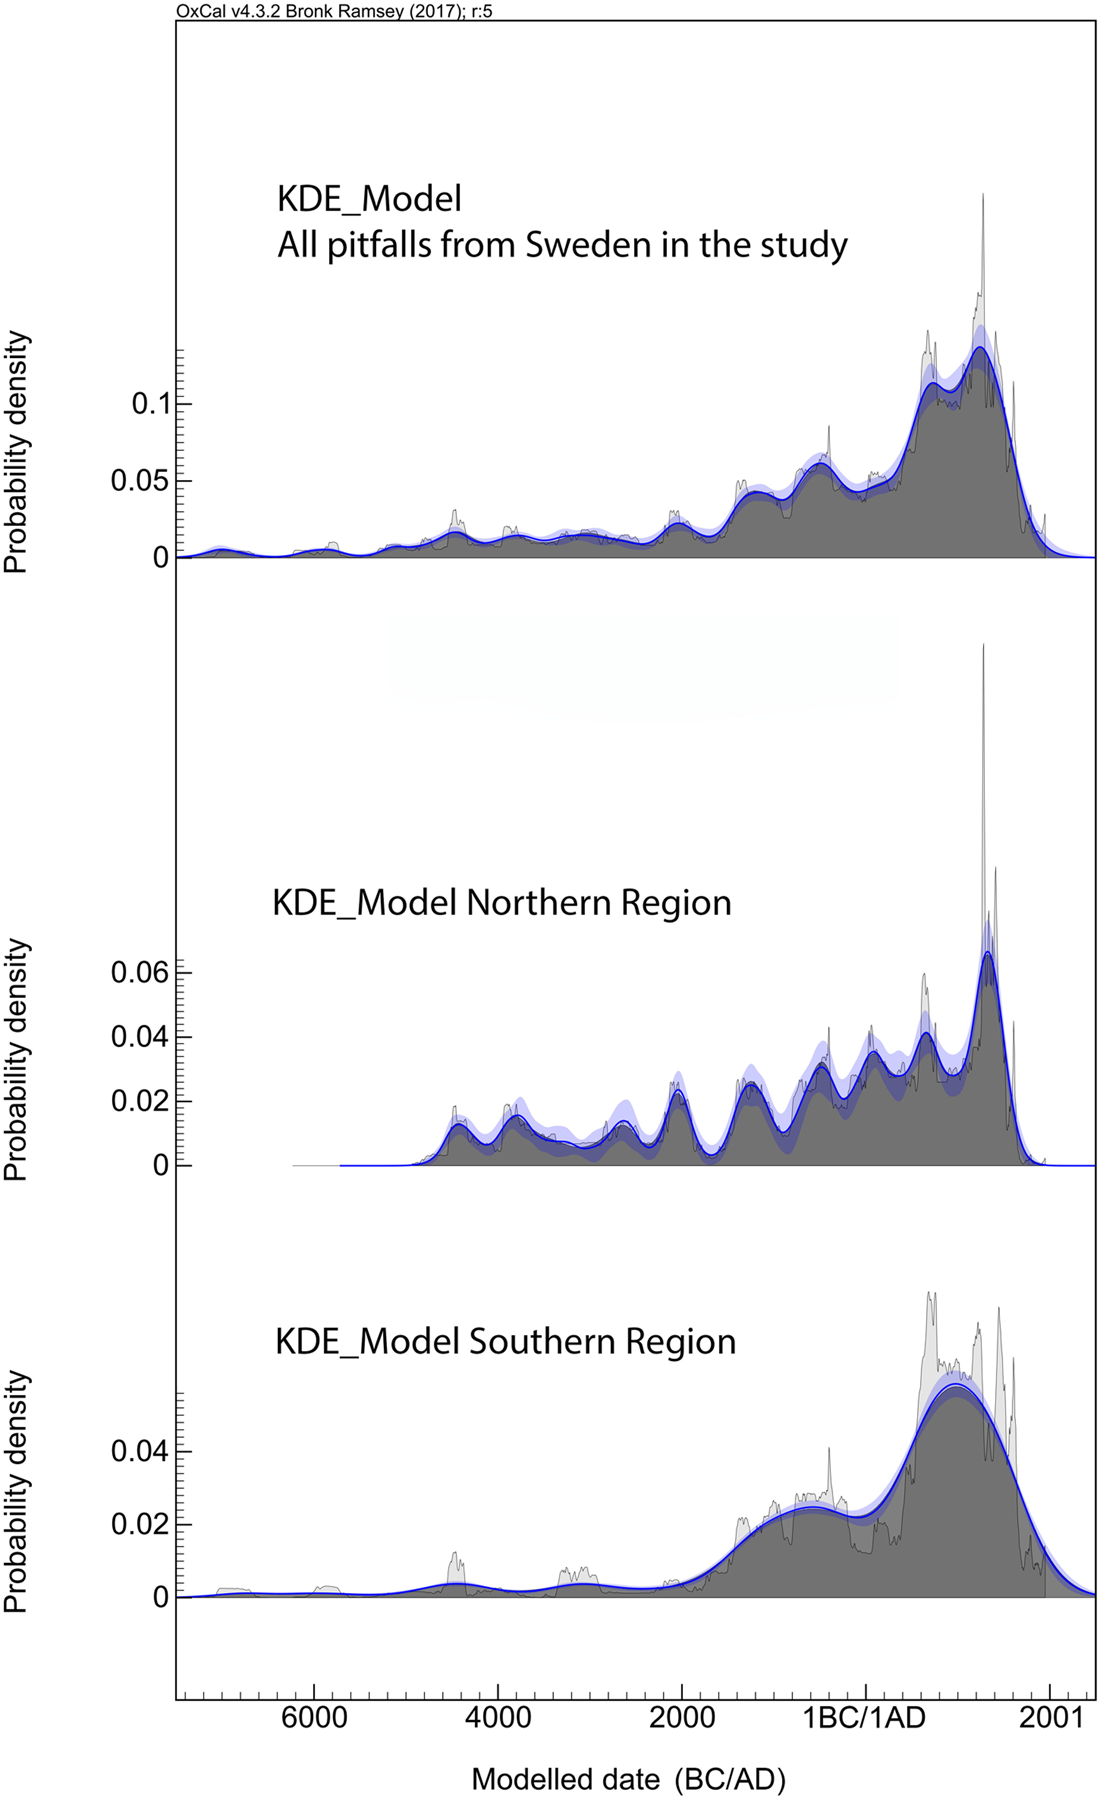
The calculated and smooth KDE modelling can be compared with the underlying summarized diagram, which shows interesting patterns on a more detailed level, amplifying peaks and dips in the curve. The diminishing numbers of pitfalls in the centuries around the turn of the first millennium is indisputable, no matter which curve is studied. For the situation in the Late Iron Age, the peak in the Vendel period and the dip in the Viking Age become emphasized. After the peak in the early Middle Ages, there is a significant decline. The dating of this decline is hard to pinpoint. According to the summarized calibration curve, the downturn seems to occur somewhat earlier than in the KDE model and, in the former, began as early as the thirteenth century, i.e. earlier than the Black Death and the subsequent agrarian decline known as the Late Medieval Agrarian Crisis (Myrdal, Reference Myrdal1999: 111, 119–20). However, a decline in activities before the Black Death is in line with several other studies of outland production such as shielings or seasonal fishing camps (see, for example, Norman, Reference Norman1993: 70; Landin & Rönnby, Reference Landin and Rönnby2002; Emanuelsson et al., Reference Emanuelsson, Johansson, Nilsson, Pettersson and Svensson2003: 131–33). In both those examples a decline in activities and a change in production seem to occur during this period.
The cyclical tendency of trapping pit construction could be interpreted as a reflection of repeated situations of increased hunting pressure resulting in the over-exploitation and collapse of animal populations. It could also be interpreted as an indication of a long period of use of pitfalls. After a period of construction, the pitfalls were used and maintained, and no new pitfalls were constructed, implying intensive hunting with pitfalls during periods with few dated samples. The unequivocal decrease in the number of dated pitfalls in the medieval period would speak against this argument, either following the reorganization in the early thirteenth century mentioned above, or immediately following the Black Death and the Late Medieval Agrarian Crisis. The short-term fluctuations suggest that the period of use for each pitfall was limited, a statement which is also in line with claims made by Hvarfner (Reference Hvarfner and Hvarfner1965: 325).
The large number of radiocarbon samples from pitfalls in the present database justifies an analysis of regional differences in the general chronology. Studying the samples on an inter-regional level, distinguishing between the northern and southern regions discussed above, emphasizes the differences between the two (see Figure 4). The earliest evidence of a continuous use of trapping pits can be found in the far north: twenty-nine out of 134 samples from the north date to before 4000 bc, compared with the southern region, with nine samples out of 128. In the north, besides large, cyclical fluctuations, there is a more even increase over the whole prehistoric period compared with the south. In the southern region, there are few until the beginning of the Bronze Age (around 1800 bc), a time of intensive construction activity. After a decline around the turn of the millennium, the number of trapping pits increases again.
The new compilation also makes it possible to study regional differences on a micro-level in more detail (Figure 5). Since the number of samples differs and is very modest from some of the provinces, the regional curves are based on the KDE_plot analysis and should merely be used to study trends in the chronology. Some of the differences between the northern and southern regions mentioned above are also visible on this small scale. Västerbotten displays a different, and older, chronology than other provinces, especially when compared with the neighbouring province of Lapland. This could perhaps be due to a difference in the number of samples used in the analysis: twenty and sixty-seven respectively. Jämtland, with ninety-five samples, does not show the same clear decline in pitfall construction in the Viking period as the other regions but rather a constant increase up to the beginning of the second millennium. Another noteworthy difference is shown by the province of Värmland (twenty-five samples), with a much younger chronological signature than other provinces. The introduction of pitfalls is later than in the other areas and there are, so far, few pitfalls dated before the Late Iron Age and a peak in the Middle Ages. Värmland shows a chronological pattern that resembles much more the situation in Norway, on the western side of the Scandinavian mountain ridge. The two areas were closely connected for long periods of history and, in both regions, there is a substantial increase in the number of dated pitfalls in the medieval period. Nevertheless, in Norway, there is also a peak on the curve in the Merovingian period, which corresponds to the Swedish Vendel period, followed by a decline in the Viking Age.
KDE_plots including summarized curves for different provinces of Sweden, as well as samples from Norway, and all the samples in the study. Samples analysed using OxCal 4.3.2. Grey = KDE_plot diagram. Black = summarized curve. The light and dark blue distributions show the marginal posteriors and overlap the first and the last sampled event by ninety-five per cent.

The additional samples and the new calibration methods have resulted in a more fine-tuned chronology of the pitfalls in northern Sweden, also making it possible to study pitfall hunting on different geographical scales. Based on the analyses presented above, the following chronological sequence can be inferred:
– Pitfalls have been in use since the Mesolithic but with increased intensity since the Bronze Age, around 1800 bc
– The number of pitfalls is small during the centuries around the turn of the millennium bc/ad
– A major increase in pitfalls occurs in the Late Roman Iron Age/Migration period (ad 400–500) and peaks in the Vendel period (around ad 600–650)
– The quantity of dated pitfalls decreases during the Viking Age (ad 750–1050)
– A further peak in pitfalls is visible in the early medieval period (around ad 1050)
– Probably as early as the thirteenth century, the number of pitfalls decreases dramatically, never to become substantial again
– The analysis shows regional chronological differences in hunting strategies, where the tradition of pitfall hunting is older in the northern region than it is in the south.
Discussion and Conclusion
As stated above, the importance of the Viking Age fur trade has been a subject of academic discussion for several decades. Even if fox, marten, squirrel, or other animals targeted by the fur trade were most probably not hunted by pitfalls, the trapping pits have occasionally been used as a proxy for stressing the importance of hunting during the Viking Age (see, for example, Ramqvist, Reference Ramqvist2007). The revised chronology of pitfall hunting presented here challenges many of the previous assumptions concerned with societal developments in the Scandinavian Late Iron Age. First, a connection between pitfalls and the establishment of sedentary settlements in the area at the beginning of the first millennium is difficult to confirm since the chronological sequence suggests a decrease in pitfall hunting during this period. Second, a connection between increased pitfall hunting and the establishment of Viking Age trading sites is equally hard to establish. Previous assertions concerning the decline of pitfall hunting during the early medieval period, presumed to be due to the establishment of trading towns in Russia, also cannot be confirmed. Instead, the revised chronology suggests that after a period of relatively low-intensity use during the Pre-Roman Iron Age, a surge in the use of pitfalls for hunting began in the Migration period, with this practice peaking during the Vendel period. Furthermore, at the beginning of the Viking Age, the number of radiocarbon dates from pitfalls decreases before a new peak in the early medieval period. According to the present analysis, the major decrease of pitfalls took place in the thirteenth century. Neither the establishment of sedentary settlements in the area, around the beginning of the first millennium, nor the reorganization of settlement in the middle of the Iron Age is reflected in the frequency of pitfalls. Instead, it can be argued that different chronological patterns of societal development emerge when agrarian areas are compared with the forested areas. This in turn suggests that the latter should not be interpreted on the basis on the former.
The study presented here could be framed within a research discourse concerned with resource exploitation and non-cultivated production in northern Europe during the Late Iron Age (see, for example, Glørstad & Loftsgarden, Reference Glørstad and Loftsgarden2017). As for the new chronology of pitfall hunting, it is in agreement with several recent studies that have argued for an increased focus on the exploitation of northern resources and an intensification in trade, which connected forested outlands with an over-regional economy in the centuries preceding the Viking Age. It is noted, for example, that the increase of pitfalls in the Late Roman Iron Age and Migration period is consistent with the chronology of bear hunting suggested by Lindholm and Ljungkvist (Reference Lindholm and Ljungkvist2016). Bear claws found in burials in southern Sweden, the authors argue, are most likely to have come from the northern boreal forests. Even if it is unlikely that bears were hunted using pits, this could still be used as an indication of more intensive hunting, as well as a signal that a domestic trade in animal products was developing during the period (Lindholm & Ljungkvist, Reference Lindholm and Ljungkvist2016). A parallel for the large-scale hunting of terrestrial mammals in trapping pits can be seen in the exploitation of marine mammals. Gaming pieces made from whalebone are present in burials in eastern central Sweden from at least the mid-sixth century. It is claimed that the gaming pieces were by-products of active whale hunting, including that of the North Atlantic right whale. The gaming pieces were distributed as finished items on long-distance exchange networks that connected the north Atlantic coasts of Norway with eastern central Sweden (Hennius et al., Reference Hennius, Gustavsson, Ljungkvist and Spindler2018). A study (Ashby et al., Reference Ashby, Coutu and Sindbæk2015) of trading contacts between the north Scandinavian arctic outlands and southern Scandinavia has shown that reindeer antler was being transported from northern Scandinavia to Ribe, Denmark, as early as the beginning of the eighth century. Furthermore, the new chronology of the pitfalls shows great similarities with the chronology of other types of hunting equipment from Oppland, Norway, presented by Pilø et al. (Reference Pilø, Finstad, Bronk Ramsey, Martinsen, Nesje and Solli2018: 5). The exploitation of non-cultivated resources, however, not only involves hunting; similar developments can be seen, for example, in the production of iron (Magnusson, Reference Magnusson1986: 221–22) and tar (Hennius, Reference Hennius2018), whose production increased during the sixth and seventh centuries. These studies not only strengthen the relevance of the new pitfall chronology, but also bear witness to major societal changes in Scandinavia in the centuries before the Viking Age expansion. The increased exploitation of outland resources, supposedly resulting in the production of a surplus, indicates the existence of far-reaching trade networks, connecting northern Scandinavia with southern markets well before the rise of the Viking Age emporia.
Acknowledgements
This study was funded by the Berit Wallenberg Foundation (grant no. BWS2014.0117). Open Access fees were supported by the ‘Viking Phenomenon’ project from the Swedish Research Council (grant 2015-00466). I would like to thank all colleagues at local museums around Sweden for help with compiling the radiocarbon samples from pitfall sites, Per Frölund (Upplandsmuseet) for discussions on KDE modelling, and Calum McDonald and Benjamin Raffield for language revision.


 Open access