

Introduction
Biological invasions are an unfortunate component of global environmental change. Major goals of many biological invasion studies are to understand the factors that affect the spread of invasive species and to determine their current and potential distributions (With Reference With2002). Typically, the more advanced the invasion process is, the more difficult it is to mitigate (Hester and Cacho Reference Hester and Cacho2009). As such, early observation and action are critical to native communities. Proactive efforts can be undertaken to eliminate infestations when species first invade an area (Rejmanek and Pitcairn Reference Rejmanek and Pitcairn2002). For example, several small infestations of small broomrape (Orobanche minor Sm.), tropical soda apple (Solanum viarum Dunal), wild red rice (Oryza sativa L.), and killer algae [Caulerpa taxifolia (Vahl) C. Ag.] were successfully eradicated in the United States in the 1990s and 2000s due to early recognition (Simberloff Reference Simberloff2013). Even eradicating isolated populations can keep the invader out of a region for years (Mack et al. Reference Mack, Simberloff, Londsdale, Evans, Clout and Bazzaz2000; Simberloff Reference Simberloff2013).
Site characteristics are a major component that determine invasion success (Radosevich et al. Reference Radosevich, Stubbs and Ghersa2003; Thuiller et al. Reference Thuiller, Gassó, Pino and Vilà2012). Knowledge of the biotic and abiotic features of the areas experiencing a new invasion is critical to limiting negative impacts (Vilà et al. Reference Vilà, Pino and Font2007). Environmental data, that is, abiotic site features such as soil type and topographic position, help to improve our understanding of site characteristics that influence invasive species occurrence (Stohlgren et al. Reference Stohlgren, Barnett and Simonson2003). Additionally, recent studies indicated that abiotic and biotic features of recipient habitats play a prominent role in plant invasions (Chytrý et al. Reference Chytrý, Jarošík, Pyšek, Hájek, Knollová, Tichý and Danihelka2008a, Reference Chytrý, Maskell, Pino, Pyšek, Vilà, Font and Smart2008b; Pyšek et al. Reference Pyšek, Bacher, Chytrý, Jarošík, Wild, Celesti-Grapow, Gassó, Kenis, Lambdon, Nentwig, Pergl, Roques, Sádlo, Solarz, Vilà and Hulme2010). For example, among 32 habitats in the Czech Republic, disturbed human-made habitats with herbaceous vegetation (e.g., agricultural land) were the most invaded, whereas dry, wet, and saline grasslands, base-rich fens, and broad-leaved deciduous woodlands were most resistant to invasion (Chytrý et al. Reference Chytrý, Jarošík, Pyšek, Hájek, Knollová, Tichý and Danihelka2008a). The composition of the recipient community of a new invader also plays a role in invasion success and severity of impacts (D’Antonio and Thomsen Reference D’Antonio and Thomsen2004). It is well documented that many invasions result in decreased biodiversity due to predation, competition for resources, habitat alteration, and other direct and indirect effects (Bertness Reference Bertness1984; Mack et al. Reference Mack, Simberloff, Londsdale, Evans, Clout and Bazzaz2000; Vitousek Reference Vitousek1990). On the other hand, the invader may not necessarily precipitate a loss of biodiversity, but rather the existing community may be one where species are not resistant to invasion, either because of functional dissimilarity to the invader or a lack of structural complexity (Allen and Meyer Reference Allen and Meyer2014; Leffler et al. Reference Leffler, Leonard, James and Monaco2014). Thus, the invader’s presence may correlate to a different species assemblage than when the invader is not present because of the traits of the previously established community. Furthermore, the presence of an indicator species in the recipient habitat may be used to evaluate a site’s susceptibility to invasion (Godefroid and Koedam Reference Godefroid and Koedam2003). For example, Godefroid and Koedam (Reference Godefroid and Koedam2003) identified three plant species that indicated areas at risk for colonization by nonindigenous species in a Belgian forest. They concluded that since those three taxa characterize open habitats, forest-clearing activities are somewhat responsible for the spread of nonindigenous species. As such, land managers of this Belgian forest can work to limit, monitor, and/or revegetate areas of tree felling. In summation, knowing the abiotic and biotic features that increase the invasibility of a habitat allows managers to make educated predictions and develop integrated pest management strategies to prevent, control, or eliminate the spread of an invader. While foresight of the species’ arrival is extremely difficult, knowledge of the features and availability of areas suitable for colonization and establishment in the new range may encourage focus on inhibiting the expansion of the invasion.
Ventenata [Ventenata dubia (Leers) Coss.] is a nonindigenous winter annual grass that has become increasingly invasive in grasslands and pasturelands in the Inland Northwest (Pavek et al. Reference Pavek, Wallace and Prather2011) since its arrival to the region in 1952 (Barkworth et al. Reference Barkworth, Capels and Long1993). Ventenata dubia is capable of displacing perennial grasses as well as other invasive, nonindigenous annual grasses, including downy brome (Bromus tectorum L.) and medusahead [Taeniatherum caput-medusae (L.) Nevski] (Prather and Burke Reference Prather and Burke2011). It has spread from its initial location in Spokane County, WA, to 10 other U.S. states and five Canadian provinces (CABI 2017). In 2001, V. dubia was spreading at a rate of 1.2 million ha yr−1 in the Pacific Northwest (Novak et al. Reference Novak, Cristofaro, Maguire and Sforza2015), and so it is likely that this range expansion will continue, increasing management challenges and ecological costs. As evidenced by herbaria specimen frequency and dates of collection, V. dubia is only just beginning its invasion into sagebrush steppe ecosystems. The oldest (ca. 1960s) and most abundant herbaria records are from grasslands in the Spokane, WA, and Coeur d’Alene, ID, areas, with fewer and newer (ca. 2010s) records in southern Idaho and eastern Oregon in sagebrush steppe habitat (Consortium of Pacific Northwest Herbaria 2018). Little is known about V. dubia’s distribution, abundance, and habitat niche in sagebrush steppe communities, a large region critical for forage production and wildlife habitat (Smith Reference Smith1950). Documented impacts of V. dubia invasion include: (1) a significant decline in forage production in small pasture, grass–hay, and grassland systems of north-central Idaho due to displacement of perennial grasses and poor forage value of V. dubia (Prather and Burke Reference Prather and Burke2011); and (2) a decline in nesting success of insectivorous birds due to a loss of biodiversity in conservation lands in northern Idaho (Mackey Reference Mackey2014).
Characterizing the new landscape where V. dubia is expanding is a valuable endeavor, because the spatial arrangement of different landscape elements affects the rate of spread of invasive species (Theoharides and Dukes Reference Theoharides and Dukes2007). In addition, quantifying if the plant community composition is different when this new invader is present as opposed to when it is absent provides insight into its competitive ability and the resistance ability of the resident community. To initiate investigation of V. dubia’s expansion into sagebrush rangelands, we asked: (1) What is the distribution and abundance of V. dubia in this new ecosystem? (2) How do plant diversity and abundance vary with increasing V. dubia cover? (3) What abiotic and biotic features are associated with V. dubia presence and abundance? Answers to these questions will help guide efforts to assess the kind of niche V. dubia may invade as it undergoes range expansion in sagebrush steppe communities. If preventing invasive plants from reaching new areas is the most cost-effective means of control (Davies and Sheley Reference Davies and Sheley2007), then proactive surveys for at-risk areas in rangelands are worthwhile. We performed field surveys in sagebrush steppe communities in southern Idaho and eastern Oregon to answer these questions.
Materials and Methods
Study Location and Sampling
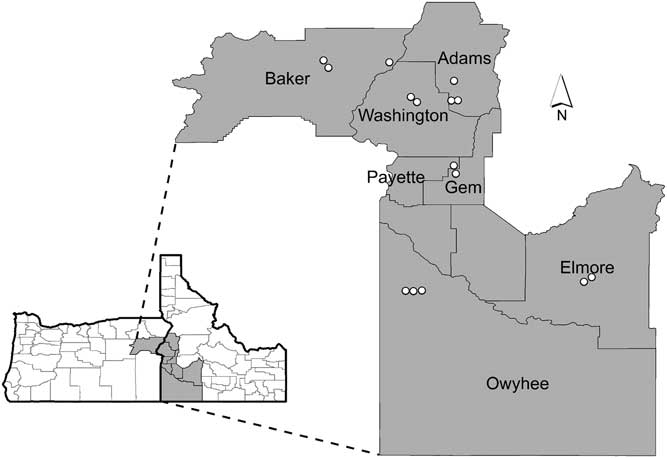
We conducted field surveys from June 2, 2015 to June 16, 2015 in six counties in southwestern Idaho and one county in eastern Oregon (Figure 1). We chose two ecoregions that support sagebrush steppe: the Blue Mountains in northeastern Oregon and the Snake River Plain in Idaho. In these regions, 15 locations were selected after consultation with local agency botanists who were knowledgeable concerning where V. dubia occurred. Because V. dubia is not common in these regions, conducting a random survey would have resulted in few or no inclusions of V. dubia. At each location, we established a site, defined as a circle with a 100-m diameter, based on ease of access (proximity to roads) and landscape conditions. Sites were selected to be representative of the dominant plant community at that location and they were classified based on types and abundance of important functional groups, including dominant woody species. All sites were disturbed by grazing, but disturbance severity was not recorded.
Sagebrush steppe survey locations in eastern Oregon and southwestern Idaho with county names indicated. See Table 1 for more information specific to each location.
Within each site, we arbitrarily located three transects where we recorded global positioning system coordinates, elevation, aspect, and slope. Transects were placed so they would characterize the site vegetation and remain within a single plant community type. Each transect was 20-m long, and along it we placed five quadrats (i.e., plots) sized 0.25 by 1 m at 5-m intervals beginning at 0 m. At the start of each transect, two soil depths were recorded on opposite sides of the 0-m plot. Each depth was determined by driving a 2.54-cm-diameter, pointed, iron rod into the ground in multiple locations and then calculating the average depth at which the rod could no longer penetrate. Soil core samples from these depth locations were collected and homogenized so that texture and nutrient analyses could be conducted later. Thus, at each site, there were 3 transects, 15 plots, 6 soil depth measurements, and 3 soil samples. In each plot, percent cover of all vascular plant species, biological soil crust, and abiotic variables (bare ground, rock, litter) were assessed via ocular estimation according to established cover classes: 0%, 1% to 5%, 5% to 12.5%, 12.5% to 25%, 25% to 50%, 50% to 75%, 75% to 95%, and 95% to 100%. For subsequent statistical analysis, the median percent from each cover class was used to represent estimates of cover.
A prior study indicated that there was less phosphorous in soil where V. dubia infestation was high compared with areas with low V. dubia infestation (Mackey Reference Mackey2014). Because of this possible link between soil fertility and infestation severity, of the 45 soil samples, a subset (n=21) from 10 sites was analyzed for particle size distribution and available phosphorus and potassium concentrations. The subset was selected based on the V. dubia cover values at the 0-m plot (the plot in closest proximity to the soil sampling site) to provide the best comparison: five samples were from plots with no V. dubia, seven samples were from plots with low V. dubia, and nine samples were from plots with high V. dubia. Available phosphorus and potassium were determined via the Olsen sodium bicarbonate extraction method at the University of Idaho Analytical Science Laboratory.
Statistical Analysis
In general, within plots, V. dubia foliar cover was 0%, less than 12.5%, or greater than 12.5%, so three categories—none, low (<12.5%), and high (>12.5%)—were used for most analyses. At each site, we computed species richness for each of the three V. dubia cover categories using species presence/absence data at the plot level. Results were tested for statistical significance using one-way ANOVA with a Tukey honest significant difference (HSD) post hoc test to evaluate pairwise multiple comparisons. The response variable was square-root transformed when necessary to meet assumptions of normality and homogeneity of variance. In addition, at each site, the Shannon diversity index was calculated for each of the three V. dubia cover categories using the average percent foliar cover values at the plot level. The Shannon diversity index considers not only the number of species but their relative abundance within the plots and is better indicator of diversity when rare and abundant species are expected to be equally important (Morris et al. Reference Morris, Caruso, Buscot, Fischer, Hancock, Maier, Meiners, Müller, Obermaier, Prati, Socher, Sonnemann, Wäschke, Wubet, Wurst and Rillig2014). Results were tested for statistical significance using one-way ANOVA with a Tukey HSD post hoc test. However, when diversity values failed to meet ANOVA assumptions and data transformations did not remedy the problem, we used the nonparametric Kruskal-Wallis rank-sum test and the Dunn post hoc test to evaluate pairwise multiple comparisons. Because richness and diversity values between three levels of V. dubia cover were compared, V. dubia’s own presence and cover were not included in these analyses.
For further insight into species composition, rank abundance models were evaluated at the plot level with the best-fit model selected by the radfit function in the ‘vegan’ R software package (R v. 3.2.2, Vienna, Austria). To evaluate indicator species associated with V. dubia, a chi-square test with Pearson residuals was evaluated for species either positively or negatively associated with the three categories of V. dubia cover. A nonmetric multidimensional scaling (NMDS) analysis revealed biotic and abiotic features associated with V. dubia cover. Finally, the relationships between V. dubia cover and soil particle composition, phosphorus concentration, and potassium concentration were analyzed with a linear regression. To standardize the variance, one was added to V. dubia cover values, which were then natural log transformed. Outliers were adjusted by reweighting them by 1/studentized residual. All analyses were computed in R v. 3.2.2.
Results and Discussion
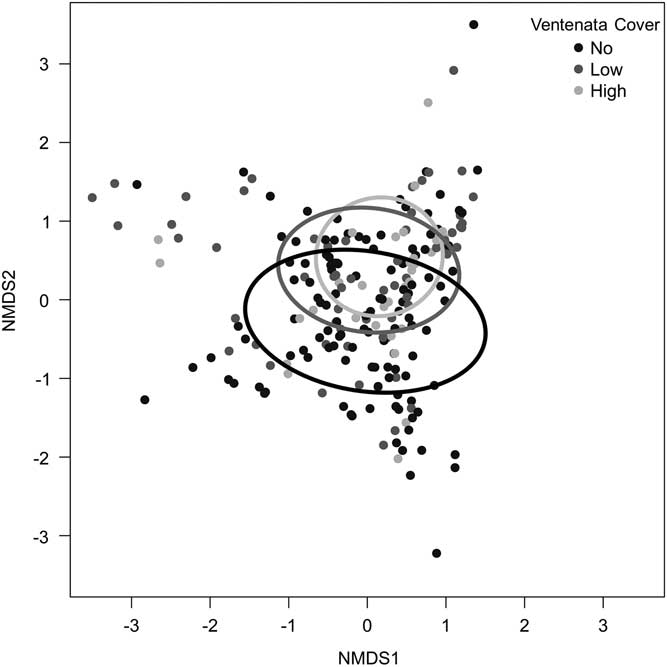
Within the study area, we found V. dubia in a variety of plant communities at elevations ranging from 916 to 1,662 m (Table 1). At the study locations, V. dubia was primarily located in moist habitats; either in topographic features that retain water or in areas that receive more precipitation as inferred from the native vegetation present. Though widely distributed throughout the study region, V. dubia only appeared in 45% of the 225 plots across all sites, despite the site-selection method being positively biased for V. dubia. In addition, V. dubia only existed at greater than 50% cover in 2 of the 225 plots across all sites. The low percent cover of V. dubia and its presence in about half the plots indicate that its distribution is patchy and suggest that V. dubia may be in an early phase of invasion in sagebrush rangelands. In comparison, in the Inland Northwest where V. dubia has been present for many more decades, it frequently forms a near monoculture in areas up to hundreds of hectares (Novak et al. Reference Novak, Cristofaro, Maguire and Sforza2015). NMDS analysis of plot-level community data revealed that all of the categories of V. dubia cover were widely distributed in community space and overlapped extensively (Figure 2).
Nonmetric multidimensional scaling (NMDS) of plant communities from plots with no Ventenata dubia (black line), low (<12.5%) V. dubia cover (gray line), and high (>12.5%) V. dubia cover (light gray line). Ellipses represent standard deviations of the weighted average of different V. dubia categories at the 95% confidence level.
List of locations surveyed, including county and state, global positioning system coordinates, elevation, and plant community type.
a Coordinates and elevation are average values from the starting points of the three transects placed at each site.
b Community types were defined according to important functional groups and listed from most prevalent to least prevalent within each 100-m-diameter site. Scabland sagebrush, Artemisia rigida; big sagebrush, Artemisia tridentata; antelope bitterbrush, Purshia tridentata; rock buckwheat, Eriogonum sphaerocephalum; juniper, Juniperus occidentalis; little sagebrush, Artemisia arbuscula; Idaho fescue, Festuca idahoensis.
Three of the five locations where V. dubia was most abundant (Big Flat: 18% average V. dubia cover; Four Mile Road: 13% cover; Schwenkfelder: 10% cover) were located below 1,000-m elevation. These locations were characterized by extensive annual grass complexes largely composed of T. caput-medusae. Taeniatherum caput-medusae invades areas with relatively higher precipitation or, where precipitation is lower, it is associated with swales (Hironaka Reference Hironaka1994). The association of V. dubia with T. caput-medusae in the Snake River Plain contrasts to observations in grasslands of the Inland Northwest, where V. dubia is associated with B. tectorum (Northam and Callihan Reference Northam and Callihan1994). Within the native European range of V. dubia, it can be found in areas where T. caput-medusae, Japanese brome (Bromus japonicus Houtt.), B. tectorum, and interrupted windgrass [Apera interrupta (L.) Beauv.] are found (CABI 2017; Contu Reference Contu2013). Interestingly, the other two locations where V. dubia was most abundant (Ida Belle: 10% average V. dubia cover; Chipmunk Road: 8% cover) were located above 1,450-m elevation. These locations had significant stands of mountain big sagebrush [Artemisia tridentata Nutt. spp. vaseyana (Rydb.) Beetle] and little sagebrush (Artemisia arbuscula Nutt.). Artemisia tridentata spp. vaseyana inhabits a relatively higher precipitation zone and A. arbuscula inhabits poorly drained, shallow clay soils (Shultz Reference Shultz2012). Thus, elevation does not seem to be a good indicator of V. dubia presence. Instead, V. dubia appears to be associated with relatively wetter microhabitats, either because of the precipitation zone, topographic features, or edaphic qualities that maintain higher soil moisture.
Within sites, species richness between plots with no, low (<12.5%), and high (>12.5%) V. dubia cover was significantly different (ANOVA: F=13.54, df=2, P<0.001), with the lowest species richness in plots with high V. dubia cover (Figure 3A). Comparatively, plots with no and low V. dubia cover had higher richness, but they were not significantly different from each other (Tukey HSD: no vs. low P=0.088; Figure 3A). This finding supports evidence from other invasions showing a negative correlation between richness and the presence of an invasive species (Báez and Collins Reference Báez and Collins2008; Porter and Savignano Reference Porter and Savignano1990).
Box plots of species richness of (A) all plants, (B) only native plants, and (C) only nonindigenous plants within sample plots with no, low (<12.5%), and high (>12.5%) V. dubia cover. Groups with the same letter are not statistically different (α=0.05).
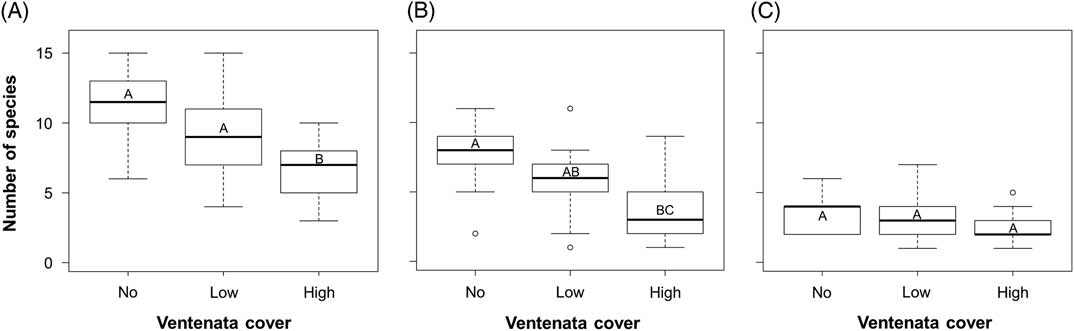
When considering species richness of just the native plants, there was a significant difference between the three categories of V. dubia cover (ANOVA: F=8.20, df=2, P=0.001; Figure 3B). Richness was lower in plots with high V. dubia cover compared with plots without V. dubia (Tukey HSD: P<0.001; Figure 3B). Plots with low V. dubia cover had an intermediate species richness statistically equivalent to plots with no and high cover (Tukey HSD: low vs. no P=0.092, low vs. high P=0.168; Figure 3B). It may be the case that there is a threshold in invader abundance that must be achieved to permit detection of a difference in native species diversity (Gooden et al. Reference Gooden, French, Turner and Downey2009; Grice Reference Grice2004). Among nonindigenous species, there was a nearly significant difference in richness between the V. dubia cover categories (ANOVA: F=3.179, df=2, P=0.053; Figure 3C). But when pairwise comparisons were evaluated, significance was not achieved, though it trended toward decreased richness in plots with high V. dubia compared with plots with no V. dubia (Tukey HSD: P=0.070; Figure 3C). The effects of an invasive species on the diversity of other nonindigenous species is not well studied, though in a mesocosm of aquatic communities, invaders did not negatively influence each other (Preston et al. Reference Preston, Henderson and Johnson2012). Overall, there was an association between high V. dubia cover and lower species richness, and the correlation was stronger among the resident native species than among the nonindigenous species.
The trends for Shannon’s diversity values were weaker than those from species richness, as there was more variability in diversity values within the three V. dubia cover categories (Figure 4). Shannon’s diversity considers not only the number of species but their relative abundances within plots. There was a significant correlation between diversity and V. dubia cover (Kruskal-Wallis rank sum: χ2=6.386, df=2, P=0.041; Figure 4A), in that diversity was lower in plots with high V. dubia compared with plots with no V. dubia (Dunn post hoc: no vs. high P=0.042; Figure 4A). Thus, high V. dubia cover was correlated with a decreased richness and evenness of the plant community. Comparatively, plots with low V. dubia cover were not significantly different from plots with no or high cover (Dunn post hoc: no vs. low P=0.964, low vs. high P=0.084; Figure 4A).
Box plots of average Shannon diversity indices of (A) all plants, (B) only native plants, and (C) only nonindigenous plants within sample plots with no, low (<12.5%), and high (>12.5%) Ventenata dubia cover. Groups with the same letter are not statistically different (α=0.05). Higher diversity values indicate greater richness and evenness.
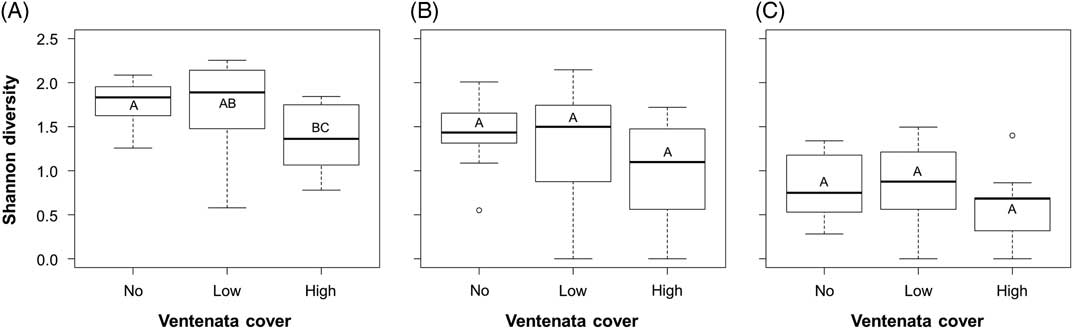
When only native species were considered, there was no significant difference in diversity values between cover categories (ANOVA: F=2.742, df=2, P=0.078; Figure 4B). The same was true when just the nonindigenous species were evaluated (ANOVA: F=1.965, df=2, P=0.155; Figure 4C). In general, there was more variability in diversity values than in simple richness values, indicating that species’ abundances covered a large range. In fact, within sites, the average cover values within the V. dubia cover categories ranged from 0% to 69%. Thus, at this snapshot in time, high V. dubia cover was weakly associated with decreased diversity, but high variability in the data prevented detection of whether this correlation existed for native and nonindigenous species when evaluated separately.
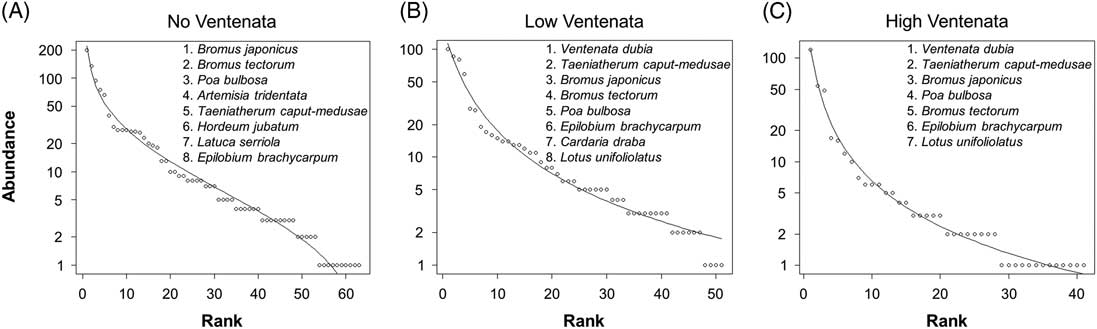
Next, rank abundance models elucidate the dominant species present within plots stratified by the three V. dubia cover categories. The models show that invasive annual grass species such as B. tectorum, T. caput-medusae, and B. japonicus, as well as bulbous bluegrass (Poa bulbosa L.), a nonindigenous perennial grass, were consistently the most abundant across all plots but their relative abundance rankings changed depending on the amount of V. dubia cover (Figure 5). With no V. dubia, A. tridentata was the fourth most dominant species. But when V. dubia was present, this important shrub moved down in rank. Also, as V. dubia cover increased, T. caput-medusae moved up in rank, and B. tectorum moved down. Unsurprisingly, the most abundant native species present when V. dubia was present were annual forbs (foxtail barley (Hordeum jubatum L.), panicle willowherb (Epilobium brachycarpum C. Presl), and deervetch [Lotus unifoliolatus (Hook.) Benth.] that inhabit disturbed, moist habitats (Jepson Flora Project 2017).
Rank abundance models of plots with (A) no, (B) low (<12.5%), and (C) high (>12.5%) V. dubia cover across all sites. The solid line represents the best-fit model for each data set, and a selection of the most abundant species have been listed in order starting with the highest rank to better reveal differences in community structure.
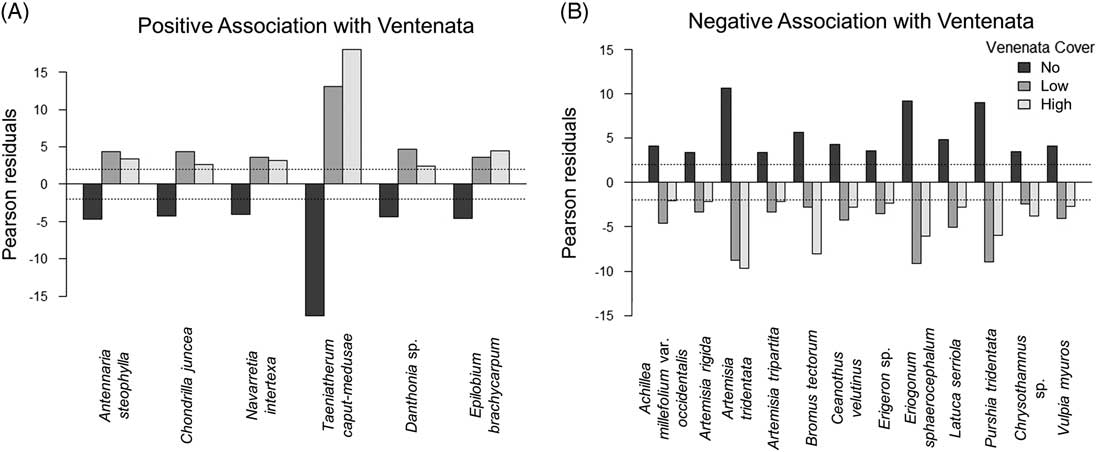
Chi-square indicator analysis revealed the presence of several species positively correlated with the different categories of V. dubia cover and other species that negatively correlated with the cover categories (Figure 6). Species positively associated with V. dubia included T. caput-medusae, needleleaf navarretia [Navarretia intertexta (Benth.) Hook.], and E. brachycarpum. These species were less frequent in plots that did not contain V. dubia. Conversely, species negatively associated with V. dubia included A. tridentata, threetip sagebrush (Artemisia tripartita Rydb.), antelope bitterbrush [Purshia tridentata (Pursh) DC.], rock buckwheat [Eriogonum sphaerocephalum Douglas ex Benth.], and B. tectorum. These species were less common in plots containing V. dubia. These data indicate that in sagebrush steppe, V. dubia is associated with T. caput-medusae and is less prevalent in dry, intact shrub communities. These indicator species also provide insight into V. dubia’s niche: the species positively associated with V. dubia were annuals that inhabit moist areas, while the species negatively associated with V. dubia were primarily perennials (B. tectorum being the exception) that inhabit dry areas (Jepson Flora Project 2017). In arid and semiarid ecosystems, soil moisture strongly influences plant composition (Ehleringer et al. Reference Ehleringer, Schwinning and Gebauer1999). More abiotically benign environments (e.g., wet areas) typically support increased invasive plant growth and reproduction (Pfeifer-Meister et al. Reference Pfeifer-Meister, Cole, Roy and Bridgham2008). For example, in an oak savanna ecosystem, MacDougall et al. (Reference MacDougall, Boucher, Turkington and Bradfield2006) reported that the abundance of invasive plants increased in habitats with deeper soils that retain more soil moisture, and in an eastern deciduous forest. Warren et al. (Reference Warren, Bahn and Bradford2012) reported that an invasive annual grass had higher germination and survival when soil moisture was higher. In our study, while we did not measure soil moisture, the results of the indicator species analysis suggest that V. dubia occurs with other species that inhabit a moist niche.
Indicator species in relation to Ventenata dubia cover across all survey plots. (A) Positive indicator species are defined as those with significantly negative Pearson residuals (<−2) in plots without V. dubia and significantly positive Pearson residuals (>2) in plots with low (<12.5%) and high (>12.5%) V. dubia cover. (B) Conversely, negative indicator species are defined as those with significantly positive Pearson residuals (>2) in plots without V. dubia and significantly negative Pearson residuals (<−2) in plots with low and high V. dubia cover.
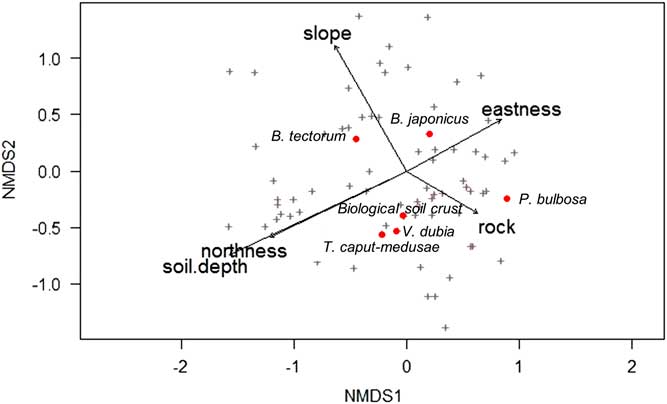
NMDS analysis revealed that V. dubia, T. caput-medusae, and biological soil crust were closely associated (Figure 7). Although biological soil crust is often linked to undisturbed areas, some crust components, such as lichens, can colonize disturbed sites more rapidly than other species (U.S. Department of the Interior [USDI] 2001). In addition, surveys show that communities invaded by annual plants can still maintain annual mosses and cyanobacteria on the soil surface (Kaltenecker Reference Kaltenecker, Wicklow-Howard and Rosentreter1997). In this study, because all sites were disturbed by grazing, the close association between V. dubia, T. caput-medusae, and soil crust is likely more indicative of a wetter microhabitat than of the level of disturbance. Biological crusts can produce a rough surface microtopography that acts as detention structures for water, which can increase water infiltration (USDI 2001). The NMDS analysis revealed that much of the variation in abundance of V. dubia, T. caput-medusae, and biological soil crust was explained by variation in rock, soil depth, and a north/south gradient (Figure 7). By contrast, P. bulbosa abundance was largely influenced by rock; B. japonicus was largely influenced by an east/west gradient; and B. tectorum was largely influenced by a combination of slope, soil depth, and a north/south gradient.
Nonmetric multidimensional scaling (NMDS) of species scores in relation to collected environmental variables across all surveyed plots. Plus signs indicate all species, and for clarity, red circles indicate a selection of plant species or functional groups of interest, which are labeled. Only significant (α=0.05) environmental predictors were included, and arrows show the direction of increasing gradient.
Linear regressions using natural log–transformed V. dubia cover values were calculated to test for a relationship between V. dubia cover and clay, sand, and silt content from 21 soil samples. There was a significant positive relationship between V. dubia and clay [F(1, 19)=5.925, P=0.025, adj. R2=0.198; Figure 8A]. Clay composed up to 41% of the soil particle distribution. There was no significant relationship between V. dubia and sand or silt (P>0.1). These data provide further support that V. dubia occupies wetter areas, because clay particles retain more soil moisture compared with other soil particles (Marshall and Holmes Reference Marshall and Holmes1988).
Relationships between percent Ventenata dubia cover and (A) percent clay content [ln(y+1)=−0.363+0.102x], (B) phosphorous concentration [ln(y+1)=3.917 − 0.101x], and (C) potassium concentration [ln(y+1)=4.676 − 0.008x] in the soil. Fitted lines are significant (α=0.05) regressions.
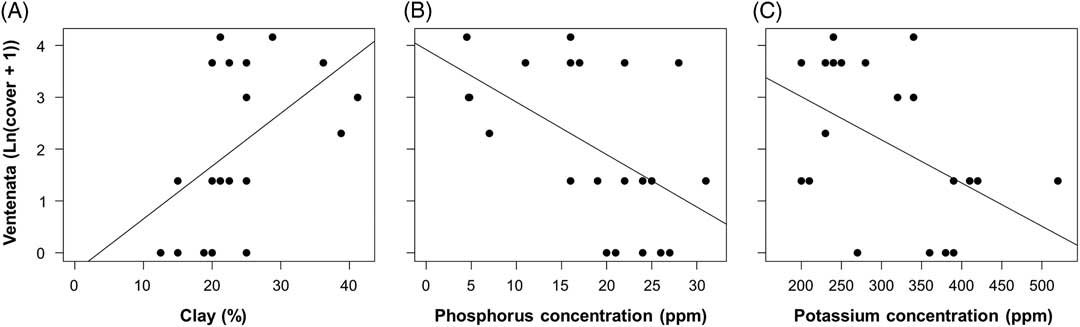
In agricultural systems, Mackey (Reference Mackey2014) found an association between high V. dubia cover (>50%) and soils comparatively low in phosphorous and potassium concentration. In our study, linear regressions of natural log–transformed V. dubia cover values showed lower phosphorous [F(1, 19)=22.44, P<0.001, adj. R2=0.517] and potassium [F(1, 19)=5.598, P=0.029, adj. R2=0.187] concentrations with higher V. dubia cover (Figure 8B and C). For all samples, measured phosphorus values ranged from 5 to 31 ppm, and potassium values ranged from 200 to 520 ppm. In addition to providing more information about V. dubia’s abiotic niche, these results offer insight into V. dubia’s competitive ability to access these macronutrients when they are in limited supply. Evidence from meta-analyses suggests that invasive plants have higher nutrient resorption efficiencies than native plants when in nutrient-poor environments (González et al. Reference González, Kominoski, Danger, Ishida, Iwai and Rubach2010; Sardans et al. Reference Sardans, Bartrons, Margalef, Gargallo-Garriga, Janssens, Ciasis, Obersteiner, Sigurdsson, Chen and Peñuelas2017).
These data, coupled with herbaria records, suggest that V. dubia is still in the early stages of invasion in sagebrush steppe communities. Its presence was patchy across a range of elevations, and its abundance was low. Currently, areas with high V. dubia cover were associated with decreased plant plant species richness and diversity, particularly native plant species richness. While soil moisture was not directly measured, V. dubia was observed in ephemerally wet areas, and results from the indicator species and NMDS analyses show associations between V. dubia and plants that occupy moist habitats, suggesting that V. dubia initially occupies wet microhabitats. In addition, there were strong positive associations between V. dubia and the abundance of T. caput-medusae and the amount of clay in the soil. There were negative correlations between V. dubia cover and phosphorus and potassium concentrations in the soil.
In grasslands of the Inland Northwest, before the 1990s, V. dubia was initially observed in seasonally wet areas (Miller et al. Reference Miller, Northam and Callihan1998). Now, however, V. dubia dominates dry, south-facing slopes originally populated by xeric perennial bunchgrasses, such as bluebunch wheatgrass [Pseudoroegneria spicata (Pursh) Á. Löve] and Sandberg bluegrass (Poa secunda J. Presl) (Wallace and Prather Reference Wallace and Prather2013b). In this region, V. dubia in moist areas initially acted as source populations, with it later expanding its habitat niche to also include dry areas. We hypothesize a similar phenomenon may occur where V. dubia has expanded its range to sagebrush steppe ecosystems. Source-sink dynamics explain patch demography of metapopulations for animals, plants, and microbes (Eriksson Reference Eriksson1996; Hall et al. Reference Hall, Wood, Harrison and Brockhurst2016; Horvath et al. Reference Horvath, Lamberti, Lodge and Perry1996). For example, Wallace and Prather (Reference Wallace and Prather2013a) concluded that high shrub communities, compared with three other habitat types, were more suitable for a nonindigenous annual forb, which may then act as source populations for invasive spread at a landscape scale. Our experience of V. dubia’s spread in the Inland Northwest leads us to conclude that V. dubia’s current distribution in sagebrush rangelands may not always be limited to seasonally wet areas. Instead, its presence in moist microhabitats may initially serve as source populations that will permit its spread to other, drier habitat types. Moreover, B. tectorum and T. caput-medusae, with life-history traits similar to those of V. dubia, are problem weeds in both the grasslands of the Inland Northwest (Northam and Callihan Reference Northam and Callihan1994) and sagebrush rangelands of the Intermountain West (Miller et al. Reference Miller, Clausnitzer and Borman1999). Thus, in sagebrush steppe ecosystems, V. dubia management efforts should: (1) seek to use T. caput-medusae as an indicator species, such that initial monitoring efforts are focused around areas where T. caput-medusae has previously established or has the potential to be a problem; and (2) focus control and restoration efforts on moist habitats, as these may act as source populations where V. dubia is initially most competitive.
Locating areas where the risk of invasion is high by using knowledge of existing flora and site characteristics offers a preventive control policy of invasive taxa in place of a curative control policy (Godefroid and Koedam Reference Godefroid and Koedam2003). Knowledge of the distribution of T. caput-medusae in sagebrush steppe rangelands would elucidate the potential area of future V. dubia invasion. Preventive action is more efficient than a reactive one (Macdonald Reference Macdonald1994), and the importance of detecting invasions early and initiating appropriate levels of control immediately must continue to be emphasized (Dickson Reference Dickson1998; Usher Reference Usher1989).
Acknowledgments
The authors would like to gratefully acknowledge Larry Lass, Josh Everett, and Bonnie Davis for their assistance with locating study sites. This research was partially funded by the David Little Livestock Range Management Endowment.


