





1. Introduction
For astronomers to adopt active radio frequency interference (RFI) mitigation, they need to understand the impact of mitigation on telescope performance and calibration.
Active RFI mitigation algorithms can help sensitive radio telescopes operate over scientifically interesting bandwidths in the congested modern radio spectrum. RFI continues to increase with population and technology use (Committee on Radio Astronomy Frequencies 1997). Telescopes are also becoming more susceptible to RFI as they are built to operate with higher sensitivities and bandwidths. The Australian SKA Pathfinder (ASKAP) telescope (Hotan et al. Reference Hotan2021) used in this work operates over 700–1800 MHz in frequency bands where satellite navigation, aviation, and terrestrial mobile communication base stations have a primary service allocation (ITU-R 2016). Active mitigation algorithms could enable the use of the 1.15–1.3 GHz band that is largely avoided by ASKAP due to satellite navigation signals.
Radio astronomers currently mark and discard (flag) RFI-affected data so that it does not affect scientific conclusions. Unfortunately, discarding data reduces measurement sensitivity as the discarded data contains valuable information from astronomical sources. In the case of a synthesis imaging array like ASKAP, flagging also changes the secondary beam, or point spread function, and thereby image resolution and dynamic range. Although effective when carefully implemented, flagging does not exploit all the information the system provides. In particular, the interferer’s spatial information is not fully considered.
Phased array feeds (PAFs) allow for the recovery of spatial information of RFI and cosmic sources. Using this spatial information, projection techniques for aperture arrays and PAFs create nulls in the direction of the RFI (Leshem, van der Veen, & Boonstra Reference Leshem, van der Veen and Boonstra2000; Hellbourg et al. Reference Hellbourg, Weber, Capdessus and Boonstra2012b; Jeffs & Warnick Reference Jeffs and Warnick2008), which could reduce the amount of discarded and flagged data. The viability of this technique for the ASKAP PAF has already been explored in simulation (Black et al. Reference Black, Jeffs, Warnick, Hellbourg and Chippendale2015) and demonstrated on six antennas during commissioning (Hellbourg, Bannister, & Hotarp Reference Hellbourg, Bannister and Hotarp2017). Black et al. (Reference Black, Jeffs, Warnick, Hellbourg and Chippendale2015) showed that mitigation via spatial nulling at the PAF beamformer is most effective. The PAF primary beam nulls are spatially broader and, therefore, don’t have to be updated as rapidly to track moving interferers as would be the case for secondary beam nulls formed at the correlator.
Despite promising progress of active RFI mitigation radio in radio astronomy (Fridman & Baan Reference Fridman and Baan2001; Series Reference Series2013), much work remains to implement these techniques as part of a holistic strategy in routine, large-scale telescope operations in combination with ‘traditional’ RFI mitigation techniques.
This paper begins to address this gap, building on work by Chippendale & Hellbourg (Reference Chippendale and Hellbourg2017) in which a narrowband tone generated by the PAF digital back-end was suppressed by up to 20 dB using a modified ASKAP Mk. II PAF on the 64 m Parkes telescope. In this instance, the unwanted signal is static (not moving) relative to the receiver and mitigated at the start of the observation. This static case is an essential first step toward mitigating more pernicious forms of RFI from satellite and aviation systems that are dynamic (moving) and need to be mitigated in as close to real-time as possible. Note that in cases where the interference is external to the receiver (or downstream electronics), RFI will appear dynamic from the telescope’s point of view because the telescope tracks a source on the sky.
We present simulated forward predictions of the effects of spatial nulling via PAF beamforming on astronomical figures of merit, comparing two subspace-projection-based algorithms with attention to the impacts on sensitivity (noise), bandpass (gain), and beam shape, including polarisation response. Section 2 describes the ASKAP PAF, the signal model and an overview of the spatial filtering algorithms. Section 3 gives simulated forward predictions of the effects of the mitigation. Finally, Section 4 presents the implementation and measured performance on ASKAP.
2. Background
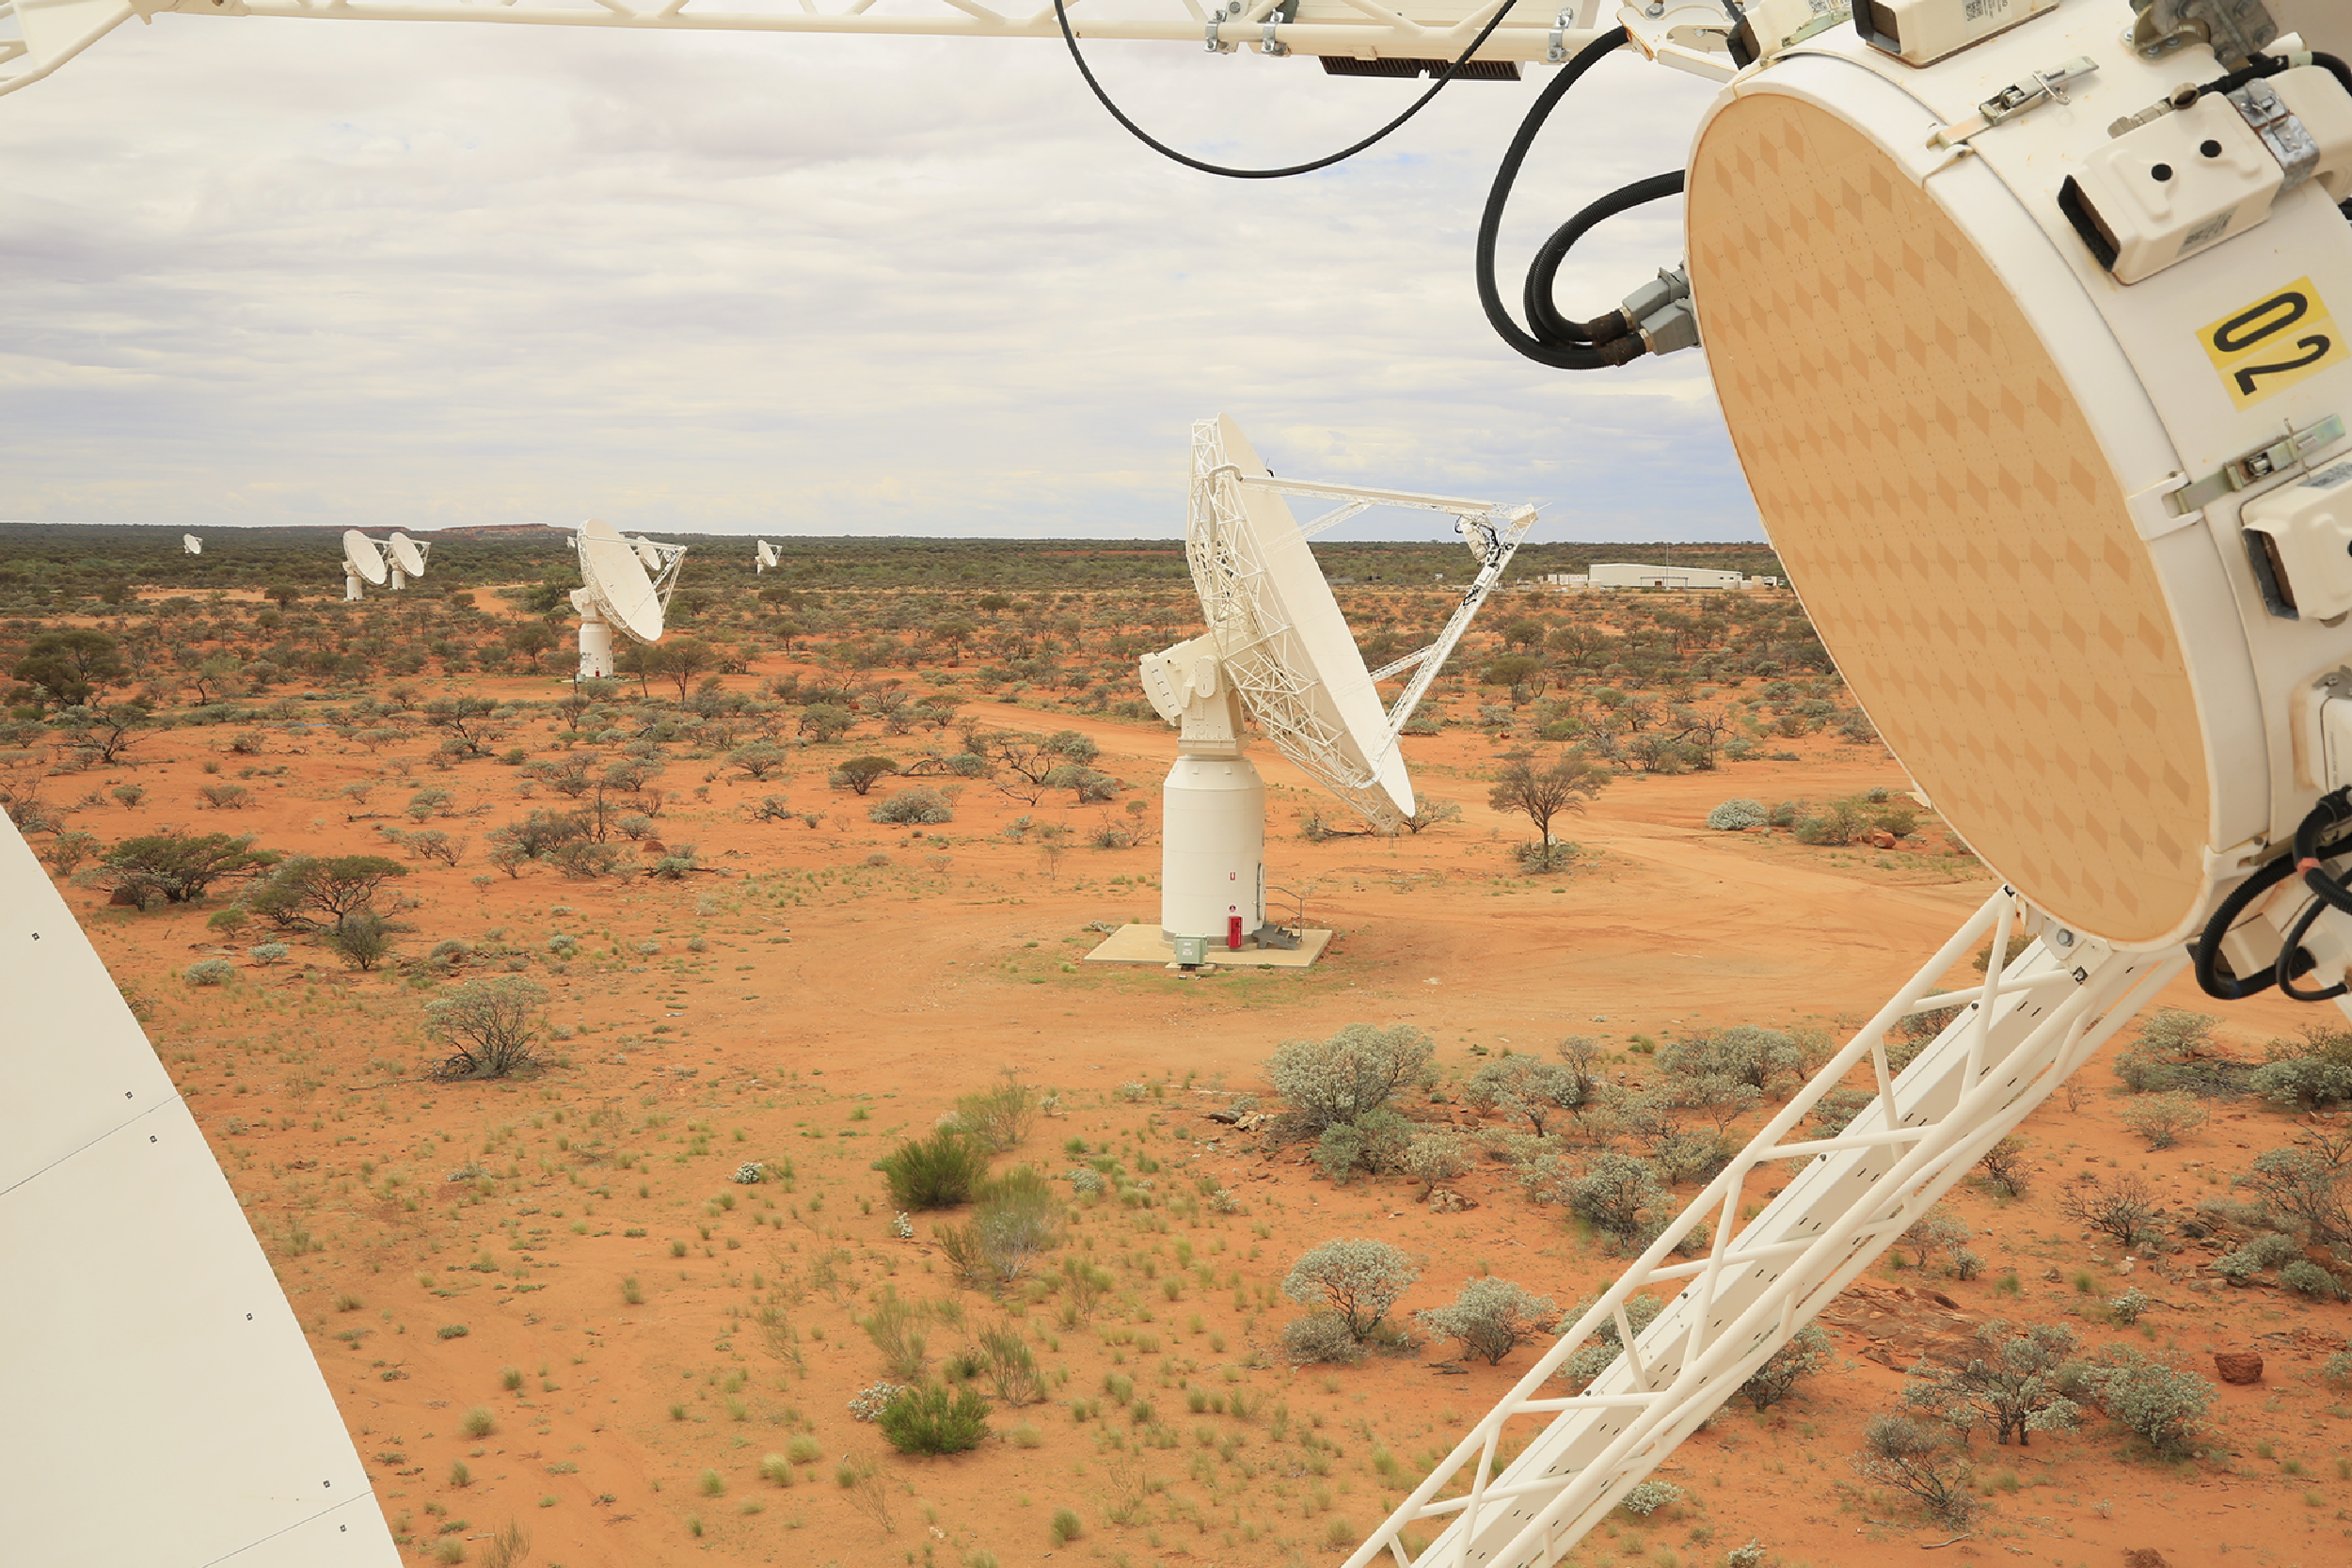
The ASKAP telescope comprises thirty-six 12 m parabolic reflectors at Inyarrimanha Ilgari Bundara, the CSIRO Murchison Radio-astronomy Observatory. This unique radio-quiet site is protected by rigorous testing and shielding of observatory electronics and legislative coordination of spectrum usage up to a radius of 260 km (Wilson, Storey, & Tzioumis Reference Wilson, Storey and Tzioumis2013). Fig. 1 shows the Mk. II PAF at the focus of each antenna. Behind the 188 chequerboard elements (94 per polarisation) is the receiver electronics package housing the low noise amplifiers (per antenna element), three radio frequency (RF) band selection filters and RF-over-fibre transmitter (Hotan et al. Reference Hotan2021).
12 m ASKAP antennas with PAFs at their foci at Inyarrimanha Ilgari Bundara, the CSIRO Murchison Radio-astronomy Observatory. Credit: CSIRO.
The self-generated RFI is generated by a 256 MHz FPGA clock that is multiplied by an oversampling rate of 32/27 to read out the digital receiver’s 1 MHz resolution oversampled coarse filter bank (Tuthill et al. Reference Tuthill2012). Relative delays of this unwanted signal between digital ports differ significantly from relative delays of the desired astronomical signals entering via the reflector and PAF. This difference in the spatial signature allows the RFI to be cancelled at the beamformer output with little impact on the desired signal. The digital receiver is housed in the stable environment of the ASKAP’s central building, so we expect this RFI and its path into the signal chain to be stable except for resets of the digital receiver, which do not occur during observing.
The fundamental of this $32 / 27 \times 256\,\mathrm{MHz} = 303.4\,\mathrm{MHz}$
clock signal is aliased and appears at the frequency labeled
$32 / 27 \times 256\,\mathrm{MHz} = 303.4\,\mathrm{MHz}$
clock signal is aliased and appears at the frequency labeled
 $$ F_s/2 + (F_s/2 - 303.4) = 976.6\,\mathrm{MHz} $$
when observing in ASKAP’s 700–1 200 MHz band with a sampling rate of $F_s= 1\,280\,\mathrm{MHz}$
.
$F_s= 1\,280\,\mathrm{MHz}$
.
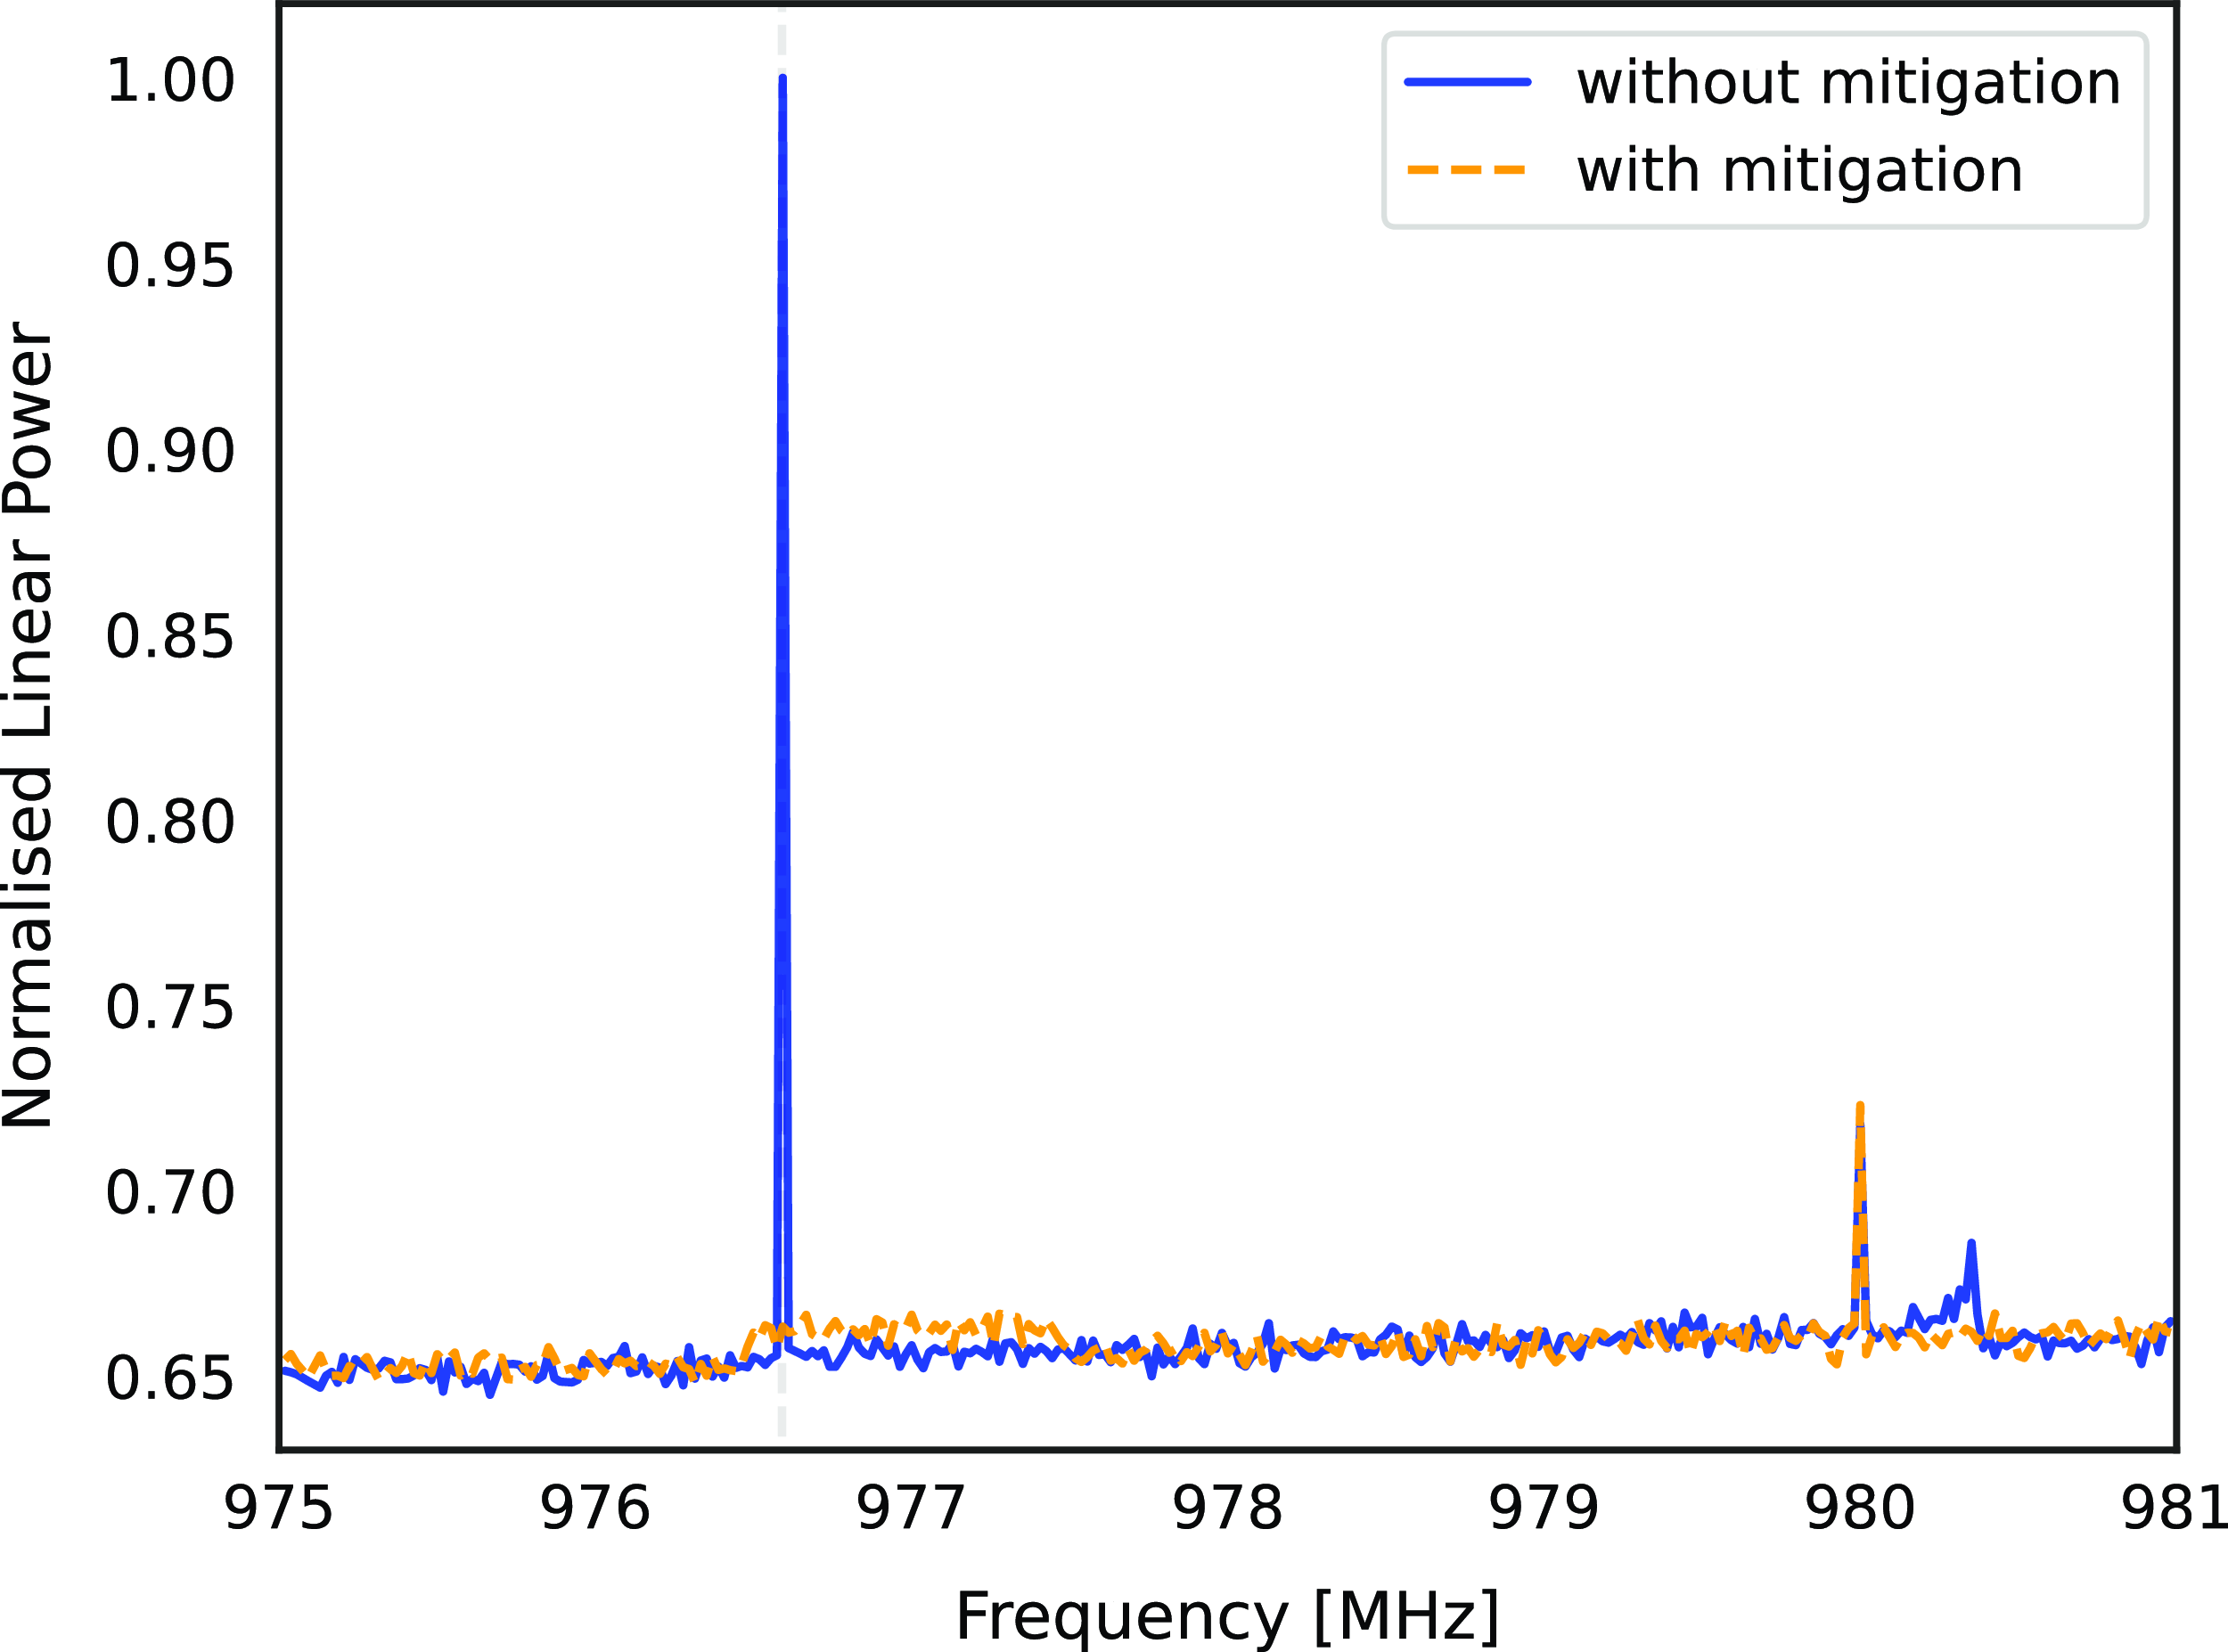
Fig. 2 shows the clock signal in the fine filter bank power spectrum without mitigation (blue) and with mitigation (orange). The mitigation suppresses the unwanted interference, but also increases the system temperature of the 1 MHz channel in which beamformer weights were adjusted to implement the mitigation.
Beamformed single-antenna power spectra with mitigation (orange) and without (blue). Beamformer weights are fixed over each 1 MHz coarse channel before further channelisation to 18.5 KHz resolution. The 976.6 MHz unwanted clock signal is successfully mitigated but with an increase in the system temperature for that coarse channel. The difference between spectra at 980.3 MHz is due to these observations occurring at different times. The mitigation, using the oblique projection, was performed whilst observing a flux reference source, Virgo A, assuming the flux model of Ott et al. (Reference Ott, Witzel, Quirrenbach and Krichbaum1994) using a single ASKAP antenna.
2.1. Signal model
The instantaneous output for a single ASKAP PAF (Fig. 1) is an M-dimensional vector of complex voltages ( $M = 188$
)
$M = 188$
)
 \begin{equation}\mathbf{x}[n] = x_{\text{SOI}}[n]\mathbf{a}_{\text{SOI}} + x_{\text{RFI}}[n]\mathbf{a}_{\text{RFI}} + \mathbf{x}_{\text{z}}[n]\end{equation}
where $x_{\text{SOI}}[n]$
and
$x_{\text{SOI}}[n]$
and $x_{\text{RFI}}[n]$
are the scalar amplitude time samples of the astronomical and RFI (unwanted signal to mitigate) respectively.
$x_{\text{RFI}}[n]$
are the scalar amplitude time samples of the astronomical and RFI (unwanted signal to mitigate) respectively. $\mathbf{a}_{\text{SOI}}$
and
$\mathbf{a}_{\text{SOI}}$
and $\mathbf{a}_{\text{RFI}}$
are the spatial signature vectors of the SOI and RFI, respectively.
$\mathbf{a}_{\text{RFI}}$
are the spatial signature vectors of the SOI and RFI, respectively. $\mathbf{x}_{\text{z}}[n]$
is the total system noise (the radio sky, feed, and receiver). ASKAP’s beamformer (Hotan et al. Reference Hotan2021) computes an array covariance matrix (ACM), which is the pairwise correlation of each port with every other port for a single 1 MHz coarse filter bank channel
$\mathbf{x}_{\text{z}}[n]$
is the total system noise (the radio sky, feed, and receiver). ASKAP’s beamformer (Hotan et al. Reference Hotan2021) computes an array covariance matrix (ACM), which is the pairwise correlation of each port with every other port for a single 1 MHz coarse filter bank channel
 \begin{equation} \mathbf{R} = \langle \mathbf{x}[n]\cdot \mathbf{x}[n]^H \rangle = \frac{1}{L} \sum_{n=1}^{L} \mathbf{x}[n]\mathbf{x}^{H}[n]\end{equation}
where $(.)^{H}$
is the Hermitian (complex conjugate) transpose, and
$(.)^{H}$
is the Hermitian (complex conjugate) transpose, and $\langle.\rangle$
is the average operator. The spatial filtering algorithms used below use this ACM to estimate the RFI spatial signature (
$\langle.\rangle$
is the average operator. The spatial filtering algorithms used below use this ACM to estimate the RFI spatial signature ( $\mathbf{a}_{RFI}$
) and subsequently suppress its contribution. For typical moving RFI
$\mathbf{a}_{RFI}$
) and subsequently suppress its contribution. For typical moving RFI $\mathbf{a}_{RFI}$
must be estimated frequently. For the stationary clock signal being mitigated here,
$\mathbf{a}_{RFI}$
must be estimated frequently. For the stationary clock signal being mitigated here, $\mathbf{a}_{RFI}$
can be estimated once at the beginning of an observation because it does not change with time or PAF motion.
$\mathbf{a}_{RFI}$
can be estimated once at the beginning of an observation because it does not change with time or PAF motion.
Under typical operation, a set of beamforming steering vectors or ‘beamformer weights’ are calculated at the beginning of the observation and loaded to the beamformer to create up to 36 dual-polarised beams on ASKAP. The 188 weights correspond to a weighting of each PAF port and are calculated per beam, per 1 MHz channel via the ACM using a maxSNR algorithm from an on-source and off-source pointing (Hotan et al. Reference Hotan2021). This beamforming process is most easily understood as applying the weights as a weighted sum of the PAF array element voltages
 \begin{equation}\mathbf{y}[n] = \mathbf{w}^H \mathbf{x}[n].\end{equation}
The goal is to update these beamformer weights ( $\mathbf{w}$
) by projecting them onto a subspace orthogonal to the interference subspace, forcing a deep null in the ‘direction’ of the interferer but preserving beam gain in the direction of the original beam that was designed to receive the SOI.
$\mathbf{w}$
) by projecting them onto a subspace orthogonal to the interference subspace, forcing a deep null in the ‘direction’ of the interferer but preserving beam gain in the direction of the original beam that was designed to receive the SOI.
2.2. Mitigation algorithm
Subspace projection refers to a subset of spatial filtering signal processing techniques involving a linear projection to cancel the unwanted signal in the beamformed output of an array. Two projections are considered in this research: orthogonal (Leshem & Van Veen Reference Leshem and Van Veen2000) and oblique (Behrens & Scharf Reference Behrens and Scharf1994; Hellbourg et al. Reference Hellbourg, Weber, Capdessus and Boonstra2012b). Hellbourg et al. (Reference Hellbourg, Weber, Capdessus and Boonstra2012b) and Warnick et al. (Reference Warnick, Maaskant, Ivashina, Davidson and Jeffs2018) give a full description of both projections. Both use an eigenvalue decomposition of the ACM to determine the ‘direction’ of the RFI
 \begin{equation} \mathbf{R} = \mathbf{U} \Lambda \mathbf{U}^{H}. \end{equation}
Each column of $\mathbf{U}$
is an eigenvector of
$\mathbf{U}$
is an eigenvector of $\mathbf{R}$
, corresponding to the eigenvalues contained along the diagonal of the matrix
$\mathbf{R}$
, corresponding to the eigenvalues contained along the diagonal of the matrix $\Lambda$
sorted in descending power.
$\Lambda$
sorted in descending power. $\mathbf{U}$
may be partitioned into columns
$\mathbf{U}$
may be partitioned into columns $\mathbf{U}_{RFI}$
defining the RFI subspace and
$\mathbf{U}_{RFI}$
defining the RFI subspace and $\mathbf{U}_{SOI + z}$
defining the signal plus noise subspace
$\mathbf{U}_{SOI + z}$
defining the signal plus noise subspace
 \begin{equation}\mathbf{U} = [\mathbf{U}_{\text{RFI}}|\mathbf{U}_{\text{SOI} + z}].\end{equation}
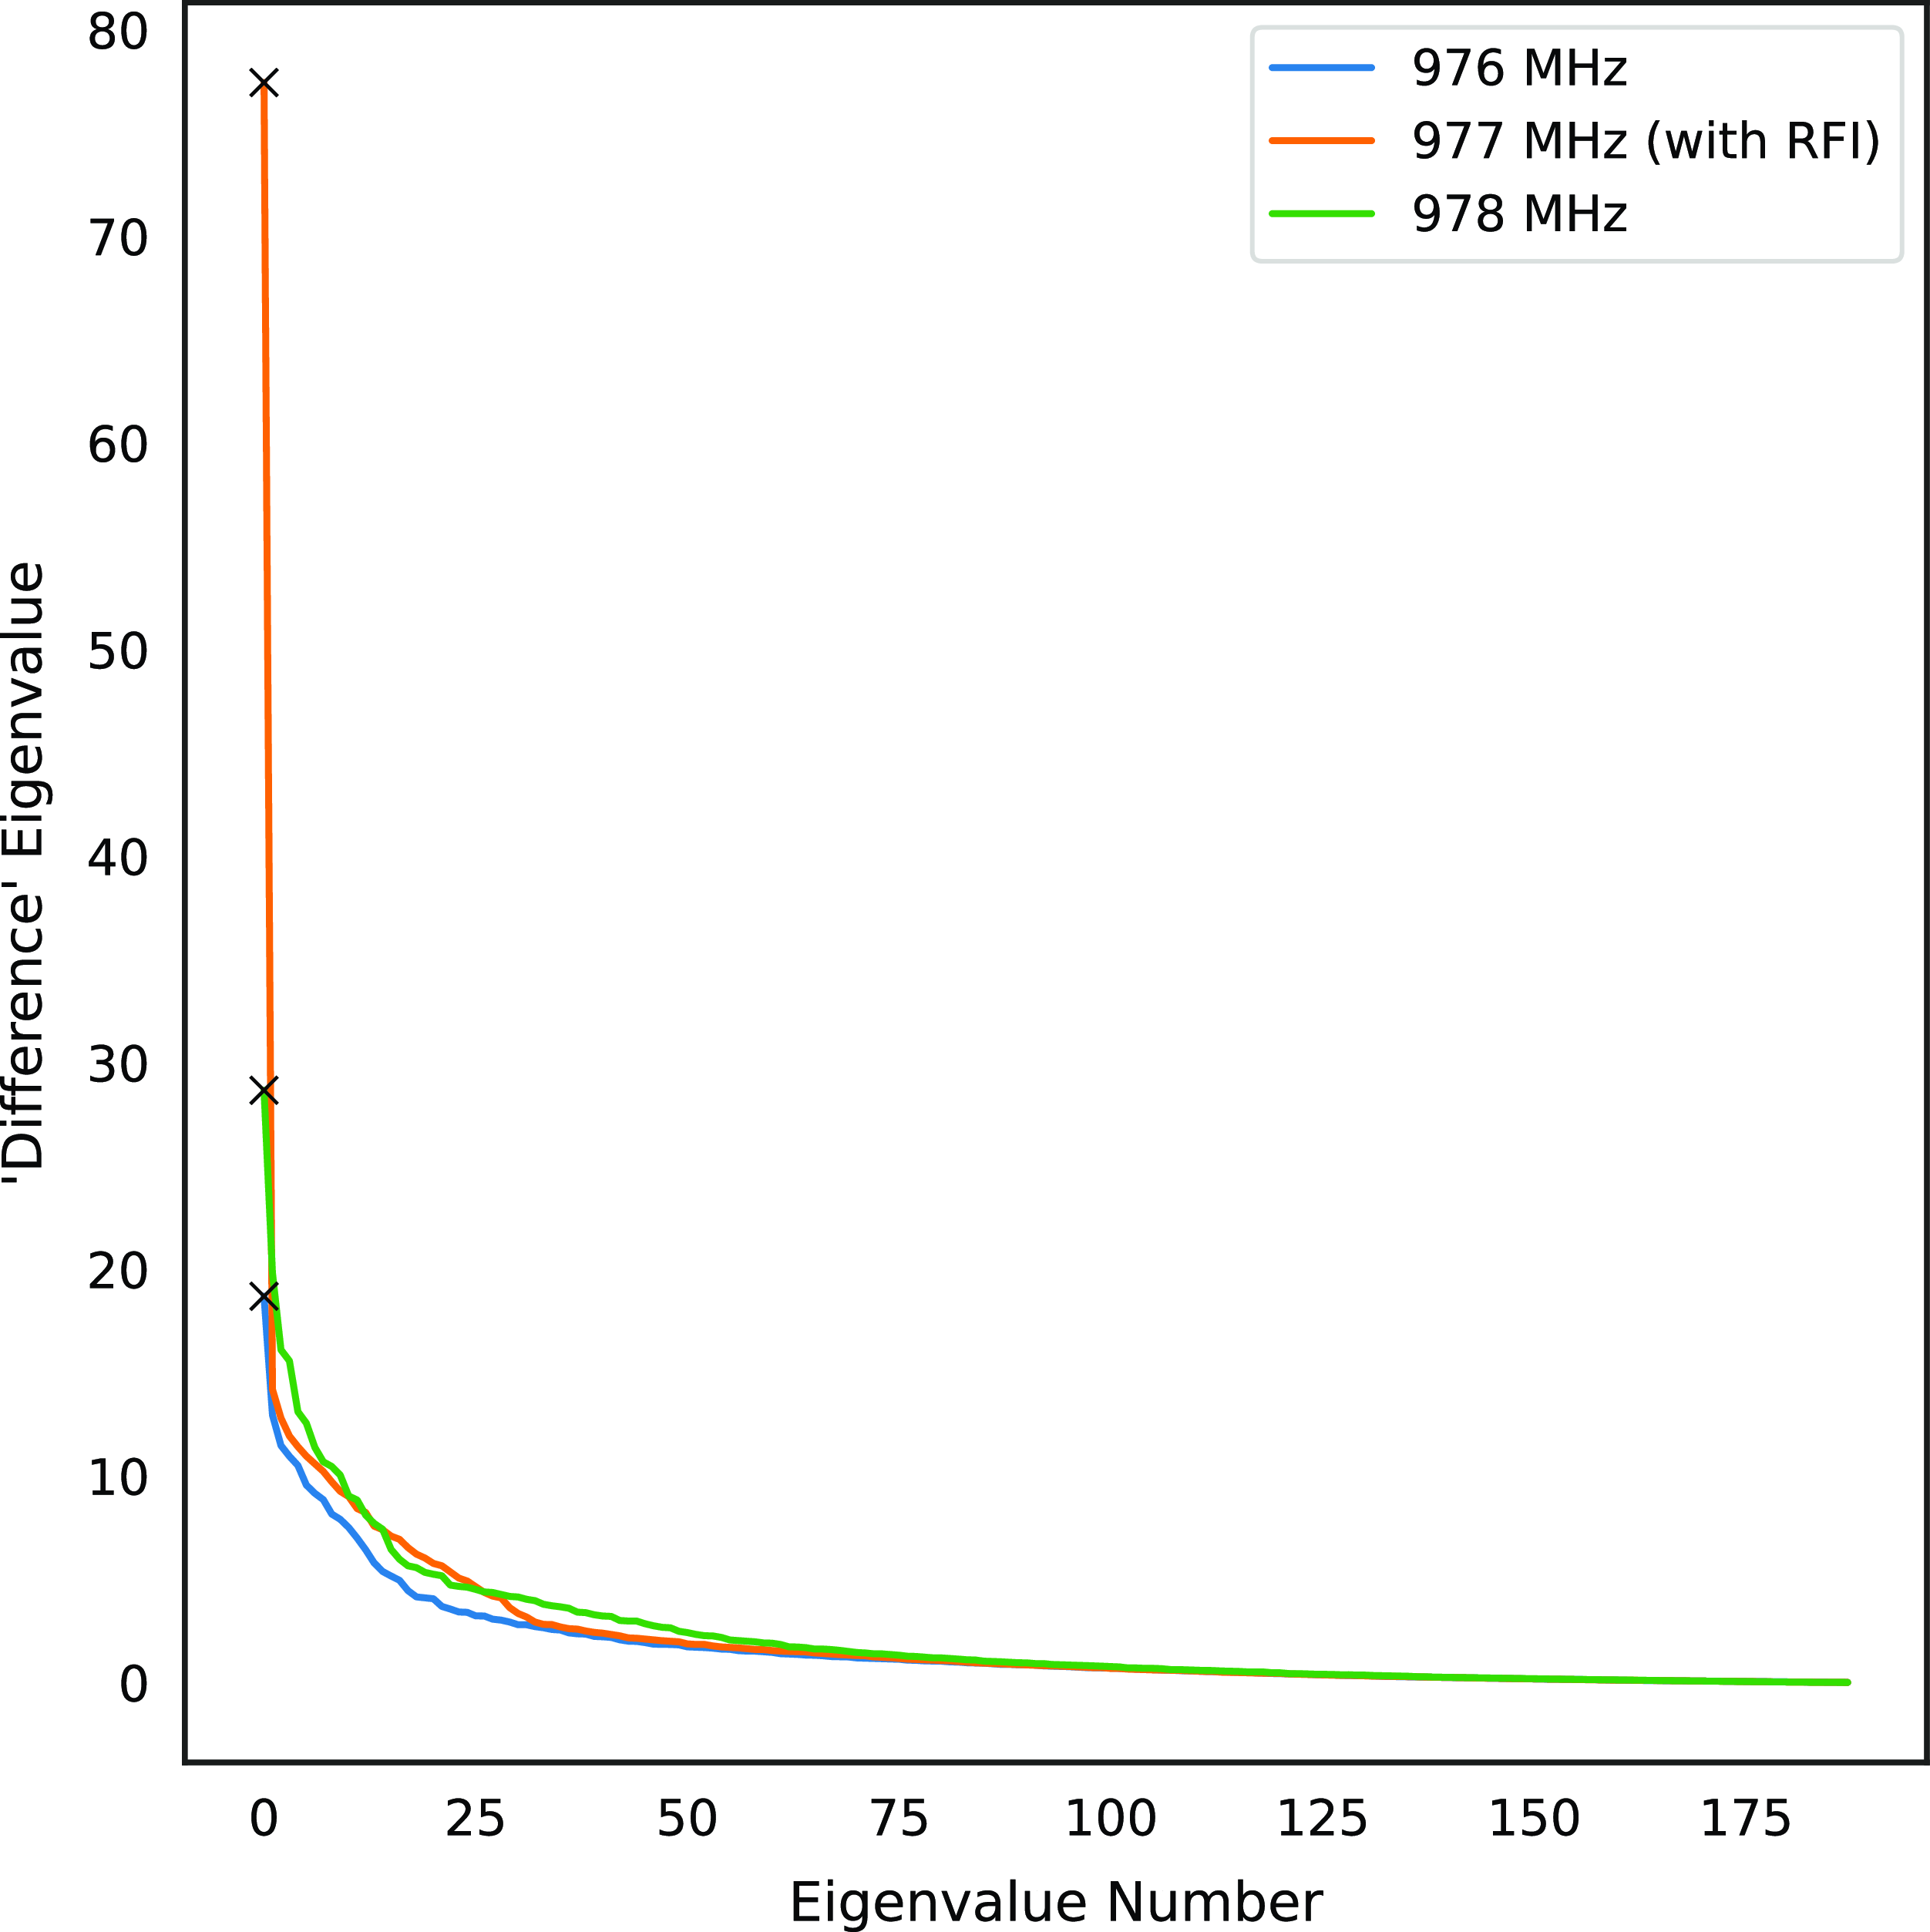
In the case of the self-generated interference, Fig. 5a shows there is only one dominant eigenvalue. The corresponding eigenvector $\mathbf{a}_{\text{RFI}}$
comprises a one-dimensional RFI subspace
$\mathbf{a}_{\text{RFI}}$
comprises a one-dimensional RFI subspace $\mathbf{U}_{\text{RFI}}$
.
$\mathbf{U}_{\text{RFI}}$
.
An orthogonal projection matrix $\mathbf{P}_{\text{ortho}}$
is defined as follows, where
$\mathbf{P}_{\text{ortho}}$
is defined as follows, where $\mathbf{I}$
is the identity matrix
$\mathbf{I}$
is the identity matrix
 \begin{equation} \mathbf{P}_{\text{ortho}}= \mathbf{I} - \mathbf{U}_{\text{RFI}}\left(\mathbf{U}_{\text{RFI}}^{H}\mathbf{U}_{\text{RFI}}\right)^{-1}\mathbf{U}_{\text{RFI}}^{H}.\end{equation}
Whilst orthogonal projection mitigates the unwanted signal, it introduces undesirable distortions to the primary beam shape. Therefore, oblique projection is preferred as it better preserves the desired beam shape (Hellbourg et al. Reference Hellbourg, Weber, Capdessus and Boonstra2012b). Using the calculated maxSNR beam weights ( $\mathbf{w}$
) as our spatial signature
$\mathbf{w}$
) as our spatial signature $\mathbf{a}_{\text{SOI}}$
, we determine a projection matrix
$\mathbf{a}_{\text{SOI}}$
, we determine a projection matrix $\mathbf{P}_{\text{obliq}}$
, which not only mitigates the interferer but maintains the steering direction and gain
$\mathbf{P}_{\text{obliq}}$
, which not only mitigates the interferer but maintains the steering direction and gain
 \begin{equation} \mathbf{P}_{\text{obliq}}= \mathbf{a}_{\text{SOI}}\left(\mathbf{a}_{\text{SOI}}^{H}\mathbf{P}_{\text{ortho}}\mathbf{a}_{\text{SOI}}\right)^{-1}\mathbf{a}_{\text{SOI}}^{H}\mathbf{P}_{\text{ortho}}.\end{equation}
To obtain updated (‘mitigated’) weights, the chosen projection matrix is applied to the original weights
 \begin{equation} \mathbf{w}_{\text{proj}} = \mathbf{P}^{H} \mathbf{w}\end{equation}
before uploading them to the beamformer where they are used to calculate a beamformed voltage time series with suppressed RFI
 \begin{equation} \mathbf{y}_{\text{proj}}[n] = \mathbf{w}_{\text{proj}}^{H}\mathbf{x}[n].\end{equation}
3. Simulated forward predictions
The voltage pattern of individual ASKAP PAF elements is estimated based on the geometric optics analysis of Baars (Reference Baars2007) for the illumination of a parabolidal reflector by laterally offset feeds
 \begin{align} A_k(l,m) =\sqrt{2.56} \int_{0}^{1}2rF(r)J_{0}\left[ r\left\{ (l - sx_{k})^2 + (m - sy_{k})^2 \right\}^{0.5}\right]dr\end{align}
where $J_{0}$
is the Bessel function of the first kind and order zero. The illumination function
$J_{0}$
is the Bessel function of the first kind and order zero. The illumination function $F(r)= 1 - (1 - \tau) r^2$
based on the geometry of the reflector and PAF element positions (above). A one-dimensional slice showing the x-pol element response for the centre row (ten ports) of the ASKAP PAF is plotted in the background of Fig. 3.
$F(r)= 1 - (1 - \tau) r^2$
based on the geometry of the reflector and PAF element positions (above). A one-dimensional slice showing the x-pol element response for the centre row (ten ports) of the ASKAP PAF is plotted in the background of Fig. 3.
A model was created based on the PAF port spacing and diameter of the antenna. The background shows the x-polarisation element response for the centre row of ports using a $-15\, \text{dB}$
taper. The background curves are weighted and summed to form a beam in the foreground in a process called digital beamforming.
$-15\, \text{dB}$
taper. The background curves are weighted and summed to form a beam in the foreground in a process called digital beamforming.
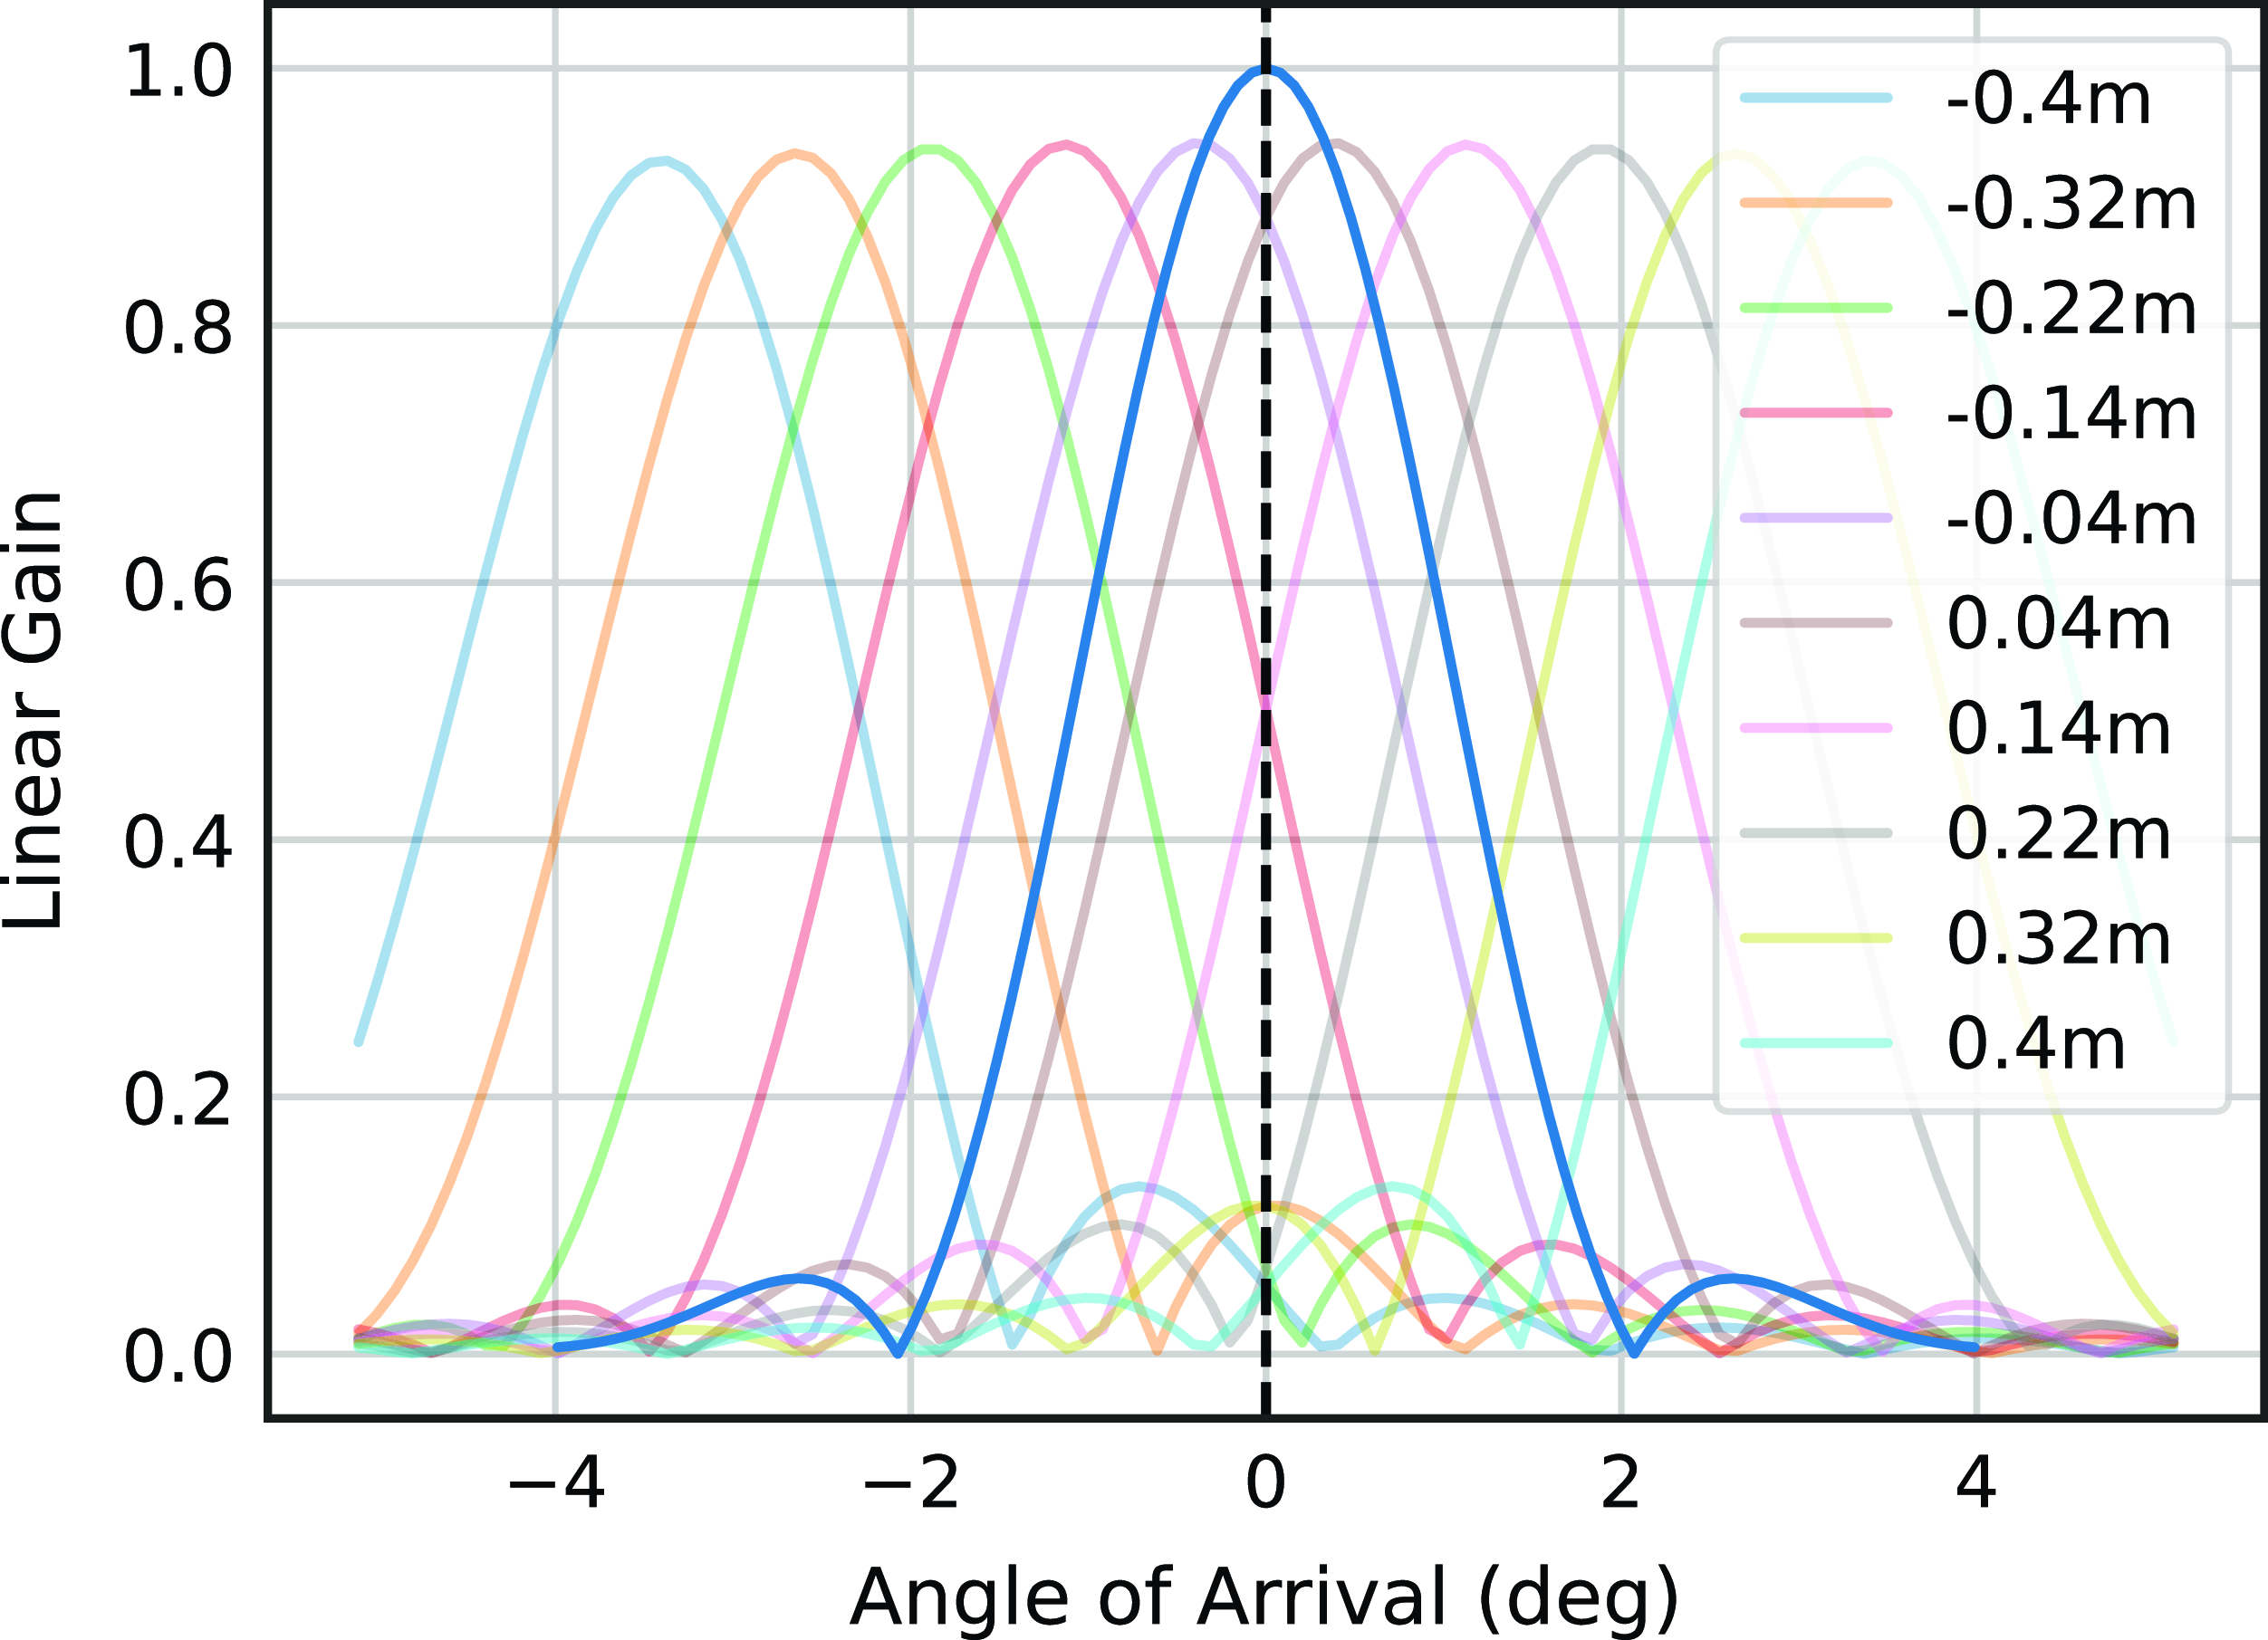
To create the beam ( $\mathbf{y}[n]$
) at the boresight in the foreground of Fig. 3, the model uses maximum gain weights that effect a conjugate field match (CFM); that is, the intersections of the background curves with the dashed vertical line are the weights
$\mathbf{y}[n]$
) at the boresight in the foreground of Fig. 3, the model uses maximum gain weights that effect a conjugate field match (CFM); that is, the intersections of the background curves with the dashed vertical line are the weights $\mathbf{w}$
used to steer the beam. The exact process is repeated for the y-polarisation ports but is not shown here.
$\mathbf{w}$
used to steer the beam. The exact process is repeated for the y-polarisation ports but is not shown here.
PAF ports are weighted by a steering vector and summed to create beams. The beam in the foreground of Fig. 3 shows a high-gain main lobe centred about the dotted line and terminates on either side with a null. The first and second side lobes are also discernible, separated by nulls. The model evaluates the effects of the orthogonal and oblique projection on six equally spaced beams ( $\approx+0.9^\circ$
degrees apart) across the PAF for both polarisations. This beam separation was chosen based on the close-pack square
$\approx+0.9^\circ$
degrees apart) across the PAF for both polarisations. This beam separation was chosen based on the close-pack square $6\times6$
beam footprint used by ASKAP (Hotan et al. Reference Hotan2021).
$6\times6$
beam footprint used by ASKAP (Hotan et al. Reference Hotan2021).
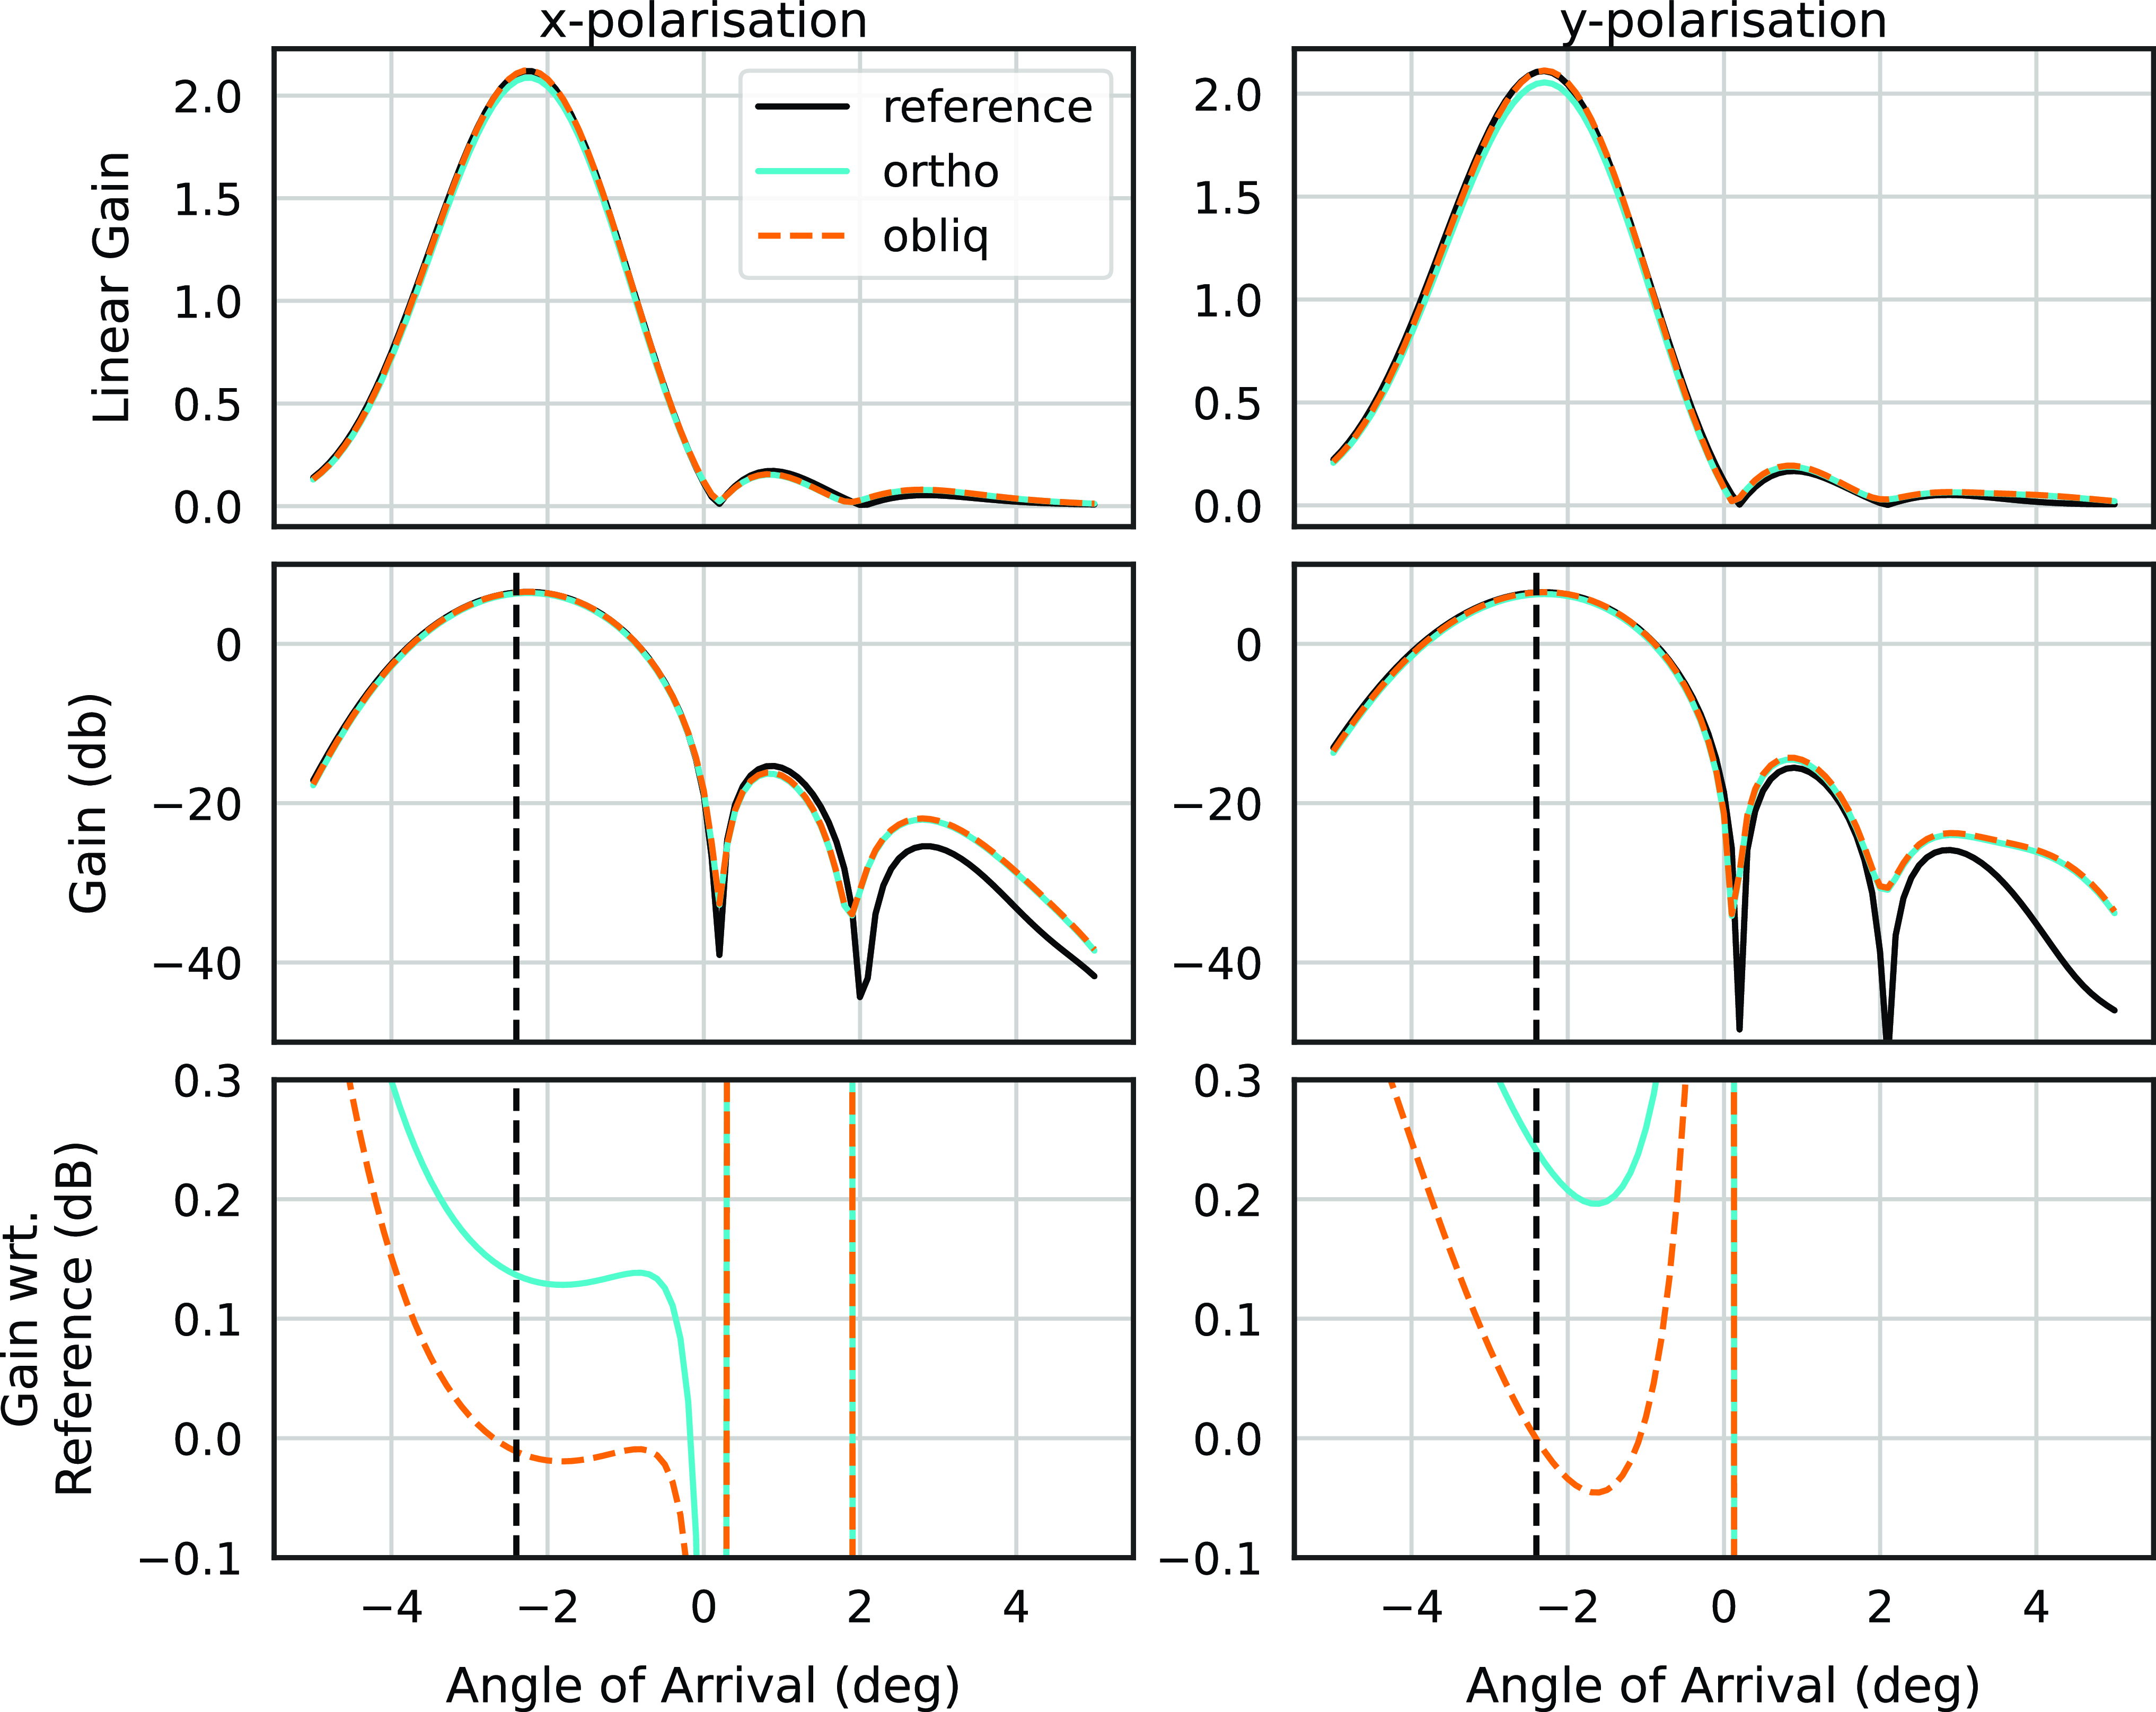
X and Y polarisation beamformed response in the direction $-2.4^\circ$
, before and after mitigation. The rows show the linear gain, gain in decibels and gain in decibels with respect to the reference (unmitigated) beam. This result is for the case where the RFI enters each PAF port with a measured RFI spatial signature. Variations to the beam shape are reduced in the main lobe when using oblique projection. In both cases, introduced variations to suppress the unwanted signal are confined to the outer lobes.
$-2.4^\circ$
, before and after mitigation. The rows show the linear gain, gain in decibels and gain in decibels with respect to the reference (unmitigated) beam. This result is for the case where the RFI enters each PAF port with a measured RFI spatial signature. Variations to the beam shape are reduced in the main lobe when using oblique projection. In both cases, introduced variations to suppress the unwanted signal are confined to the outer lobes.
The effects of mitigation, using an estimated 1-D RFI spatial signature of the stationary internal clock signal determined from an ASKAP ACM, were assessed on changes to model beam shape (Fig. 4) and suppression calculated as follows
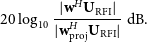 \begin{equation} 20\log_{10}\frac{\lvert \mathbf{w}^H \mathbf{U}_{\text{RFI}} \rvert}{\lvert \mathbf{w}_{\text{proj}}^{H} \mathbf{U}_{\text{RFI}} \rvert} \ \text{dB}.\end{equation}
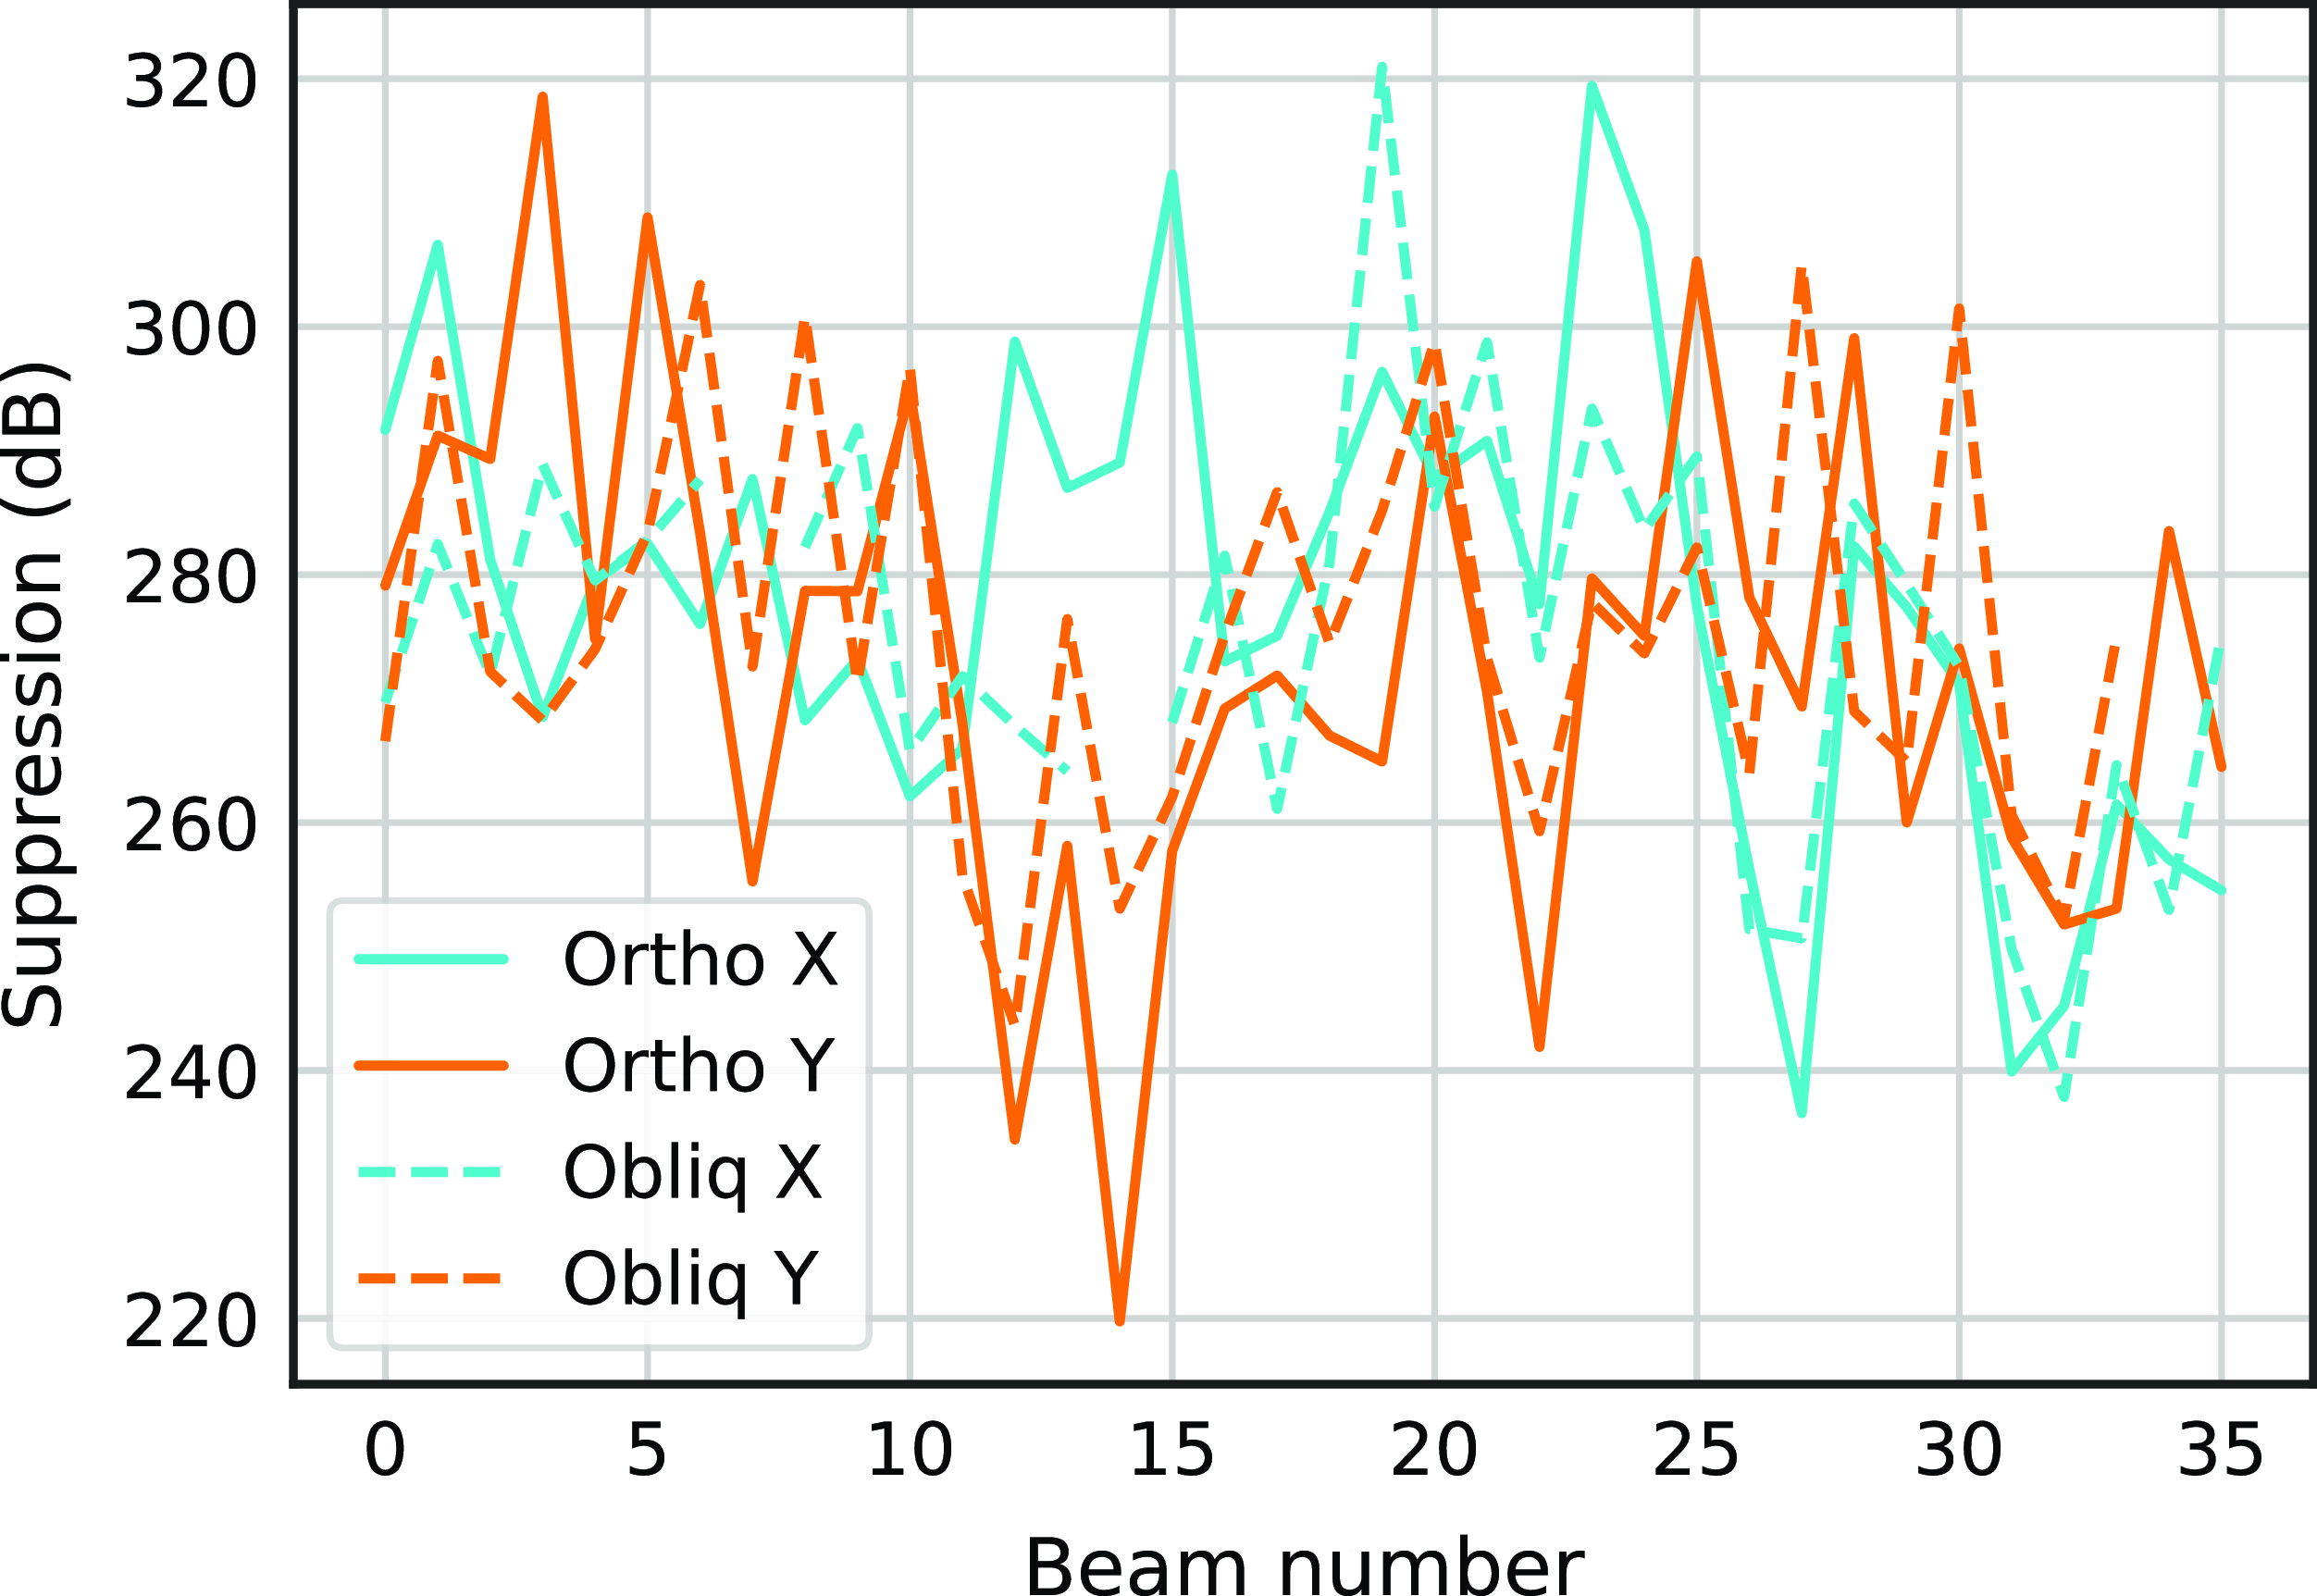
As expected from previous experiments (Chippendale & Hellbourg Reference Chippendale and Hellbourg2017), the projection algorithms suppress the unwanted signal. The calculated predicted suppression of the unwanted signal across the six simulated beams yields an upper limit on the suppression greater than 250 dB. In other words, how orthogonal the RFI spatial signature can be made given, for example, the numeric precision of the calculations. In practice, this will be limited by the noise floor and the degree to which an accurate RFI spatial signature vector can be estimated.
The eigenvalue decomposition of three adjacent ACM centred on the RFI-affected channel showing the power and ‘direction’ of the eigenmodes.
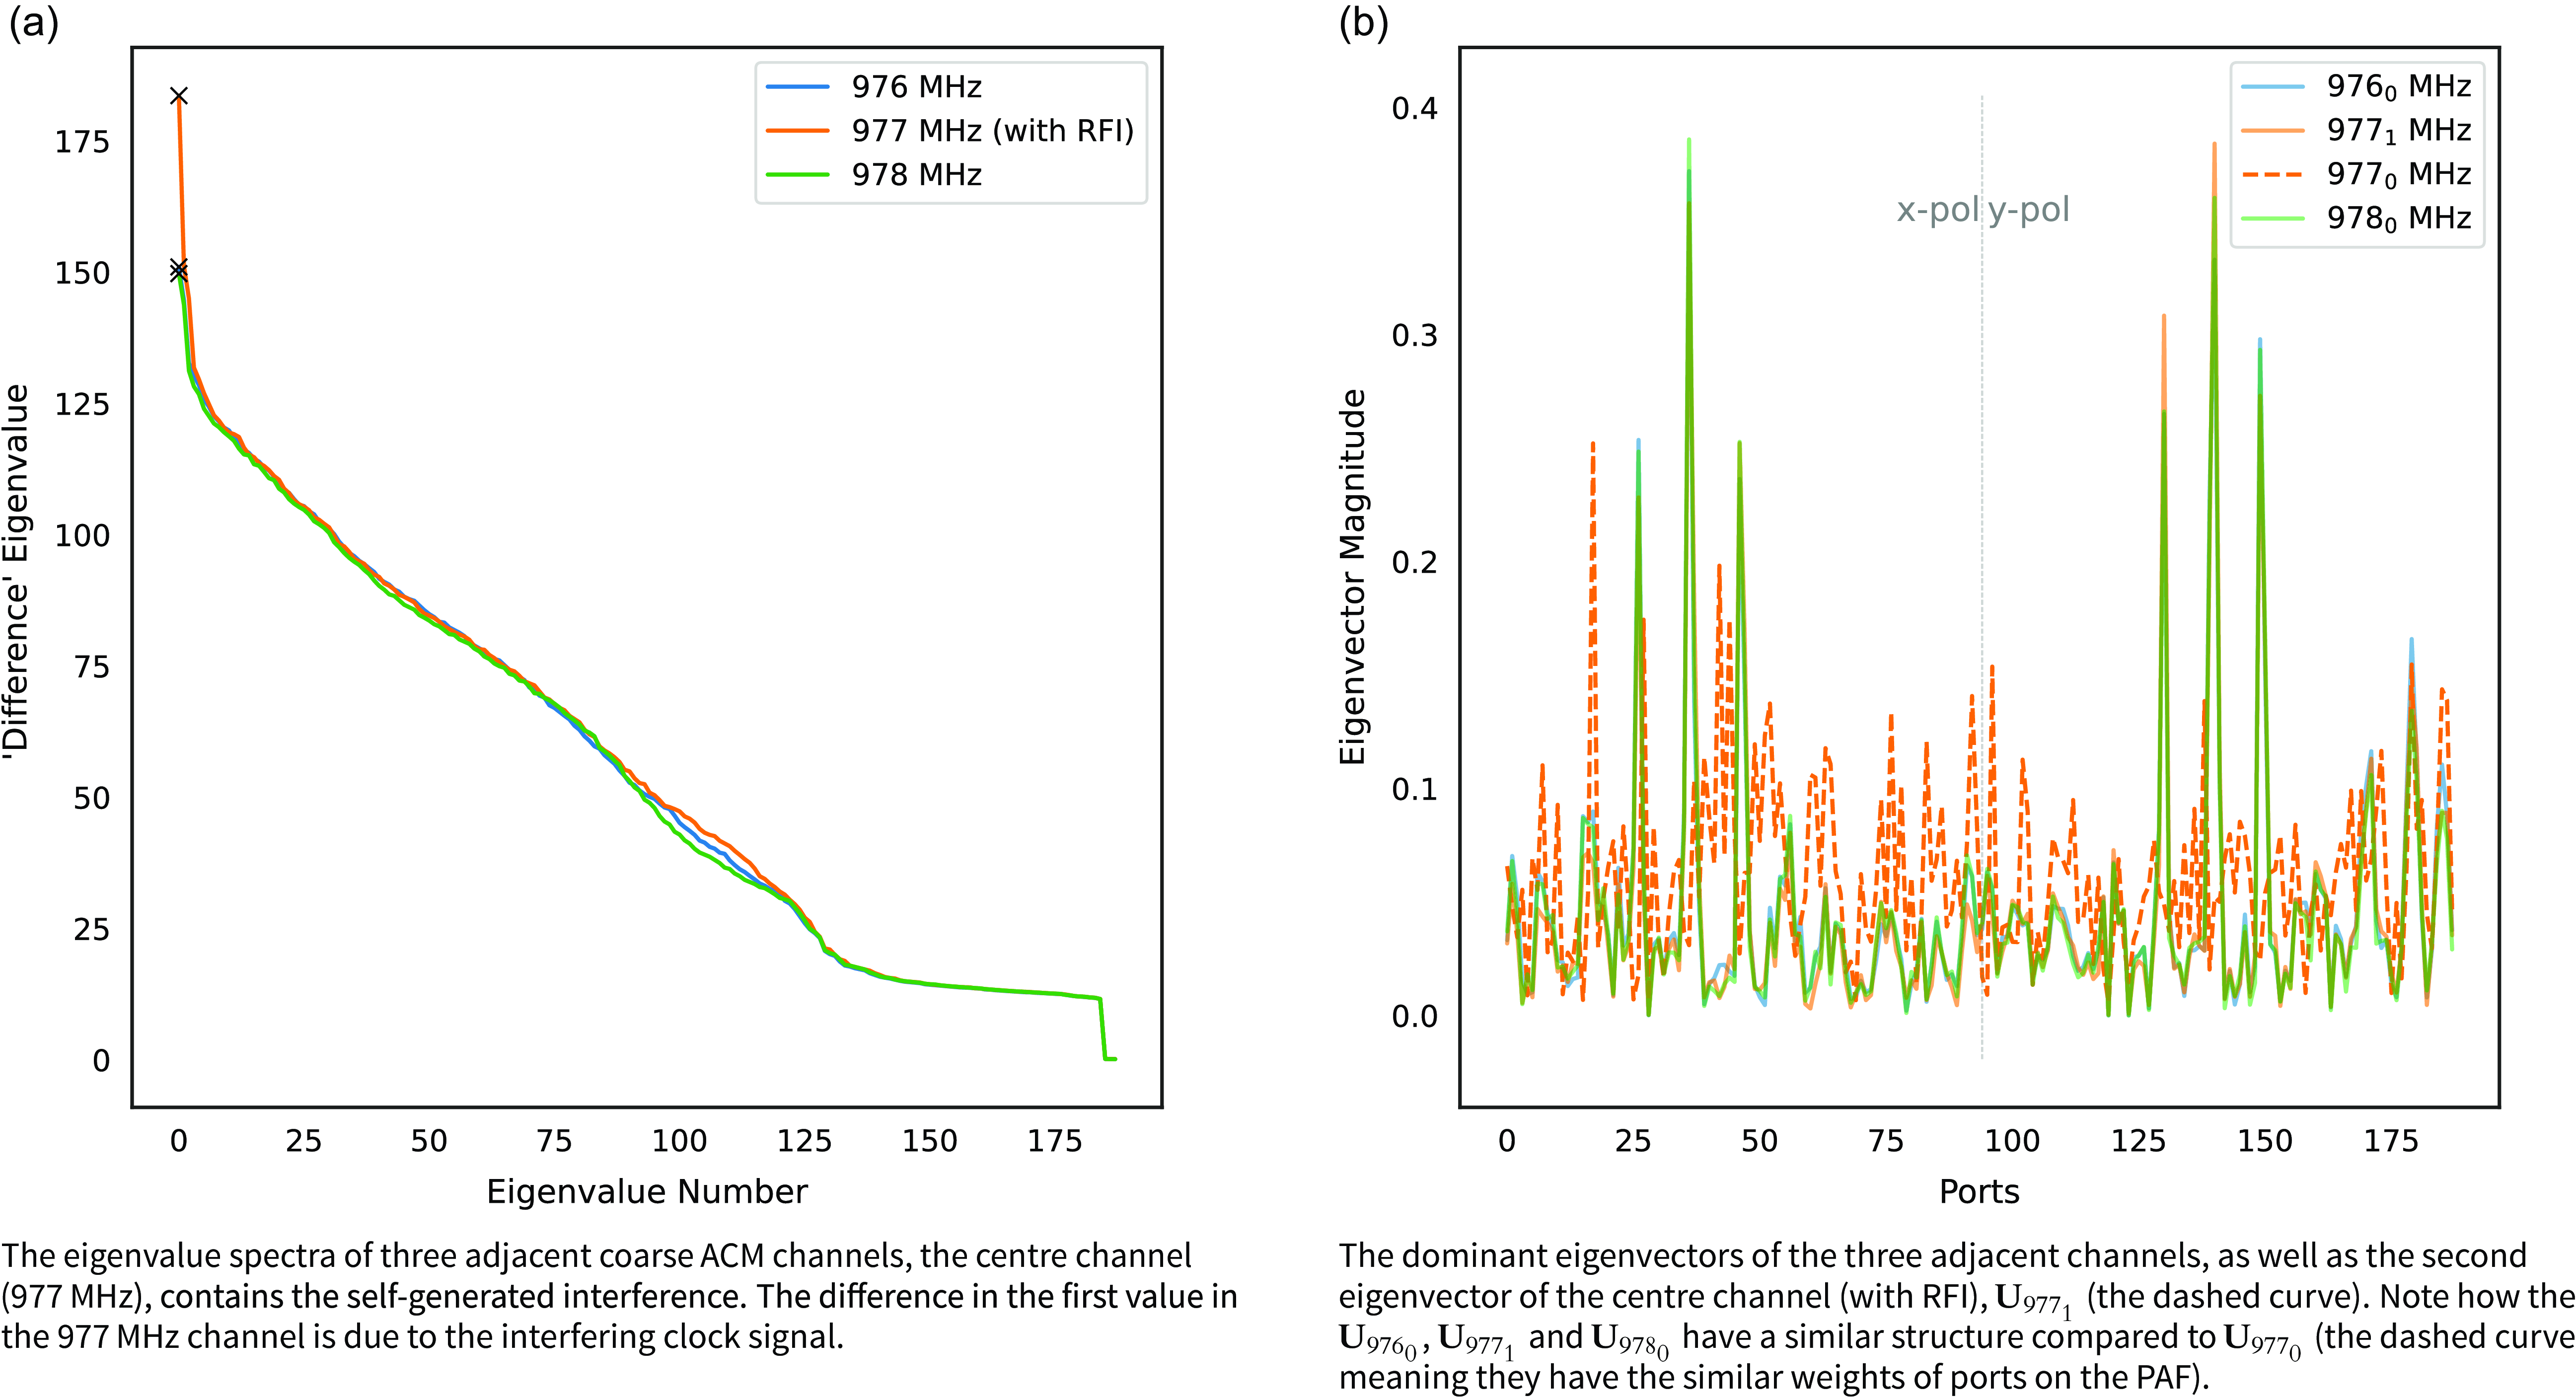
Fig. 4 shows the X and Y polarisation beamformed response in the direction $-2.4^\circ$
(black vertical dashed line), before and after mitigation using a measured RFI spatial signature. The rows show the linear gain, gain in decibels and gain (in decibels) with respect to the reference (unmitigated) to highlight differences in maximum gain of the main beam.
$-2.4^\circ$
(black vertical dashed line), before and after mitigation using a measured RFI spatial signature. The rows show the linear gain, gain in decibels and gain (in decibels) with respect to the reference (unmitigated) to highlight differences in maximum gain of the main beam.
After mitigation, variations to the beam patterns were observed mostly in the outer side lobes (starting at the second null). The bottom panel of Fig. 4 shows differences in the main beam are reduced when using oblique projection. Two instances of the self-generated interferer $\mathbf{a}_{\text{RFI}}$
were considered in the model (Appendix A); a uniform amplitude arriving at all ports with and without randomised delay/phase. That is all ports with different delay (randomised) and all ports with the same (aligned) phase, respectively. It was found that distortions to the beam were reduced when the phase of the generated signal was randomised. The estimated RFI spatial signature in Fig. 4 is consistent with a clock signal arriving at the PAF ports with randomised phase due to differing delays in the signal path of each port. Using this property, we can start to preselect RFI, based on its phase as being a suitable candidate for subspace projection RFI mitigation. Similarly, for a one-dimensional RFI subspace
$\mathbf{a}_{\text{RFI}}$
were considered in the model (Appendix A); a uniform amplitude arriving at all ports with and without randomised delay/phase. That is all ports with different delay (randomised) and all ports with the same (aligned) phase, respectively. It was found that distortions to the beam were reduced when the phase of the generated signal was randomised. The estimated RFI spatial signature in Fig. 4 is consistent with a clock signal arriving at the PAF ports with randomised phase due to differing delays in the signal path of each port. Using this property, we can start to preselect RFI, based on its phase as being a suitable candidate for subspace projection RFI mitigation. Similarly, for a one-dimensional RFI subspace $\mathbf{u}_{\text{RFI}}$
the correlation
$\mathbf{u}_{\text{RFI}}$
the correlation $\rho$
, between the estimated RFI and beam weights, given by their dot product
$\rho$
, between the estimated RFI and beam weights, given by their dot product
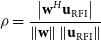 \begin{equation} \rho = \frac{\left| \mathbf{w}^H\mathbf{u}_{\text{RFI}} \right|}{ \left\lVert\mathbf{w}\right\rVert \left\lVert\mathbf{u}_{\text{RFI}}\right\rVert}\end{equation}
can be used to estimate the performance impact of the orthogonal and oblique projections as given by Hellbourg et al. (Reference Hellbourg, Weber, Capdessus and Boonstra2012b). For oblique projection the increase in the noise power is
 \begin{equation} P_{noise} = \sigma^{2}_{n} \left( 1 - \left| \rho \right|^{2} \right)^{-1}\end{equation}
where $\sigma^{2}_{n}$
is the true noise power.
$\sigma^{2}_{n}$
is the true noise power.
Simulating changes in $T_{sys}$
requires a full simulation of the noise and mutual coupling. Without a full noise model, this paper uses CFM (maximum gain) weights in place of the maximum Signal-to-noise ratio (maxSNR) weights used in operational ASKAP beamforming. We, therefore, measure the mitigation’s effects on sensitivity using on and off-source measurements from the telescope directly.
$T_{sys}$
requires a full simulation of the noise and mutual coupling. Without a full noise model, this paper uses CFM (maximum gain) weights in place of the maximum Signal-to-noise ratio (maxSNR) weights used in operational ASKAP beamforming. We, therefore, measure the mitigation’s effects on sensitivity using on and off-source measurements from the telescope directly.
4. Measured performance on ASKAP
We conducted three experiments to assess the effects of spatial nulling via PAF beamforming on astronomical figures of merit. First, we conducted offline mitigation and calculated the suppression and sensitivity. The second experiment was conducted in real-time using on and off-source measurements whilst observing Virgo A using a single ASKAP antenna with and then without mitigation. We measured suppression limited by the noise floor and a beam equivalent system-temperature-on-efficiency $T_{\text{sys}}/\eta$
across eight beams via the Y-factor ratio of beamformed power between on and off-source pointings.
$T_{\text{sys}}/\eta$
across eight beams via the Y-factor ratio of beamformed power between on and off-source pointings.
Finally, we performed simultaneous measurements across the entire array, using pairs of beams in the same direction. Each beam pair comprises one beam with oblique projection and the other using maxSNR weights. We simultaneously measure the SEFD and perform holography on both mitigated and unmitigated beams to isolate changes due to the mitigation from other variations. This final experiment uses all antennas and a set of 36 beams to quantify the impact on telescope performance of mitigating the narrowband self-generated signal during operational observing modes.
4.1. Implementation
Eigenvalue decomposition of the ACM is performed to isolate the one-dimensional spatial signature of the self-generated interferer via the dominant eigenvalue. RFI moving relative to the telescope would have a higher dimensional subspace Hellbourg (Reference Hellbourg2015), Lourenço & Chippendale in prep. Looking at the eigenvalue spectra (Fig. 5a) of three adjacent channels, we can see that when the self-generated RFI is powerful enough, the dominant eigenvalue of the centre channel is easily identifiable – the max value of the 977 MHz (orange) curve is higher – compared to the adjacent coarse 1 MHz channels.
When comparing the dominant eigenvectors (Fig, 5b) of the same three adjacent channels (subscript $[.]_{0}$
), as well as the second eigenvector (subscript
$[.]_{0}$
), as well as the second eigenvector (subscript $[.]_{1}$
) of the centre 977 MHz channel (with RFI), we see that
$[.]_{1}$
) of the centre 977 MHz channel (with RFI), we see that $\mathbf{U}_{976_{0}}$
,
$\mathbf{U}_{976_{0}}$
, $\mathbf{U}_{977_{1}}$
and
$\mathbf{U}_{977_{1}}$
and $\mathbf{U}_{978_{0}}$
have a similar structure compared to
$\mathbf{U}_{978_{0}}$
have a similar structure compared to $\mathbf{U}_{977_{0}}$
(the dashed curve).
$\mathbf{U}_{977_{0}}$
(the dashed curve). $\mathbf{U}_{976_{0}}$
, the dashed curve, is our 1-D RFI spatial signature (
$\mathbf{U}_{976_{0}}$
, the dashed curve, is our 1-D RFI spatial signature ( $\mathbf{a}_{\text{RFI}}$
). The other curves are representative of our SOI spatial signature (
$\mathbf{a}_{\text{RFI}}$
). The other curves are representative of our SOI spatial signature ( $\mathbf{a}_{\text{SOI}})$
. This is only the case here because the ACM is an on-source beamforming ACM, so the Sun is in the field-of-view, which gives the structure in the solid curves, dominated by six highly weighted ports (i.e. the ports onto which the Sun’s energy is focused by the reflector).
$\mathbf{a}_{\text{SOI}})$
. This is only the case here because the ACM is an on-source beamforming ACM, so the Sun is in the field-of-view, which gives the structure in the solid curves, dominated by six highly weighted ports (i.e. the ports onto which the Sun’s energy is focused by the reflector).
ASKAP calculates a weights steering vector per polarisation. Implementation of these algorithms, therefore, requires we calculate ${\mathbf{a}_{\mathbf{x}}}_{\text{RFI}}$
and
${\mathbf{a}_{\mathbf{x}}}_{\text{RFI}}$
and ${\mathbf{a}_{\mathbf{y}}}_{\text{RFI}}$
separately to be consistent with ASKAPs existing codebase. We isolate two sub-ACMs of size
${\mathbf{a}_{\mathbf{y}}}_{\text{RFI}}$
separately to be consistent with ASKAPs existing codebase. We isolate two sub-ACMs of size $94\times94$
along the diagonal and perform the eigenvalue decomposition on those matrices to obtain
$94\times94$
along the diagonal and perform the eigenvalue decomposition on those matrices to obtain ${\mathbf{a}_{\mathbf{x}}}_{\text{RFI}}$
(first sub-ACMs) and
${\mathbf{a}_{\mathbf{x}}}_{\text{RFI}}$
(first sub-ACMs) and ${\mathbf{a}_{\mathbf{y}}}_{\text{RFI}}$
(second sub-ACMs). That is quadrants I and III of the ACM moving clockwise from the top left. In other words the first 94 ports of the ASKAP PAF (and weights) correspond to the x-polarisation and ports 95 through 188 correspond to the y-polarisation (as illustrated in Fig. 5b).
${\mathbf{a}_{\mathbf{y}}}_{\text{RFI}}$
(second sub-ACMs). That is quadrants I and III of the ACM moving clockwise from the top left. In other words the first 94 ports of the ASKAP PAF (and weights) correspond to the x-polarisation and ports 95 through 188 correspond to the y-polarisation (as illustrated in Fig. 5b).
Furthermore, ASKAP varies the number of ports used in beamforming. Typically for thirty-six beams, only sixty ports per ASKAP antenna are used. The number of ports used increases as the number of beams decreases (Hotan et al. Reference Hotan2021). We compared the effects of using all ports vs sixty ports in simulation and found the results to be comparable.
Finally, in some cases, when the interference-to-noise power is low, the difference observed in Fig. 5a is not substantial enough to provide an accurate estimation of $\mathbf{a}_{RFI}$
due to the low power nature of the signal. To overcome this, the ACMs of the adjacent channels were averaged and subtracted from the centre channel to isolate the spatial signature more easily. The ACM,
$\mathbf{a}_{RFI}$
due to the low power nature of the signal. To overcome this, the ACMs of the adjacent channels were averaged and subtracted from the centre channel to isolate the spatial signature more easily. The ACM, $\mathbf{R}$
in the eigenvalue decomposition in Equation (4)
$\mathbf{R}$
in the eigenvalue decomposition in Equation (4)
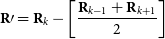 \begin{equation} \mathbf{R}\prime = \mathbf{R}_k - \left[\frac{\mathbf{R}_{k-1} + \mathbf{R}_{k+1}}{2}\right]\end{equation}
is modified to estimate the RFI spatial signature and the results shown in Fig. 6.
This would not be necessary for typical RFI which is much stronger than our test signal, however, a useful result nevertheless for identifying and mitigating weak sources of RFI. Comparing both methods for calculating $\mathbf{a}_{RFI}$
yielded similar (and parallel determined by the dot product) vectors.
$\mathbf{a}_{RFI}$
yielded similar (and parallel determined by the dot product) vectors.
4.2. Impact on suppression, sensitivity, and beam shape
In the first experiment, the mitigation is performed offline. We use ACMs (containing the unwanted signal) and beamformed maxSNR weights from one ASKAP antenna (ak18) to determine the calculated suppression across beams. Fig. 7 shows a maximum expected suppression of approximately 277 dB across all thirty-six beams, consistent with the model.
When the interference-to-noise power is low, by subtracting the mean of the adjacent channels it is easier to isolate an RFI- affected channel in the eigenvalue spectra.
Calculated suppression of the unwanted signal across beams is approximately 277 dB.
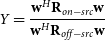
Using on and off-source ACMs the Y-factor (on-dish noise performance) can additionally be calculated (Chippendale, Hayman, & Hay Reference Chippendale, Hayman and Hay2014):
 \begin{equation} Y = \frac{\mathbf{w}^H\mathbf{R}_{on-src}\mathbf{w}}{\mathbf{w}^H\mathbf{R}_{off-src}\mathbf{w}}\end{equation}
That is, the power ratio between measurements of a known astronomical source and nearby empty sky, respectively. The off-source measurements are routinely obtained at the beginning of a beamformer weight calibration observation and stored in the resulting ACM file. Across beams, similar results in terms of suppression were obtained using both projections, as expected. Using offline mitigation we measured a maximum increase to the Y-factor of 17% and 15% and an average increase of 3% and 5% for the x and y polarisations, respectively. Up to 6% increase could be expected from the calculated value using Equation (13). Currently, on ASKAP, as the number of beams increases to the complete set of 36 dual-polarisation beams, the maximum number of ports used to form each beam reduces from 192 to 60 (Hotan et al. Reference Hotan2021). We assessed the expected increase in noise power using only 60 ports in the above calculation, and recall are only using the sub-ACMs to estimate ${\mathbf{a}_{\mathbf{x}}}_{\text{RFI}}$
and
${\mathbf{a}_{\mathbf{x}}}_{\text{RFI}}$
and ${\mathbf{a}_{\mathbf{y}}}_{\text{RFI}}$
. We use the indices of the same 60 ports from the beam weights to mask the RFI spatial signatures and then calculate the correlation coefficient.
${\mathbf{a}_{\mathbf{y}}}_{\text{RFI}}$
. We use the indices of the same 60 ports from the beam weights to mask the RFI spatial signatures and then calculate the correlation coefficient.
However, the expected noise power increase is much smaller when calculating the correlation coefficient with an RFI spatial signature estimated from the full ACM and using all ports with the x and y maxSNR weights, 0.2% and 0.4%, respectively, on average. This result shows that the mitigation works much better for a beamformer that can work over all PAF ports of all polarisations and suggests how we could improve the mitigation on ASKAP in the future.
The second experiment conducted on 20 June 2022 captures on and off-source measurements using one antenna (ak18 again). The mitigation, using the oblique projection, was performed whilst observing a flux reference, Virgo A, assuming the flux model of Ott et al. (Reference Ott, Witzel, Quirrenbach and Krichbaum1994). Eight beams were formed. First, the antenna was pointed off-source $-9^\circ$
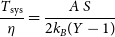
offset in declination, each beam was then subsequently directed toward Virgo A in turn, and fine filter bank data were recorded at 18.5 kHz resolution. We repeated the experiment with mitigation turned off for comparison. The sensitivity can be determined via the Y-Factor by calculating the beam equivalent system-temperature-on-efficiency as in Chippendale et al. (Reference Chippendale2016) and Chippendale et al. (Reference Chippendale2015), Hayman et al. (Reference Hayman, Bird, Esselle and Hall2010).
$-9^\circ$
offset in declination, each beam was then subsequently directed toward Virgo A in turn, and fine filter bank data were recorded at 18.5 kHz resolution. We repeated the experiment with mitigation turned off for comparison. The sensitivity can be determined via the Y-Factor by calculating the beam equivalent system-temperature-on-efficiency as in Chippendale et al. (Reference Chippendale2016) and Chippendale et al. (Reference Chippendale2015), Hayman et al. (Reference Hayman, Bird, Esselle and Hall2010).
 \begin{equation} \frac{T_{\text{sys}}}{\eta} = \frac{A~S}{2k_B(Y-1)}\end{equation}
where A is the area of the dish, S is the known flux of the source, and $k_{B}$
is Boltzmann’s constant.
$k_{B}$
is Boltzmann’s constant.
Sensitivity (System-temperature-over-efficiency) with mitigation, shows x-polarisation on the top and y-polarisation on the bottom across eight different beams. $T_{\text{sys}}/\eta$
increases at the channel updated using oblique projection compared to maximum signal-to-noise ratio weights (seen in adjacent channels). Beamforming and sensitivity measurements were made using Virgo A and an off-source measurement
$T_{\text{sys}}/\eta$
increases at the channel updated using oblique projection compared to maximum signal-to-noise ratio weights (seen in adjacent channels). Beamforming and sensitivity measurements were made using Virgo A and an off-source measurement $-9^\circ$
offset in declination.
$-9^\circ$
offset in declination.
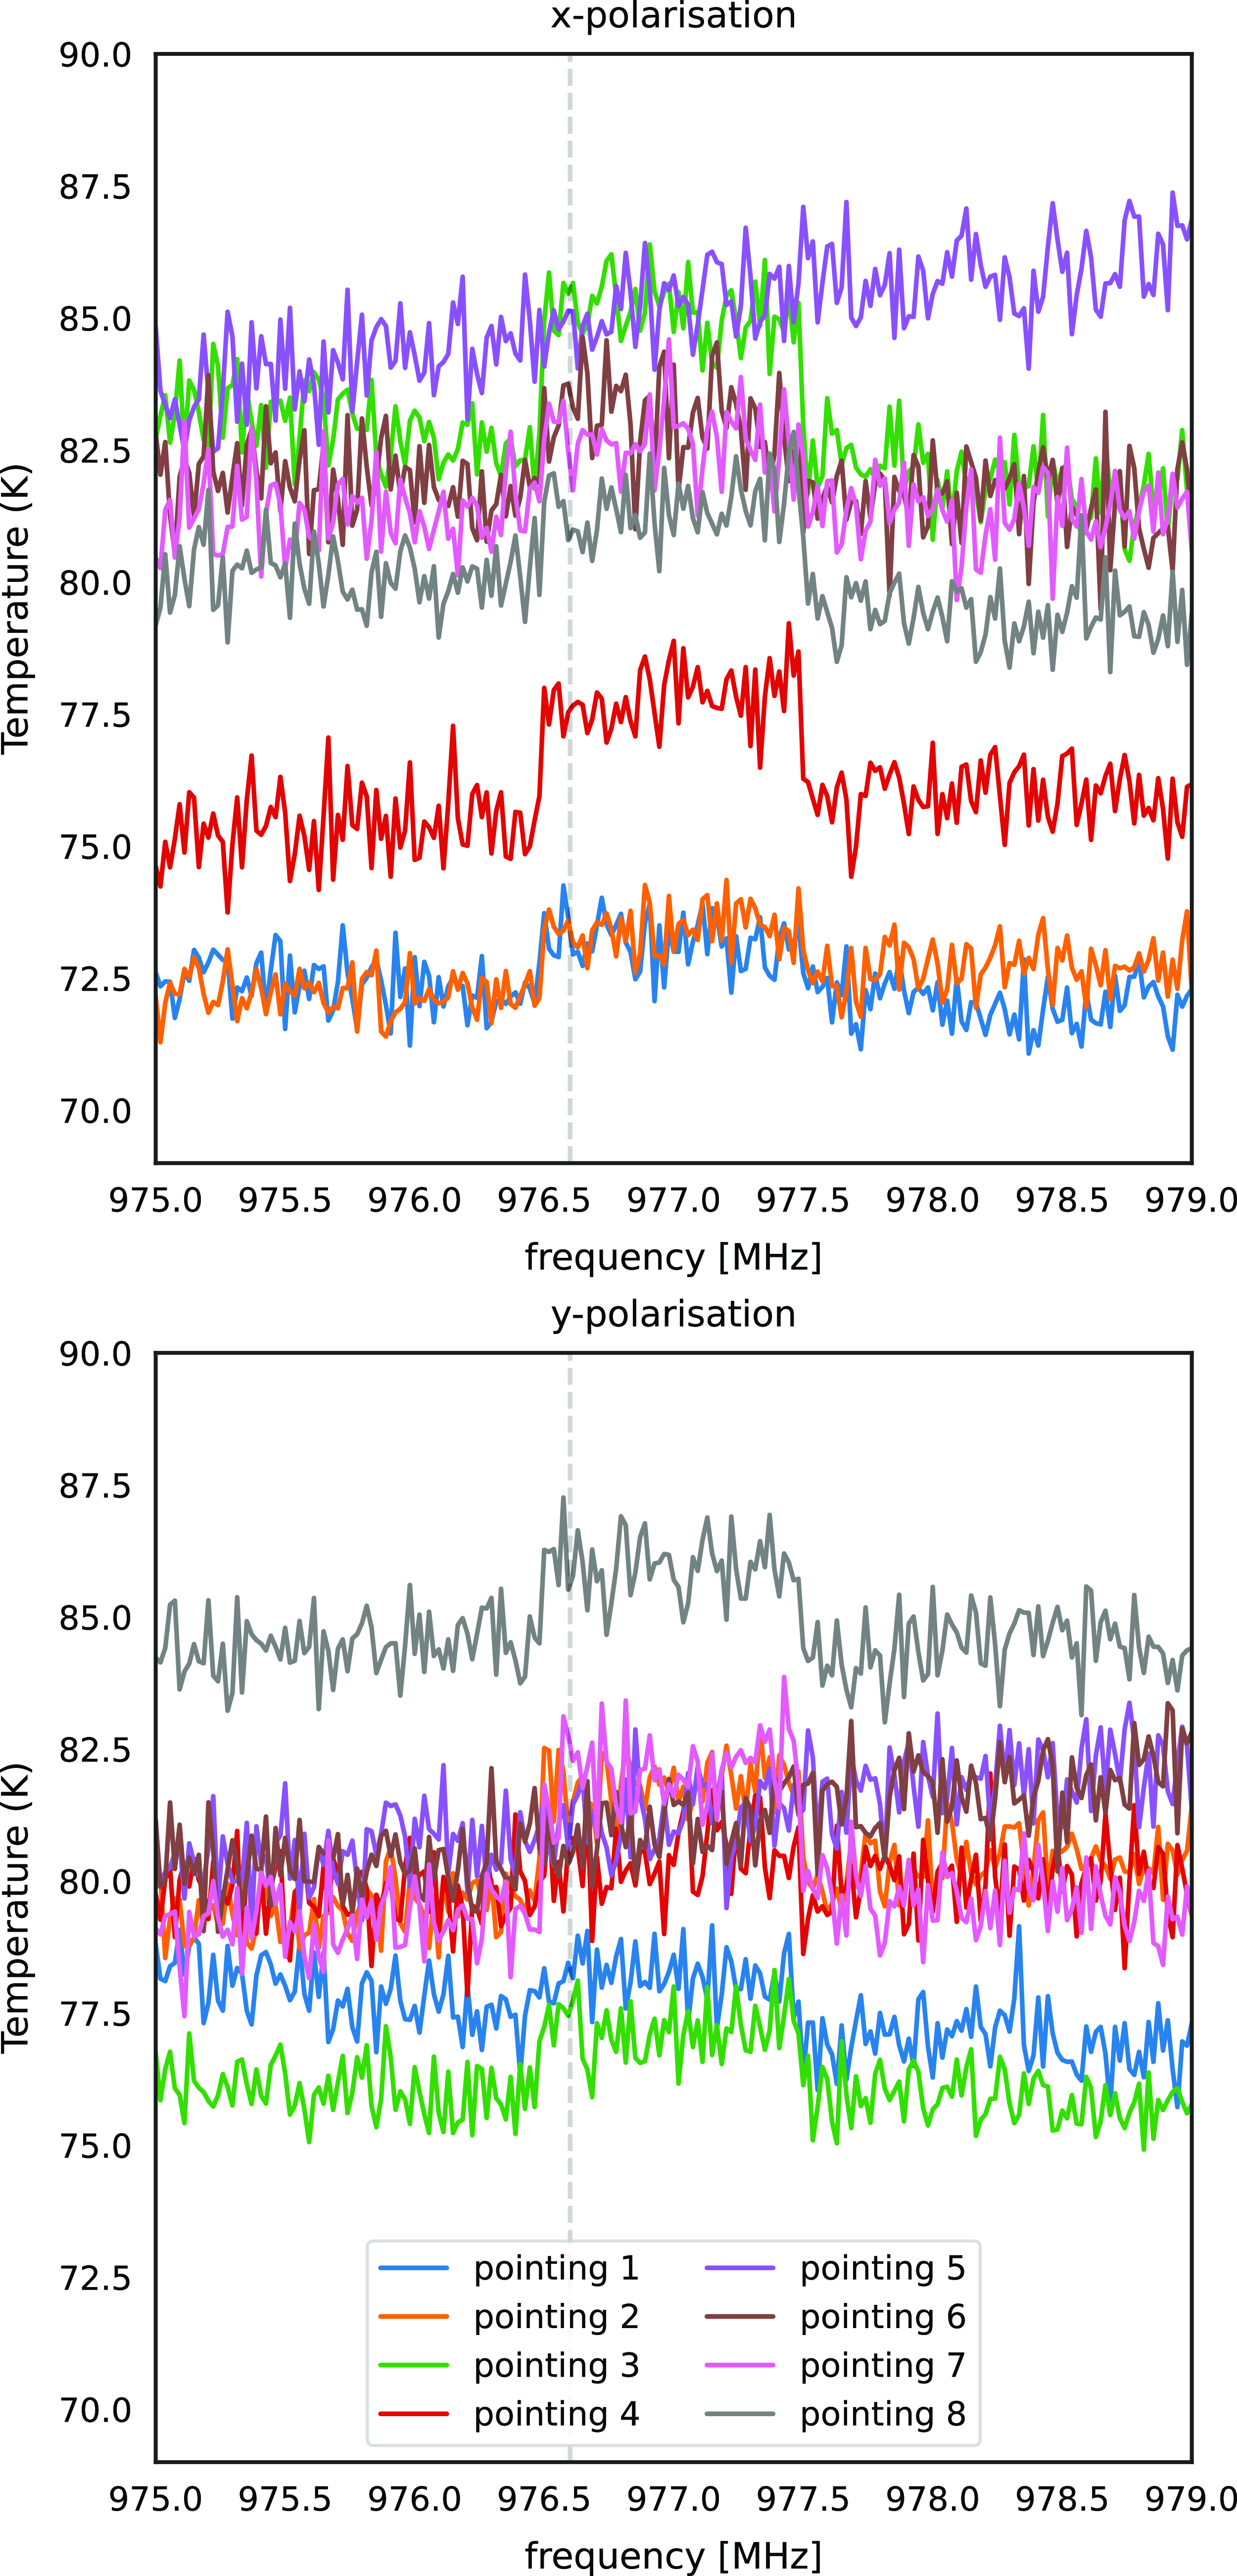
Fig. 8 shows the $T_{\text{sys}}/\eta$
of eight x and y polarisation beams across an approximately 3 MHz frequency range centred at the 1 MHz channel containing the unwanted signal. The dashed vertical line demarcates the frequency of the mitigated interfering clock signal. There is a mean
$T_{\text{sys}}/\eta$
of eight x and y polarisation beams across an approximately 3 MHz frequency range centred at the 1 MHz channel containing the unwanted signal. The dashed vertical line demarcates the frequency of the mitigated interfering clock signal. There is a mean $T_{\text{sys}}/\eta$
of 79.2
$T_{\text{sys}}/\eta$
of 79.2 $\pm$
3.7 K, 80.6
$\pm$
3.7 K, 80.6 $\pm$
3.8 K, and 79.5
$\pm$
3.8 K, and 79.5 $\pm$
3 K for the 976 MHz, 977 and 978 MHz channels respectively across all beams. All the mitigated channels have a higher
$\pm$
3 K for the 976 MHz, 977 and 978 MHz channels respectively across all beams. All the mitigated channels have a higher $T_{\text{sys}}/\eta$
, except beam 5, due to the upward slope in the curve. In the 1 MHz channel containing the unwanted signal, across all beams, there is a maximum increase of 3.31% or 2.66 K in
$T_{\text{sys}}/\eta$
, except beam 5, due to the upward slope in the curve. In the 1 MHz channel containing the unwanted signal, across all beams, there is a maximum increase of 3.31% or 2.66 K in $T_{\text{sys}}/\eta$
and a mean increase of 1.59% or 1.26 K. Note that these increases are smaller than the differences between beams. A mean increase of 1% based on the correlations was expected (Equation 13). The rest of the band is consistent with Chippendale et al. (Reference Chippendale2015). One way to understand the increase in
$T_{\text{sys}}/\eta$
and a mean increase of 1.59% or 1.26 K. Note that these increases are smaller than the differences between beams. A mean increase of 1% based on the correlations was expected (Equation 13). The rest of the band is consistent with Chippendale et al. (Reference Chippendale2015). One way to understand the increase in $T_{\text{sys}}/\eta$
is that the original weights are calculated to yield a maximum signal-to-noise ratio (the lowest
$T_{\text{sys}}/\eta$
is that the original weights are calculated to yield a maximum signal-to-noise ratio (the lowest $T_{\text{sys}}/\eta$
); any deviation from those weights will by definition be less than the maximum.
$T_{\text{sys}}/\eta$
); any deviation from those weights will by definition be less than the maximum.
Suppression using Equation (11) is not limited by the noise floor. From this experiment, we were able to determine a noise floor limited suppression of 31 dB, see Fig. 2. Importantly, we have regained a channel that is otherwise always flagged (Lourenço et al. Reference Lourenço2024) and ultimately discarded.
Recall we are applying the mitigation once at the start of an observation because, in this case, the 1-D RFI spatial signature ( $\mathbf{u}$
) is unchanging during an observation. The similarity of the two signatures
$\mathbf{u}$
) is unchanging during an observation. The similarity of the two signatures $\Re\left\{\mathbf{u}_{RFI}[t1]^H \mathbf{u}_{RFI}[t2]\right\}\gt= 0.99$
, i.e. they are in the same ‘direction’ over a 7 min measurement.
$\Re\left\{\mathbf{u}_{RFI}[t1]^H \mathbf{u}_{RFI}[t2]\right\}\gt= 0.99$
, i.e. they are in the same ‘direction’ over a 7 min measurement.
4.3. Concurrent measurements with mitigation on and off
Two experiments were conducted in January 2023 to compare the effects of the projection techniques simultaneously. First measuring sensitivity across the array, we carried out a SEFD measurement whilst observing a flux reference, PKS B1934–638. Then we made a holography measurement to determine changes to the beam shape.
A modified ASKAP 6 $\times$
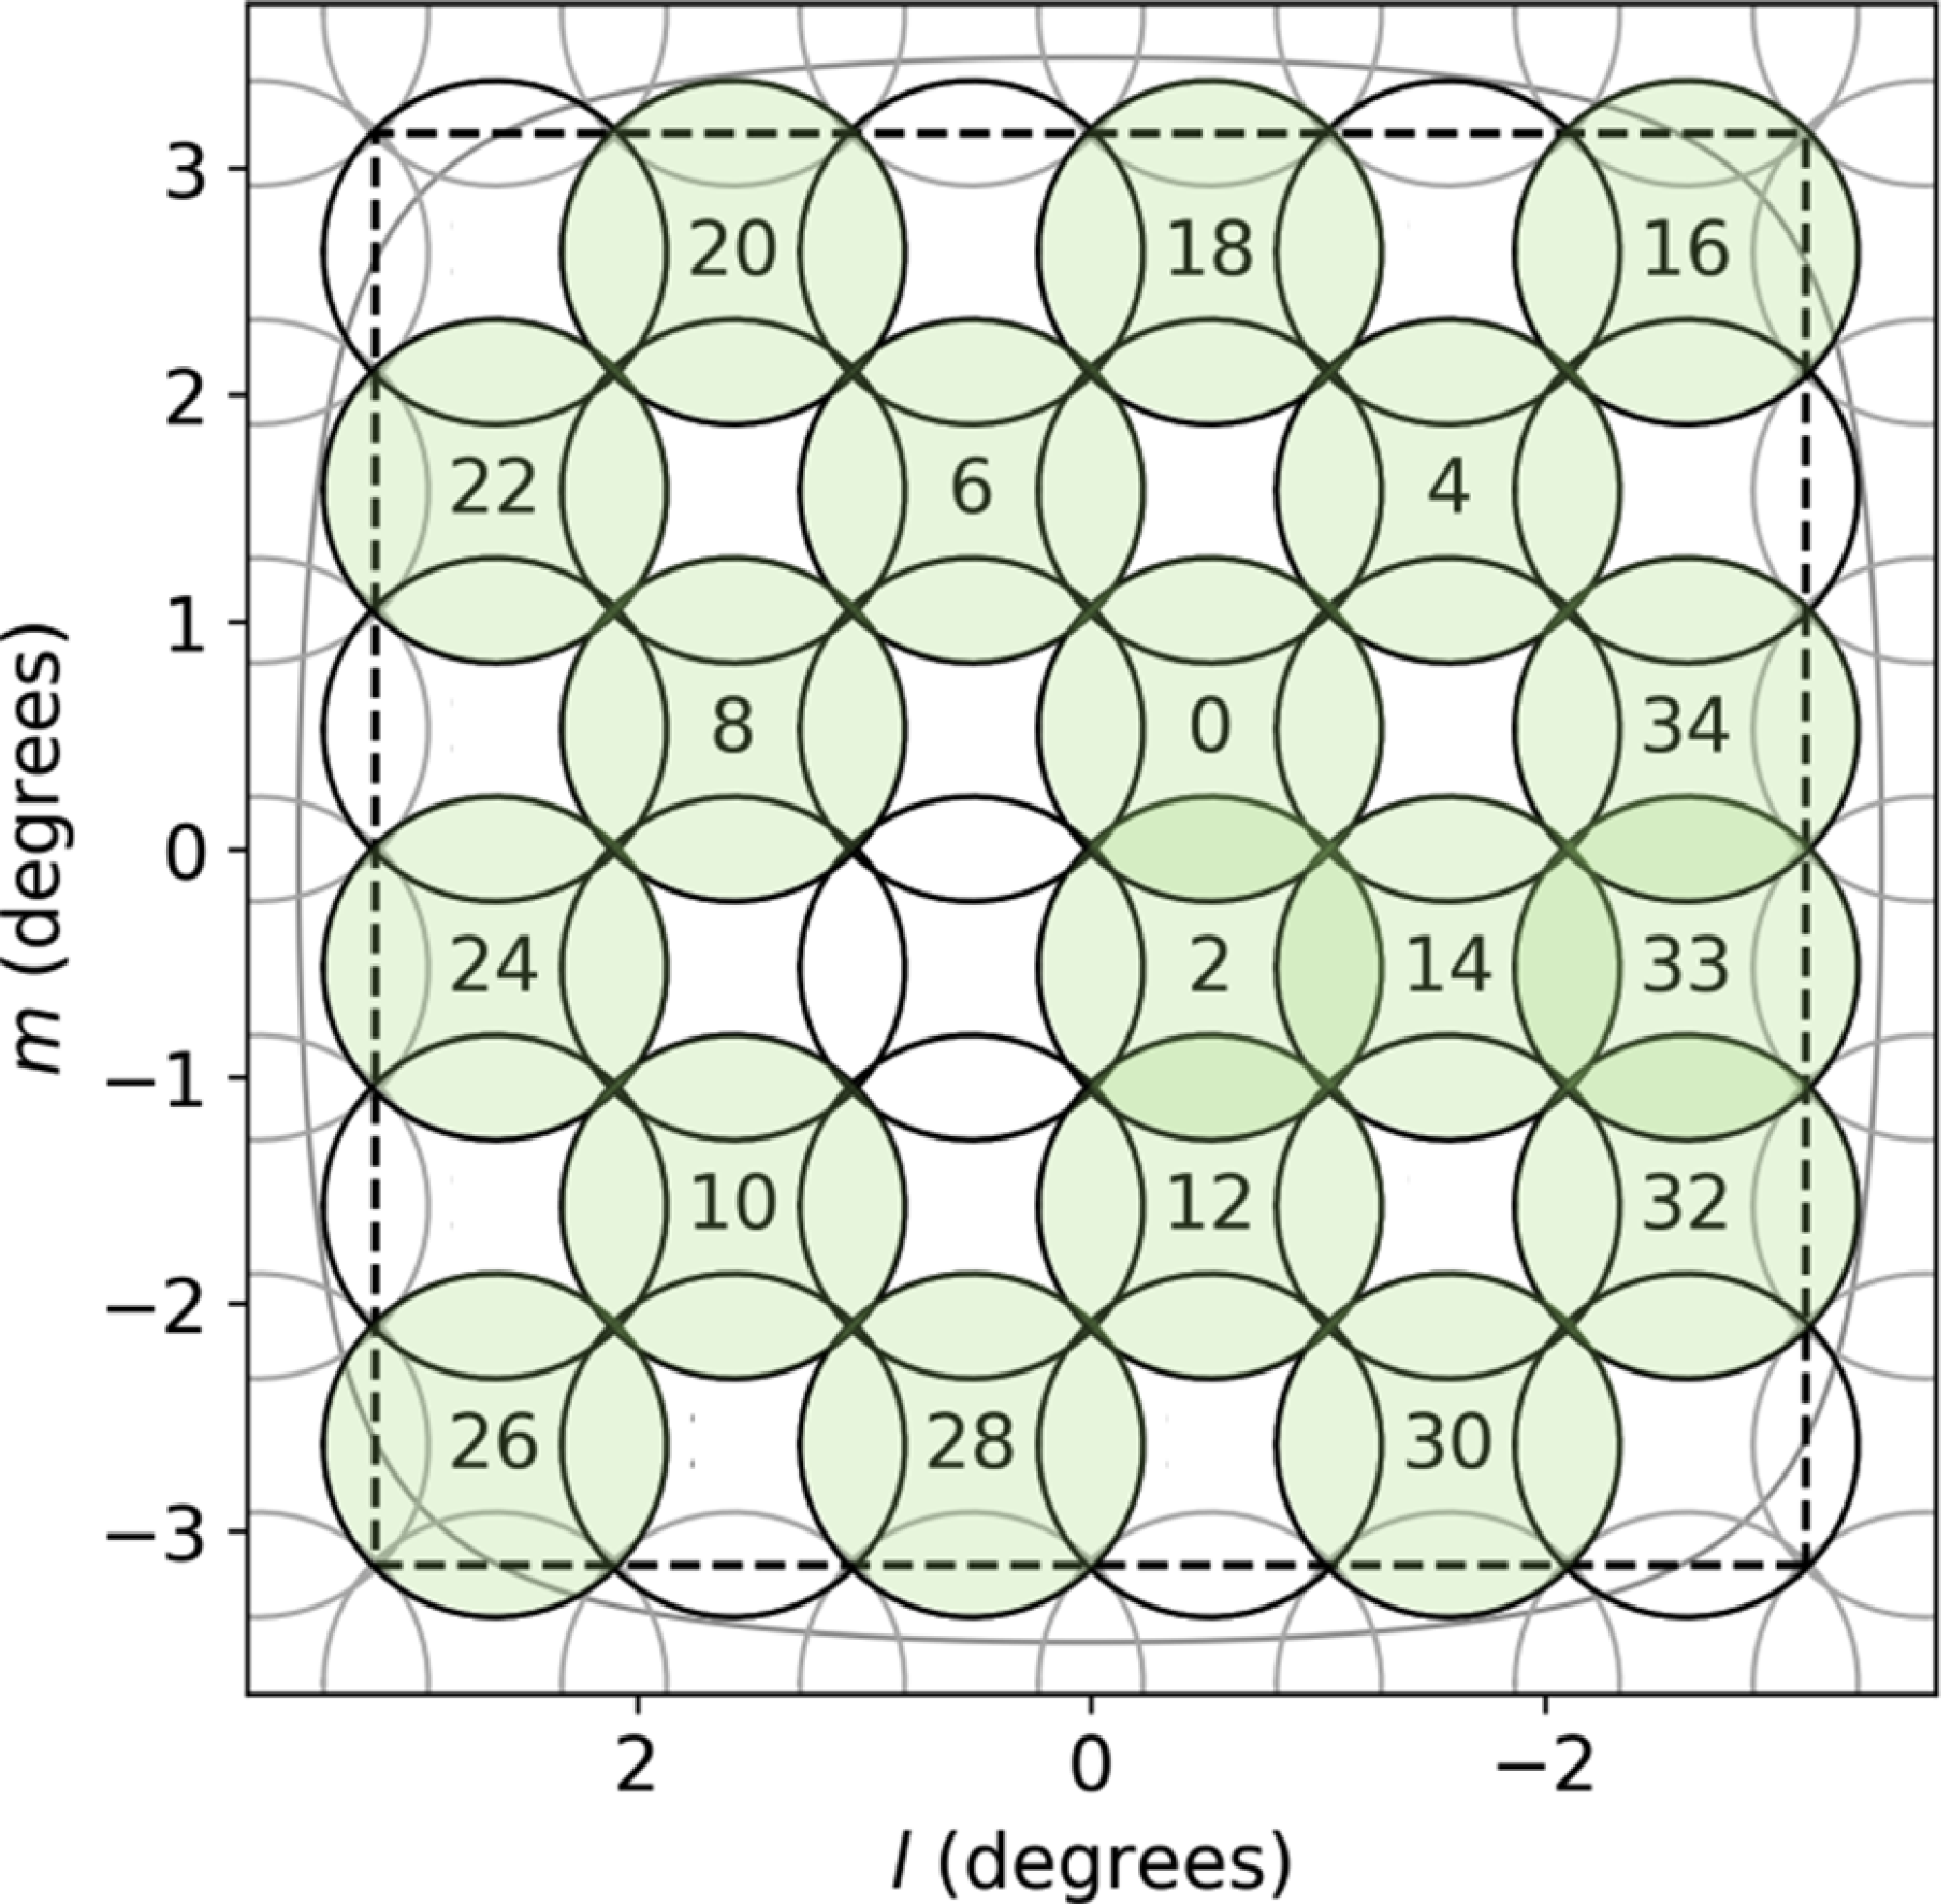
6 square close-pack beam footprint was used in both experiments. The modified footprint creates pairs of beams in the even positions (highlighted in green) of the footprint shown in Fig. 9. Thirty-six beams grouped into 18 pairs were created; odd-numbered beams used unmitigated weights, and even beams used updated weights with mitigation using oblique projection. In other words, for every beam in Fig. 9, marked in green, there is a mitigated copy in the same position labelled with the subsequent number. Simultaneously measuring beams with and without mitigation isolates changes in the SEFD and holography to the mitigation itself.
$\times$
6 square close-pack beam footprint was used in both experiments. The modified footprint creates pairs of beams in the even positions (highlighted in green) of the footprint shown in Fig. 9. Thirty-six beams grouped into 18 pairs were created; odd-numbered beams used unmitigated weights, and even beams used updated weights with mitigation using oblique projection. In other words, for every beam in Fig. 9, marked in green, there is a mitigated copy in the same position labelled with the subsequent number. Simultaneously measuring beams with and without mitigation isolates changes in the SEFD and holography to the mitigation itself.
To simultaneously compare the effects of the projection techniques on sensitivity and beam shape, experiments were conducted using a modified close-pack square $6\times6$
footprint. The modified footprint consists of two beams created at each odd position (shaded in green), the first without mitigation and the second with mitigation. Modified from Figure 2 in McConnell et al. (Reference McConnell2020).
$6\times6$
footprint. The modified footprint consists of two beams created at each odd position (shaded in green), the first without mitigation and the second with mitigation. Modified from Figure 2 in McConnell et al. (Reference McConnell2020).
SEFD measurement showing unwanted clock signal with and without mitigation (orange and blue, respectively). Similar to a single antenna across the array, mitigation introduces a reduction in sensitivity to the 1 MHz channel. This plot is averaged over all beams and all antennas.

Sensitivity across the Array
The SEFD, measured in Janskys (Jy), is given by (Hotan et al. Reference Hotan2021)
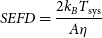 \begin{equation} SEFD = \frac{2k_BT_{\text{sys}}}{A\eta}\end{equation}
and used to characterise the sensitivity of an antenna (and receiver). We use a modification of ASKAP standard SEFD which uses the correlation coefficient (Perley Reference Perley2008) to reduce measurement noise. SEFD measurements are a good way of comparing sensitivity between telescopes because it takes into account both the receiver system temperature ( $T_{\text{sys}}$
) and the area (A). Note the
$T_{\text{sys}}$
) and the area (A). Note the $T_{\text{sys}}/\eta$
term, Equation (16), from the previous experiment. A lower SEFD value corresponds to an increased sensitivity.
$T_{\text{sys}}/\eta$
term, Equation (16), from the previous experiment. A lower SEFD value corresponds to an increased sensitivity.
Holography measurement at 977 MHz with mitigation (bottom) and without mitigation (top). Beams at this frequency are routinely corrupted by RFI but can be completely recovered using the oblique projection.

SEFD measurement per beam, annotations showing the percentage increase and the increase in Janskys in the mitigated channel in orange introduced by the mitigation. The unmitigated SEFD in blue. Each panel is averaged over all antennas.
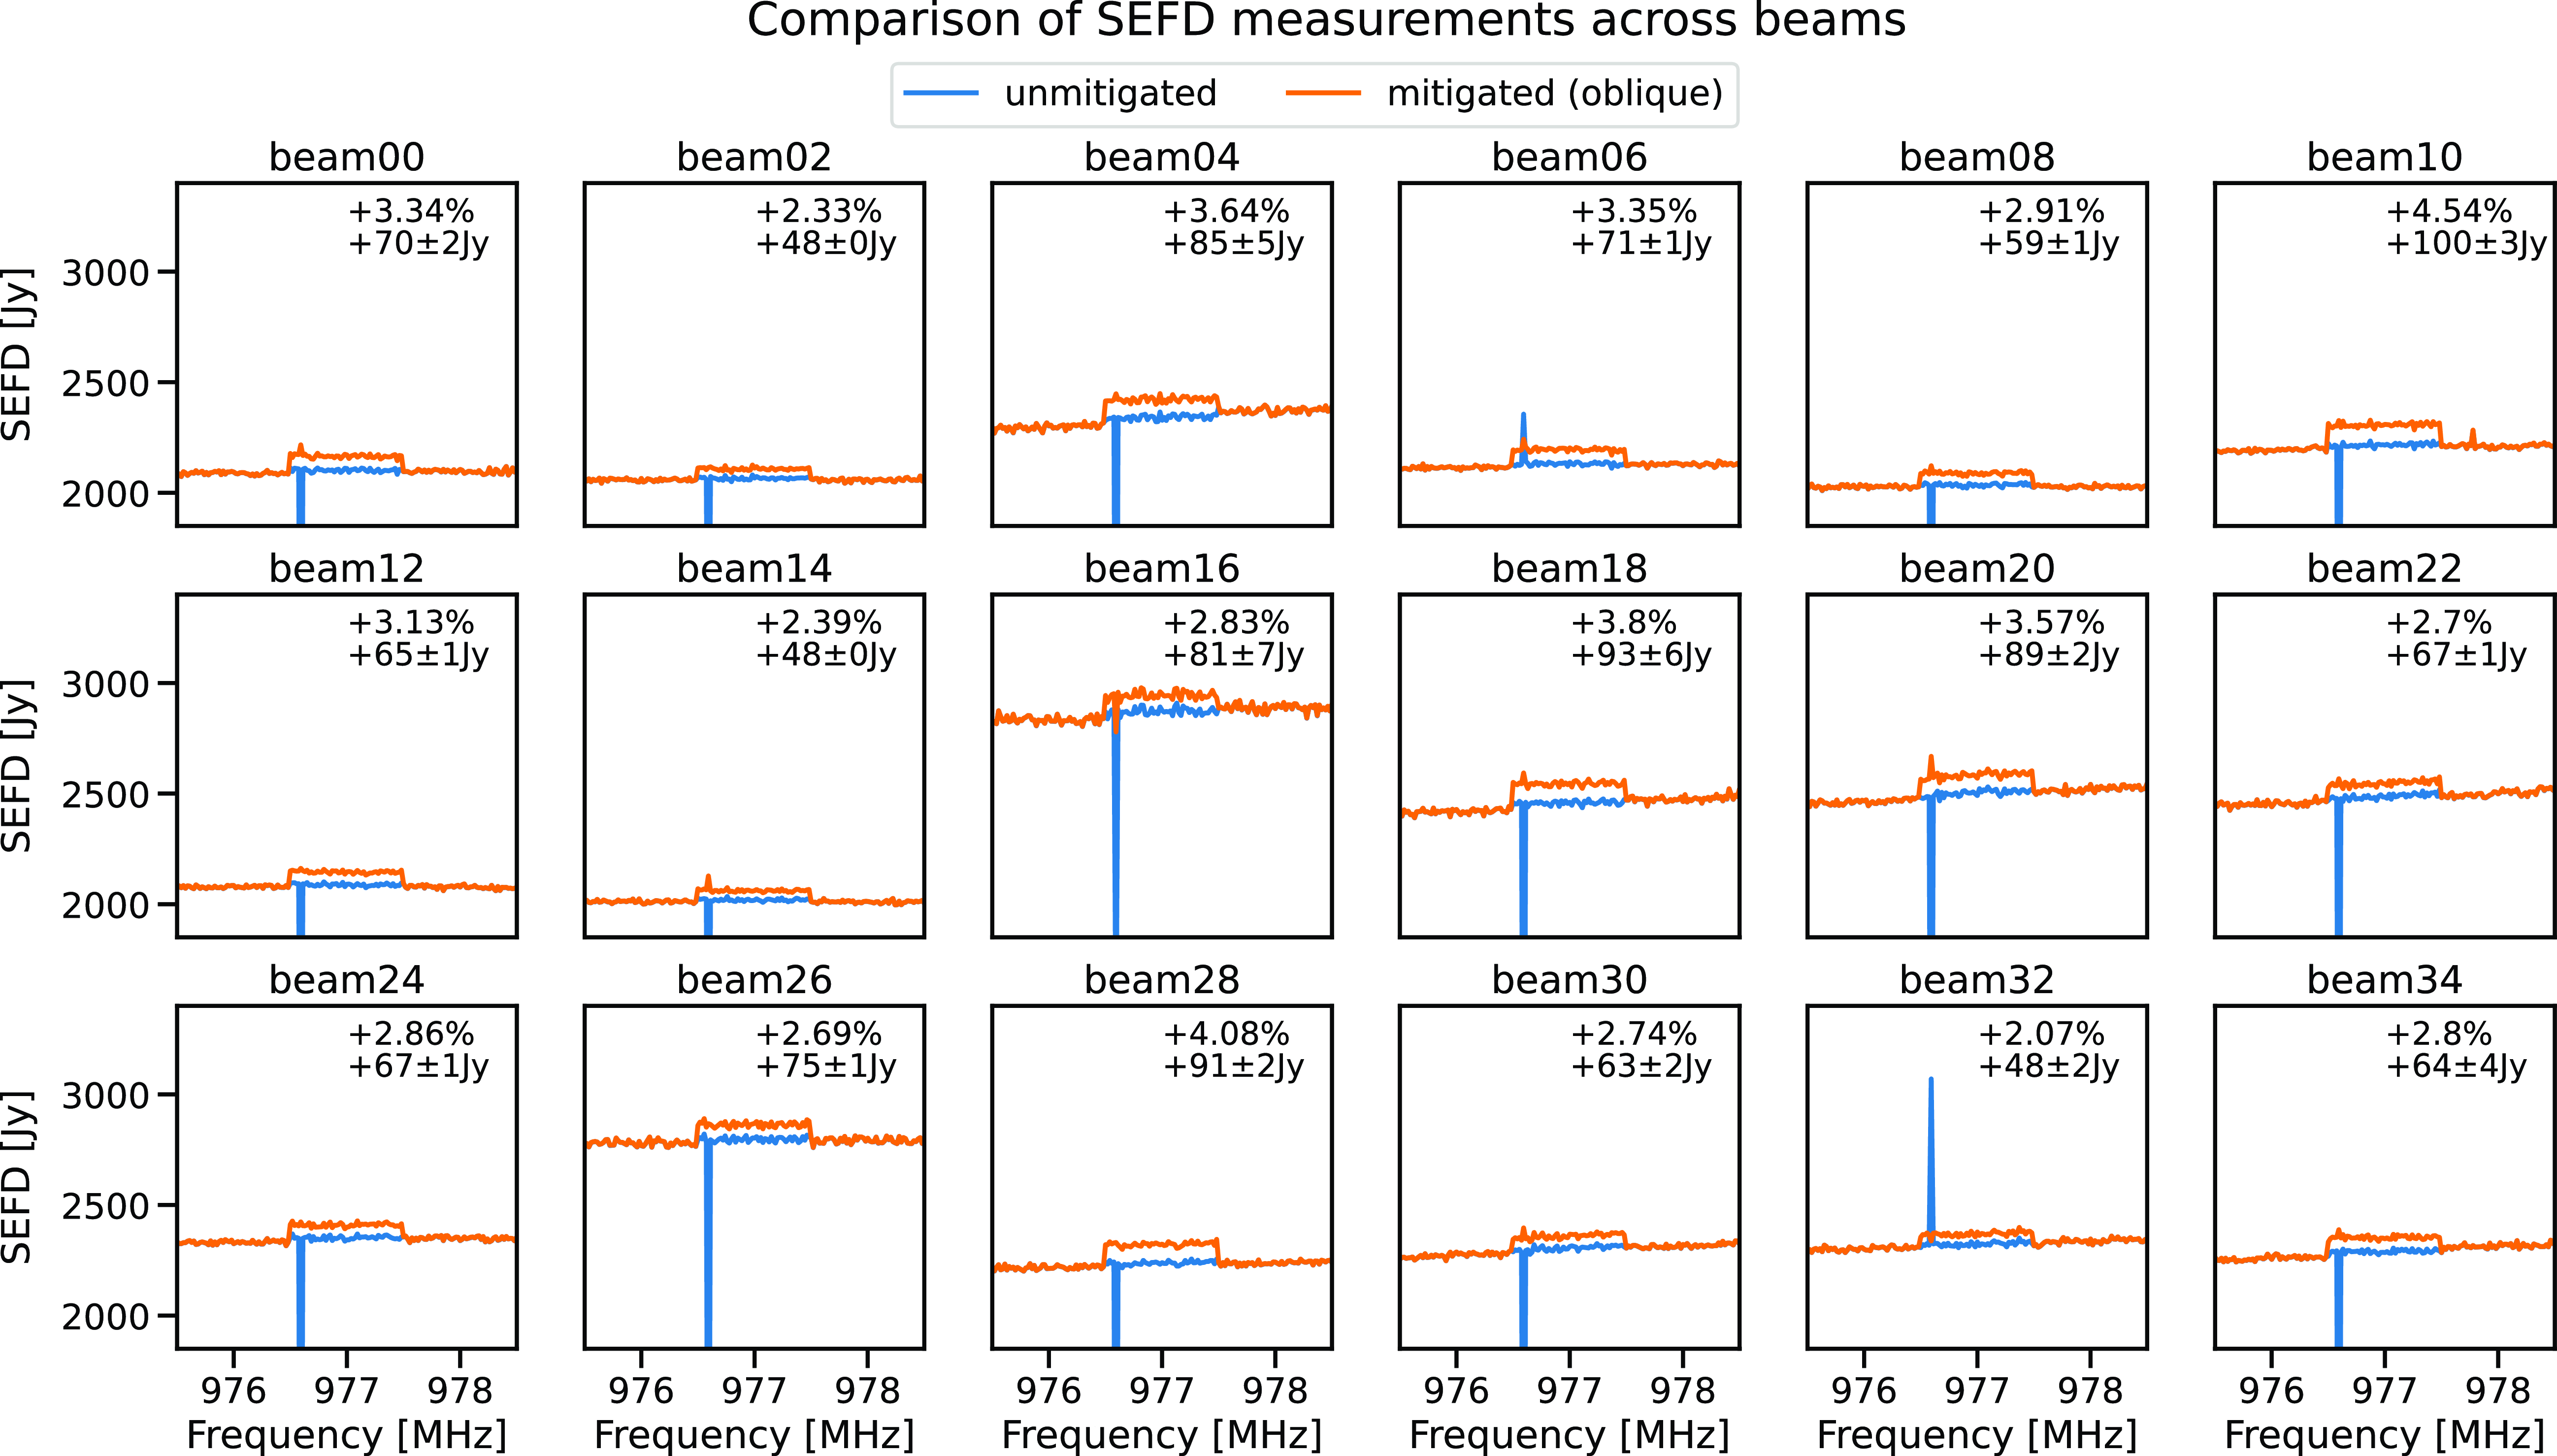
Fig. 10 shows the SEFD measurement with mitigation (orange) versus without mitigation (blue) averaged across all beams and antenna. The inset shows that similar to Fig. 8, the subspace projection introduces a measured 3.1% decrease in sensitivity in the mitigated channel. This increase in the system temperature is larger than what was seen in the fine filter bank test on Virgo in the previous experiment, and at the lower end of the 3% to 5% calculated value using the y-factor. Fig. 12 separates out the individual beams (averaged over antennas) in the same SEFD measurement. Each panel shows the corresponding pair of mitigated (orange) and unmitigated beams (blue) showing three adjacent 1 MHz channels. In each channel containing the interferer, the offset in the mitigated channel is annotated. Offsets range from 48 $\pm$
0.8Jy to 100
$\pm$
0.8Jy to 100 $\pm$
3Jy, much less than the
$\pm$
3Jy, much less than the $\approx$
800 Jy difference between beams. Compared to the calculated value using the correlation of the spatial signature vector and weights, the SEFD values are higher than the mean calculated value of 1%, but all lower than the maximum calculated value of 6%.
$\approx$
800 Jy difference between beams. Compared to the calculated value using the correlation of the spatial signature vector and weights, the SEFD values are higher than the mean calculated value of 1%, but all lower than the maximum calculated value of 6%.
Measured change in beamshape
Holography was used to determine changes to the beam shape and gain using the same footprint. Fig. 11 shows two beams located in position 0 of the footprint at 977 MHz with (bottom) and without mitigation (top). Holography measurements are performed using a raster grid while observing a calibration source. In comparison to a reference boresight beam, the sensitivity pattern of all beams in the footprint is sampled (Hotan Reference Hotan2016; McConnell et al. Reference McConnell, Lenc, Duchesne and Thomson2022).
The top panel of Fig. 11 shows the effect of RFI on holography. The gross impact of RFI on beamformer weights is already corrected using frequency interpolation (Chippendale & Hellbourg Reference Chippendale and Hellbourg2017). The degradation in the holography measurement is likely because the correlations are dominated by the correlating RFI instead of the weaker astronomical source we are doing holography on. Not only is there an order of magnitude difference in the peak values between the two panels of Fig. 11, but there is also no discernible beam in the top panel. Furthermore, this is not the case in the adjacent 1 MHZ channels free from RFI. Comparison with archived holography measurements at 977 MHz shows that beam maps at this frequency are regularly corrupted.
The mitigated copy of the beam is shown in the bottom panel of Fig. 11. The mitigated beam pattern in Fig. 11 clearly shows the high-gain main lobe terminating in a surrounding null. We can also identify the side lobes surrounding the first null.
To quantitatively measure differences in the mitigated beam pattern, we interpolate between the adjacent channels’ sensitivity patterns to establish a reference beam to which to compare, assuming the channel-to-channel variations are smooth. We then fit a Gaussian to the reference ‘beam’ to find the half power point, sample the reference beam, and integrate around the half-power contour. We do the same for the mitigated beam and calculate the percentage difference between them at half power.
Fig. 13 shows differences between the reference and mitigated beams across the footprint. The heatmaps in Fig. 13 shows that there is no change (white) to the shape or gain in the main lobe. The heatmaps show the difference between the reference and mitigated beams in dB. The half power point is marked by the red dashed circle. Green indicates suppression of the RFI in the beam pattern by oblique projection. Purple, an increase in gain, is the compensation as a result of the mitigation of introducing the (green) suppression. The purple also represents the underlying reason for the increase in the system temperature.
Comparison between the reference and mitigated beams by oblique projection across the modified close-pack square $6\times6$
footprint. Each beam has a central heatmap showing the difference between reference and mitigated beams in dB. The red dashed circle marks the half power point, white shows no change to the beam. Purple is an increase in gain, resulting from changes to the weights by introducing the green null (decrease in gain). All differences are within -3 to 2.5 dB and primarily limited to the outer lobes as predicted by the modelling. The top and side panels of each heatmap show a slice through the main beam at the grey dashed lines of each heatmap. These subplots show the reference beam (blue) and mitigated beam (overlaid in orange) with the normalised linear gain using solid curves and gain in dB using dashed curves.
$6\times6$
footprint. Each beam has a central heatmap showing the difference between reference and mitigated beams in dB. The red dashed circle marks the half power point, white shows no change to the beam. Purple is an increase in gain, resulting from changes to the weights by introducing the green null (decrease in gain). All differences are within -3 to 2.5 dB and primarily limited to the outer lobes as predicted by the modelling. The top and side panels of each heatmap show a slice through the main beam at the grey dashed lines of each heatmap. These subplots show the reference beam (blue) and mitigated beam (overlaid in orange) with the normalised linear gain using solid curves and gain in dB using dashed curves.

The subplots in Fig. 13 (the top and right panels of each individual heatmap) show a slice across the main heatmap through the maximum of the beam identified by horizontal and vertical dashed grey lines, respectively, similar to (and with the same colours as) Fig. 4. The top and side panels show the reference beam in blue and the mitigated beam overlay in orange through that slice. The solid curves show the normalised linear gain. The dashed curves show the beamformed response in dB.
Two points worth noting; first, in Fig. 13, had the interferer been external to ASKAP’s receivers, the suppressed direction of the interferer (Green) would have been ‘better defined’. Second, Figs. 11 and 13 have been interpolated to a higher resolution from the original holography measurements.
On average the mitigated beam differs from the main beam about the half power point by only 0.02%, with a range of just over 1.5% and standard deviation of 0.4%. Fig. 13 shows that all differences are within -3 to 2.5 dB of the reference beam and, in line with our modelling, changes to the beam shape are limited to the outer sidelobes.
5. Future work
We are in the process of making this operational on ASKAP. We have also found a second self-generated RFI signal in ASKAP data at 960 MHz that is persistently flagged in continuum observations (Lourenço et al. Reference Lourenço2024). This is due to the ADC read-out clock at 320 MHz being aliased by the 1 280 MHz sample clock when observing with the 1 200 MHz bandpass filter. We can mitigate this second signal using the exact method presented above.
We would like to provide users with information on which RFI may be successfully mitigated without exceeding specific limits on performance degradation. During observations, these impact estimates may be provided to observers and observing systems (Moss Reference Moss2022) to inform whether activating the mitigation will benefit science goals. The calculations from the correlation of the beam weight steering vector and the RFI spatial signature seem sufficient to predict changes to the RFI-affected channel and can therefore be recommended to guide users.
Furthermore, calculations of the expected noise power from the correlation of an estimated RFI spatial signature using the full ACM with maxSNR weights using all ports, as opposed to only 60, show potential for improved mitigation on ASKAP.
This method, applying projected beam weights at the beginning of observation and leaving them fixed, would also work for a phased array pointing directly at the sky, which doesn’t track the source where the interferer is nearby and ground-based. In this case, there is also no relative motion between the array elements and the interferer(s). However, additional techniques to determine the RFI subspace would be required, especially at low frequencies (Hellbourg et al. Reference Hellbourg, Weber, Capdessus and Boonstra2012a).
In order to mitigate moving interferers relative to the ASKAP – and in the future, the Murriyang (Parkes) cryogenic (Dunning et al. Reference Dunning2023) – PAFs, we are currently developing strategies to identify RFI affected channels and determine their suitability for mitigation based on their eigenvalues (power), eigenvectors (spatial signature), and estimate performance impacts via orthogonality of the RFI eigenvactors and the maxSNR beam weights (Lourenço & Chippendale in prep).
6. Conclusion
In the growing presence of RFI, sensitive synthesis array instruments will need to rely on methods other than flagging for RFI mitigation. Mitigating self-generated interference by estimating the spatial signature of the interferer once at the beginning of the observation is a practical initial use case of ASKAP’s RFI mitigation capabilities via PAF beamforming before implementing the dynamic case – adjusting beam weights continuously throughout the observation – required to mitigate RFI from moving sources, e.g. signals from satellites and aircraft (or static sources with a tracking telescope).
This paper presents the effects on gain, beampattern, and sensitivity of RFI mitigation using subspace-projection-based spatial nulling algorithms on a self-generated stationary clock signal. Our modelling and measurements show that the impact on the main beam shape and sensitivity is small. Measured results on sensitivity and beam impacts agree with theoretical calculations via $\rho$
(correlation between RFI subspace and beam weights) as well as simulations using a geometric optics model of the RFI. We have also shown a technique for estimating weak narrowband interference subspaces by taking the difference of the mean adjacent channels and the RFI-impacted channel ACMs. Suppression of the unwanted signal by over 31 dB, to our measurement noise floor, was achieved with a 1.5% measured average increase to the system-temperature-over-efficiency using a single antenna and a 3.1% increase in the SEFD across the array. We modelled and measured no significant change to the gain in the main beam,
$\rho$
(correlation between RFI subspace and beam weights) as well as simulations using a geometric optics model of the RFI. We have also shown a technique for estimating weak narrowband interference subspaces by taking the difference of the mean adjacent channels and the RFI-impacted channel ACMs. Suppression of the unwanted signal by over 31 dB, to our measurement noise floor, was achieved with a 1.5% measured average increase to the system-temperature-over-efficiency using a single antenna and a 3.1% increase in the SEFD across the array. We modelled and measured no significant change to the gain in the main beam, $\pm$
0.4% on average, about the half power point. Variations to the beam pattern were limited to the outer lobes.
$\pm$
0.4% on average, about the half power point. Variations to the beam pattern were limited to the outer lobes.
Acknowledgments
We would like to thank Dr. Gregory Hellbourg and Professor Tara Murphy for their helpful feedback. We would also like to thank Dr. Tim Galvin for helping us run the SEFD processing on supercomputers.
This scientific work uses data obtained from Inyarrimanha Ilgari Bundara, the CSIROs Murchison Radio-astronomy Observatory. We acknowledge the Wajarri Yamaji People as the Traditional Owners and native title holders of the observatory site. CSIRO’s ASKAP radio telescope is part of the Australia Telescope National Facility (https://ror.org/05qajvd42). Operation of ASKAP is funded by the Australian Government with support from the National Collaborative Research Infrastructure Strategy. ASKAP uses the resources of the Pawsey Supercomputing Research Centre. Establishment of ASKAP, Inyarrimanha Ilgari Bundara, the CSIROs Murchison Radioastronomy Observatory and the Pawsey Supercomputing Research Centre are initiatives of the Australian Government, with support from the Government of Western Australia and the Science and Industry Endowment Fund.
Data availability
Not applicable.
Appendix A. Effects of changes in phase on spatial nulling
In the process of constructing the model, we considered two instances of self-generated RFI; a uniform amplitude arriving at all ports with and without a random phase, i.e. randomised and aligned phase, respectively. Fig. A1 shows an X polarisation beam centred in the direction $-2.4^\circ$
, before and after mitigation.
$-2.4^\circ$
, before and after mitigation.
Changes to the beam based on an RFI spatial signature with aligned phase on the left and randomised phase on the right are shown using both the orthogonal and oblique projections. The rows show the linear gain, gain in decibels and the percentage difference in linear gain to the unmitigated beam, respectively. After mitigation, more significant variations to the beam patterns were observed in both the main lobe and the outer lobes without a uniform phase compared to a random phase, where variations were most pronounced starting at the second null and an almost complete agreement between the reference and projected beamformed patterns in the main lobe and first side lobe. Although, the top left panel of Fig. A1 shows that the oblique projection corrects for the error in the main beam experienced by the orthogonal projection when the RFI subspace is randomised in phase. Variations to the beampatterns are reduced when the phase of the generated signal is randomised. The measured RFI spatial signature in Fig. 4 is consistent with a clock signal arriving at the PAF ports with differing delays along the signal path of each port. The delay differences are dominated by random digital delays that are introduced each time ASKAP’s digital receivers are reset.
X polarisation beamformed response in the direction $-2.4^\circ$
, before and after mitigation, showing that variations to the beampatterns are reduced when the phase of the generated signal is randomised. The rows show the linear gain, gain in decibels and the percentage difference in linear gain compared to the unmitigated beam.
$-2.4^\circ$
, before and after mitigation, showing that variations to the beampatterns are reduced when the phase of the generated signal is randomised. The rows show the linear gain, gain in decibels and the percentage difference in linear gain compared to the unmitigated beam.


 Open access

