





Introduction
The infection fatality risk (IFR), defined as the probability of death among all infected individuals, is an essential metric for quantifying clinical severity and comparing virulence across pathogens, settings, and time [Reference Wong1, Reference Levin2]. During the influenza-A/H1N1 pandemic, age-specific IFR estimates were used to characterize severity gradients by age and address ascertainment biases in mortality outcome assessment [Reference Wong3]. IFR estimation was crucial for public health decision-making during the COVID-19 pandemic, playing a central role in interpreting infection severity, identifying high-risk populations (e.g., older adults), modelling epidemic trajectories (e.g., in the absence of interventions), and predicting overall mortality [Reference O’Driscoll4, Reference Verity5].
Statistical estimation of the IFR has traditionally been performed by coupling observed death counts with independently estimated cumulative infections, typically inferred from population-based seroepidemiological surveys [Reference Levin2, Reference O’Driscoll4, Reference Meyerowitz-Katz and Merone6–Reference Streeck10]. To translate seroepidemiological datasets into cumulative infection risk, various studies have proposed methods to account for and address imperfect testing performance, employing hierarchical Bayesian measurement-error frameworks that propagate uncertainty in sensitivity and specificity [Reference Gelman and Carpenter11, Reference Larremore12]. Additionally, because antibody waning and seroreversion following an infection can cause fluctuations in seropositivity, recent research has suggested incorporating time-varying sensitivity and antibody kinetics into models to improve the estimation of cumulative incidence from sequential serosurvey data [Reference Shioda13]. However, the vast majority of seroepidemiological surveys are still resource-intensive to implement and sustain, and non-random participation in blood collection remains a concern. Recruitment and non-response biases can link participation to infection risk, symptom history, and risk perception, thereby distorting the denominator of the IFR [Reference Kinoshita14–Reference Ith17]. Furthermore, the death count may be affected by surveillance processes, especially for mild infectious diseases. In many settings, routine reporting and vital registration systems cannot capture all deaths attributable to an infectious disease. Consequently, excess-mortality estimation has been employed as an alternative, often producing a value that exceeds the ascertained number of deaths, and the accurate excess mortality estimate may provide a lower bound of COVID-19 deaths [Reference Karlinsky and Kobak18, Reference Msemburi19]. Bias and uncertainty in both the numerator (deaths) and the denominator (infected) of the IFR are recognized as influential problems, and unbiased IFR estimation remains a challenge for public health practice. Developing multiple complementary approaches to IFR estimation could improve its robustness and enhance its resilience to method-specific biases and limitations.
A valuable yet underused source of data is the medicolegal death investigation system, which includes forensic autopsy programmes that utilize systematic post-mortem testing and standardized cause-of-death assessment. Death investigations can determine infection status among decedents via routine cause-of-death surveillance, thereby estimating the number of individuals infected with COVID-19. The autopsy system in Tokyo’s metropolitan areas operates across all 23 special wards, where all medicolegal deaths, including those with natural, non-natural, and undetermined causes, are reported to the Tokyo Medical Examiner’s Office. Between 2020 and 2021, medicolegal investigations of abnormal deaths in these wards included reverse transcription-polymerase chain reaction (RT-PCR) testing for COVID-19, post-mortem computed tomography, and administrative autopsy [20]. Previous studies have used autopsy data to evaluate the causal relationship between death and SARS-CoV-2 positivity, as well as to investigate mortality following COVID-19 vaccination [Reference Suzuki, Muramatsu and Hayashi21, Reference Suzuki22]. Rather than focusing on causality, the present study exploits these data to reflect population-level COVID-19 risk. The objective of this research was to estimate age-specific IFRs for COVID-19 using medicolegal death investigation data, including forensic autopsy RT-PCR results, obtained from the Tokyo Medical Examiner system across the 23 special wards of Tokyo. We also performed a sample size calculation to determine the minimum number of autopsies requiring RT-PCR testing under a fixed IFR assumption.
Methods
Epidemiological autopsy and seroprevalence data
We used three independent empirical datasets to estimate the age-dependent IFR of SARS-CoV-2. First, we obtained autopsy data from the Tokyo Medical Examiner’s Office, which had conducted systematic medicolegal death investigations in the 23 special wards of Tokyo from March 2020 to February 2021 [20]. The dataset included the count of positive cases as determined by post-mortem nasopharyngeal RT-PCR testing, stratified into three age groups (≤39 years, 40–64 years, and ≥65 years). We also used the cumulative number of autopsies conducted at the Tokyo Medical Examiner’s Office [23]. Second, we derived the cumulative incidence of SARS-CoV-2 infection in the Tokyo Metropolitan Area from two independent seroepidemiological surveys that collected residual clinical specimens using a chemiluminescence immunoassay [Reference Sanada24] and an enzyme-linked immunosorbent assay (ELISA) [Reference Yamayoshi25] to detect IgG antibodies against the SARS-CoV-2 nucleocapsid (N) and spike (S) proteins. The incidence of infection was estimated from a cross-sectional survey of leftover serum at 14 Tokyo outpatient clinics between 1 September 2020 and 31 March 2021, restricted to patients without a prior COVID-19 diagnosis or symptoms at the time of blood collection [Reference Sanada24]. We also examined data from another study of residual serum or plasma collected for medical examination from patients visiting healthcare facilities in the Tokyo Metropolitan Area between February 2020 and March 2022, which again excluded patients with positive SARS-CoV-2 nucleic acid or antigen tests [Reference Yamayoshi25]. Third, we used vital statistics to extract age-specific numbers of all-cause deaths and mid-year population sizes for the abovementioned study period and region [26, 27].
Estimation of age-specific IFR
We estimated age-specific IFR by applying Bayes’ theorem to combine serologically inferred cumulative risk of infection with medicolegal death investigation data quantifying SARS-CoV-2 infection risk among autopsied dead individuals. Let the age-specific IFR for the age group
$ a $
 be
$ {\mathrm{IFR}}_a=\Pr \left({A}_a\mid {B}_a\right) $
be
$ {\mathrm{IFR}}_a=\Pr \left({A}_a\mid {B}_a\right) $
 , where
$ A $
, where
$ A $
 represents death from all causes and
$ B $
represents death from all causes and
$ B $
 denotes SARS-CoV-2 infection. It should be noted that our IFR is thus regarded as the conditional risk of death given infection and that here it does not handle the causal risk of death. Using Bayes’ theorem, the age-specific
$ {\mathrm{IFR}}_a $
denotes SARS-CoV-2 infection. It should be noted that our IFR is thus regarded as the conditional risk of death given infection and that here it does not handle the causal risk of death. Using Bayes’ theorem, the age-specific
$ {\mathrm{IFR}}_a $
 was rearranged as

where specific to age group
$ a $
 ,
$ P\left({B}_a\mid {A}_a\right) $
,
$ P\left({B}_a\mid {A}_a\right) $
 denotes the probability that a decedent was infected with SARS-CoV-2,
$ P\left({A}_a\right) $
denotes the probability that a decedent was infected with SARS-CoV-2,
$ P\left({A}_a\right) $
 denotes the probability of death during the study period, and
$ P\left({B}_a\right) $
denotes the probability of death during the study period, and
$ P\left({B}_a\right) $
 denotes the cumulative risk of infection with SARS-CoV-2. Empirically, the conditional probability
$ P\left({B}_a\mid {A}_a\right) $
denotes the cumulative risk of infection with SARS-CoV-2. Empirically, the conditional probability
$ P\left({B}_a\mid {A}_a\right) $
 can be estimated using the age-specific risk of SARS-CoV-2 infection among decedents in the 23 special wards of Tokyo between March 2020 and February 2021. To account for limited sensitivity, we computed the true positivity proportion using the Rogan–Gladen estimator [Reference Rogan and Gladen28] and the Bayesian estimation model. The details of the procedure are provided in the Supplementary Material.
The infected proportion of the population
$ P\left({B}_a\right) $
 was obtained from age-stratified seroepidemiological data, adjusted for assay sensitivity and specificity using the Rogan–Gladen estimator [Reference Rogan and Gladen28]. Let
$ {y}_a^{sero} $
was obtained from age-stratified seroepidemiological data, adjusted for assay sensitivity and specificity using the Rogan–Gladen estimator [Reference Rogan and Gladen28]. Let
$ {y}_a^{sero} $
 and
$ {n}_a^{\mathrm{sero}} $
and
$ {n}_a^{\mathrm{sero}} $
 denote the number of seropositive individuals and the number tested in age group
$ a $
denote the number of seropositive individuals and the number tested in age group
$ a $
 , respectively, with an observed seropositivity proportion of
$ {p}_{a,\mathrm{obs}}^{\mathrm{sero}}={y}_a^{sero}/{n}_a^{\mathrm{sero}} $
, respectively, with an observed seropositivity proportion of
$ {p}_{a,\mathrm{obs}}^{\mathrm{sero}}={y}_a^{sero}/{n}_a^{\mathrm{sero}} $
 . The adjusted seroprevalence was calculated as

In addition to RT-PCR testing, we calculated the true positivity of the assay using the Rogan–Gladen estimator. We assigned study-specific values for serological assay sensitivity and specificity. Specifically, for Sanada et al.’s study [Reference Sanada24], we used
$ {s}_e^{\mathrm{sero}}=0.636 $
 and
$ {s}_p^{\mathrm{sero}}=1.0 $
and
$ {s}_p^{\mathrm{sero}}=1.0 $
 , whereas for Yamayoshi et al.’s study [Reference Yamayoshi25], we used
$ {s}_e^{\mathrm{sero}}=0.995 $
, whereas for Yamayoshi et al.’s study [Reference Yamayoshi25], we used
$ {s}_e^{\mathrm{sero}}=0.995 $
 and
$ {s}_p^{\mathrm{sero}}=1.0 $
and
$ {s}_p^{\mathrm{sero}}=1.0 $
 . Because the seroepidemiological surveys spanned a finite sampling period, we rescaled the infection risk using a scaling factor
$ {r}_a={L}_a/T $
. Because the seroepidemiological surveys spanned a finite sampling period, we rescaled the infection risk using a scaling factor
$ {r}_a={L}_a/T $
 , where
$ {L}_a $
, where
$ {L}_a $
 is the age-group specific mean time from the onset of COVID-19 symptoms to death, which was computed from individual death records from 2020 [Reference Beppu and Shinohara29], and T is the duration of the sero-survey sampling period. The rescaled risk of infection was defined as
$ P\left({B}_a\right)={\pi}_a^{\mathrm{sero}}{r}_a $
is the age-group specific mean time from the onset of COVID-19 symptoms to death, which was computed from individual death records from 2020 [Reference Beppu and Shinohara29], and T is the duration of the sero-survey sampling period. The rescaled risk of infection was defined as
$ P\left({B}_a\right)={\pi}_a^{\mathrm{sero}}{r}_a $
 . Combining these data with Equation (1), we calculated age-specific IFR and quantified the uncertainty in these estimates. To quantify uncertainty in the age-specific IFR estimates, we used a parametric bootstrap method; detailed descriptions are available in the Supplementary Material. We compared our age-specific IFRs with values published in systematic reviews and meta-analyses [Reference Levin2, Reference O’Driscoll4, Reference Brazeau30–Reference Herrera-Esposito and de los Campos35], as well as with published country-specific IFR estimates from the pre-vaccination era [Reference Levin2, Reference Verity5, Reference Levin33, Reference Zhang and Nishiura36, Reference Herlinda37].
Relationship between IFR and RT-PCR positivity during autopsies
To facilitate the prediction of a fixed IFR value from the empirically observed proportion of RT-PCR positives among autopsied individuals, we examined the relationship between (i) the estimated cumulative risk of infection derived from sero-surveys and (ii) all-cause mortality. We adjusted for test performance by setting the sensitivity and specificity of the sero-survey to
$ {s}_e^{\mathrm{ser}}=0.805 $
 and
$ {s}_p^{\mathrm{ser}}=1.0 $
and
$ {s}_p^{\mathrm{ser}}=1.0 $
 , and those of RT-PCR performance to
$ {s}_e^{\mathrm{PCR}}=0.733 $
, and those of RT-PCR performance to
$ {s}_e^{\mathrm{PCR}}=0.733 $
 and
$ {s}_p^{\mathrm{PCR}}=0.999 $
and
$ {s}_p^{\mathrm{PCR}}=0.999 $
 [Reference Parai38–Reference Kostoulas, Eusebi and Hartnack40]. The sensitivity of RT-PCR was based on pooled estimates from a meta-analysis [Reference Böger39], which synthesized evidence from four studies evaluating the sensitivity of RT-PCR testing of nasopharyngeal aspirates, nasopharyngeal swabs, and throat swabs in symptomatic patients. Supposing that the all-cause mortality risk of
$ P(A) $
[Reference Parai38–Reference Kostoulas, Eusebi and Hartnack40]. The sensitivity of RT-PCR was based on pooled estimates from a meta-analysis [Reference Böger39], which synthesized evidence from four studies evaluating the sensitivity of RT-PCR testing of nasopharyngeal aspirates, nasopharyngeal swabs, and throat swabs in symptomatic patients. Supposing that the all-cause mortality risk of
$ P(A) $
 was that of vital statistics for 2020 and
$ {r}_a=24/180 $
was that of vital statistics for 2020 and
$ {r}_a=24/180 $
 , where 24 days represents the mean duration from COVID-19 symptom onset to death, and 180 denotes the duration of a sero-survey sampling period. Using seroprevalence, a fixed IFR value, and Equation (1), we first derived the true PCR positivity from
$ {r}_a $
, where 24 days represents the mean duration from COVID-19 symptom onset to death, and 180 denotes the duration of a sero-survey sampling period. Using seroprevalence, a fixed IFR value, and Equation (1), we first derived the true PCR positivity from
$ {r}_a $
 ,
$ P\left({A}_a\right) $
,
$ P\left({A}_a\right) $
 , and
$ {\pi}^{\mathrm{sero}} $
, and
$ {\pi}^{\mathrm{sero}} $
 . We then incorporated the sensitivity and specificity of RT-PCR to derive the expected RT-PCR positivity proportion via the Rogan–Gladen estimator.
Required sample size for autopsy
We performed a sample size calculation to determine the number of deceased individuals required for autopsy and RT-PCR testing to estimate the IFR within several predefined error levels. The calculation is based on the expected RT-PCR positivity among decedents, denoted by
$ {\pi}_o $
 . Because the IFR is close to zero, the required sample size was derived using the Wilson score confidence interval for a binomial proportion. This approach is preferred over the Wald method because of its superior reliability [Reference Wei and Hutson41]. Let
$ 1-\alpha $
. Because the IFR is close to zero, the required sample size was derived using the Wilson score confidence interval for a binomial proportion. This approach is preferred over the Wald method because of its superior reliability [Reference Wei and Hutson41]. Let
$ 1-\alpha $
 be the confidence level and
$ {z}_{1-\alpha /2} $
be the confidence level and
$ {z}_{1-\alpha /2} $
 the corresponding standard normal quantile. For a target absolute margin of error
$ \varepsilon $
the corresponding standard normal quantile. For a target absolute margin of error
$ \varepsilon $
 on
$ {\pi}_o $
on
$ {\pi}_o $
 , the required sample size
$ N $
, the required sample size
$ N $
 is
is

Details of errors in the translation from RT-PCR positivity to the IFR are provided in the Supplementary Material. Assuming that specific seroprevalence data (e.g., anti-nucleocapsid antibody) are not influenced by vaccine-induced immunity, we computed the required sample sizes for three margins of error for the IFR, defined by relative errors of 5%, 10%, and 20%.
Ethical considerations
The present study used only publicly available data that had been anonymized by the data source institutes. No personally identifiable information was accessed or handled.
Results
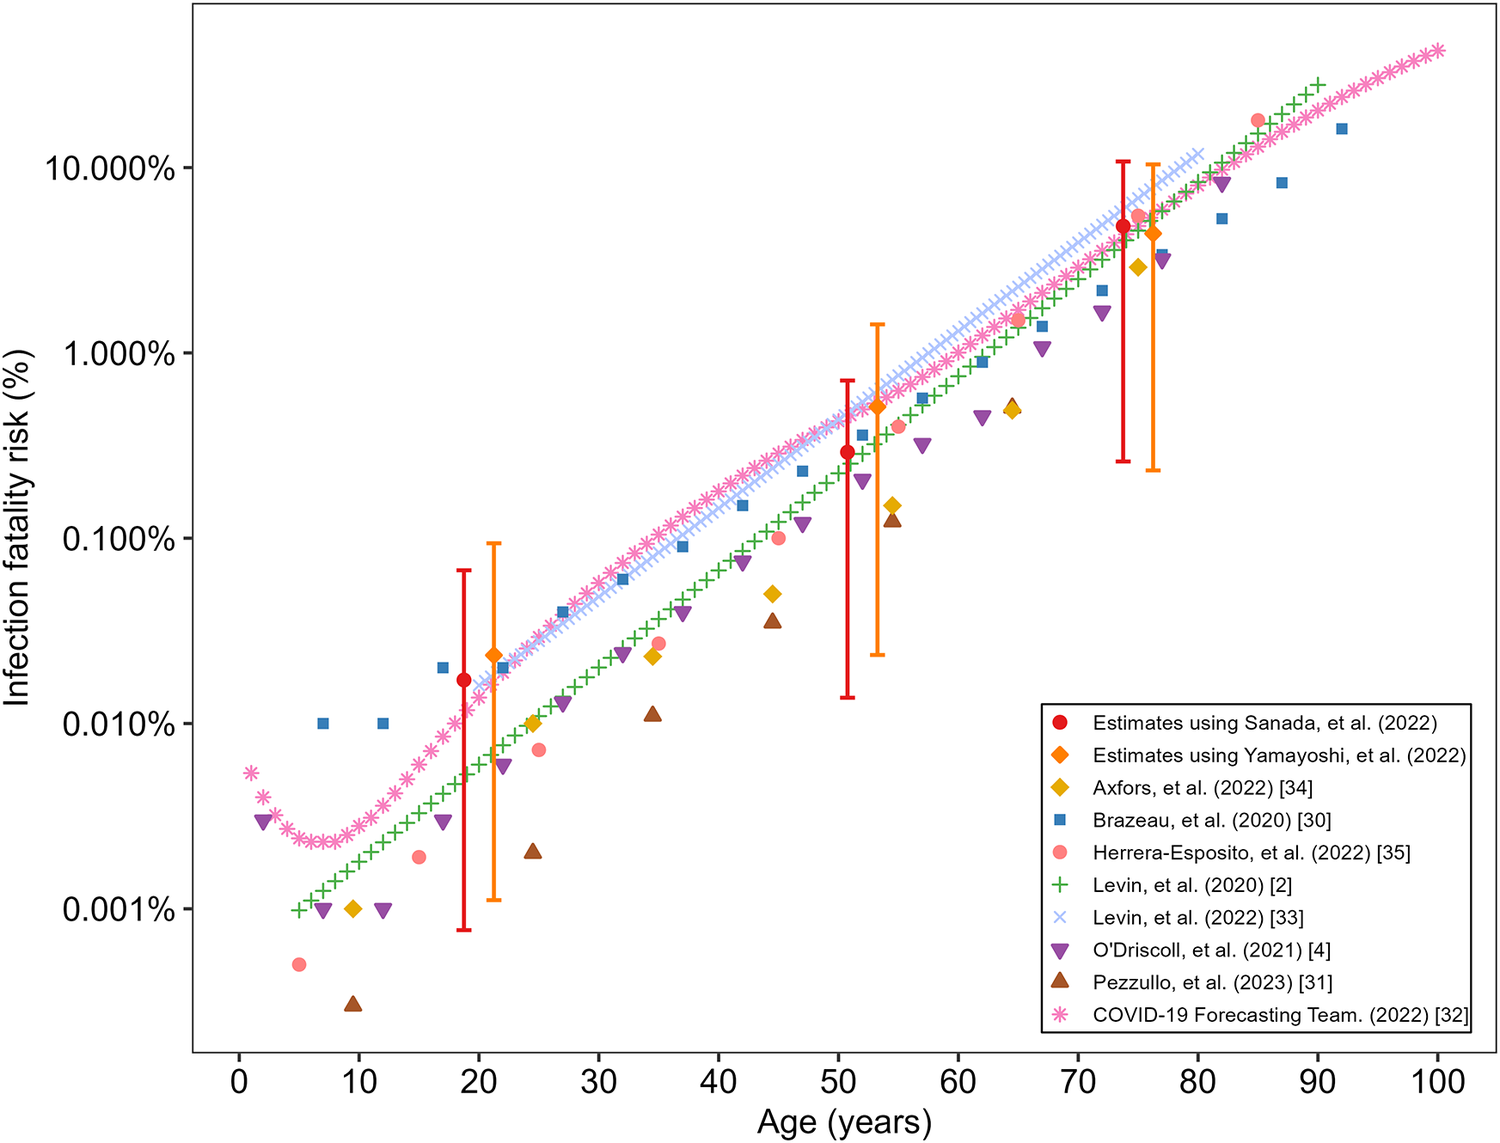
A total of 14574 autopsies were carried out between 1 March 2020 and 28 February 2021. Of these, 60 cases tested positive for SARS-CoV-2, yielding a positivity rate of 0.41%. The estimated age-specific RT-PCR positivity was 0.25% (95% credible interval (CI) 0.01–0.91) among individuals aged ≤39 years, 0.40% (95% CI 0.02–0.97) for those aged 40–64 years, and 0.28% (95% CI 0.01–0.59) for those aged ≥65 years. The estimated IFR was 0.02% (95% CI 0.0007–0.06) for 0–39 years, 0.30% (95% CI 0.01–0.59) for 40–64 years, and 3.8% (95% CI 0.20–8.79) for those aged 65 years and older, using seroprevalence data from Sanada et al. [Reference Sanada24]. Using the seroprevalence data from Yamayoshi et al.’s study [Reference Yamayoshi25], the estimated IFR for the three age groups was 0.02% (95% CI 0.0011–0.10), 0.50% (95% CI 0.03–1.44), and 4.22% (95% CI 0.19–10.4), respectively. Figure 1 shows the IFR estimated using each sero-survey dataset, compared against published estimates of IFR during the pre-vaccination period. The IFR increased exponentially with age.
Estimated age-specific infection fatality risk of COVID-19 compared with published estimates during the pre-vaccination period.
The horizontal axis shows age in years, and the vertical axis shows infection fatality risk (IFR) on a logarithmic scale. Study-specific point estimates are distinguished by colour and symbol: Estimates from Sanada et al. [Reference Sanada24] are shown as red circles, and those from Yamayoshi et al. [Reference Yamayoshi25] are shown as orange diamonds, each with a vertical 95% interval. Published estimates are represented by purple inverted triangles for O’Driscoll et al. [Reference O’Driscoll4], brown triangles for Pezzullo et al. [Reference Pezzullo31], blue squares for Brazeau et al. [Reference Brazeau30], green plus symbols for Levin et al. [Reference Levin2], pink asterisks for the COVID-19 Forecasting Team [32], light-blue crosses for Levin et al. [Reference Levin33], coral-coloured filled circles for Herrera-Esposito and de los Campos [Reference Herrera-Esposito and de los Campos35], and yellow filled diamonds for Axfors and Ioannidis [Reference Axfors and Ioannidis34].

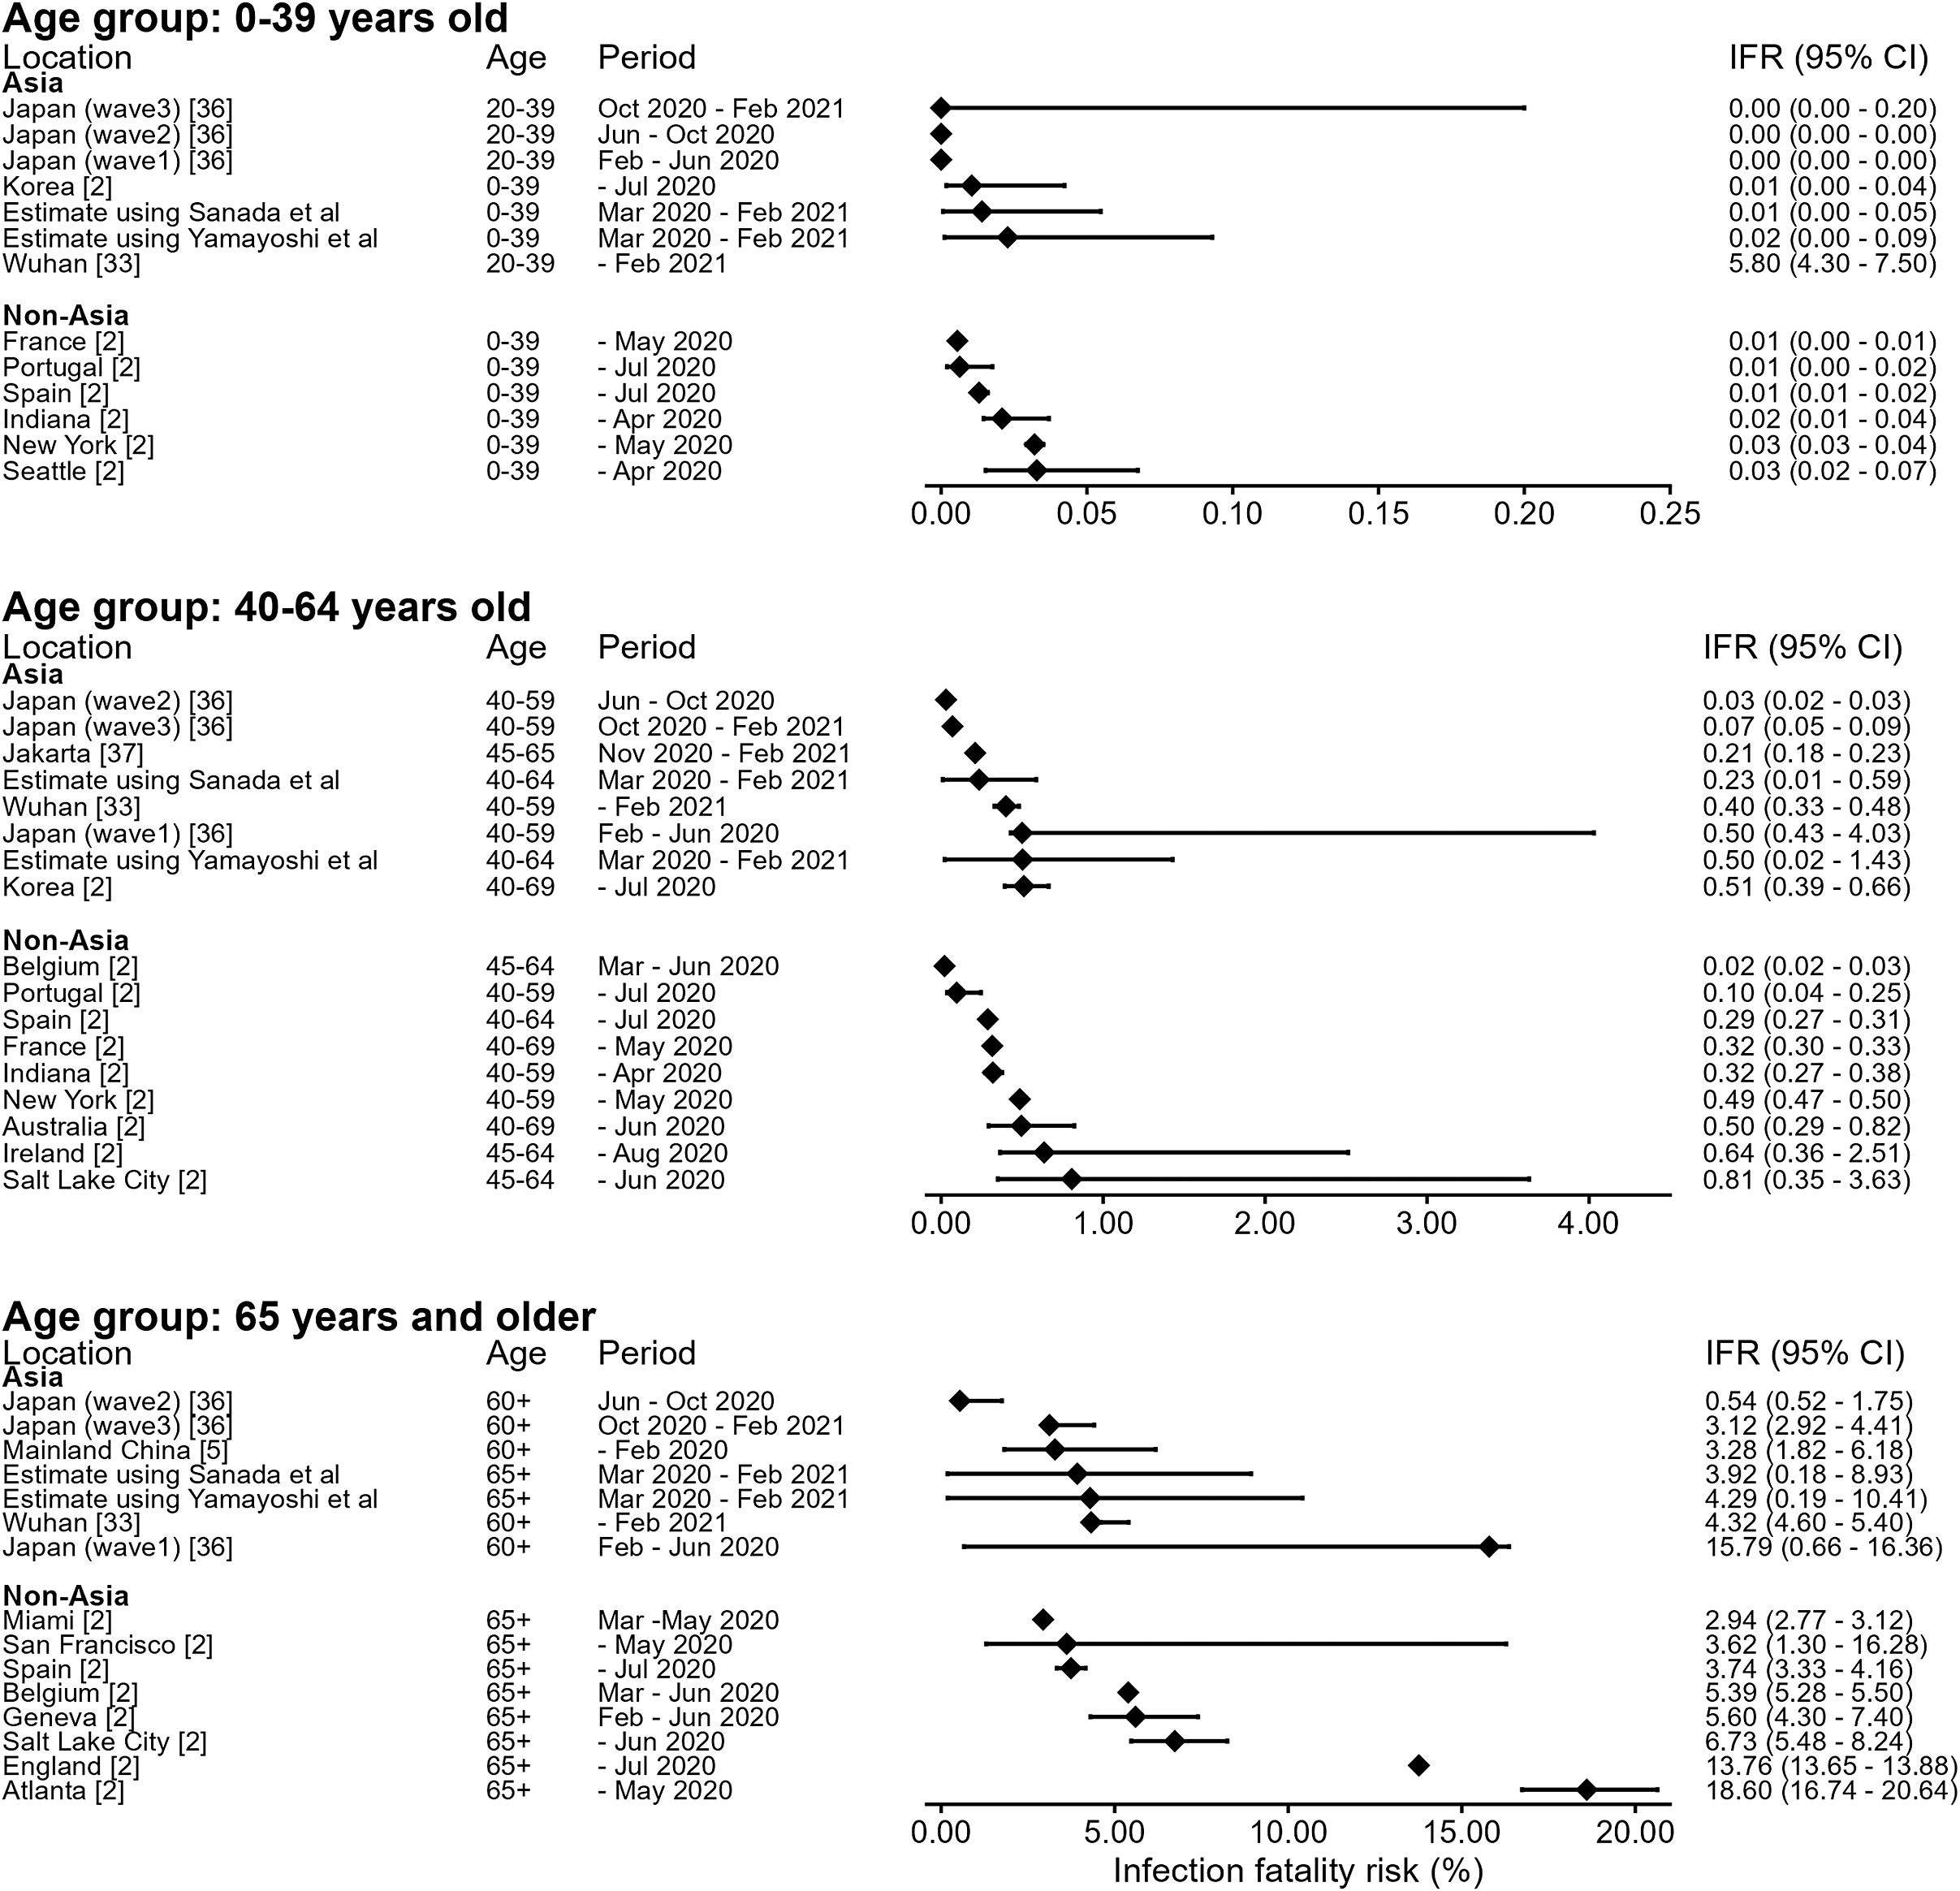
Figure 2 provides an age-stratified comparison between our IFR estimates and published estimates. Across all age groups, our estimated IFR generally fell within the ranges reported internationally for comparable periods. Among people aged from 0 to 39 years, IFR values were consistently very small, as reported elsewhere [Reference Levin2]. Among those aged between 40 and 64 years, our IFR estimate was close to those reported in European settings (e.g., Belgium 0.02%; 95% CI 0.02–0.03) but substantially smaller than those reported in North America and parts of Europe. Among those 65 years and older, estimated IFR values were consistent with other estimates from Japan.
Forest plot of infection fatality risk estimates by study and age group.
Each row corresponds to one study. Results are shown for up to three age groups: 0–39 years, 40–64 years, and ≥ 65 years. Each row displays study location, age group, study period, and IFR estimates as points with horizontal 95% confidence intervals. The exact estimate with its 95% interval is printed to the right of the plot.

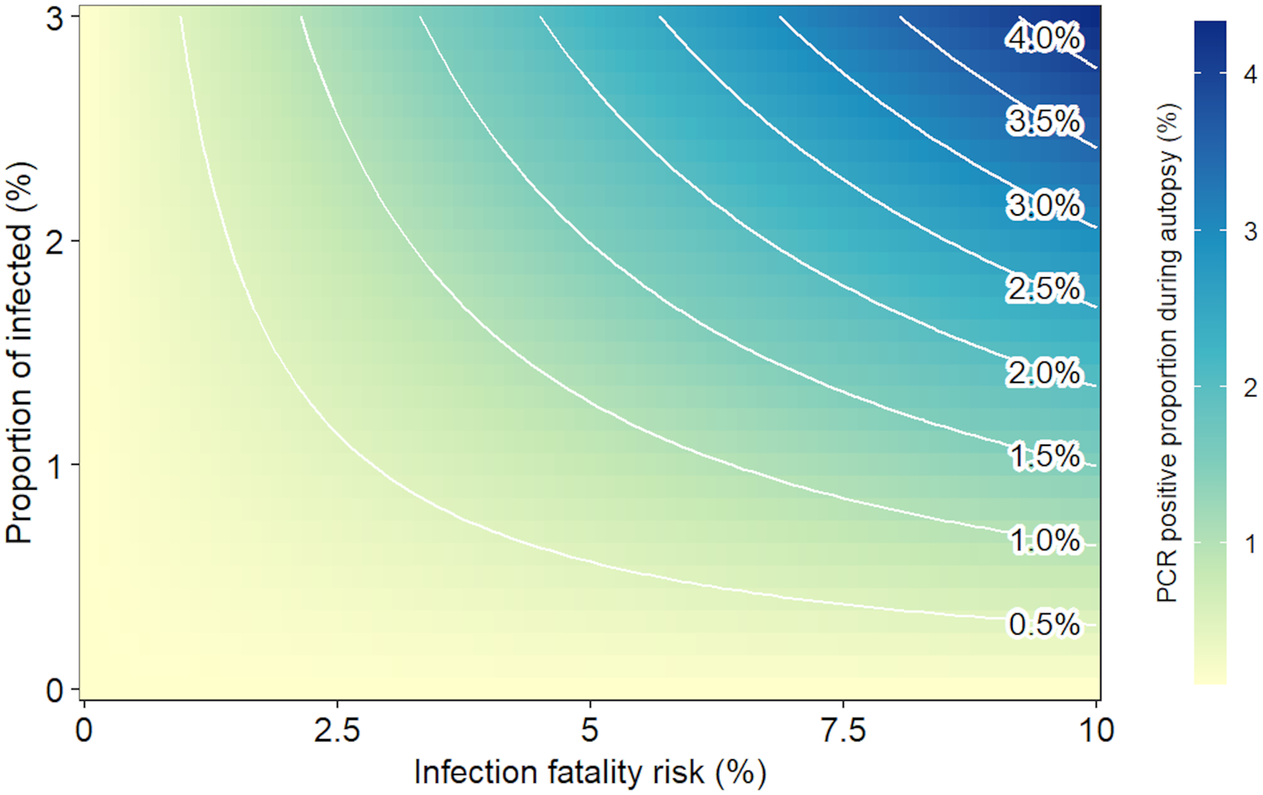
Figure 3 depicts the modelled interdependent relationships among IFR, seroprevalence, and expected RT-PCR positivity at autopsy. The expected RT-PCR positivity is positively associated with both IFR and seroprevalence. Conversely, the contours illustrate the trade-off between IFR and seroprevalence. For a given RT-PCR positivity rate, a high IFR value indicates a small seroprevalence (and vice versa).
Relationship between IFR and RT-PCR positivity during autopsies.
The horizontal axis shows the infection fatality risk (IFR), and the vertical axis shows the proportion of the population infected. The heatmap indicates the expected proportion of RT-PCR positivity at autopsy, with darker shading representing higher positivity, as shown in the colour bar. White contour lines show equal values of expected RT-PCR positivity across the heat map.

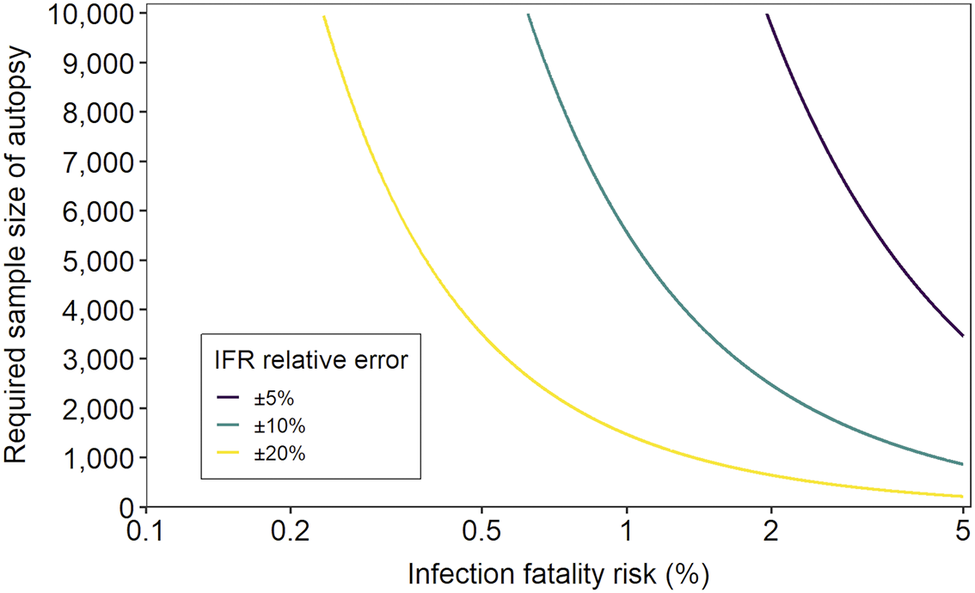
Figure 4 shows the required autopsy sample size, defined as the number of autopsies needed to estimate the IFR within prespecified relative errors of 5%, 10%, and 20%. The results indicate an inverse relationship between the expected IFR and the required sample size. As the IFR decreases, the sample size necessary to achieve the same relative precision increases rapidly, becoming very large. For any given IFR, a tighter relative error requires a substantially larger sample size than a wider error margin. For example, when the IFR is 1%, the sample sizes required to achieve relative errors of 5%, 10%, and 20% are 21673, 5556, and 1474, respectively.
Required number of deceased individuals for autopsy and RT-PCR testing to estimate the IFR within predefined relative error levels.
The horizontal axis represents the infection fatality risk on a logarithmic scale. The vertical axis represents the required number of deceased individuals for RT-PCR testing. The curves correspond to relative error margins of 5%, 10%, and 20% for the IFR estimate, shown in purple, green, and yellow, respectively.

Discussion
RT-PCR testing for SARS-CoV-2 was routinely carried out at the Tokyo Medical Examiner’s Office from 2020 to 2021. We combined these testing results with seroepidemiological data and the total all-cause death count to estimate the age-specific IFR for COVID-19 in Tokyo. The estimated age-specific IFRs increased steeply with age and were consistent with published estimates from meta-analyses and country-specific studies during the pre-vaccination period. We also characterized the relationships among IFR, seroprevalence, and expected RT-PCR positivity at autopsy and quantified the required autopsy sample size for several prespecified levels of relative error. This proposed estimation method can serve as a practical alternative approach to the conventional IFR estimation procedure (i.e., dividing observed or estimated deaths by the serologically estimated cumulative incidence of infection).
Our findings highlight the practical value of medicolegal death investigation data in assessing the severity of an emerging infectious disease. By introducing post-mortem infection data into the public health evaluation framework, we have demonstrated that the IFR can be double-checked against a conventional estimate derived from the number of COVID-19 deaths and the seroepidemiologically estimated infection size [Reference Perez-Saez8]. The direct estimation method struggles to accurately ascertain deaths, requiring either direct counting of causally evident deaths (e.g., deaths due to viral pneumonia) or indirect estimates (e.g., derived from the excess mortality estimation method). Both conventional methods and our proposed approach require seroepidemiological estimates of infection incidence. However, our method overcame the challenges of attributing deaths causally. In particular, when infection (e.g., influenza or COVID-19) makes it impossible to fully ascertain the cause of death, our alternative approach can help ensure the validity of the IFR estimate.
While the proposed method produced reasonable IFR estimates, and the age-specific IFR values were consistent with published data, indicating that COVID-19 severity in Asia, including Japan, was not intrinsically lower than in other regions [Reference Owusu-Boaitey42, Reference Miyawaki and Tsugawa43], it is vital to discuss the potential pitfalls of this approach. That is, it is essential to consider that medicolegal death investigations handle deaths following acute exacerbations and accidents; therefore, potential selection bias could yield erroneous IFR estimates. For instance, if an autopsy dataset of acute deaths included a substantial number caused by acute myocardial infarction (a known complication of COVID-19) [Reference Katsoularis44], the observed RT-PCR positivity of the sample may be greater than that of the entire population of deceased individuals, including those not autopsied. While the Tokyo Medical Examiner’s Office routinely tests deceased individuals, reducing this potential bias, the most promising remedy is to screen all deaths for SARS-CoV-2 regardless of autopsy.
In addition to measuring the overall severity of an emerging disease, the IFR is useful for assessing the probability of death among high-risk individuals (e.g., those with underlying comorbidities). Computing the age-specific IFR was not technically challenging because we were able to derive
$ P\left({A}_a\right) $
 in Equation (1), the risk of death in age group a, directly from vital statistics. Measuring the IFR
$ \Pr \left({A}_i\mid {B}_i\right) $
in Equation (1), the risk of death in age group a, directly from vital statistics. Measuring the IFR
$ \Pr \left({A}_i\mid {B}_i\right) $
 among those with comorbidity i is far more difficult. That is, the risk of death
$ P\left({A}_i\right) $
among those with comorbidity i is far more difficult. That is, the risk of death
$ P\left({A}_i\right) $
 among individuals with comorbidity i is required, and the seroprevalence estimate
$ P\left({B}_i\right) $
among individuals with comorbidity i is required, and the seroprevalence estimate
$ P\left({B}_i\right) $
 must also be stratified by comorbidity. Routinely recording underlying comorbidities on death certificates and through seroepidemiological surveys is therefore crucial, and the underlying population-level estimate of individuals with disease i should be regularly updated.
To improve pandemic preparedness, our proposed technique should be incorporated into the global public health infrastructure by systematically screening decedents to enable the use of the dataset for epidemiological purposes. Our sample size calculations indicate that even when the IFR is approximately 1%–2%, achieving tight relative precision can require tens of thousands of RT-PCR tests at autopsy. This suggests that no single jurisdiction is likely to accumulate sufficient observations rapidly during an initial wave. Accordingly, an effective strategy would combine routine pathogen testing of deceased individuals undergoing medicolegal investigation with standardized data elements and a mechanism for timely linkage and pooled aggregation across jurisdictions. Considering additional needs for datasets stratified by age and underlying comorbidities, integrating electronic health record data (e.g., to provide prevalence estimates of underlying comorbidities) and digital transformation technologies (e.g., automated identification of high-risk groups) may be key to future success, as well as to establishing an analytic pipeline for IFR computation. Furthermore, as a published study explored seroprevalence with post-mortem PCR analysis to estimate the IFR [Reference Sheppard45], our sample size calculation will be valuable for planning similar epidemiological studies.
By examining the relationship between IFR and RT-PCR positivity at autopsy, our study demonstrated that RT-PCR testing implemented within medicolegal autopsy practice can facilitate the use of observed positivity to infer a plausible range of IFR values under fixed assumptions about seroprevalence and all-cause mortality risk. This relationship is particularly useful during the early stage of a pandemic, when uncertainty about infection incidence and incomplete case ascertainment complicate direct IFR estimation.
Four limitations of the proposed approach should be discussed. First, while the sensitivity of RT-PCR and serological assays for SARS-CoV-2 is known to vary with time since infection [Reference Kucirka46, Reference Scheiblauer47], we treated RT-PCR sensitivity as fixed because data on infection timing were unavailable. Although anti-nucleocapsid (N) antibodies are known to wane rapidly, the two surveys we referenced also incorporated spike (S) protein targets, which have been shown to maintain high sensitivity and persistent detection over time [Reference Scheiblauer47]. Additionally, routine RT-PCR testing is expensive, whereas antigen testing could enable the assessment of a larger number of deceased individuals at a lower cost. Furthermore, antigen testing may not be essential when recent infection can be reasonably inferred from serological markers, such as IgM antibodies. Second, our death numerator relies on post-mortem RT-PCR, which detects SARS-CoV-2 RNA only when viral material remains present at the time of autopsy. This misclassification results in an underestimation of our estimated IFR. Third, our medicolegal data were collected from a single metropolitan area, which may limit the generalizability of the findings to settings with different demographic structures, healthcare access, epidemic timing, and medicolegal investigation practices. Seroepidemiological surveys employing a random sampling method in Japan were carried out across different survey periods and geographic regions and have reported different seroprevalence estimates compared with Sanada et al. and Yamayoshi et al. [Reference Sanada24, Reference Yamayoshi25, Reference Yoshiyama48, Reference Sugiyama49]. Fourth, although the age-specific cumulative risk of infection was derived from a seroepidemiological survey, the present framework could not account for selection bias arising from the participant inclusion process in seroepidemiological studies [Reference Ith17].
In conclusion, we estimated age-specific IFR using forensic autopsy data, and the findings highlight the practical value of medicolegal death investigation for severity assessment during an emerging pandemic. The proposed alternative approach to estimating IFR helps overcome uncertainties arising from technical difficulty in the conventional method, including ascertainment of the cause of death.
Supplementary material
The supplementary material for this article can be found at http://doi.org/10.1017/S0950268826101873.
Data availability statement
All data and code necessary to reproduce the results are available at https://github.com/Yuri-Amemiya/IFR_COVID-19_2026.git.
Acknowledgements
We thank C. J. Singleton, PhD, from Edanz (https://jp.edanz.com/ac) for editing a draft of this manuscript.
Author contribution
H.N. conceived the study idea. All authors participated in the study design. H.N. and Y.A. collected and retrieved the data. Y.A. analysed the data, and H.N. evaluated the validity of the analysis. Y.A. and H.N. jointly drafted the manuscript, including the figures and tables. H.N. edited earlier versions of the manuscript. All authors read and approved the final version of the manuscript.
Funding statement
Y.A. received financial support from the Japan Society for the Promotion of Science (JSPS) (24KJ1518). H.N. received funding from Health and Labour Sciences Research Grants (20CA2024, 20HA2007, 21HB1002, 21HA2016, and 23HA2005); the Japan Agency for Medical Research and Development (AMED; JP24fk0108685 and JP24fk0108710); the JSPS KAKENHI (21H03198 and 22K19670); the HU-RIZONT International Research Excellence Program (Rapid-GRIP project: 2024-1.2.3-HU-RIZONT-2024-00034 to H.N.); the World Health Organization; the Japan Science and Technology Agency (JST) CREST programme (JPMJCR24Q3) and the RISTEX programme for Science of Science, Technology and Innovation Policy (JPMJRS22B4).
Competing interests
The authors declare none.


 Open access

