


1. Introduction
Vibration mitigation remains a central design driver in space applications. During launch and stage separation, shock and sustained vibration can damage vibration-sensitive hardware and degrade performance (NASA GSFC, 2021). During operations, reaction wheels, cryocoolers, and thermoelastic changes introduce micro-vibrations that propagate through spacecraft structures and affect optical payloads (Reference Dennehy and Alvarez-SalazarDennehy & Alvarez-Salazar, 2018).
A potential solution is additively manufactured particle-damped (AMPD) structures. In ground tests, they show strong damping performance, reducing the modal mass increase by up to a factor of 17.9 (Reference Yu, Ehlers, Biermann, Meyer, Oel, Xia, Niedermeyer, Maalaoui, Lachmayer and LehmannYu et al., 2025), and achieving up to 70× higher damping ratios for extreme mode shapes (Reference Oel, Kleyman, Jonkeren, Tatzko and EhlersOel et al., 2025b), consistent with the idea of “damping for free” (Reference Ehlers, Tatzko, Wallaschek and LachmayerEhlers et al., 2021). Powder bed fusion using a laser beam with metal (PBF-LB/M) enables the design of sealed cavities that retain residual build powder as the granular damping medium, achieving optimal weight, stiffness, and damping through design choices such as cavity sizing and placement across the design and manufacturing process (Reference Lachmayer, Ehlers and LippertLachmayer et al., 2024).
Since AMPD particle geometry, powder size, and the manufacturing process differ from traditional particle damping structures, their behavior in microgravity is not yet well characterized. The Einstein-Elevator (EE) at the Hannover Institute of Technology (HITec) has already conducted a series of experiments under microgravity conditions (Reference LotzLotz et al., 2017; Reference Overmeyer, Raupert, Pusch, Griemsmann, Katterfeld and LotzOvermeyer et al., 2025), enabling pre-flight testing of AMPD structures under microgravity conditions. It provides up to 4 seconds of repeatable microgravity with programmable acceleration profiles (Reference LotzLotz, 2022). During each run, the input and output accelerations of the specimens are measured and estimated as power spectral densities (PSDs), so that ground characterization can be replayed under microgravity-representative inputs, and DfAM-driven cavity choices can be evaluated under comparable excitation.
During spacecraft operations, micro-vibrations are dominated by rotating subsystems such as reaction wheels and cryocoolers, and are a persistent driver of pointing and image quality limits of optical systems in microgravity conditions. Mitigation methods include source reduction, compliant mounts and tuned mass dampers, viscoelastic and wire-rope isolators, and active or hybrid stages; vacuum, thermal cycling, and radiation constrain viscoelastic materials. A recent review consolidates these methods and their limits (Reference Jiao, Zhang, Li, Wang, Ma and ZhaoJiao et al., 2023).
From a DfAM viewpoint, PBF-LB/M extends this by forming sealed cavities where residual powder acts as the granular medium, eliminating separate inserts and assembly, with friction between the powder and the cavity (Reference Ehlers, Tatzko, Wallaschek and LachmayerEhlers et al., 2021). Coupling topology optimization and load paths with embedded dissipative volumes enables stiffness routing with low part count and weight-optimized structures (Reference Oel, Roeder, Meyer and LachmayerOel et al., 2025a). Studies on additively manufactured damped specimens report frequency- and modal-shape-dependent effectiveness (Reference Oel, Kleyman, Jonkeren, Tatzko and EhlersOel et al., 2025b; Reference Yu, Ehlers, Biermann, Meyer, Oel, Xia, Niedermeyer, Maalaoui, Lachmayer and LehmannYu et al., 2025). Granular damper experiments confirm a sharp transition between gas-like and collect-and-collide regimes at a critical vibration amplitude (Reference Sack, Windows-Yule, Heckel, Werner and PöschelSack et al., 2020). Under microgravity, the removal of gravity preload changes contact boundaries, mean free paths, and collision statistics, which may shift the effective operating window of a given cavity design. Currently, no public reports on PBF-LB/M AMPD specimens tested in microgravity are available, leaving open how cavity volume and excitation level should be selected for space-relevant micro-vibration environments and how these selections should be formulated as transferable DfAM rules.
The objective of this research is to evaluate whether AMPD structures produced by PBF-LB/M differ in damping performance in microgravity compared with ground conditions, and to identify the general conditions under which ground test results can predict behavior in microgravity. The study focuses on a simple beam structure, uses a systematic cavity-variation design (cavity length and thus cavity volume) under identical outer geometry and fastening interface, combines a series of tests in the EE with ground replay based on extracted PSDs, and compares overall and band-limited transmissibility metrics to assess damping effectiveness. The goal is to determine the optimal acceleration profile, the required number of trials for confidence interval (CI) validation, and a feasible testing protocol to accelerate future design and validation for more complex AMPD geometries, with explicit links to DfAM decision variables and constraints. The scope is limited to the first bending mode, matched input PSDs, and repeatable programmable profiles to isolate the roles of cavity design and excitation level.
2. Methods
2.1. AMPD structure
The AMPD specimens are manufactured by PBF-LB/M using 316L powder on an EOS M 280, following reported cavity design rules (Reference Ehlers, Tatzko, Wallaschek and LachmayerEhlers et al., 2021; Reference Oel, Kleyman, Jonkeren, Tatzko and EhlersOel et al., 2025b; Reference Yu, Ehlers, Biermann, Meyer, Oel, Xia, Niedermeyer, Maalaoui, Lachmayer and LehmannYu et al., 2025). All specimens share the same outer geometry (exemplified in Figure 1).
AMPD specimen S2 showing the cavity position in the CAD model

S1 is fully solid, whereas S2 and S3 include cavities. S4 has the same cavity as S2 but with powder removed after manufacturing. In total, four specimens were manufactured with the specimen longitudinal axis (y-axis in Figure 1) oriented orthogonal to the build direction (printing direction), consistent with the intended DfAM constraints for powder retention and a design wall thickness of 2 mm. Table 1 lists the configurations and cavity parameters.
Figure 1 shows the cavity location in the CAD geometry of S2 with a 30 mm cavity. S2 and S3 differ only in cavity length. Cavity volume fraction and packing density are calculated following Reference Oel, Kleyman, Jonkeren, Tatzko and EhlersOel et al. (2025b) from the CAD model and the density of fully dense LPBF 316L bulk material, representing the solid regions of the printed parts and not a powder density. Packing density is defined here as the powder filling fraction inside the cavity; therefore, it is 0 for the fully solid specimen (S1) and for the specimen with removed powder (S4). Detailed specimen geometry, technical drawings, powder documentation including particle size distribution, and manufacturing machine parameters are provided in the LUIS data repository (Reference YuYu, 2025).
AMPD specimen configurations and cavity parameters

2.2. Experimental setup
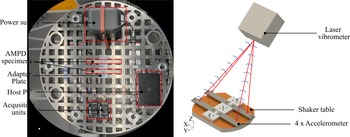
To achieve comparable boundary conditions across different testing platforms, an adaptor plate is designed to accommodate all specimens on both the EE facility and the ground shaker, as illustrated in Figure 2. The adaptor plate standardizes clamping geometry, contact area, and bolt preload, ensuring consistent constraints across both setups and reducing preparation time. Each specimen is fastened to the adaptor plate with a tightening torque of 20 Nm. The adapter plate and its positioning are shown in Figure 2 in both setups. Both setups in the EE and on the ground shaker use the same input measurement point at the center of the adaptor plate, and the outputs are measured at the free ends, using accelerometers in the EE setup and an LDV in the ground-shaker setup.
Experimental setups in the Einstein-Elevator (left) and the ground shaker (right)

Figure 2 Long description
Panel A: A circular setup with various labeled components including power supply, AMPD specimens, adapter plate, host plate, and acquisition units. The components are arranged in a specific pattern with red outlines highlighting certain parts. Panel B: A schematic diagram showing a laser vibrometer directed at a shaker table with four accelerometers attached. The laser vibrometer is positioned above the shaker table, and the setup is labeled with the axes X, Y, and Z.
For experiments at the EE facility, a typical trial consists of preparation, initial acceleration, microgravity phase, and deceleration. The microgravity (in this paper earth’s gravity
 is with 9,81
 ; microgravity is with

 ) duration is achieved by different combinations of acceleration and deceleration profiles. After the initial acceleration reaches the target level, a short microgravity phase begins. The experiment uses the elevator’s acceleration phases to introduce base excitation, which serves as the input. The EE experimental setup is illustrated in Figure 2 (left). The measurement system comprises two multichannel data acquisition units (DT9837-C) with a sampling rate of up to 105 kHz, a host PC, four single-axis accelerometers at the specimens’ free ends for output acceleration collection, and one triaxial accelerometer on the adaptor plate for input acceleration measurement.
For ground vibration testing, a separate set of tests is performed on a TV 51120-M shaker using a single accelerometer for input acceleration measurement and a Polytec PSV-400 (scanning laser Doppler vibrometer, LDV) to measure specimen output velocity with a sampling rate of 5,120 Hz. The shaker applied random excitation, sine sweeps, and steady-state sinusoidal signals to evaluate beam damping and vibrational mode shapes. The shaker experimental setup is shown in Figure 2 (right). All detailed experimental setup parameters, including data acquisition settings, are provided in the LUIS data repository (Reference YuYu, 2025).
2.3. Experiment workflow
After specimen manufacturing, Figure 3 summarizes the integrated workflow comprising FEM and LDV validation, ground shaker sweep characterization, Einstein-Elevator (EE) microgravity testing, and ground random-vibration replay driven by input PSDs extracted from EE runs. FEM-LDV is used to identify resonance frequencies and mode shapes relevant to AMPD effectiveness. Based on these results, a fixed evaluation band (200-270 Hz) with two subbands (210-230 Hz and 235-255 Hz) is defined. These bands are used consistently in all subsequent analyses to ensure comparability across platforms.
Table 2 defines the evaluation metrics and symbols used throughout the study, including the sample size N used for confidence-interval (CI) estimation. Table 3 summarizes the four workflow steps, the corresponding platforms, and the key outputs carried forward to subsequent analyses.
FEM and LDV provide an initial screening of the first two resonances and their mode shapes under the shared clamping boundary condition to verify that the cavity regions are located in displacement-relevant areas (near antinodes) for the selected evaluation band. Ground shaker sweep tests then establish the terrestrial reference within the fixed band and quantify baseline-referenced differences relative to S1. EE microgravity tests are organized into four groups defined by initial acceleration (5.3
 or 2.5
 ) and regulated gravity level (0
 or 0.5
 ). For each run, the microgravity plateau is isolated using a run-specific time window defined from the measured input acceleration profile, and summarized at the group level. Finally, measured EE input PSDs are used to synthesize random-excitation replay for shaker replay. Long replay records are segmented into windows matching the effective EE microgravity duration to quantify the relationship between 95% CI half-width and sample size N and to derive the required N for target precision.
Signal processing follows Section 2.4 (PSD estimation, FRF computation, coherence filtering, and interpolation). All raw measurement data and acquisition settings are provided in the LUIS data repository (Reference YuYu, 2025).
Experimental test flow

Evaluation metrics and symbols

Workflow key overview

2.4. Experiment algorithm
This section defines a common signal-processing and evaluation pipeline applied across all test stages. Input and output signals are expressed as one-sided acceleration PSDs estimated using Welch’s method with a Hann window, 50% overlap, and NFFT = 32,768. For random-vibration replay, the Welch segment length equals the 5 s analysis window with 0% overlap. Where required for integration and comparison, spectra are interpolated to a common linear frequency grid over the fixed evaluation band (200-270 Hz). When the response is acquired as velocity (e.g., LDV), it is converted to an equivalent acceleration spectrum via
 prior to PSD-based evaluation so that all transmissibility metrics share a consistent acceleration-PSD basis. Where FRF analysis is used, the input-output relation is computed with the H1 estimator and screened using magnitude-squared coherence, retaining only results that satisfy
 ≥ 0.90. Variance-based transmissibility is reported as
 from cumulative PSD integrals within 200-270 Hz, while the band-level and subband RMS transmissibility ratios
 and
and
 are computed from PSD ratios over the specified bands. Baseline-referenced differences relative to S1 are expressed in decibels using 20 log10 for amplitude-type ratios (e.g.,
 ,
,
 ), while power-type ratios use 10 log10 (e.g.,
 when plotted in dB). Confidence intervals are derived from repeated trials or ensembles of microgravity-length windows, with sample size N defined accordingly. A consolidated description consistent with the analysis scripts, together with the complete parameter catalogue and implementation details, is provided in the LUIS data repository (Reference YuYu, 2025).
3. Results and discussion
3.1. FEM simulation and LDV validation results
According to the FEM results, all boundary-condition variants predict stable resonance peaks near 293 Hz and 1322 Hz. Sweep-test FRFs further confirm that, under the implemented fixture and clamping, the dominant transmission features relevant to the selected evaluation band appear as a two-peak pattern 200-270 Hz for specimens S1 to S3. The first peak appears in all specimens at approximately 221 Hz. Its half-power points are typically at 220 Hz and 223 Hz, and Q ranges from 68 to 103. The peak location is stable across amplitudes and repeats. The second peak is mainly present in S3 at approximately 245 Hz. Its half-power points are typically around 243 Hz and 249 Hz, with Q being lower at about 34-46. In S1 and S2 this second peak is absent or only weakly expressed. Together, these features dominate the transmissibility within the evaluation band and suggest that cavity length changes the response primarily by redistributing modal participation rather than by shifting the first-peak frequency. The deviation between the idealized FEM peak locations and the measured features in the 200-270 Hz range is attributed to the implemented fixture and clamping compliance, which alters the effective boundary condition under test.
Figure 4 shows LDV mode shapes. Under fixed sinusoidal excitation near 215 Hz, close to the first resonance at approximately 221 Hz, the response matches the first out-of-plane (z-direction) bending mode across all specimens. Under matched input, the velocity amplitude is highest for S1 and lowest for S3, indicating that the AMPD design provides stronger damping in this mode. This ranking is consistent with particle damping, where larger dissipative volumes can reduce the response when the cavity is placed near an antinode for the excited mode (Reference Sack, Windows-Yule, Heckel, Werner and PöschelSack et al., 2020; Reference Oel, Kleyman, Jonkeren, Tatzko and EhlersOel et al., 2025b). For excitation near 1,300 Hz, the response is dominated by a higher-order mixed bending mode and couples to the fixture, introducing torsional components and velocity amplitude differences. This coupling indicates that higher-order modes are more sensitive to interface compliance and fixture dynamics, and therefore the subsequent comparative analysis is restricted to the first bending-dominated band to maintain interpretability for design decisions.
LDV scanning results for mode shapes near 200 Hz (left) and 1,300 Hz (right)

Therefore, the main RMS transmissibility band is defined as
 over 200 to 270 Hz. To capture these two peaks without overlap, two band-limited RMS transmissibility metrics are used:
 is reported for 210-230 Hz for the first peak and for 235-255 Hz for the second peak, with a separation of about 5 Hz. These bands are used in all later analyses. From a DfAM perspective, these band definitions translate the modal observations into design-relevant targets, namely suppression of the first peak without unacceptable amplification in the second peak region.
3.2. Sweep vibration shaker test
According to the high-resolution sweep vibration tests in Figure 5, S3 shows the lowest output in 210-230 Hz but a higher output in 235-255 Hz relative to S1, whereas S2 remains close to S1 with only mild shifts. This indicates a cavity-length-driven trade-off between the two subbands, consistent with the frequency- and mode-shape-dependent effectiveness reported for AMPD concepts (Reference Oel, Kleyman, Jonkeren, Tatzko and EhlersOel et al., 2025b; Reference Yu, Ehlers, Biermann, Meyer, Oel, Xia, Niedermeyer, Maalaoui, Lachmayer and LehmannYu et al., 2025). At 1
 excitation, the resonance near 220 Hz exhibits saturation, suggesting clipping or dynamic-range compression in the measurement chain; therefore, the 1
 case is used primarily as a qualitative check for nonlinearity and measurement limitations.
PSD and cumulative variance transmissibility for 200-300 Hz with 1
 excitation

Figure 5 Long description
Panel A: A line graph shows power spectral density (PSD) in units of m squared per second squared per Hertz (m^2/s^2/Hz) against frequency in Hertz (Hz). The graph includes four lines representing Input, S1, S2, and S3. The Input line is black, S1 is blue, S2 is orange, and S3 is green. The PSD values range from 10^-2 to 10^4, with notable peaks around 220 Hz and 250 Hz. Panel B: Another line graph displays cumulative variance transmissibility (T_v(f)) against frequency in Hertz (Hz). This graph also includes three lines representing S1, S2, and S3, with S1 in blue, S2 in orange, and S3 in green. The transmissibility values range from 0 to 2.5, with peaks around 220 Hz and varying trends thereafter.
Figure 6 reports baseline-referenced transmissibility changes relative to S1 with paired 95% confidence intervals (negative values indicate reduction). Across 0.2
 , 0.5
, 0.5
 , and 1.0
 excitation, S3 provides broadband reduction and strong suppression in 210-230 Hz (CIs not crossing 0 dB) but consistently amplifies 235-255 Hz. S2 shows smaller but stable improvements overall and in the first band, with only a mild increase in the second band. In design terms, S3 represents an aggressive cavity sizing option with a predictable penalty in the second band, whereas S2 provides a conservative option with reduced risk of band amplification; such trade-offs should be assessed against the expected micro-vibration spectrum and payload sensitivity with in the corresponding bands (Reference Jiao, Zhang, Li, Wang, Ma and ZhaoJiao et al., 2023).
Sweep vibration tests:
 and
and
 vs S1 with paired 95% CI

3.3. Einstein-Elevator microgravity test results
Figure 7 shows that, in microgravity, S3 exhibits a robust transmissibility reduction in the first band
 only under 0
 regulated gravity profiles (e.g., 5.3-0
 and 2.5-0
 ), with confidence intervals entirely below 0 dB. Under 0.5
 regulated gravity profiles, the confidence intervals cross 0 dB and therefore do not confirm a reduction. This sensitivity to the regulated gravity level suggests that the first-band benefit of S3 depends on powder contact and collision dynamics, which can change when gravity preload is reduced (Reference Sack, Windows-Yule, Heckel, Werner and PöschelSack et al., 2020). For S3, the second band
 increases across all profiles and remains significant, and
 is slightly negative and significant in three of the four profiles. S2 remains near the S1 baseline overall, with significant amplification in the first band (210-230 Hz) in all profiles, small, mixed changes in the second band (235-255 Hz), and
 fluctuating around 0 dB in three of the four profiles. Taken together, the microgravity results indicate that S3 retains the qualitative trade-off observed on the ground, but with reduced magnitude, whereas S2 does not reproduce the ground-based first-band reduction under the tested profiles.
EE microgravity tests:
 and
and
 vs S1 with paired 95% CI

Figure 7 Long description
Panel A: A bar graph displays the change in root mean square temperature (Delta T rms) across different conditions. The x-axis represents different mass values (5.3-0.45 g, 5.3-0 g, 2.5-0.45 g, 2.5-0.0 g), and the y-axis represents the change in decibels (dB). Two data series are shown in orange and green, with error bars indicating the 95% confidence interval. Panel B: A bar graph shows the change in temperature (Delta T k) in the frequency range of 210-250 Hz. The x-axis and y-axis are the same as in Panel A. Panel C: A bar graph illustrates the change in temperature (Delta T k) in the frequency range of 235-255 Hz. The x-axis and y-axis are the same as in the previous panels. The orange bars represent data series S2, and the green bars represent data series S3. The error bars indicate the 95% confidence interval.
Compared with Figure 6, S3 matches the sign in the first and second bands but with smaller magnitudes. S2 does not match Figure 6 in the first band and shows weaker, mixed behaviour in the second band. Regarding results robustness, the 0
 profiles show fewer CIs crossing 0 dB, indicating greater robustness. For later experiments, the 5.3-0
 profile is used as the baseline when focusing on S3 behaviour in the 210-230 Hz band. This comparison is central to the study objective, showing that ground tests predict the direction of S3 effects across bands, while microgravity reduces effect size and can change significance for smaller cavities. This motivates the subsequent replay step, which isolates excitation matching from gravity-level effects.
3.4. Random vibration shaker test results
From Figure 8, the 5.3-0
 random-replay test results are consistent with Figure 6 in trend and sign. For S3,
 is negative across 0.2, 0.5, and 1.0
 excitation levels, while
 is positive. At the same time,
 is negative, with narrower intervals than in EE microgravity in Figure 7, indicating a transmissibility reduction relative to the S1 baseline. This agreement supports the use of EE-derived input PSDs to reproduce the main terrestrial trends under controlled laboratory conditions, enabling larger sample sizes and tighter confidence bounds than available in EE runs. For S2,
 is slightly negative,
 is slightly positive, and
 is slightly negative, which matches the ground sweep results in Figure 6 in trend, but not the EE microgravity trend in Figure 7. This discrepancy suggests that S2 may be more sensitive to microgravity-specific contact conditions than to excitation matching alone, implying that PSD-matched replay may be insufficient to capture gravity-level effects when they dominate the damper dynamics in the present S2 results. All CIs exclude 0 dB except for S2
 at 0.2
 . The 1.0
 excitation level case shows the tightest intervals and the largest separation to characterise transmissibility between specimens.
Therefore, the 5.3-0
 profile at 1.0
 excitation level is selected as the baseline for the CI vs N analysis. This choice is made because
 and
and
 show consistent trends for S2 and S3, and S2 and S3 are clearly separated, as their means differ by several dB, and their 95% confidence intervals do not overlap in both subbands and in
 . The CIs are narrow and mostly exclude zero. Practically, this profile provides the most discriminative and repeatable condition for planning follow-up validation campaigns under constrained EE runtime.
Random vibration shaker tests with 5.3-0
 profile:
 and
and
 vs S1 with paired 95% CI

According to Table 4, N is the total count of non-overlapping 5 s windows needed, under the 5.3-0
 , 1.0
, 1.0
 excitation level PSD simulation, to reduce the 95% confidence interval half width of a metric to 0.5 dB or 0.3 dB. Here, N represents the number of EE-equivalent 5 s microgravity windows; in the replay analysis, N is obtained by segmenting long shaker records into non-overlapping 5 s windows. The columns “N for 0.5 dB” and “N for 0.3 dB” report the total number needed if the experiments take place in EE with the 5.3-0
 profile. As a rule of thumb for the present dataset and laboratory setup, about 15-20 windows are needed to reach 0.5 dB and at least 35-50 windows to reach 0.3 dB, with exceptions (e.g., the S2 235-255 Hz band requires as few as 3-6 windows). These trial counts can serve as planning targets to benchmark against future experimental runs and to guide the design of data acquisition and validation plans. In an engineering context, this quantifies how many EE-equivalent microgravity windows are required to resolve cavity-driven differences at a chosen precision, supporting qualification-oriented planning under limited runtime.
Required sample size (N) for 0.5 dB and 0.3 dB CI half-width (5.3-0
 profile, 1.0
 excitation level PSD)

4. Conclusion
This paper characterizes when and how ground tests can predict microgravity damping in AMPD structures, using a simple beam specimen, matched input PSDs, and programmable acceleration profiles. The study leverages a capability specific to PBF-LB/M, namely sealed cavities that retain residual build powder as the granular medium, and evaluates cavity length (and thus cavity volume) as a controlled DfAM decision variable under identical outer geometry and interface. The results are reported in four parts.
First, FEM simulation and LDV identify the first bending mode and define the evaluation band (200-270 Hz) and the analysis subbands (210-230 Hz, 235-255 Hz), which together specify the detailed test scope. These bands cover displacement antinodes identified in the measured mode shapes for the simple beam, thereby maximizing sensitivity to particle damping. The procedure standardizes the clamping interface and LDV scan settings so that comparisons between platforms remain reproducible.
Second, baseline computations with confidence intervals show stable specimen ranking and a consistent pattern: the AMPD designs tend to reduce broadband and first subband transmissibility, with a trade-off of second band amplification most pronounced for S3 and smaller for S2. This baseline provides the reference frame for interpreting all microgravity and replay results. In design terms, the results highlight a cavity-sizing trade-off across the two subbands that should be weighed against the expected micro-vibration spectrum of the target application, and can be formulated as a DfAM target: suppress 210-230 Hz without unacceptable amplification in 235-255 Hz.
Third, EE test results show a clear dependence on the acceleration profile. For the 5.3-0
 profile, the results agree with ground tests, providing evidence that for S3, profile matched ground tests predict the sign and ranking of microgravity effects. This observation helps guide profile selection and trial allocation before hardware changes. At the same time, the profile dependent significance indicates that reduced gravity can alter powder contact conditions and effect size, which is reflected by weaker and sometimes non-significant changes for S2 and should be considered when transferring terrestrial rankings to microgravity-representative cases.
Finally, ground random PSD replay reproduced the sweep patterns and yielded tighter confidence envelopes than EE microgravity. Across the replay datasets, confidence intervals were narrower than in EE, while the sweep tests remained the most precise baseline. It also quantified the trial counts for CI targets (≈20 for 0.5 dB, ≈50 for 0.3 dB) in terms of EE equivalent 5 s windows. Replay then maps EE inputs to laboratory conditions, enabling parameter studies while conserving microgravity runs.
The study shows that AMPD structures exhibit damping behavior in microgravity that is predictable from ground tests under profile matched inputs for the 5.3-0
 case, with the sign of the S3 band trade-off preserved, and within the isolated first bending band. On this basis, the paper provides a directly applicable replay protocol, recommends 5.3-0
 as the baseline profile and specifies the required sample size (number of windows) for given CI targets, offering a practical route to predict microgravity performance from ground data. All supporting data and code are provided in the accompanying dataset (Reference YuYu, 2025). The scope here is limited to a simple beam and a single bending mode. Future work will extend the approach to multimode components while retaining CI based planning.
Acknowledgement
This work was supported by: The Federal Ministry of Education and Research (BMBF) and zukunft.niedersachsen (a funding programme of the Ministry for Science and Culture of Lower Saxony, MWK, and the Volkswagen Foundation) for the research building SCALE (Scalable Production Systems of the Future) and the testing equipment “Additive Großfertigungsanlage”. The German Research Foundation (DFG) and the State of Lower Saxony for the Hannover Institute of Technology (HITec) and the Einstein-Elevator (NI1450004, INST 187/624-1 FUGB), and the Institute for Satellite Geodesy and Inertial Sensing of the German Aerospace Center (DLR-SI) for the development and provision of the experiment carrier system. The German Research Foundation (DFG), project number 495193504, for the project “Development methodology for laser powder bed fused lightweight structures with integrated particle dampers for vibration reduction”.




 Open access

