In this article, we build on the influential theoretical contribution made by the selectorate theory, and examine the empirical underpinnings of the theory with reference to two hybrid regimes. In The Logic of Political Survival, Bueno de Mesquita et al. (Reference Bueno de Mesquita, Smith, Siverson and Morrow2003) generalize previous works to create a framework in which two critical characteristics of a political system – the size of the winning coalition (W) and the size of the selectorate (S) – explain political outcomes ranging from public goods provision to the level of corruption, decision to engage in international conflict, and political survival. The promise of the theory has attracted a great deal of academic interest over the years. It is currently one of the most exciting theories in the literature, due to its simplicity, explanatory power and wide-ranging implications.
Despite Bueno de Mesquita et al.’s stated aim to devise an encompassing framework for analysis of all cases without resorting to traditional regime classifications, some researchers discuss selectorate theory with reference to existing typologies. For example, scholars focusing on authoritarian regimes have borrowed the logic underlying the theory to analyse corruption (Chang and Golden Reference Chang and Golden2010) and the propensity for conflict (Pickering and Kisangani Reference Pickering and Kisangani2010) in relation to regime subcategories (e.g. single-party, military and personalist regimes; Geddes Reference Geddes2004). However, like any other important contribution, selectorate theory has been challenged from a range of perspectives. For example, Gallagher and Hanson (Reference Gallagher and Hanson2015) question the power of the theory to explain authoritarian regimes due to its over-simplification of political dynamics. Kennedy (Reference Kennedy2009) criticizes the treatment of regimes as vectors rather than categories, among other aspects of the theory.
This debate leads to a critical issue. Under selectorate theory, most democracies (disregarding institutional differences such as presidential and parliamentary systems) are characterized by a similar W and S. Therefore, the value of the theory overwhelmingly lies in explaining the gap between democratic and authoritarian performance, which is a well-established finding in the literature. However, this greatly diminishes the implications of selectorate theory, which offers a means of studying politics beyond regime typologies (such as the labels of democracy and authoritarianism). To this end, hybrid regimes are investigated in this article to test the theory from a new perspective. If selectorate theory is found to explain policy outcomes in hybrid regimes, we have further evidence that the theory is a real step beyond regime typologies. Given the unique nature of hybrid regimes and the lack of consensus to date on conceptualizing them, selectorate theory may also offer a valuable method of regime analysis. In addition, the design of this research allows us to disentangle the effects of coalition size from those of supporter loyalty, which has rarely been done in previous works.
This article starts with a review of selectorate theory and the literature on hybrid regimes. This is followed by an outline of the research design. Next, the cases of Hong Kong and Singapore are discussed, with particular reference to their winning coalitions and selectorate. We then present the empirical results. The implications of the research are discussed in the concluding section.
SELECTORATE THEORY: A BRIEF OVERVIEW
The basic logic of selectorate theory is that the design of any political system, democratic or otherwise, can be simplified into two dimensions: S and W. S is defined as those who ‘have a government-granted say in the selection of leaders’, and W is a subset of S whose support ‘endows the leadership with political power’ (Bueno de Mesquita et al. Reference Bueno de Mesquita, Smith, Siverson and Morrow2003: 42, 51). In other words, W is the crucial group of supporters needed by a leader to retain power. It has been suggested that the ratio of W to S (W/S) and the size of W determine a wide range of policy outcomes.
According to the theory, the primary objective of leaders in every political system is to secure the support of W and remain in power. To this end, leaders suggest a mixture of public and private goods to beat the challengers’ offers. Public goods benefit everyone in society and private goods are exclusive to members of W. Each member of S supports either the incumbent or the challenger to maximize their own expected utility. It is assumed that each member of S wishes to become part of W to receive private as well as public goods.
As a result, the respective sizes of S and W have non-trivial policy implications. When W is small and S is large (a small W/S), members of W can easily be replaced, and they are likely to remain loyal to the leader to avoid missing out on private goods. This allows the leader to offer a minimal amount of public goods, since the leadership is stable. In contrast, when W is large as compared to S (a large W/S), loyalty to the leader is weaker and competition drives up the amount of resources required to form coalitions. When W is sufficiently large, the difference between public and private goods becomes smaller (because private goods are shared among members of W). As a result, leaders may shift their spending towards public goods provision to increase efficiency. On the whole, systems with small coalitions perform poorly, as leaders focus on ensuring the flow of private goods and have little reason to deliver public goods. The opposite is true of systems with large coalitions.Footnote 1
As most democratic systems are characterized by a large S (franchised voters) and a large W (a significant share of voters), selectorate theory predicts that these systems will exhibit high overall spending and high public goods expenditure. The performance of systems with a smaller S and W, such as monarchies, is likely to be varied (Bueno de Mesquita and Smith Reference Bueno de Mesquita and Smith2010). These predictions are largely consistent with the general understanding about regime types (e.g. Baum and Lake Reference Baum and Lake2001) and have been supported by a range of empirical works (Bueno de Mesquita and Smith Reference Bueno de Mesquita and Smith2010; Bueno de Mesquita et al. Reference Bueno de Mesquita, Smith, Siverson and Morrow2003; Morrow et al. Reference Morrow, Bueno de Mesquita, Siverson and Smith2008). For example, in their original contribution, Bueno de Mesquita et al. (Reference Bueno de Mesquita, Smith, Siverson and Morrow2003) test their arguments with more than 30 types of public and private goods, such as education, health care and corruption. It must be emphasized that the theory does not focus on either private or public goods, as all leaders provide both. Instead, it is suggested that the relative proportions of public and private goods change according to S and W. A larger W (thus also a larger W/S) is expected to result in better policy performance (more overall spending and more public goods relative to private goods).
Hybrid Regimes
The classification of hybrid regimes – regimes that are neither fully democratic nor outright authoritarian – has gained much theoretical interest in recent decades following events in many third-wave democracies (e.g. Diamond Reference Diamond2002; Levitsky and Way Reference Levitsky and Way2010). However, due to the distinctive nature of such regimes, no consensus has yet been reached on a system for classifying them. Focusing on electoral authoritarianism, a subtype of hybrid regime, Clark et al. (Reference Clark, Golder and Golder2012: 367) note that ‘there are almost as many different ways of classifying electoral authoritarian regimes as there are scholars working on this topic’.
Competitive/electoral authoritarianism is by far the most common type of hybrid regime. According to Levitsky and Way (Reference Levitsky and Way2002: 53), competitive authoritarian regimes violate a key criterion for democracy by creating ‘an uneven playing field between government and opposition’. Competitive authoritarianism is the third category in a typology of regimes between democracy and closed authoritarianism. Extending the logic of this framework, Diamond (Reference Diamond2002) suggests a six-part typology of regimes. Besides electoral democracy, liberal democracy and politically closed system, three types of hybrid regime are identified: competitive authoritarian, hegemonic electoral authoritarian and ambiguous.
Following this classification, given the long-standing dominance of the People’s Action Party (PAP) and its use of various means such as legal procedures to suppress oppositions, Singapore can be unambiguously regarded as a hegemonic authoritarianism regime (Clark et al. Reference Clark, Golder and Golder2012; Diamond Reference Diamond2002). Although Levitsky and Way (Reference Levitsky and Way2002, Reference Levitsky and Way2010) argue that Singapore is an electoral authoritarian system due to insufficient contestation (not competitive authoritarianism; thus a non-democracy rather than a hybrid regime), Ortmann (Reference Ortmann2011) argues that Singapore is slowly transforming from a hegemonic party-state into a competitive authoritarian system.
Other scholars interpret hybrid regimes in relation to democratic norms. Building on the traditional conception of democracy along the two dimensions of liberalization and inclusiveness (Dahl Reference Dahl1972), O’Donnell and Schmitter (Reference O’Donnell and Schmitter1986) propose a classic typology of hybrid regimes consisting of civil liberties and competitive elections. Liberal authoritarianism allows for the protection of civil liberties, but there is no meaningful electoral competition. In competitive authoritarian regimes, ruling groups are contested in elections by opposition groups, but the latter are suppressed in an environment with limited civil liberties (following Levitsky and Way Reference Levitsky and Way2002).
Of the two types of regime, liberal authoritarianism is by far the less common. According to O’Donnell and Schmitter (Reference O’Donnell and Schmitter1986), the granting of initial rights makes subsequent demands stronger. As a result, liberalization attempts often result in democracy. This is evidenced by the small number of cases in this category. Liberal authoritarianism does not even feature in the six regime types suggested by Diamond (Reference Diamond2002). Tonga, a ‘liberal autocracy with partial elective authority’, is classified as an ambiguous regime. East Timor was put in the competitive authoritarian category, despite having the same Freedom House ratings as Tonga (Diamond Reference Diamond2002: 31).
The classification of Hong Kong depends on the framework chosen. Following the latter approach, according to which hybrid regimes are conceived in terms of civil liberties and elections, Hong Kong is a liberal authoritarian system, as civil liberties in the region are largely protected by the tradition of rule of law established during the colonial era (e.g. Case Reference Case2008; Zakaria Reference Zakaria1997). Alternatively, following the typology suggested by Levitsky and Way (Reference Levitsky and Way2002) and Diamond (Reference Diamond2002), Hong Kong may also be regarded as a competitive authoritarian system (e.g. Wong Reference Wong2014).
RESEARCH DESIGN
The focus on hybrid regimes offers new avenues for testing selectorate theory. First, one of the central predictions of the theory is that democracies deliver better governance because they are characterized by large coalitions. While this prediction is largely supported by empirical evidence as noted above, separating the effects of W from those of democracy could prove to be tricky (Clarke and Stone Reference Clarke and Stone2008; Morrow et al. Reference Morrow, Bueno de Mesquita, Siverson and Smith2008). Any findings pertaining to differences between regime types may be subject to this challenge. The difficulty in distinguishing between the effects of W and the effects of democracy may be alleviated by identifying differences between cases of the same regime type.
However, even in such cases, the same challenge may be encountered at the sub-regime level. For example, although W differs in size between parliamentary democracies (one quarter of the total population for Westminster-style systems) and presidential democracies (half of the total population for directly elected presidents), the differences can be ascribed to other system-specific factors unrelated to the size of W (e.g. Gerring et al. Reference Gerring, Thacker and Moreno2009). The difficult thing, then, is that countries of the same regime subtype share similar values of W and S. Indeed, Gallagher and Hanson (Reference Gallagher and Hanson2015) note that their measurement methodology would lead to very little variation in W and S within regime subtypes, due to their reliance on codes from the Polity project (see also Kennedy Reference Kennedy2009). A focus on hybrid regimes thus provides a unique advantage, as differences in W and S are found within the same regime subtype.Footnote 2 For example, hybrid regimes with elections, as in Singapore, are characterized by a large W and a large S, which makes them empirically closer to democratic regimes. In contrast, hybrid regimes without executive elections (as in Hong Kong) have a much smaller W and S.Footnote 3
Second, the inclusion of hybrid regimes enhances our understanding of the analytical dimensions of selectorate theory. In almost all of the empirical tests reported in their original and subsequent works, the authors focus on the effects of W and W/S (Bueno de Mesquita et al. Reference Bueno de Mesquita, Smith, Siverson and Morrow2003; Morrow et al. Reference Morrow, Bueno de Mesquita, Siverson and Smith2008). They hypothesize that these two indicators (unsurprisingly) have similar effects in the same directions. However, when it comes to the size of winning coalitions, does absolute size (W) or relative size (W/S) matter more? This is a potentially important question, as the underlying dynamics of the two indicators differ. Yet this is a largely unexplored question in the literature.
If one wished to pin down the respective effects of W and W/S, it would be difficult to find cases with changes in one but not the other. Democratization, with few exceptions, involves an increase in both W and W/S through the introduction of universal suffrage. Again, hybrid regimes (insofar as they are a coherent group of cases) show variation in this regard (the same W/S with substantial differences in W). As a dominant-party system, for example, Singapore has a large S and a large W. Hong Kong, in contrast, experienced a political change that increased the size of its W while its W/S remained unchanged. Comparison of these two cases sheds light on the respective effects of W and W/S.
Case Selection
To tackle the research question with reference to hybrid regimes, a large-N study covering all hybrid regimes would also be a viable option. However, the current research design is chosen for two reasons. First, given the concerns raised about the measurement and approximation of W and S in the literature (Clarke and Stone Reference Clarke and Stone2008; Gallagher and Hanson Reference Gallagher and Hanson2015), further efforts based on the same methodologies would suffer from the same shortcomings. Focusing on two cases allows us to identify accurately the size of W and S, alleviating this concern. Indeed, Hong Kong and Singapore would have the same W and S scores if the original coding scheme were followed, yet their actual patterns are quite different (see below). Second, although hybrid regimes may be very stable, they are still more prone to state failure and instability than either democracies or authoritarian regimes (e.g. Goldstone et al. Reference Goldstone, Bates, Epstein, Gurr, Lustik, Marshall, Ulfelder and Woodward2010). A selection of two durable hybrid regimes ensures that the patterns identified are long-term and stable. These patterns are also expected to be less endogenous to the effects of institutional/regime changes and the legacies of past regimes, which can continue to exert an influence even after they have been replaced (Darden and Grzymala-Busse Reference Darden and Grzymala-Busse2006).
Hong Kong and Singapore are selected in part due to their similarity. As former British colonies, both can be regarded as ‘administrative states’, whose legitimacy derives largely from an efficient bureaucracy and the principle of meritocracy. They excelled as two of the four ‘Asian tigers’, with strong growth lasting for several decades. Unlike the other ‘tigers’, Taiwan and Korea, however, neither Hong Kong nor Singapore have gone down the path of democratization, instead remaining as hybrid regimes. As a result, these two regions are often comparatively analysed in the literature (e.g. Cheung Reference Cheung2008; Lim Reference Lim1999). The selection of Hong Kong also carries implications for the causality of the effects. In 1997, its political system underwent an exogenous change following the transfer of sovereignty from Britain to China. The new political system was designed almost exclusively by Beijing, with little input from Britain or the local people. Therefore, analysing policy outcomes in Hong Kong before and after the handover largely rules out the possibility that the results are endogenous (i.e. that policy outcomes lead to changes in W and S).
This research adopts a differences-in-differences design. As Hong Kong and Singapore are comparable cases, and W and S changed exogenously in Hong Kong while remaining unchanged in Singapore, the differences identified between the two cases before and after 1997 can reasonably be attributed to the suggested theoretical arguments. In other words, we take Singapore as a control case and examine the effects of a ‘treatment’ in Hong Kong. The key identifying assumption underlying this design is the common trends in the two cases in the absence of the treatment (Angrist and Pischke Reference Angrist and Pischke2009: 227–33). Although I attempt to mitigate this concern, it is acknowledged that this cannot be completely resolved in the current study. This will be further discussed in the conclusion.
Hypotheses and Data
Selectorate theory predicts that the provision of public goods relative to private goods will increase with W and W/S. The creators of the theory test a wide range of indicators in their original work. To facilitate comparison, I first examine four types of government spending on public goods, namely education, welfare, health care and housing. The data for Singapore are taken from the International Monetary Fund’s (2014) Government Finance Statistics database. Official statistics from Hong Kong are used (Census and Statistics Department, multiple years). The identification of private goods is less straightforward. By definition, benefits exclusive to a small group of people are difficult to observe, much less measure, on a cross-country basis. Bueno de Mesquita et al. (Reference Bueno de Mesquita, Smith, Siverson and Morrow2003) use three indicators: black market exchange rate premium, infrastructure spending and corruption. Due to a lack of suitable data on these indicators, I evaluate corruption in Hong Kong and Singapore based on the Corruption Perceptions Index (CPI) from Transparency International (2014) and the World Governance Indicators (WGI) (Kaufmann and Kraay Reference Kaufmann and Kraay2015). As explained later, housing expenditures can also be used to indirectly assess the provision of private goods.
In the next section, I will discuss the measurement of W and S in the two hybrid regimes. It should first be noted that following Hong Kong’s handover in 1997, both its W and S increased. Singapore has always been characterized by a much larger W and S than Hong Kong (albeit with a similar W/S). Assuming the effects come from W, the following hypotheses can be formulated from the theoretical arguments:
Hypothesis 1: The provision of public goods in Hong Kong relative to Singapore increased after 1997.
Hypothesis 2: The provision of private goods in Hong Kong relative to Singapore decreased after 1997.
IDENTIFYING THE SELECTORATE AND WINNING COALITION
Clearly, measuring the exact size of S and W for many countries is a daunting task. The creators of selectorate theory propose a method of approximating values of W and S using other indicators. Based on data from the Polity IV project (Marshall et al. Reference Marshall, Jaggers and Gurr2014) and Banks (Reference Banks2002), S is proxied by the status of legislature (elective, non-elective, no legislature) and W is calculated based on regime status, the competitiveness and openness of executive recruitment, and the competitiveness of participation (for details, see Bueno de Mesquita et al. Reference Bueno de Mesquita, Smith, Siverson and Morrow2003). Although the authors have repeatedly emphasized the preliminary nature of these measurements, others find them too crude and problematic to be useful (e.g. Gallagher and Hanson Reference Gallagher and Hanson2015). For example, the approximated figures for Hong Kong and Singapore are shown in Table 1. Both cases have the same S value (a full mark of 1 given the elective nature of the legislature in both countries) and W (0.75). Hong Kong’s W prior to the handover is estimated at 0.25.
Selectorate and Winning Coalition in Hong Kong and Singapore
Notes: S and W refer to the code in the original selectorate theory (Bueno de Mesquita et al. Reference Bueno de Mesquita, Smith, Siverson and Morrow2003). Refer to text for estimates of selectorate and winning coalition size. Figures as of 1997 and 2014.
* The values of S and W for Hong Kong are compiled by the author, as Hong Kong does not feature in the Polity IV dataset and the one by Banks (Reference Banks2002). S takes the value of 1 if an elective legislature is present. W receives 0.25 point each if: (i) it is a civilian regime; (ii) there is some competition for the executive; (iii) there is some openness in the recruitment process (the opportunity to participate in regularized elections); and (iv) there is competitiveness of participation (party competition and regular power transfer). For details, see Bueno de Mesquita et al. (Reference Bueno de Mesquita, Smith, Siverson and Morrow2003).
Although these figures may look reasonable, given the presumed similarity of the two cases, closer investigation reveals that the approximation fails to capture the nature of the systems, especially that of Hong Kong. This also justifies my in-depth focus on two cases.
Hong Kong
Hong Kong under British colonial rule (before 1997) has been described as a bureaucratic polity or an administrative state with no ‘politics’ (Cheung Reference Cheung2008). All of the colony’s governors, with the exception of the last, were themselves civil servants (bureaucrats and diplomats) drawn mainly from the British system. The governors were supported by a small group of administrative officers, elites who wielded great power. There were only 42 administrative officers in 1950 (governing a population of 2.4 million; Goodstadt Reference Goodstadt2009). Similarly, the Executive Council and Legislative Council were both presided over by the governor himself until the final stage of the colonial era, and the governor was always able to exert his own preferences. In effect, the two councils were built to facilitate the execution of the governor’s power rather than to provide checks and balances (see Goodstadt Reference Goodstadt2009 and Miners Reference Miners1998 for notable exceptions). The great powers conferred to the governor with minimal limits were even compared to ‘those once possessed by a King of England before the coming of democracy’ by Miners (Reference Miners1998: 69).
Therefore, it is suggested that the political survival of Hong Kong’s governors depended less on local politics than on the orders from London. In theory, the power of the governor was subject to the Crown’s pleasure, like that of all civil servants, and his appointment could be summarily dismissed based on directives from the secretary of state. In practice, although the British government and the parliament were legally permitted to enforce decisions on the colony, officials in London often sought to negotiate with the Hong Kong government to reach a compromise (Miners Reference Miners1998). According to Governor Murray MacLehose, although the Colonial Office had ultimate power, the man on the spot generally had the last word on how his jurisdiction should be governed (Li Reference Li2012: 41). Goodstadt (Reference Goodstadt2009) notes that the governors were not intimidated by the constitutional powers held by their masters. According to documental archives, both MacLehose and his successor, David Trench, expressed their dissatisfaction with growing interference from Britain, and directly resisted their nominal superiors. Trench succeeded in fending off interventions from the new Conservative government in 1970 by the possibility of his resignation (Li Reference Li2012). After a protracted struggle between London and the colonial government, Hong Kong achieved a level of political and economic autonomy unprecedented in British imperial history (Goodstadt Reference Goodstadt2009).
Given the governors’ power and their ability to fend off pressure from London, their political survival can be traced to the appointment process. For a long time, a committee within the Colonial Office was in charge of selecting and recommending candidates for senior offices – such as governors – to the secretary of state for the colonies. Prime ministers sometimes had their own preferences. Appointments were made after obtaining the monarch’s approval (e.g. Kirk-Greene Reference Kirk-Greene1999). This process remained largely unchanged despite the restructuring of the colonial services in the 1960s. Subsequently, the Dependent Territories Senior Appointment Board under the Foreign and Commonwealth Office made recommendations for appointments, and the selected candidates were confirmed by the secretary of state for foreign and Commonwealth affairs with the prime minister’s consent and the queen’s approval (Li Reference Li2012). In 1979, the Dependent Territories Senior Appointment Board was chaired by the permanent under-secretary of the Foreign and Commonwealth Office with only a handful of members, including the chief clerks of the office, senior officials related to the territory (including the former Hong Kong governor, David Trench) and representatives from the Ministry of Overseas Development (Li Reference Li2012). In sum, the selectorate for the governorship of Hong Kong consisted of no more than a dozen people in such committees, and the winning coalition comprised merely a handful of influential individuals (e.g. the secretary of state for foreign and Commonwealth affairs and the prime minister).
Compared with the situation prior to the handover, the situation after 1997 was more clear-cut, due to the existence of formal institutions. In 2012, a chief executive was nominated and elected by an Election Committee of 1,200 people. In effect, a candidate can guarantee victory by securing a majority within the Election Committee. In 2012, Leung Chun Ying was elected with 689 votes. Therefore, the estimated sizes of W and S in Hong Kong today are 600 and 1,200 respectively.Footnote 4
Singapore
As a competitive authoritarian regime since its independence in 1965, Singapore has been ruled without interruption by the PAP. Although Singapore’s elections have been described as ‘free from irregularities and vote rigging’ (Freedom House 2015), the PAP enjoys a decisive advantage in the political process, such as control over the design of the political system and gerrymandering, and shows no hesitation in suppressing opposition through various means, such as lawsuits and media attacks (e.g. Abdullah Reference Abdullah2015). This was especially the case in the early years of independence, when the PAP did everything possible to hinder opposition parties (Trocki Reference Trocki2006). The parliament had no elected opposition members until 1984, and until 2006 the PAP was always re-elected on the nomination day, as fewer than half of the parliamentary seats were contested. Although opposition parties have gradually increased their share of seats, achieving their best results in recent elections (Abdullah Reference Abdullah2015; Ortmann Reference Ortmann2015), the PAP still enjoys a comfortable majority of votes in elections and tight control of the parliament.
At the top of Singapore’s political system is the leader of the PAP, who also serves as the prime minister. The important question then concerns the true nature of W and S in Singapore. Do leaders owe their political survival to general voters, as in a competitive electoral system (large W and large S), or to intra-party politics, as in a one-party dictatorship (small W and large S)? A solid case can be made for the latter interpretation: given the virtual invincibility of the PAP, it could be argued that leaders in Singapore survive as long as they maintain the support of the Central Executive Committee of the PAP (W) while all party members have some limited influence in the process (S). According to selectorate theory, this classification positions Singapore together with other well-known one-party dictatorships, such as those of Vietnam and China. However, the electoral nature of Singapore’s (though at times less competitive) system sets it apart from these regimes. In this article, Singapore’s W and S are identified as the voters who support the ruling party and all enfranchised voters (at least half of them) respectively.
Several reasons can be provided to support this decision. First, the governance of the PAP has been at least partly accepted by the people. The absence of any serious challenge, socially or electorally, to the PAP’s dominance may reflect the ‘chronic quiescence’ of the local middle classes, elites and businessmen who have surrendered their capacity to oppose due to a their overriding emphasis on stability (Slater Reference Slater2010: 239). Wong and Huang (Reference Wong and Huang2010) also argue that Singaporeans have largely sacrificed their freedom in exchange for the PAP’s capable governance. More tellingly, representatives of the strongest opposition party, the Workers’ Party, have ironically stated that the PAP is the best party to govern Singapore, and that it should remain in office for the foreseeable future (Abdullah Reference Abdullah2015). To explain the relatively stronger performance of opposition parties in by-elections, others argue that Singaporeans do not want to ‘risk’ electing opposition parties to government in a general election, but feel able to ‘safely’ vote for them to express their dissatisfaction in by-elections (see Ortmann Reference Ortmann2014). In the past, this also induced opposition parties to avoid competing in the majority of districts in general elections in the hope that voters would support them in districts in which they did compete. In this light, it is argued that voters do make up some form of S, and that a large proportion of them opt for the rule of the PAP. Second, that the PAP uses (or abuses) other means to suppress the opposition should not affect the analysis here. Recall that the goal of selectorate theory is to interpret political systems in terms of the size of W and S. Nothing external to these dimensions (democratic/electoral quality in this case), however important, should be considered. Finally, a large W and a large S are consistent with the coding of the original contributors, who note that the higher values of Singapore might indicate ‘a more broadly based government . . . or . . . a breadth of necessary support for [Lee Kuan Yew’s] government and its programs’ than reflected by other indicators (Bueno de Mesquita et al. Reference Bueno de Mesquita, Smith, Siverson and Morrow2003: 140).
The estimated figures for W, S and W/S are presented in Table 1. To recap: the change in Hong Kong’s political system increased the absolute size of W (which is still tiny compared with that of democratic systems) but W/S remained largely unchanged. With a stable political system since independence, Singapore’s W and S have not changed (ignoring population shifts), and its W/S is the same as that of Hong Kong. The potential effect of political changes in Singapore on this classification is discussed in the concluding section.
EMPIRICAL EVIDENCE: PROVISION OF PUBLIC AND PRIVATE GOODS
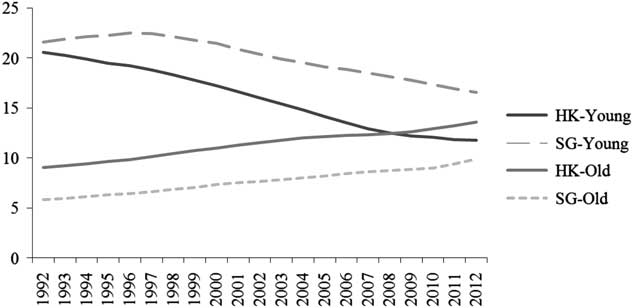
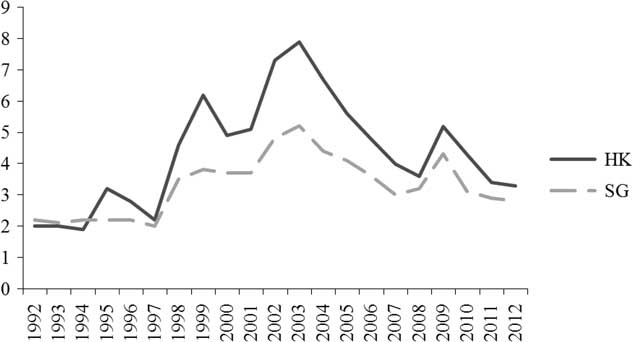
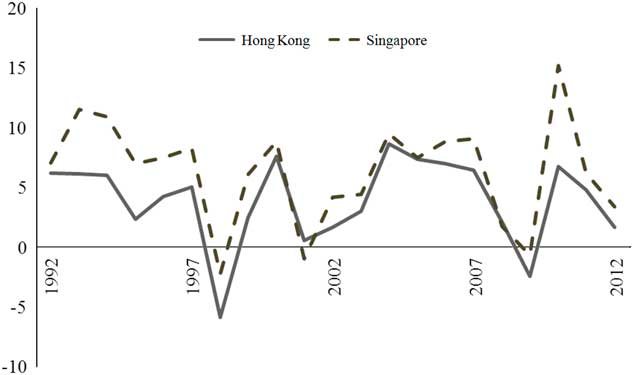
After identifying the actual S and W in the two cases, I conduct a test to determine whether the political outcomes concur with the hypotheses. First, however, it is vital to note that public spending figures change according to wider economic conditions, especially when they are calculated relative to the levels of GDP. Public spending figures are also affected by demographic factors. To examine this, the annual GDP growth rates for Hong Kong and Singapore are shown in Figure 1. Although Singapore in general enjoys stronger economic growth, the two economies exhibit very similar patterns in response to global economic events (the Asian financial crisis in the late 1990s and the global financial crisis in 2007/8). This largely rules out the concern that the differences between the two economies identified empirically below are due to changes in the global economy. Although it is not the main focus of this study, it is also interesting to note that Singapore is consistently able to deliver stronger economic growth than Hong Kong, which may be considered a public good (e.g. Bueno de Mesquita et al. Reference Bueno de Mesquita, Smith, Siverson and Morrow2003). This could also be attributed to the positive effects of a larger W. In addition to economic growth, demographic changes (the share of elderly and young people in the population) and unemployment rates are also compared in the Appendix. All of these factors show the same trends in both Hong Kong and Singapore. Although these trends are certainly not perfectly correlated (for instance, unemployment is generally higher in Hong Kong), the crucial thing here is whether systematic differences exist between the two cases before and after the treatment (1997), as such differences could invalidate the identifying assumption of the research design. In this regard, no evidence of systematic differences before and after 1997 is found.
Economic Growth Rates (%) Source: World Bank (2014).
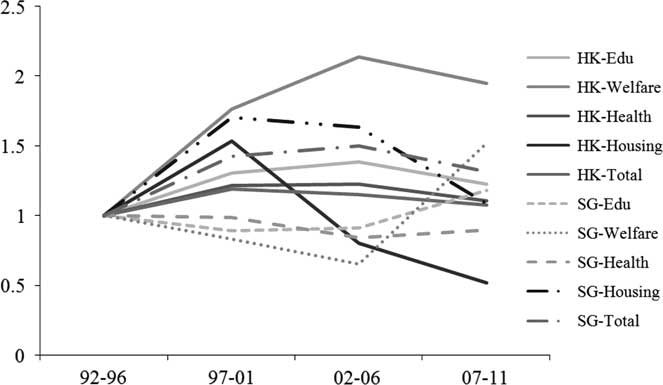
Public expenditure in Hong Kong and Singapore over time is shown in Table 2 and presented graphically in Figure 2 with the first period (1992–6) as a reference point. As these values are calculated as shares of GDP, it is first important to note that the trends in total government spending are similar: increasing from 1997 to 2006 and decreasing slightly between 2007 and 2011. Together with the similarity in economic growth rate, this indicates that the results below are robust to numerous competing explanations (e.g. that the relative increase in sectoral spending in Hong Kong is due to economic recession). Although it is true that the general increase in spending across sectors in Hong Kong is linked with higher overall spending, we do not observe the same sectoral increase in Singapore despite a similar expansion of its public sector in the late 1990s.
Government Spending by Sector (1992–6 Indexed to 1) Source: Author’s compilation based on data from Census and Statistics Department (various years) and IMF (2014). Note: HK=Hong Kong; SG=Singapore.
Total and Sectoral Government Spending (% GDP)
Source: Author’s compilation based on data from Census and Statistics Department (various years) and IMF (2014).
Regarding the provision of public goods, Hong Kong experienced a surge in average spending on education, welfare and health care immediately after 1997. This change is even more revealing given that in the same period, Singapore’s spending in these sectors dropped in GDP terms despite its similar economic conditions and increased total government spending (partly due to the recession). In addition, most of these observations can be considered long-term changes. As shown in Figure 2, the upward shift in spending in Hong Kong was fairly long-lasting, albeit with a slight adjustment in the last period (2007–11). In contrast, sectoral spending in Singapore fluctuated over time. It is argued that this change represents a permanent policy shift following the change in the design of Hong Kong’s political system in 1997, resulting in a larger W. Hypothesis 1 is thus confirmed. The only exception to this trend in both cases is housing expenditures. This anomaly is discussed in relation to private goods below.
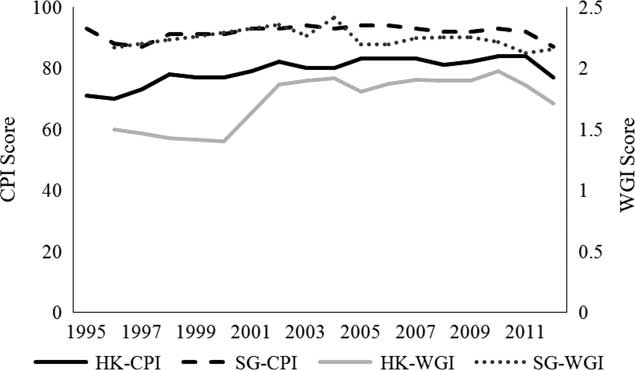
We now turn to the distribution of private goods. Hong Kong and Singapore are renowned for their lack of corruption; they are the ‘cleanest’ non-Western cases in the world. According to the CPI surveys (Transparency International 2014), Singapore has consistently ranked within the top 10 regions for corruption control, while Hong Kong ranks within the top 20.Footnote 5 Figure 3 shows the scores for the two cases (from 0 to 100; higher scores mean less corruption) over time. Corruption scores from the WGI (Kaufmann and Kraay Reference Kaufmann and Kraay2015) are used as robustness checks (from −2.5 to +2.5; higher scores mean less corruption).Footnote 6 Although Hong Kong’s control of corruption generally improved after 1997, this trend has reversed in recent years. Importantly, the ratings for Singapore are very similar to those for Hong Kong. This may reflect changes in general impressions of East Asian economies within the international community. In addition, as the data series begins in 1995, it is very difficult to compare meaningfully variations before and after 1997. These findings do not support Hypothesis 2.
Corruption Perception Scores and Rankings Sources: Transparency International (multiple years) and Kaufmann and Kraay (Reference Kaufmann and Kraay2015). Note: HK=Hong Kong; SG=Singapore.
Nevertheless, some observations supporting selectorate theory can be made. As an exception to the general increase in public goods in Hong Kong, housing expenditure decreased continuously after an initial surge between 1997 and 2001, eventually reaching half of its original level. The surge immediately after the handover was the result of an ambitious housing project suggested by the first chief executive. However, this project was abandoned within a few years due to the recession, and perhaps more importantly, due to the strong opposition by real estate conglomerates, which wield great power in the post-1997 political system because of their institutionalized access to the Election Committee and legislature (Fong Reference Fong2014; Goodstadt Reference Goodstadt2009). The abandonment of the project was regarded as a major concession to property developers and banks (e.g. Cheung Reference Cheung2000; Wong Reference Wong2015). Events played out almost exactly according to the logic of selectorate theory. With an increase in W and S, the chief executive allocated more spending to public goods, such as housing. Yet this was quickly retracted as the provision of housing adversely affected the benefits enjoyed by the core members of S. It could be argued that private goods were distributed to this group of political elites in the form of a cutback in public housing expenditure. In addition, the abandonment of the policy against the chief executive’s wishes partly rules out the explanation that policy outcomes were mainly driven by individual governing style. Although chief executives are able to exert their preferences, they are likely to be overwhelmed by their supporters’ wishes in due course.
However, this explanation fails to account for the changes in housing expenditures in Singapore. Despite the many similarities between the two cases, differences such as this can be attributed to the distinct governing strategies. For instance, although both Singapore’s and Hong Kong’s governments have long been considered advocates of the laissez-faire approach, Hong Kong unprecedentedly took action in response to the Asian financial crisis by investing in the stock market and suspending land sales, whereas Singapore’s government refrained from intervening and reaffirmed its commitment to market liberalism. Lim (Reference Lim1999) suggests that the relative autonomy of the state from the local private sector and the electoral accountability of the government allowed Singapore to stick with its open market policy. Singapore’s leaders can thus be said to be better equipped (with a large W and S) to resist pressure from the business community. In contrast, due to the much smaller W and S in Hong Kong, business elites’ institutionalized access to power may substantially affect policy trajectories (e.g. Cheung Reference Cheung2000; Fong Reference Fong2014). The intervention of the government was closely related to, and directly benefited, Hong Kong’s economic elites, especially property tycoons (Wall Street Journal 14 September 1998; Lim Reference Lim1999; Wong Reference Wong2015). The trajectory from coalition formation to political outcome is discussed in greater detail below.
All in all, the empirical support for Hypothesis 2 is weak at best. Recall that whilst Hong Kong’s W and S have increased, W/S has remained the same over time. This leads to one of the contributions of this article. Disentangling the effects of W from those of W/S reveals that public goods increase as a direct result of a larger W. However, the distribution of private goods does not seem to be majorly affected. This is, of course, mainly due to the difficulty in identifying and measuring private goods, but it is also possible that private goods are more closely connected to W/S (which is unchanged in both cases here) than to W. As W/S is an indicator of the ‘loyalty norm’, the allocation of private goods may only change when the formula for forming W changes. This also has implications for the relative strength of the mechanisms of coalition size and loyalty.
From Coalitions to Political Outcomes
To supplement the patterns demonstrated above, I now investigate the mechanism linking coalition size with political outcomes in Hong Kong. The marked effects of the shift away from colonial rule in 1997 are recognized by Cheung (Reference Cheung2000), who identifies a ‘new interventionism in the making’. Specifically, the design of Hong Kong’s new political institutions was one of the main factors leading to greater state intervention. As opposed to the self-initiated and endogenous policy reforms prior to 1997, the actions of the post-colonial state are influenced by exogenous factors, such as changing institutional and political conditions (Cheung Reference Cheung2000). This reflects difference in the underlying logic of state intervention with a small coalition (W) during the colonial era and with a larger coalition today. Extending this idea, Ma (Reference Ma2016) argues that the increase in state involvement is sectoral. As the post-1997 political institutions have been functionally designed (representing different sectors), each sector lobbies for preferential treatment. Although the business sector has surely obtained the lion’s share of the benefits in this process (e.g. tax reduction), labour and social welfare groups have also received some concessions such as a minimum wage and an improvement to the education system (Ma Reference Ma2016: 13–15). In line with selectorate theory, as the post-colonial government has to please more stakeholders to stay in power, overall government spending has increased to supply various public goods across sectors. This explains the empirical pattern observed above.
With the increased intervention of the Hong Kong government, the rhetoric of business–state collusion has become ever more popular. Therefore, it may be surprising that private goods provision has remained roughly the same. There are several possible reasons for this finding. First, post-colonial governance may be more similar to colonial governance than generally assumed, as the colonial government sometimes prioritized the interests of foreign (especially British) firms (Goodstadt Reference Goodstadt2009; Miners 1998). Although state–business collusion/cooperation was seldom considered a problem prior to the politicization of Hong Kong society, it is very likely that businesses in the colonial era received a supply of private goods, given their influence and position within the system.Footnote 7 It is thus plausible that the level of private goods provision has not changed, despite the handover.
Second, based on the analysis above, it is suggested that private goods (measured by corruption) are affected by W/S, which is the degree of loyalty in the system. As W/S is unchanged, no surge in overall corruption is observed. This dynamic could also be reflected by some recent events relating to the chief executive. In 2012, the chief executive election was a contest between two pro-Beijing candidates (the third candidate from the opposition had no realistic chance of winning), with Henry Tang as the obvious frontrunner, receiving strong support from major tycoons such as Li Ka-shing (Wong Reference Wong2015). However, during the run-up to the election, Tang was hit by a series of scandals and his popularity plummeted. Leung eventually won the election, with a majority of 689 in the 1,200-strong Election Committee. It is precisely because W/S was relatively large (and the loyalty norm relatively weak) in this system that such a rapid shift in supporter allegiance and the formation of a new coalition occurred. Arguably, this mechanism goes some way towards keeping leaders in check. Another example is the recent prosecution of ex-chief executive Donald Tsang for misconduct and graft. Although some argue that the case was politically motivated (Ming Pao 9 October 2015), Tsang’s prosecution would not have been possible had the group of patrons who supported Tsang been the coalition that backed the current chief executive. Again, the weak loyalty norm was at work. Needless to say, the inferences here are somewhat speculative, but they do offer insights into the pathway from coalition formation to political outcomes. More in-depth discussion must be left for future research.
CONCLUSION
In this article, selectorate theory is used to explain public and private goods provision in two hybrid regimes, Hong Kong and Singapore. Despite the popularity of the theory, Gallagher and Hanson (Reference Gallagher and Hanson2015) argue that it offers a ‘blunt instrument’ for understanding authoritarian rule. Other scholars borrow certain elements of the theory while also retaining regime typologies (e.g. Chang and Golden Reference Chang and Golden2010). These developments highlight the plight of theoretical development in comparative politics. As a primary goal of selectorate theory is to simplify politics and provide an ‘inherently continuous conceptualization of institutions’ that permits comparison across all regimes (Bueno de Mesquita and Smith Reference Bueno de Mesquita and Smith2010: 937), accounting for regime typologies not only challenges the theory but partially defeats its purpose.
This research contributes to the literature in several major ways. The analysis of hybrid regimes opens up new ways of understanding selectorate theory. First, as previously noted, the theory is subject to ongoing debate, as it attempts to abstract away political institutions and traditional regime typologies. The utility of the theory is greatly reduced if regime typology is still the dominant factor (e.g. the classification of authoritarian regimes), or if empirical results rest mainly on the identification of democratic effects. Therefore, a focus on hybrid regimes tests the theory beyond the democratic–authoritarian dimension. It also rules out competing regime-based explanations, as the classification of hybrid regimes is still underdeveloped, let alone the policy effects associated with each subtype.
Second, this research offers an empirical contribution to selectorate theory. In Bueno de Mesquita et al. (Reference Bueno de Mesquita, Smith, Siverson and Morrow2003), W and W/S are discussed and analysed synonymously (same directions of effects, etc.), despite their different theoretical underpinnings. In a response to an empirical critique, the authors replicate all of the major tests with W but not W/S (Morrow et al. Reference Morrow, Bueno de Mesquita, Siverson and Smith2008). These are understandable simplifications: after all, a change in W will directly result in a change in W/S in the same direction, all else being equal. However, by leveraging a political change in Hong Kong in 1997, this study tests a distinctive setting in which both W and S increased while W/S remained roughly the same. This enables us to separate the effects of W and W/S. I find that public goods in Hong Kong increased with W, but private goods were unaffected, as W/S did not change. Applying this logic to other cases may deepen our understanding of the dynamics of coalition formation, supporter loyalty and the incentives of political leaders.
Third, the measurement of S and W for every regime is far from straightforward as it requires in-depth knowledge of each case. In the original project, the use of regime indicators (e.g. the openness of elite recruitment from Polity) to facilitate coding is acknowledged to be a ‘crude and primitive’ way (Bueno de Mesquita et al. Reference Bueno de Mesquita, Smith, Siverson and Morrow2003: 133). Whilst this method is of course necessary for large-scale cross-national comparisons, it lacks precision and overlooks important dynamics not captured by the indicators, as reflected by the coding of the two cases discussed above. According to Clark et al. (Reference Clark, Golder and Golder2012: 388), scholars from the original project have begun to measure S and W using expert surveys. This article contributes to this effort by providing initial estimates of the changes in the size of S and W over time in Hong Kong and Singapore.
In this study, Singapore is considered a static case, whereas Hong Kong is analysed dynamically. It is not my intention to suggest that there has been no change in the Singaporean political scene. It is widely agreed that the electoral dominance of the PAP has gradually been eroded (Abdullah Reference Abdullah2015; Ortmann Reference Ortmann2011, Reference Ortmann2015). In what is regarded as a landmark election in 2011, the PAP won just over 60 per cent of the votes, its lowest ever. Although the PAP remains in power with a comfortable edge over its oppositions, it is no longer viewed as invincible. Yet, from the perspective of selectorate theory, which focuses only on formal institutions, the basic political structure and the dynamics of coalition building in Singapore have remained unchanged over time.
However, the theory may offer some insight into Singapore’s future political development. Bueno de Mesquita and Smith (Reference Bueno de Mesquita and Smith2010) consider the possibility of threats from outside the system (e.g. a popular uprising), a factor missing from the original theory. In the case of an external threat, leaders have to not only maintain the loyalty of their coalitions, but also dissuade people from rebelling. This can be achieved either by improving the provision of certain public goods, such as welfare, to pacify ordinary citizens, or by suppressing freedom and blocking communication channels to decrease the likelihood of a successful revolution (Bueno de Mesquita and Smith Reference Bueno de Mesquita and Smith2010). Thus far the PAP has used both strategies to keep a firm grasp on power. The electoral success of the PAP in the past can be attributed directly to its fulfilment of promises of material welfare (Wong and Huang Reference Wong and Huang2010). However, in a modern globalized economy, electoral success also depends on external factors such as the wider economic environment. When discontent surfaced due to social problems such as rising income inequality and housing prices, the PAP seemed no longer to be invincible, as indicated in the 2011 election. The weakening of the PAP hegemony is reflected not only in the stronger electoral results of the opposition, but also in the rise of civil society coalitions and the greater willingness of the government to reach compromises with political activists (Ortmann Reference Ortmann2015). Comparison of the effectiveness of these two channels suggests that the PAP’s political survival is due primarily to its capacity to control civil society, especially in times of economic difficulties. On the other hand, it can be said that Hong Kong is experiencing the same difficulty. As its basic political structure has remained unchanged in the post-1997 period (same W and S), the pressures for liberalization and greater electoral competition, as reflected by political instabilities and the recent Umbrella Movement, are also huge challenges faced by the regime.
Finally, besides the assumption of a static system in Singapore, another limitation of the research design is the analytical strategy, namely the differences-in-differences method. As the two cases are selected for the opportunity to compare a control case (Singapore) with a treatment case (Hong Kong), due to the latter’s exogenous institutional change in 1997 the results cannot be tested statistically. According to the creators of selectorate theory, the predictions of the theory are central tendencies instead of absolutes (Morrow et al. Reference Morrow, Bueno de Mesquita, Siverson and Smith2008: 394). Whilst the hypothesized effects are confirmed by most indicators in large-N cross-sectional statistical tests, the same results are less likely to hold in a longitudinal case study, due to potential confounding factors. Therefore, I attempt to preclude as many alternative explanations as possible (e.g. socioeconomic background, responses to the Asian financial crisis, personal leadership style).Footnote 8 Nevertheless, as these possibilities cannot be exhausted, the results reported should be interpreted with caution. Given the potential of testing selectorate theory with hybrid regimes in this article, a follow-up large-N statistical study of this group of cases along the same lines should be fruitful.


Acknowledgements
I would like to acknowledge the generous support of the Seed Funding Programme for Basic Research provided by the University of Hong Kong.