

Much work in cognitive ageing has investigated the structure of the ageing process. It has asked whether there are general ageing effects that occur across many different domains of cognitive and sensory ability (e.g., Baltes & Lindenberger, Reference Baltes and Lindenberger1997; Lindenberger & Baltes, Reference Lindenberger and Baltes1994), whether cognitive declines are also associated with declines in physical functions, and whether individuals with higher levels of cognitive and physical function earlier in life tend subsequently to age more healthily (e.g., Boyle, Buchman, Wilson, Leurgans, & Bennett, Reference Boyle, Buchman, Wilson, Leurgans and Bennett2009). In this study, we use data from a longitudinal, narrow-age cohort study to provide new evidence on the relations between declines in cognitive and physical functions during the eighth decade of life.
Many cognitive functions such as memory, reasoning, and processing speed show substantial declines in later life (Salthouse, Reference Salthouse2004). Evidence from longitudinal studies indicates that much of the variation in these declines is shared (that is, there is evidence for a latent, general factor of cognitive change, analogous to the latent, general ‘g’ factor of cognitive ability level that has been studied extensively for the past century; Carroll, Reference Carroll1993). For example, a study of over six thousand participants by Ghisletta, Rabbitt, Lunn, and Lindenberger (Reference Ghisletta, Rabbitt, Lunn and Lindenberger2012) showed that 66% of cognitive changes were shared across twenty different cognitive tasks, assessed across multiple years (see also Hertzog, Dixon, Hultsch, & MacDonald, Reference Hertzog, Dixon, Hultsch and MacDonald2003; Lindenberger & Ghisletta, Reference Lindenberger and Ghisletta2009; Reynolds, Gatz, & Pedersen, Reference Reynolds, Gatz and Pedersen2002; Tucker-Drob, Reference Tucker-Drob2011a,Reference Tucker-Drobb; Tucker-Drob, Briley, Starr, & Deary, Reference Tucker-Drob, Reynolds, Finkel and Pedersen2014; Tucker-Drob, Reynolds, Finkel, & Pedersen, Reference Tucker-Drob, Briley, Starr and Deary2014; Wilson et al., Reference Wilson, Beckett, Barnes, Schneider, Bach, Evans and Bennett2002).
In a recent analysis of data from the same narrow-age cohort considered in the current report, we found that a general factor of change in six-year changes in 13 cognitive tests comprising visuospatial, crystallized, memory, and processing speed domains explained 48% of the variance across all the tests. A further 26% of variance was explained at the domain level, and 26% was explained at the level of the individual tests (Ritchie et al., Reference Ritchie, Tucker-Drob, Cox, Corley, Dykiert, Redmond and Deary2016). These proportions correspond closely to those from an analysis of changes in abstract reasoning, spatial visualization, episodic memory, and processing speed, in an independent longitudinal study of an age-heterogenous sample of adults by Tucker-Drob (Reference Tucker-Drob2011a): 39% of the variance in change was domain-general, 33% was domain-specific, and 28% was test-specific. Overall, then, there is compelling evidence that a substantial portion of the variance in cognitive decline is general: to use the phrasing of Rabbitt (Reference Rabbitt1993), to a substantial extent “it all goes together when it goes”.
In its original conception, the ‘common cause’ theory posited that general declines might occur across both cognitive and more basic sensory functions (Lindenberger & Baltes, Reference Lindenberger and Baltes1994). More recently, some authors have gone further, suggesting commonalities in the declines of cognitive functions and general physical functions such as handgrip strength (which declines with age on a broadly similar trajectory to cognitive tests; e.g., Dodds et al., Reference Dodds, Syddall, Cooper, Benzeval, Deary, Dennison and Sayer2014). Initial tests relied on cross-sectional data, which are only able to make inferences about shared variance among levels of individual differences and similarities in mean age trends (Lindenberger, von Oertzen, Ghisletta, & Hertzog, Reference Lindenberger, von Oertzen, Ghisletta and Hertzog2011). For instance, in a cross-sectional study of 374 participants aged over 70 years, Christensen, Mackinnon, Korten, and Jorm (Reference Christensen, Mackinnon, Korten and Jorm2001) found that a latent factor could be estimated from cognitive tests and physical measures such as grip strength and lung function (that is, they shared common cross-sectional variance), and that this factor was negatively associated with age (that is, age had effects on the cognitive and physical measures’ common variance). However, a systematic review of thirty-six longitudinal studies that have included both cognitive and physical measures (though not all with both variables measured longitudinally; Clouston et al., Reference Clouston, Brewster, Kuh, Richards, Cooper, Hardy and Hofer2013) found only modest evidence for a cognitive-physical common cause: only two of the studies had both longitudinal cognitive and physical data, and although they both reported significant coupled change in these functions, the correlations were small. This was not judged to be strong evidence in favour of a common cause.
Some of the other findings from the systematic review by Clouston et al. (Reference Clouston, Brewster, Kuh, Richards, Cooper, Hardy and Hofer2013) could be recast as evidence for a bodily ‘reserve’ hypothesis, analogous to the original conception of ‘cognitive reserve’. Cognitive reserve was originally proposed as a theory of ‘differential preservation’ (Salthouse, Babcock, Skovronek, Mitchell, & Palmon, Reference Salthouse, Babcock, Skovronek, Mitchell and Palmon1990): individuals with higher levels of ‘reserve’ were hypothesized to have more resilient nervous systems conferred upon them by early-life factors such as education, and were predicted to have slower rates of later-life cognitive decline (Stern, Reference Stern2002). However, newer evidence has cast doubt on this idea, finding that whereas education might affect the level of later-life cognitive ability—meaning that more highly-educated individuals begin their decline from a higher point (and thus lose functional independence later in life)—it does not appear to alter the rate of decline from that point (Tucker-Drob, Johnson, & Jones, Reference Tucker-Drob, Johnson and Jones2009; Zahodne et al., Reference Zahodne, Glymour, Sparks, Bontempo, Dixon, MacDonald and Manly2011). Nevertheless, translating this reserve theory to the realm of physical functions and cognitive decline, it is of interest to test whether physical fitness is related to differential preservation of cognitive ability, and vice versa. In the systematic review, Clouston et al.’s (Reference Clouston, Brewster, Kuh, Richards, Cooper, Hardy and Hofer2013) survey of longitudinal studies suggested evidence that higher levels of baseline walking speed—but not grip strength or lung function—were protective against subsequent cognitive decline. They noted, however, that fewer studies had tested the converse association: that is, whether baseline cognitive ability was related to subsequent physical decline. One of the objectives of the present study, then, is to address this gap in the literature.
Before proceeding, there are two important points to note regarding the ‘common cause’ and ‘reserve’ concepts. First, the two ideas are not mutually exclusive: a common ageing process that has effects on cognitive, physical, and other functions could conceivably be mitigated by pre-existing system reserve. Evidence for one proposition is not necessarily, therefore, evidence against the other. Second, the factors that promote ‘cognitive reserve’ are normally thought of as having their influences early in the lifespan. Thus, any study that seeks to test the idea with data beginning late in the lifespan, as we do with our analysis of physical functions as ‘reserve’ (though not with our analysis of cognitive ability as ‘reserve’, for which we had childhood data), must make the assumption that higher levels of physical or cognitive functioning in later life indicate, at least to a degree, traits that are at least moderately stable across the lifespan. There is, importantly, evidence to support this assumption for cognitive traits (Deary, Pattie, & Starr, Reference Deary, Pattie and Starr2013; Tucker-Drob & Briley, Reference Tucker-Drob and Briley2014), but true lifespan-length longitudinal studies of physical functions are lacking.
The present study
Overall, a review of the previous literature highlights the need for more studies investigating the relation between cognitive and physical functions. Such evidence would shed further light on ‘common causes’ and ‘reserve’ in ageing. We tested three main hypotheses (and one subsidiary analysis) relating to this physical-cognitive link in a longitudinal dataset where measurements of both cognitive abilities and physical functions were taken at ages 70, 73, and 76 years.
First, we tested for the existence of a general factor of physical change among three physical functions (grip strength, lung function, and walking speed) across the three waves (six years). This extends our previous work on the general factor of cognitive change (Ritchie et al., Reference Ritchie, Tucker-Drob, Cox, Corley, Dykiert, Redmond and Deary2016). If there is a ‘common cause’ at work in physical functions, we should expect to see correlated within-individual decline in the three measures.
Second, we tested whether these physical changes could be predicted by baseline fluid intelligence (g f ), and vice versa. The design of our study allowed us to use a measure of intelligence taken at age 11 as a predictor in one of our analyses. If the concept of ‘reserve’ applies here, we would expect that individuals with higher baseline levels of general cognitive ability should see less steep declines in physical function (either general physical function, if the first hypothesis holds, or specific physical functions, if it does not). We should also expect to see the converse association: better physical function at baseline should predict healthier cognitive ageing.
Third, we tested whether later-life physical function changes (either general or specific) were correlated with changes in fluid intelligence. If the ‘common cause’ hypothesis holds, we would expect to see consistent coupled changes in physical and cognitive markers, since the same domain-general ageing processes should be acting upon both.
Finally, as a subsidiary analysis, we repeated the tests of the second and third hypotheses, but included, alongside the fluid intelligence factor, a psychophysical measure of cognitive processing speed, ‘inspection time’. Speed has been hypothesized as a more ‘basic’ indicator of the cognitive ageing process (Ritchie, Tucker-Drob, & Deary, Reference Ritchie, Tucker-Drob and Deary2014; Salthouse, Reference Salthouse1996), and may thus be biologically ‘closer’ to the ageing processes hypothesized to be the ‘common cause’ of cognitive and physical ageing. In addition, cognitive processing speed may be of particular relevance as a marker of bodily ‘reserve’, because of the finding that it mediates the association between early-life cognitive ability and longevity (Deary & Der, Reference Deary and Der2005). We chose the inspection time measure specifically because it is near-unique among cognitive processing speed measures in that it tests speed of visual discrimination at increasingly short presentation times, such that it involves no speeded physical movements on the part of the participant, and thus is not subject to method-based confounding in its relations with the physical functions.
Method
Participants
The Lothian Birth Cohort 1936 (LBC1936) is a longitudinal cohort study of ageing based in the Edinburgh and Lothians area of Scotland, UK (Deary et al., Reference Deary, Gow, Taylor, Corley, Brett, Wilson and Starr2007; Deary, Gow, Pattie, & Starr, Reference Deary, Gow, Pattie and Starr2012). After sitting a test of intelligence, the Moray House Test No. 12, in 1947 at the age of 11 as part of a nationwide survey (Scottish Council for Research in Education, 1949), 1,091 cohort members (543 female), all of whom were living in the community, were followed up for a first wave of old-age cognitive and physical testing in 2004–2007, at a mean age of 695 years (SD = .83). 866 (418 female) returned for a second wave in 2007–2011, at a mean age of 72.5 years (SD = .71). 697 (337 women) returned for a third wave in 2011–2014, at a mean age of 76.3 years (SD = .68).
Measures
Physical function measures
Professional nurses made three measurements of physical functions when the cohort members visited a research facility for their testing wave. First, forced expiratory volume in 1s (FEV1), to measure lung function, was assessed using a Micro Medical Spirometer. The best of three attempts was used as the variable in the present study. Second, the participant’s time to walk 6m along a corridor was recorded on a stopwatch (the variable was reversed so that higher scores indicate better performance, and it is referred to as ‘walking speed’ for the remainder of this report). Finally, grip strength in both hands was assessed using a North Coast Hydraulic Hand Dynamometer. For the current study, we took the best grip strength score in the participant’s dominant hand from three attempts. All three physical function measures were adjusted for age (in days on the day of the tests), sex, and height (measured on the same day as the test).
Psychometric cognitive tests
The Moray House Test No. 12, completed by our participants at age 11, is a group test of general intelligence that has been validated against individually-administered IQ tests (Deary et al., Reference Deary, Simonotto, Meyer, Marshall, Marshall, Goddard and Wardlaw2004). It includes items covering a variety of cognitive abilities, with a weighting towards verbal reasoning. The participants were administered a wide-ranging battery of cognitive tests in later life; for the purposes of the present study, we selected four tests to indicate fluid intelligence (g f ). These were Matrix Reasoning, Block Design, Digit Span Backward, and Letter-Number Sequencing from the Wechsler Adult Intelligence Scale, 3rd UK Edition (WAIS-IIIUK; Wechsler, Reference Wechsler1998). These test visuospatial reasoning and working memory, and so are indicators of the ‘fluid’ cognitive functions known to decline in later life (Salthouse, Reference Salthouse2004).
Psychophysical test: Inspection time
For the subsidiary analysis, we also included a test of Inspection Time (described in detail by Deary et al., Reference Deary, Simonotto, Meyer, Marshall, Marshall, Goddard and Wardlaw2004), a psychophysical measure in which participants had to respond with one of two choices to a figure that was shown on a computer monitor screen for a variety of durations (15 durations ranging from 6 to 200ms), then immediately masked. No speeded responses were required; participants could take as long as they wished to respond to each of the 150 trials (10 at each duration). The variable used in our analyses was the total number of correct responses.
All cognitive tests, including the childhood intelligence test, were adjusted for sex and age in days at the time of testing.
Statistical analyses
We analyzed the three waves of cognitive and physical data using multivariate latent growth curve models (McArdle, Reference McArdle2009). Growth curve models allow the calculation of latent intercept (or baseline level) and slope (change) factors from multiple waves of measurement of a single test. These variables can then be correlated with one another and, in a multivariate model, correlated with the equivalent variables from other measurements (in this case, between cognitive and physical variables). Specifically, we can estimate four types of correlation: (a) ‘level- level’ correlations, indicating the extent to which the level of one variable at baseline correlates with that of another; (b) ‘level-slope’ correlations, indicating the extent to which the baseline level of one variable predicts subsequent change in another; (c) ‘slope-slope’ correlations, indicating the extent to which the variables show coupled change with age; and (d) covariate correlations, indicating the extent to which a covariate from outside the growth curve (in the present study, age 11 intelligence) associates with the growth curve factors. A simplified model diagram is shown in Figure 1. All modeling was performed using Mplus v7.3 (Muthén & Muthén, 1998–Reference Muthén and Muthén2014).
Simplified diagram of the latent growth curve model used in the present study. This diagram shows g f changing alongside one physical function variable (forced expiratory volume, FEV), but the full model also included growth curves formed from walking speed and from grip strength. Other abbreviations: L-L: level-level correlation path; L-S: level-slope paths; S-S: slope-slope paths; MR: Matrix Reasoning; BD = Block Design; DB: Digit Span Backward; LNS: Letter-Number Sequencing.

Results
Descriptive statistics for each measure at each wave, along with a correlation matrix, are provided in Table 1. The longitudinal changes in each of the physical functions are illustrated in Figure 2, and the longitudinal changes in the cognitive tests in Figure 3. As expected, by the third wave of the study there had been significant declines in g f (−0.05 SDs per year; 3-wave z = −3.39, p < .001), in forced expiratory volume (−0.07 SDs per year; 3-wave z = −22.53, p < .001), in walking speed (−0.17 SDs per year; 3-wave z = −14.47, p < .001), and in grip strength (−0.03 SDs per year; 3-wave z = −8.94, p < .001). For the changes in g f , we assumed strong measurement invariance across time (Widaman, Ferrer, & Conger, Reference Widaman, Ferrer and Conger2010); the standardized factor loadings on g f were as follows: Matrix Reasoning = .72, Block Design = .70, Digit Span Backward = .59, Letter-Number Sequencing = .64.
Descriptive statistics and correlation matrix for each measurement at each age

Note: The g f (general fluid intelligence) variables were latent variables with means of 0 and SDs of 1. n for the latent variables refers to the lowest n of the four variables used to indicate the factor. FEV = Forced Expiratory Volume in 1s; IT = inspection time.
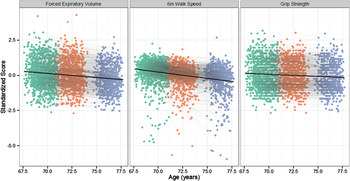
Age-related change in the three measures of physical fitness. Each point on the graph shows the data for one individual at the first (green), second (orange), and third (purple) follow-up waves. Individuals who returned for follow-up waves have their points connected with a grey line. The mean change across all three waves is illustrated by the black line. Note that all variables are coded so that higher scores indicate higher levels of physical fitness.
Age-related change in the five measures of general cognitive ability. Each point on the graph shows the data for one individual at the first (green), second (orange), and third (purple) follow-up waves. Individuals who returned for follow-up waves have their points connected with a grey line. The mean change across all three waves is illustrated by the black line.

Testing correlated levels among physical functions and between cognitive ability and physical functions
We first examined the physical functions alone. As expected, in the initial ‘factors of curves’ model, there were strong correlations between the functions at baseline (Table 1; upper section of Figure 4 [Section A]). There was, therefore, a strong general factor of physical function; the intercepts of forced expiratory volume, walking speed, and grip strength loaded on this factor at .53, and .54, .52, respectively (standardized loadings; all significant at p < .001). Additionally, g f was significantly correlated with levels of all three physical functions (all r-values > .146, all p-values < .001) and with the general factor of physical function levels (r = .39, p < .001)
A. level-level, B. level-slope, and C. slope-slope correlations among the general cognitive ability (g) and physical variables (FEV = forced expiratory volume, WLK = 6m walking speed, GRP = grip strength). The Δ symbol indicates that the variable is a latent slope factor. Values on each path are standardized correlations with standard errors in parentheses.

Testing correlated changes among physical functions
We were next interested in whether there was a similar factor for physical changes across time. When we investigated the bivariate correlations between the slope factors for each of the functions, they were small in size and non-significant: change in change in forced expiratory volume with change in walking speed (r = .12, SE = .11, p = .25); change in forced expiratory volume with change in grip strength (r = .06, SE = .07, p = .36); change in walking speed with change in grip strength (r = .23, SE = .13, p = .07). Thus, the results did not support the ‘common cause’ hypothesis, at least as regards physical functions.
Since these analyses overall indicated that there was no reliable general factor of physical change in the data, in subsequent analyses we examined changes in each of the physical functions separately alongside cognitive changes.
Level-change associations in physical and cognitive functions
Do earlier cognitive levels predict subsequent change in physical fitness, or vice versa? We first addressed this question by using the intelligence test data taken by our participants at age 11 to predict the intercepts and slopes of each of the three physical functions. The results are shown in Table 2. Although the childhood cognitive test was significantly related to the baseline levels of each of the physical functions, it made no significant prediction of the slope of change in any function (all p-values > .14). Thus, the results provide evidence against the reserve hypothesis that early-life ability is protective against declines in physical function in the eighth decade of life.
Associations of intelligence at age 11 years (Moray House Test) with physical function levels and changes between age 70 and 76 years

We then tested whether cognitive ability at the later-life baseline was significantly predictive of subsequent physical changes, by including the general (g f ) factor of fluid cognitive ability described above in the multivariate growth curve model alongside the three physical functions. This model had excellent fit to the data: χ2(169) = 489.75, p < .001, Root Mean Square Error of Approximation (RMSEA) = .04, Comparative Fit Index (CFI) = .97, Tucker-Lewis Index (TLI) = .96.
As shown in Figure 4 (Section B), there was a significant correlation between baseline g f and subsequent change in walking speed, but not with the other two physical functions. To test whether the effect for walking speed was significantly larger than the other effects, we estimated new models that constrained these paths to equality and tested whether there was a significant loss of model fit using a χ2 test. These models showed that the g f -walking speed change correlation was not significantly larger than the g f -grip strength change correlation (χ 2(1) = 2.35, p = .13), but was significantly larger than the g-forced expiratory volume change correlation (χ2(1) = 15.20, p < .001). There was no evidence that significant predictions of changes in g f could be made by the baseline levels of any of the physical functions (all standardized r-values < .06; all p-values > .59).
Correlated change across physical and cognitive functions
We tested whether changes in g and changes in any of the physical functions were correlated across the study period. These results are shown in the lower section of Figure 4 (Section C). In this model, there was a significant correlation between change in g f and change in walking speed; that is, individuals who exhibited more g f change also exhibited more change in walking speed (r = .24, SE = .12, p = .039). The slope-slope associations between g and the other physical variables were not significant (for g f -forced expiratory volume: r = .18, SE = .10, p = .25; for g-grip strength: r = .13, SE = .17, p = .45), but their effect sizes were not significantly different from the g f -walking speed correlation: for forced expiratory volume (χ2(1) = 0.07, p = .79) or for grip strength (χ2(1) = 0.31, p = .58). Thus, there were broadly similar-sized correlations between the changes in g f and in each of the physical functions, but these were only significant (and even then, only borderline-significant) for walking speed.
Alternative models including inspection time
For our subsidiary analysis, we included a measure of inspection time in the model alongside g f and the three physical functions. This allowed us to test whether there were correlations between the physical functions and a psychophysical measure of cognitive processing speed, and also whether there were significant differences between the associations of physical functions with g f and with cognitive speed. This model also fit the data very well: χ 2(217) = 561.12, p < .001, RMSEA = .04, CFI = .97, TLI = .96.
Inspection time, like g (with which it was correlated at baseline: r = .43, SE = .04, p < .001; and in terms of slope, r = .63, SE = .21, p = .002), had a significant relation at baseline with the subsequent slope of walking speed (r = .15, SE = .07, p = .03); its effect size was no different to that of g f (χ2(1) = 1.67, p = .20). Similarly, the slope-slope correlation with inspection time was only significant for walking speed (r = .29, SE = .12, p = .02), a correlation not significantly different from that with g (χ2(1) = 0.04, p = .84). Overall, then, there were not any substantially different or larger effects when using inspection time (processing speed) as the cognitive indicator rather than g f .
Discussion
Understanding the interplay between changes in cognitive ability and in physical functions during ageing requires longitudinal data on both types of function. Here, we used just such data from a relatively large, narrow-age cohort of older adults to test the much-discussed ‘common cause’ and ‘reserve’ hypotheses of ageing. There was little support for either theory. Contrary to the common cause hypothesis, we found no evidence for correlated ageing-related change among three physical functions, and inconsistent evidence for correlated changes across cognitive and physical functions. Additionally, counter to the bodily ‘reserve’ hypothesis we found that, whereas age 11 intelligence predicted the levels of both cognitive ability and physical functions, it did not predict rates of changes in either cognitive ability or physical functions in later life.
Given the substantial correlations between lung function, walking speed, and grip strength at baseline (which, incidentally, support a prediction of the ‘system integrity’ theory [Deary, Reference Deary2012], since they show that individuals who are healthier in terms of one function tend to be healthy across all of those measured), we might expect their declines to be coupled as the ageing process advanced. However, there was no compelling evidence for this in our sample. Instead, our findings implied a decoupling of each specific physical function in terms of their ageing trajectories. Needless to say, such an interpretation is contrary to the ‘common cause’ theory of ageing (or at least the version extended to physical abilities; Christensen et al., Reference Christensen, Mackinnon, Korten and Jorm2001), since it suggests there exist multiple independent causes of ageing across bodily systems. It is interesting to contrast these physical results to those from cognitive tests, which have consistently been shown to decline together in old age (e.g., Ritchie et al., Reference Ritchie, Tucker-Drob, Cox, Corley, Dykiert, Redmond and Deary2016; Tucker-Drob, Reference Tucker-Drob2011a). One possibility is that the brain is affected by domain-general aging processes that impact its core processing efficiency, causing decrements across even very disparate cognitive domains, whereas the bodily systems measured here (lung, gait, and musculature) are all affected by domain-specific detrimental processes during ageing.
Our results indicated that, whereas early-life intelligence scores made significant predictions of the level of each of the physical functions in late life, they did not significantly predict the subsequent rate of decline in those indices. Further, even though the cognitive and physical functions were all correlated at baseline, there was very little consistent evidence that the initial level of one variable made predictions about a subsequent variable. Thus, it may be that, like the cognitive reserve hypothesis (e.g., Tucker-Drob et al., Reference Tucker-Drob, Johnson and Jones2009; Zahodne et al., Reference Zahodne, Glymour, Sparks, Bontempo, Dixon, MacDonald and Manly2011), the idea of ‘bodily reserve’ has little to say about the ‘differential preservation’ of cognitive and physical functions in later life. Indeed, we have previously shown that, whereas predictors of cognitive level in old age are numerous, predictors of cognitive decline’s slope—that is, correlates of differential preservation—are few and far between, often with very small effect sizes (Ritchie et al., Reference Ritchie, Tucker-Drob, Cox, Corley, Dykiert, Redmond and Deary2016). Note that our results are not consistent with those of Sternäng et al. (Reference Sternäng, Reynolds, Finkel, Ernsth-Bravell, Pedersen and Aslan2016), who found that baseline grip strength was predictive of changes in cognitive abilities across 20 years, though particularly after age 65. Their participants were younger, and also followed up for a longer period (see below), which might explain the discrepancy.
Not only did the physical functions in our study cohort appear to age separately, but there was also no compelling evidence for coupled change across the physical and cognitive functions (there was only a borderline change-change correlation between g f and walking speed at a borderline significance of p = .039, which would be non-significant after most forms of multiple comparison correction). Thus, there was also evidence for decoupling of physical and mental functions in later life. These results are consistent with those from a similar, older group of Scottish participants, the Lothian Birth Cohort 1921, where no correlation was found between changes in scores on Raven’s Matrices—similar to the Matrix Reasoning that we included in our g f score—and changes in grip strength (Deary et al., Reference Deary, Johnson, Gow, Pattie, Brett, Bates and Starr2011). They are also consistent with data from Hofer, Berg, and Era (Reference Hofer, Berg and Era2003), who found no clear correlated changes in aging effects across cognitive and physical modalities, additionally noting that longitudinal data (such as those used in the present study) are superior to cross-sectional data for addressing such questions.
The Lothian Birth Cohort 1936 study’s design, especially its narrow age range at each testing wave, is an advantage for studies using longitudinal modeling, since it operates as a built-in control for any within-wave heterogeneity due to age. The availability of an age 11 intelligence variable allowed one test of the ‘reserve’ concept using both early- and late-life data. The multiple waves of consistent data collection allowed us to use a principled growth curve modeling approach to simultaneously address multiple theories and hypotheses. The range of cognitive tests (along with our latent-variable approach) was an advantage, since we were able to produce error-free latent estimates of each individual’s cognitive function that were more valid than some previous studies in this area, which have used dementia screening tests (mental state examinations) which provide far less precise cognitive estimates (see Clouston et al., Reference Clouston, Brewster, Kuh, Richards, Cooper, Hardy and Hofer2013).
The study has some limitations. First, whereas some of the associations we found were not statistically significant by conventional criteria, they were appreciable in effect size. It may be that our study lacked power to detect smaller-sized effects. In a simulation study, Rast and Hofer (Reference Rast and Hofer2014) found that power to detect coupled change increases substantially with additional waves of testing and longer time windows; it may be that some of effects found here would be significant after four waves and additional cognitive and physical decline. Further measurements, both cognitive and physical, are currently underway in the Lothian Birth Cohort 1936 study, with the participants at a mean age of approximately 79 years. Larger longitudinal studies may also be able to detect smaller-sized associations than those found in the present cohort (see Sternäng et al., Reference Sternäng, Reynolds, Finkel, Ernsth-Bravell, Pedersen and Aslan2016, for one such study).
Second, as noted in the Introduction section, it would be optimal to test the idea of ‘reserve’ with the reserve-conferring factors measured early in life. We were able to perform this analysis in one direction, using the age 11 intelligence test variables to predict later-life physical changes. However, we could not test the converse direction, since we did not have available any tests of physical function taken in childhood. Third, we should note that the Lothian Birth Cohort 1936 is not fully representative of the general population in the United Kingdom, being slightly higher in intelligence than average, as well as generally healthier. Since we may have missed individuals with the greatest and most severe cognitive decline and health conditions (and thus physical decline), we may have underestimated the effect sizes of some of the correlations we report here. Finally, given that some physical conditions are more readily treatable than cognitive decline, it may be that the decoupling of physical functions, and their further decoupling from cognitive functions, has in part to do with medications taken, which may specifically improve, for instance, lung function, but not have any effect on cognitive functions.
One method of teasing apart the common and specific ageing processes affecting cognitive and physical functions is to use genetic data, which might hint at biological pathways that are either shared or unique to declines across these functions. Such genetic studies can be performed either with twins (e.g., Finkel & Pedersen, Reference Finkel and Pedersen2004), or with DNA-based molecular methods such as linkage-disequilibrium score regression to calculate genetic correlations, or polygenic risk scores (e.g., Hagenaars et al., Reference Hagenaars, Harris, Davies, Hill, Liewald, Ritchie and Deary2016). Our results, combined with those from previous studies of the general factor of cognitive change, suggest that genetic studies (e.g., Tucker-Drob et al., Reference Tucker-Drob, Briley, Starr and Deary2014) may find common genetic and/or environmental influences on the levels of cognitive and physical abilities, and common genetic and/or environmental influences on the slopes of different cognitive functions, but that these effects will decouple and become specific for different measurements of physical decline within ageing.
It should be noted that, since our study was purely correlational, we cannot speak to any causal effects of improved physical fitness on cognitive ability or vice versa. Physical interventions for reducing cognitive decline have produced equivocal evidence thus far (Yong, Angevaren, Rusted, & Tabet, Reference Yong, Angevaren, Rusted and Tabet2015), with some reviewers appearing more optimistic than others (e.g., Ahlskog, Geda, Graff-Radford, & Petersen, Reference Ahlskog, Geda, Graff-Radford and Petersen2011). If courses of aerobic activities could be developed that reliably improved cognitive function (or staved off its decline), this would not only be encouraging from a clinical perspective: investigation of how any such effects were instantiated in the brain could reveal, in experimental settings, the mechanisms by which cognitive and physical functions are interrelated in later life.
The previous systematic review by Clouston et al. (Reference Clouston, Brewster, Kuh, Richards, Cooper, Hardy and Hofer2013) concluded that, as far as links between physical and cognitive changes were concerned, there was little convincing evidence for the ‘common cause’ theory of ageing. Our results, from growth curve modeling in a well-characterized, narrow-age sample, do little to improve the evidence base for this extension of the ‘common cause’ theory. They show that physical functions tend to age separately, and the support they provide for coupled ageing between physical and cognitive abilities is marginal at best. We found mixed evidence for bodily ‘reserve’; on the basis of these data at least, bodily reserve may be conceptualized as similar to cognitive reserve: earlier factors may affect the level of important health-related functions in later life, but not the slope of their subsequent decline.
We are grateful to the LBC1936 participants and the members of the LBC1936 research team who collected and collated the data analyzed in the present study. The LBC1936 is supported by Age UK (Disconnected Mind program grant). The work was undertaken in The University of Edinburgh Centre for Cognitive Ageing and Cognitive Epidemiology, part of the cross council Lifelong Health and Wellbeing Initiative (MR/K026992/1).
Funding from the UK Biotechnology and Biological Sciences Research Council (BBSRC) and the UK Medical Research Council (MRC) is gratefully acknowledged. During the writing of the present paper, E.T.-D. was a visiting scholar at the Russell Sage Foundation.


 Open access