Introduction
Online media ecosystems are high choice environments: When going online, users face a myriad of options, from which platform to use to what content to focus on. Human attention is extremely limited relative to this vastness of choices and is therefore the key commodity of online media platforms. A fundamental choice users make online is which relationships to establish with other accounts. Follower ties are particularly significant, as they represent users’ preferences regarding which accounts to pay attention to and shape the content they encounter and engage with. These relationships are a central affordance of modern social media platforms, particularly of platforms centered around users’ interests and information sharing like Twitter (now X), Instagram, and Facebook (e.g. with following Pages). In this Element, we study the networks of follower relationships among users in a social media platform as attention networks, where each tie is an allocation of attention from one user to another.
A distinctive feature of online connections is that they can overcome some of the offline constraints of socialization, like physical proximity (Cairncross, Reference Cairncross1997; Small and Adler, Reference Small and Adler2019) or social foci (Feld, Reference Feld1981), that often generate social segregation (Blau et al., Reference Blau, Blum and Schwartz1982; Blumenstock et al., no date; Feld, Reference Feld1982; Hipp and Perrin, Reference Hipp and Perrin2009; McPherson et al., Reference McPherson, Smith-Lovin and Cook2001). In principle, relationships develop online with much more freedom, as one can befriend or follow any other user on the planet without physical co-presence. However, the large disproportion between users’ available attention and the multitude of options generates opportunities for social media platforms to curate and filter these options, with the central goal of gathering users’ time. A key feature in this regard are recommendation algorithms, designed to provide users with the content they are interested in – to the point that most choices on online platforms are algorithmically mediated with this purpose. This mediation by online platforms is often linked to the increasing polarization of Western societies (Kubin and von Sikorski, Reference Kubin and von Sikorski2021; Sunstein, Reference Sunstein2001, Reference Sunstein2018), through the generation of echo-chambers (Cinelli et al., Reference Cinelli, De Francisci Morales, Galeazzi, Quattrociocchi and Starnini2021; González-Bailón et al., Reference González-Bailón, Lazer and Barberá2023). Following this view, relationships online may be particularly segregated precisely because the high diversity of available options allows algorithmic recommendations that are tailored to users’ choices, leading to siloed windows on the world without the presence of traditional constraints like geographical space.
The contrast between the freedom from physical restrictions of online relationships and the structure generated by the algorithmic management of this freedom leads to two broad questions that we speak to in this Element. First, does the social functioning of these platforms amplify social divides? And, if so, which divides? In this regard, we study the extent that attention networks are segregated by attributes that are typically divisive in society, such as ideology or race and ethnicity. The degree that follower ties connect similar individuals has wide implications for the type of content they consume, mediating the societal impact of social media – from polarization (Bakshy et al., Reference Bakshy, Messing and Adamic2015; Nyhan et al., Reference Nyhan, Settle and Thorson2023) to social cohesion (González-Bailón and Lelkes, Reference González-Bailón and Lelkes2023) to misinformation spread (Bovet and Makse, Reference Bovet and Makse2019; Grinberg et al., Reference Grinberg, Joseph, Friedland, Swire-Thompson and Lazer2019; Stein et al., Reference Stein, Keuschnigg and van de Rijt2023). Second, how is geography associated with the distribution of attention online? Space is often treated as a secondary force in online social relationships because physical proximity is not required for online interaction (Bastos, Reference Bastos2021). However, the interest-based nature of follower-based social media combined with the relative locality of some online communities suggests that geography may still play a central role in attention networks online. The relationship between geography and online networks remains an understudied question that we address in this work.
The study of homophily in the Social Networks field (McPherson et al., Reference McPherson, Smith-Lovin and Cook2001) has generated extensive research quantifying tie similarity and unraveling its mechanisms in offline settings, for key attributes such as race, ideology, or socioeconomic status (Block and Grund, Reference Block and Grund2014; Butters and Hare, Reference Butters and Hare2022; Currarini et al., Reference Currarini, Jackson and Pin2010; Kossinets and Watts, Reference Kossinets and Watts2009; McPherson et al., Reference McPherson, Smith-Lovin and Cook2001; McPherson and Smith-Lovin, Reference McPherson and Smith-Lovin1987; J. A. Smith et al., Reference Smith, McPherson and Smith-Lovin2014; Wimmer and Lewis, Reference Wimmer and Lewis2010). In contrast, empirical evidence on homophily in social media ties remains limited, and we know little of the extent that these patterns apply online. While some literature uses simulations to estimate the potential downstream impact of preferences for similar others (Karimi et al., Reference Karimi, Génois, Wagner, Singer and Strohmaier2018; E. Lee et al., Reference Lee, Karimi and Wagner2019; Rychwalska and Roszczyńska-Kurasińska, Reference Rychwalska and Roszczyńska-Kurasińska2018; Yavaş and Yücel, Reference Yavaş and Yücel2014), descriptive evidence for attributes such as race, partisanship, or age is scarce and suffers from the difficulty to link individual information external to online activity. This has led to a proliferation of studies that focus on homophily in online settings, but significant problems of measurement and coverage bias in the evidence for the attributes that are typically divisive offline. Research on ideological homophily, for instance, often infers ideology from platform behavior, biasing samples toward politically involved users (Barberá et al., Reference Barberá, Jost, Nagler, Tucker and Bonneau2015; Halberstam and Knight, Reference Halberstam and Knight2016; Mosleh et al., Reference Mosleh, Martel, Eckles and Rand2021). Another fundamental limitation is that these social traits are studied in isolation, preventing a comparison of relative homophily levels and leaving the potential for confounding between attributes, well documented for offline ties (Blau, Reference Blau1977; Goodreau et al., Reference Goodreau, Kitts and Morris2009; Wimmer and Lewis, Reference Wimmer and Lewis2010), unknown for online networks.
Current evidence shows that online relationships are strongly associated with users’ location (Bailey et al., Reference Bailey, Cao, Kuchler, Stroebel and Wong2018; Grabowicz et al., Reference Grabowicz, Ramasco, Gonçalves and Eguíluz2014; Liben-Nowell et al., Reference Liben-Nowell, Novak, Kumar, Raghavan and Tomkins2005; Morales et al., Reference Morales, Dong, Bar-Yam and Pentland2019; Takhteyev et al., Reference Takhteyev, Gruzd and Wellman2012). However, this research remains limited due to difficulties accessing geographical information on online users (Bastos, Reference Bastos2021). For example, the role of opportunity structures – the amount of people available for a tie at a given distance – in follower networks compared to simple distance is unknown. Another unexplored issue is the relationship between geography and tie similarity. The tendency to follow proximate users (Grabowicz et al., Reference Grabowicz, Ramasco, Gonçalves and Eguíluz2014) combined with strong residential segregation, particularly by partisanship and race in the United States (Brown and Enos, Reference Brown and Enos2021, Intrator et al., Reference Intrator, Tannen and Massey2016), indicates that following nearby users may lead to tie similarity – yet no research has examined this hypothesis. In addition, attention patterns may vary by physical proximity: Short distance ties may be more homophilous because they tend to link to offline acquaintances or because they reflect local interest communities. Finally, there is no evidence on the importance of geography compared to similarity online: While the literature tends to highlight the role of partisan echo-chambers, localized follower patterns may characterize attention networks as well.
In sum, the current research landscape on ties online (including follower ties but extending beyond those) rarely integrates users’ offline attributes, hampering the understanding of how online media ecosystems contribute to societal division and relate to physical space. This Element aims at addressing this limitation by drawing from a dataset of about 1.1 million Twitter accounts matched to US voter records, providing data on users’ partisanship, race/ethnicity, sex, age, and precise location information. We examine the follower ties among these users to analyze how attention allocation patterns are related to offline attributes, focusing on the role of homophily and geography. Our primary research questions are: How are follower patterns on Twitter in the United States related to users’ partisanship, race/ethnicity, sex, and age? and how does geography structure follower ties on Twitter in the United States? Twitter (now X) plays an important role in the information ecosystem of Western societies (Pew Research Center, Reference Center2024; Priya et al., Reference Priya, Sequeira, Chandra and Dandapat2019; Scharkow et al., Reference Scharkow, Mangold, Stier and Breuer2020; Shearer and Matsa, Reference Shearer and Matsa2018), and has played an especially important role in the United States. Follower ties on this platform represent a canonical model of following as attention allocations, making Twitter an ideal case study for online attention networks with findings applicable to other follower-based platforms such as Instagram.
Overall, our work underscores the importance of geography online. While the internet is often assumed to concentrate attention on large-scale national issues, our results suggest that local information networks play a central role and that users’ attention patterns cannot be well understood without considering where they live. We find that the tendency to follow proximate users drives a significant portion of the homophily by partisanship and race/ethnicity. Most research highlights recommendation algorithms as structural forces creating echo chambers; our results complement this literature by demonstrating the importance of residential segregation. However, we also conclude that social media does not seem to amplify existing social divides: The homophily we observe is weaker than typically found in offline ties. Notably, partisanship homophily is not dominant in the attention network we study, while age and race/ethnicity homophily are stronger. Beyond homophily, we find that attention flows disproportionately toward specific groups (on Twitter, +65, urban, men, and Democrat users). Geography is closely related to how these two patterns combine: Local attention structures exhibit homophily, while national-level attention flows toward these dominant groups.
This Element is structured as follows:
– Section 1 develops our theoretical framework. We conceptualize follower networks as attention networks and examine how the functioning of follower-based platforms shapes attention patterns according to users’ location and offline attributes drawing from Social Network theory. We then review the evidence on tie similarity offline and online by the attributes we study and on the relationship between geography and online ties.
– Section 2 describes the dataset and methods.
– Section 3 presents bivariate results for demographics and partisanship. We examine how attention patterns are interrelated with these attributes and evaluate the presence of homophily.
– Section 4 provides our results on geography. We compare how distance and opportunity structures are associated with follower ties, study the association with urbanicity, and explore how attention patterns by demographics and partisanship vary by physical proximity.
– Section 5 shows the results of multivariate models combining all variables to compare their relative importance and to identify how structural mechanisms – such as homophily by a correlated attribute or the tendency to follow users who reside close – drive tie similarity.
– Finally, Section 6 includes conclusions and a discussion of the implications of our results.
1 Attention Networks, Homophily, and Geography
The landscape of social media platforms has undergone significant changes since their inception in the early 2000s. They were initially based in social connectivity and self-expression and were often called “Social Networks,” with MySpace or Facebook being notable early examples. A central affordance of these platforms was the “friend” tie, a symmetrical relationship that required the agreement of both tie members. Social media gradually shifted to a model based on interests and information gathering (Burgess, Reference Burgess2015), where the main goal is to provide users with the opportunity to find the information and content they are interested in. A consequence of this transition was that friendship ties were superseded by follower relationships, which are asymmetrical and do not require the acceptance of the other account. Following is one of the crucial affordances of contemporary social media, starting with the advent of Twitter in 2006 as a lightweight social medium whose essential affordance was “following” other accounts, whether you knew them or not. More generally, we define “following” as directed ties from one actor to another actor (or set of actors), where that tie increases the probability that the first actor sees content from the second in the future. Thus, friend ties on, for example, Facebook do not qualify as following: Although those ties certainly do structure what content each member of a dyad sees, they are not directed. Other ties on Facebook, like following a Page, do align with our definition of following. Following is also not a purely algorithmic process, where an actor is passively shown content based on prior engagement and views.
In essence, establishing and maintaining a follower tie is an (implicit or explicit) decision to grant attention to that account. Follower ties are relatively weak relationships compared to active engagement actions such as re-posting or reacting to content from another user (with, for example, a like). However, engagement is very rare at the dyadic level and provides a restricted signal relative to the accounts that a user pays attention to; that is, users typically do not engage with most of the accounts they receive content from. The exact role of following in the platform algorithms deciding which content to provide to users is generally unknown. In the particular case of Twitter, however, about 50% on average of candidate tweets for the “For you” timeline (the platforms’ home page) are from accounts followed (Messing, Reference Messing2023; Twitter, 2023). The remaining 50% of candidate tweets are selected from non-followed users using a separate selection process. Only tweets that are either (a) liked by someone you follow or (b) authored by someone who is followed by someone you follow can be selected for the timeline. Thus, follower ties are purposive signals that increase exposure to the selected accounts and restrict the pool of non-followed content to related accounts. By studying follower networks, we study the network of deliberate attention allocations among users online, approximating the broader information environment they are exposed to.
In addition to the two models of social media outlined previously, a new model, led by TikTok, has recently emerged, where content recommendations are algorithmically based on previous engagement (Nowacki, Reference Nowacki2024). Still, no social media platform purely conforms to only one of these models: TikTok includes following in its repertoire of affordances, content recommendations on Twitter and Instagram are now based on engagement in addition to follower ties (Twitter, 2023), and Facebook includes elements of the three models. Through this work, we call the platforms where follower ties play a central role follower-based social media. This model includes platforms like Twitter (now X), Instagram, and LinkedIn, because follower ties are the core relationship affordance in these platforms, but it also includes platforms like Facebook, where follower ties (such as following pages) are important for information diffusion (González-Bailón et al., Reference González-Bailón, Lazer and Barberá2023) even if they are not the only existing relationship. Despite the arrival of TikTok, following is still a central affordance in contemporaneous social media, and these platforms are among the most used in the United States (Pew Research Center, Reference Center2024). Twitter, the site on which we provide empirical evidence, is a paradigmatic example of this model. While early studies found that it shared some elements of the old Social Network model of social media, researchers generally conclude that the information and attention component played a more important role on this platform (Hargittai and Litt, Reference Hargittai and Litt2011; Kwak et al., Reference Kwak, Lee, Park and Moon2010; Liang and Fu, Reference Liang and Fu2017; Mitchell et al., Reference Mitchell, Shearer and Stocking2021). In particular, some evidence finds that most of the follower ties Twitter users have are not with people they know offline or have a friendship tie with on Facebook (Buccafurri et al., Reference Buccafurri, Lax, Nicolazzo and Nocera2015; Kim et al., Reference Kim, Choi and Natali2016; Natali and Zhu, Reference Natali, Zhu, Wierzbicki, Brandes, Schweitzer and Pedreschi2016).
As mentioned in the introduction, a key concern regarding attention networks is the extent that they tend to connect similar individuals. The social networks literature has developed a rich understanding of the multiple mechanisms of tie formation and maintenance and how they can generate tie homogeneity (McPherson et al., Reference McPherson, Smith-Lovin and Cook2001; Rivera et al., Reference Rivera, Soderstrom and Uzzi2010). The first basic mechanism is simply due to the composition of a given social context, that generates some level of baseline homophily because there may be a lot more opportunities for ties with similar others than dissimilar others. Other mechanisms generate inbreeding homophily, the homophily above and “over and above” this baseline homophily (McPherson et al., Reference McPherson, Smith-Lovin and Cook2001). Through this work, we generally use the term homophily to refer to inbreeding homophily, that is, the tendency to have connections with similar others once group sizes (i.e. baseline homophily) are accounted for. One process generating inbreeding homophily is choice, leading to choice homophily when a preference for similar others is involved (McPherson and Smith-Lovin, Reference McPherson and Smith-Lovin1987).
However, the research on homophily generally concludes that structural mechanisms tend to play a more important role than choice on the homogeneity of social ties (Feld, Reference Feld1982; Kossinets and Watts, Reference Kossinets and Watts2009; Rivera et al., Reference Rivera, Soderstrom and Uzzi2010; Wimmer and Lewis, Reference Wimmer and Lewis2010). Specifically, inbreeding homophily may be caused by the organization of life in social foci, that is, communities of interests where we meet similar others (Feld, Reference Feld1981), or triadic closure, the tendency of shared ties, that are likely to be homophilous, to lead to more ties and lengthen their duration (Feld, Reference Feld1997; Hammer, Reference Hammer1979; Kossinets and Watts, Reference Kossinets and Watts2009). These mechanisms structure the opportunities for tie making, so that the pool of options to establish a tie can be heavily biased toward similar others. In this regard, a crucial factor is geography, through the mechanism of propinquity (Festinger et al., Reference Festinger, Schachter and Back1950; Small and Adler, Reference Small and Adler2019), as offline ties depend on physical encounters and residential segregation is common. Other potential reasons behind the homogeneity of ties relative to a given attribute is its association with other attributes exercising homophily, Blau’s consolidation (Blau, Reference Blau1977), and the differential propensity of group members to establish and receive ties. Altogether, all of these mechanisms reinforce each other so that small preferences for similar others can generate very segregated environments (Schelling, Reference Schelling1971).
While relationships online function differently than offline, the social networks framework for offline ties is useful to understand follower ties. A central difference lies in the opportunity structures: Anyone on a social media platform can potentially be followed, in contrast with offline settings where geography constrains available connections. This leads to a lower association of space with ties online (Lengyel et al., Reference Lengyel, Varga, Ságvári, Jakobi and Kertész2015). An expanded choice set should also alter how homophily operates, as suggested by studies of school networks finding that homophily can significantly vary with the composition of available tie options (Goodreau et al., Reference Goodreau, Kitts and Morris2009; Moody, Reference Moody2001). In particular, the extreme freedom of choice online is paradoxical, as it presents users with an impossibly vast array of options. Social media platforms manage these choices through recommendation algorithms, which are the primary structural influence online. Though less directly constraining than geography, these algorithms may intensify social segregation precisely because they amplify potentially homophilous preferences. To understand how attention networks are related to users’ offline location and attributes, we unpack in the following paragraphs the algorithmic functioning of follower-based platforms.
Inspecting Twitter’s follower recommendation algorithm (Gupta et al., Reference Gupta, Goel and Lin2013) unveils connections to the social networks mechanisms discussed previously. The algorithm suggests users similar to the focal user or followed by similar users, where similarity is operationalized as having following patterns akin to the focal user. This logic directly implements triadic closure: Following recommended users tends to close transitive triads. Indeed, sharing followers (users who follow a focal user) and followees (users followed by a focal user) is associated with similarity on Twitter and an important part platforms’ tie structure (Brzozowski and Romero, Reference Brzozowski and Romero2011; Garimella and Weber, Reference Garimella and Weber2014; A. H. Smith et al., Reference Smith, Green, Foucault Welles and Lazer2025; Xu et al., Reference Xu, Huang, Kwak and Contractor2013). Other work highlights how topical similarity predicts ties in follower-based platforms (De Choudhury, Reference De Choudhury2011; Liang and Fu, Reference Liang and Fu2017; Verma et al., Reference Verma, Wadhwa and Singh2018). Network and topical factors are connected through the logic of the algorithm: Even if not directly based on content similarity, shared follower patterns approximate shared interests.
The platforms’ algorithmic design is also closely related to Feld’s (Reference Feld1981) foci. Follower-based social media are composed of myriad interest communities (Himelboim et al., Reference Himelboim, Smith, Rainie, Shneiderman and Espina2017; Zhang et al., Reference Zhang, Wu and Yang2012), analogous to offline social gathering spaces. The algorithm uses focal user’s following and engagement patterns to recommend users with similar interests – essentially, from the communities they are already embedded in. Twitter explicitly models this in later developments, through embeddings generated from communities in the follower network and anchored around influential users (Satuluri et al., Reference Satuluri, Wu and Zheng2020; Twitter, 2023). Updated every three weeks in 2023, these embeddings are employed for multiple purposes – such as follower and timeline recommendations – and correspond to latent interest communities. We conceptualize these interest communities as online foci, mapping to how foci are usually thought of offline, as slow changing features of the environment that increase the likelihood of individuals arranged around a focal point forming a tie. Foci online can also be quite short lived (perhaps existing just minutes) and still facilitate tie formation, such as a conversation around a specific post or an influential user reposting content from another user. These ephemeral social foci may cumulatively be very consequential and crystallize into durable interest communities. For example, A. H. Smith et al. (Reference Smith, Green, Foucault Welles and Lazer2025) demonstrate that amplification (i.e. retweets) of an account by an influential user causes triad transitivity on Twitter, shedding light on the micro-mechanisms of tie formation on the platform. Recent evidence further highlights the role of influential curators of content in follower-based platforms (Green et al., Reference 62Green, Mccabe and Shugars2025), who select and disseminate specific information acting as generators of online foci.
Altogether, the interplay of how users share and consume information with algorithmic platform affordances generates a particular, interest-based socio-structural functioning in follower-based social media. This framework provides a lens for interpreting our results: We expect the social structure around online foci to be the major force driving how follower networks relate to offline attributes. For instance, the levels of tie similarity by demographic and political attributes will depend on their overlap with interest communities. When these align, algorithmic reinforcement of interest-based homophily generates tie similarity by offline characteristics. Extensive sociological research shows that sociodemographics and partisanship shape tastes and interests (Bourdieu, Reference Bourdieu1979; DellaPosta et al., Reference DellaPosta, Shi and Macy2015; Glevarec and Cibois, Reference Glevarec and Cibois2021; Katz-Gerro, Reference Katz-Gerro2002); therefore, we can expect relatively high homophily for these attributes. We argue that the social structure around online foci – rather than explicit preferences for similar others – accounts for much of the observed segregation in attention networks. Our prior is that users typically follow accounts because they are interested in their content, with tie similarity emerging as a by-product, instead of following others because they are similar to them. While there is causal evidence of choice homophily in follower-based social media (Mosleh et al., Reference Mosleh, Martel, Eckles and Rand2021), it is restricted to the likelihood of establishing a reciprocal tie and does not evaluate its role on the follower network as a whole.
From this standpoint, we assume that most of the homophily that we empirically describe in this Element reflects how interest-based following generates tie similarity. We find strong age homophily, pointing to a high association between age and online foci on Twitter, while homophily for partisanship is relatively weak, consistent with previous research finding that political foci are not central on the platform (Mukerjee et al., Reference Mukerjee, Jaidka and Lelkes2022; Wojcieszak et al., Reference Wojcieszak, Casas, Yu, Nagler and Tucker2022). Beyond examining homophily levels for each attribute separately, we also study how homophily by one attribute may produce homophily by another (Blau, Reference Blau1977). For example, tie similarity by partisanship can emerge because users follow others of the same race who also tend to share their partisanship. This hypothesis is confirmed by our analysis, albeit with relatively minor effects.
Our argument on the central role of online foci extends to the relationship between space and follower ties: We assume that an important reason why geography correlates with follower ties is that users’ interests associate with their location. Still, a portion of this relationship may reflect follower relationships replicating preexisting social ties. While some accounts suggest Twitter’s “For you” algorithm may use location for content recommendations (Wang, Reference Wang2023), the Twitter team’s description omits this factor (Twitter, 2023). Overall, public documentation of the platforms’ algorithmic structure (Gupta et al., Reference Gupta, Goel and Lin2013; Messing, Reference Messing2023; Satuluri et al., Reference Satuluri, Wu and Zheng2020; Twitter, 2023; Wang, Reference Wang2023) focuses on users interests and online foci, with minimal mention of location or offline ties, suggesting these are not directly central to Twitter’s recommendation systems. Nevertheless, the logic of the recommendation algorithms outlined previously may intersect with geography and offline ties. For instance, triadic closure is used to recommend users to follow (Gupta et al., Reference Gupta, Goel and Lin2013) and is more likely among users residing closer (Stephens and Poorthuis, Reference Stephens and Poorthuis2015). Similarly, the follower graph communities used for recommendations (Satuluri et al., Reference Satuluri, Wu and Zheng2020) may be geographically embedded.
In our results, physical proximity is highly associated with follower ties. This association is driven by the population density between locations (see Section 2.2 for details), mirroring offline networks (Simini et al., Reference Simini, González, Maritan and Barabási2012). A consequence of this association is that, in the presence of residential segregation, similar users may be more likely to be followed. For instance, following local information producers (on sports, for example) in segregated areas may lead to following users of the same race or partisanship. Algorithmic social structures online can therefore interact with geography – a central determinants or offline social life – producing comparable effects of residential segregation on tie similarity for both follower and offline relationships. Our analysis confirms that geographical factors drive a significant portion of homophily on Twitter by race/ethnicity and partisanship. Furthermore, we find that the urbanicity of users’ residential areas is strongly correlated with attention patterns, with those in high-density areas attracting disproportionate attention, suggesting that they tend to be influencers or opinion leaders of national-level foci. We also examine how attention patterns vary by physical proximity due to the different nature of local versus national foci. We find significantly higher homophily for proximate ties, suggesting that local foci tend to be segregated. In contrast, national level foci are characterized by certain groups monopolizing attention.
Besides the issues of tie similarity and space, a key consequence of the asymmetric nature of following ties is the possibility to accumulate vast numbers of incoming ties. In contrast, user attention is limited, creating an incentive to curate followee accounts. This creates huge disparities in the attention some accounts receive compared to others (Myers et al., Reference Myers, Sharma, Gupta and Lin2014). Recommendation algorithms amplify these tendencies; for example, Twitter chooses influential accounts from communities in the follower graph to provide content to users (Satuluri et al., Reference Satuluri, Wu and Zheng2020). Accordingly, the follower network that we study displays a heavy tailed in-degree distribution (see Online Appendix 11), despite including only accounts matched to “real” people offline (so excluding organizational accounts, see Section 2.1). Attention concentration is extreme: The top 1% of users by follower count capture 42% of the network edges. These disparities can correlate with demographic, political, or geographical attributes: previous research documents that men and white users tend to have more followers on Twitter than women or minorities (Messias et al., Reference Messias, Vikatos and Benevenuto2017). We expand on this work thanks to our detailed offline user information. Furthermore, disproportionate follower (and followee) accumulation by certain groups can generate apparent homophily or heterophily. For example, if popular users tend to be members of a group, the tie probability among members of this group may be high simply because of the tendency to follow popular accounts. We hypothesized that this mechanism – overlooked in previous online homophily research – would prove important given the asymmetric structure of follower-based media. However, our results indicate relatively minor effects.
Through this subsection, we have delineated our framework on attention networks and our theoretical expectations on how follower ties function. We also described the homophily mechanisms that we speak to with our methods: the interaction among homophily for different attributes, geographically confined following leading to tie similarity because of residential segregation, and homophily due to the differential number of followers/followees per group. We focus the next three subsections on previous research on tie similarity online and the role of geography, specifying how we add to these literatures. First, we discuss the research on partisanship homophily and the related issue of polarization, the social divide that has gathered the most attention from the general public and researchers alike. Then, we review the evidence on homophily by race/ethnicity, age, and gender, in offline contexts and online. Finally, we examine the literature on how space is associated with ties online. We focus our review on follower ties and on Twitter, the follower-based platform that centers most research on this type of relationship; however, and given the general scarcity of research, we also review studies on other types of online ties.
1.1 Partisanship Homophily and Polarization
A major concern associated with political and partisan homophily in the United States is polarization. Following theories like selective exposure theory, the preference for like-minded content in a high-diversity environment, buttressed by algorithms feeding on these preferences, would lead to echo chambers and a low diversity in people’s media diets (Sears and Freedman, Reference Sears and Freedman1967; Stroud, Reference Stroud2010; Sunstein, Reference Sunstein2001, Reference Sunstein2018). This line of reasoning is supported by the growing levels of polarization in US society in the last twenty years, since the rise of social media, through various dimensions such as affect toward opposing party supporters or residential and dating preferences (Boxell et al., Reference Boxell, Gentzkow and Shapiro2017; Huber and Malhotra, Reference Huber and Malhotra2017; Hui, Reference Hui2013; Iyengar and Westwood, Reference Iyengar and Westwood2015). In particular, research has found substantial and increasing ideological homogeneity in offline political discussion and confidant networks between 1992 and 2016 (Butters and Hare, Reference Butters and Hare2022; B. Lee and Bearman, Reference Lee and Bearman2020). Findings on other types of tie, such as work ties or weaker ties, seem to point to more cross-cutting ideological exposure (DiPrete et al., Reference DiPrete, McCormick, Teitler and Zheng2011; Eveland et al., Reference Eveland, Appiah and Beck2018; Mutz and Mondak, Reference Mutz and Mondak2006).
While simulations and theoretical models support the relationship between social media and polarization (Halberstam and Knight, Reference Halberstam and Knight2016; Rychwalska and Roszczyńska-Kurasińska, Reference Rychwalska and Roszczyńska-Kurasińska2018; Sasahara et al., Reference Sasahara, Chen and Peng2021; Tokita et al., Reference Tokita, Guess and Tarnita2021), the empirical evidence was, at least until recently, mixed (Barberá, Reference Barberá, Persily and Tucker2020). For example, younger age cohorts, that use social media more, are less polarized than older cohorts (Boxell et al., Reference Boxell, Gentzkow and Shapiro2017). Online media diets in the United States, when measured at the domain level, seem to be moderate on average (Guess, Reference Guess2021), while social media sites increase the diversity of news domains visited in Germany (Scharkow et al., Reference Scharkow, Mangold, Stier and Breuer2020). However, recent evidence points to a stronger relationship between social media and polarization, particularly regarding news exposure and consumption. Green et al. (Reference 62Green, Mccabe and Shugars2025) show that domain-level estimates of partisan slant obscure network curation processes where users share news pieces from politically heterogeneous sources to fit their own political narratives. Because of these processes, moderate news media diets when measured at the domain level, the standard in the literature (Eady et al., Reference Eady, Nagler, Guess, Zilinsky and Tucker2019; Guess, Reference Guess2021) may reflect less exposure to cross-cutting political narratives than previously thought. In addition, research on Facebook recently found that news exposure and consumption is significantly segregated in this platform (González-Bailón et al., Reference González-Bailón, Lazer and Barberá2023), updating and improving prior evidence (Bakshy et al., Reference Bakshy, Messing and Adamic2015). Still, artificially reducing like-minded content in users’ Facebook feeds did not impact their polarization levels (Bakshy et al., Reference Bakshy, Messing and Adamic2015; Nyhan et al., Reference Nyhan, Settle and Thorson2023). In other platforms like Reddit, interactions regarding news were found to display heterophily along partisan lines and homophily by sociodemographics (Monti et al., Reference Monti, D’Ignazi, Starnini and Morales2023).
On Twitter, a substantial number of studies find segregated political conversations, in particular along party lines in the United States (Barberá et al., Reference Barberá, Jost, Nagler, Tucker and Bonneau2015; Cinelli et al., Reference Cinelli, De Francisci Morales, Galeazzi, Quattrociocchi and Starnini2021; Conover et al., Reference Conover, Ratkiewicz and Francisco2011; Williams et al., Reference Williams, McMurray, Kurz and Hugo Lambert2015). However, when looking at partisan segregation at the user level and going beyond political content, a different picture emerges, because tweeting and political interest are positively associated with more extreme partisanship (Bestvater et al., Reference Bestvater, Shah, Rivero and Smith2022; Pew Research Center, 2019, 2020). Specifically, Shore et al. (Reference Shore, Baek and Dellarocas2018) found that the average Twitter account tweets links from more moderate news sources than they are exposed to. In contrast, a small set of users, responsible for the majority of tweets received by other users, show the opposite pattern. Research using representative survey samples from the United States, Italy, and Germany finds significant average exposure to dissimilar political opinions on Twitter, but also substantial variation by ideology and slant level (Eady et al., Reference Eady, Nagler, Guess, Zilinsky and Tucker2019; Vaccari et al., Reference Vaccari, Valeriani and Barberá2016). Studies document that the majority of users of this platform do not follow any political elite, and that nonpolitical opinion leaders attract considerably more attention (Mukerjee et al., Reference Mukerjee, Jaidka and Lelkes2022; Wojcieszak et al., Reference Wojcieszak, Casas, Yu, Nagler and Tucker2022). However, users who do follow political elites show sizable polarization levels across a range of behaviors on the platform, including following (Halberstam and Knight, Reference Halberstam and Knight2016; Wojcieszak et al., Reference Wojcieszak, Casas, Yu, Nagler and Tucker2022). Furthermore, polarization seems to have increased among this subset of users between 2009 and 2016 (Garimella and Weber, Reference Garimella and Weber2017). Finally, users who retweeted partisan media display a clear preference to follow in-party accounts in experimental settings (Mosleh et al., Reference Mosleh, Martel, Eckles and Rand2021).
The main takeaway from this literature is that users displaying some kind of political behavior on Twitter tend to be polarized, in terms of platform behavior such as in-group following and engagement patterns, while the median user rarely engages in politics and is not polarized. This presents a paradox, as the research on partisanship homophily of Twitter following measures partisanship precisely using this type of behavior in the platform (Boutyline and Willer, Reference Boutyline and Willer2017; Colleoni et al., Reference Colleoni, Rozza and Arvidsson2014; Eady et al., Reference Eady, Nagler, Guess, Zilinsky and Tucker2019; Garimella and Weber, Reference Garimella and Weber2017; Halberstam and Knight, Reference Halberstam and Knight2016; Mosleh et al., Reference Mosleh, Martel, Eckles and Rand2021; Wojcieszak et al., Reference Wojcieszak, Casas, Yu, Nagler and Tucker2022). Thus, it is effectively biased toward politically homophilous users. Some homophily by partisanship is expected on Twitter, as this is an attribute directly related to online foci on the platform and in principle prone to choice homophily online (Mosleh et al., Reference Mosleh, Martel, Eckles and Rand2021). However, the current research risks exaggerating the homophily of the average user by focusing only on users interested in these political foci. To our knowledge, there is no research examining in a generalizable fashion whether partisans are more likely to follow same partisans, despite the centrality of this descriptive “fact” to arguments around echo chambers.
Another important limitation of this literature is that ideological homophily is studied independently of other variables associated with following behavior, like standard sociodemographics or physical proximity. Some of the reviewed work implicitly assumes that the association found between partisanship similarity and following reveals preferences for ideological congruity (Boutyline and Willer, Reference Boutyline and Willer2017; Colleoni et al., Reference Colleoni, Rozza and Arvidsson2014), without considering that it may be driven by the relationship between partisanship and age, race/ethnicity, and residential patterns in the United States (Brown and Enos, Reference Brown and Enos2021; Munger, Reference Munger2022) or by the differential propensity of Democrats and Republicans to send and receive ties. In addition, a complete examination of the role of partisanship regarding online social divides requires a comparison to other attributes also behind major divides, like age or race and ethnicity. We fill these gaps by using partisanship information external to Twitter behavior, including a self-reported measure, and by modeling the association of partisanship with following together with other key variables.
1.2 Sociodemographic Homophily
Social network researchers have thoroughly studied segregation and homophily by demographic attributes in the United States. In this subsection we summarize this literature for race and ethnicity, age, and gender and detail the existing evidence on ties online, allowing for a comparison of both contexts.
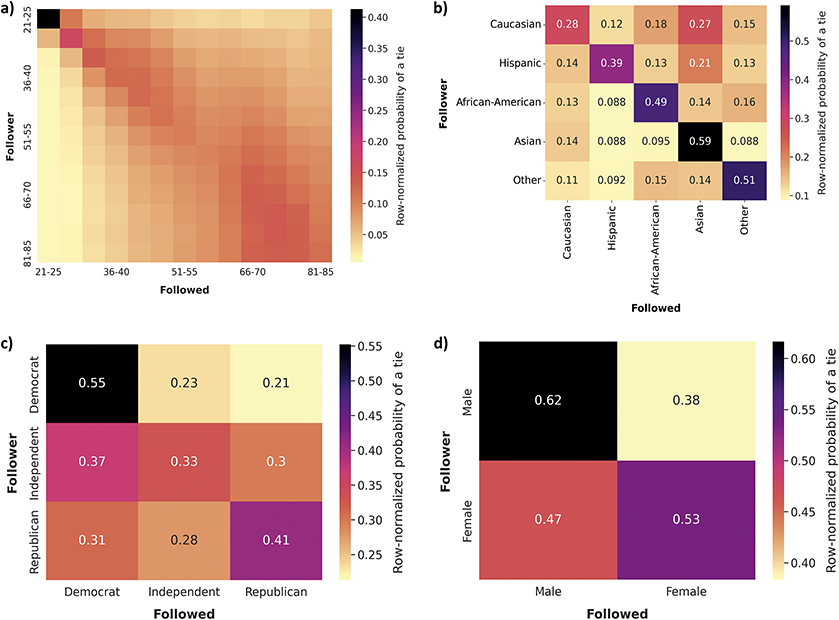
Focusing first on race and ethnicity, a substantial body of research has found them to be one of the demographics with higher levels of homophily in the United States (McPherson et al., Reference McPherson, Smith-Lovin and Cook2001; J. A. Smith et al., Reference Smith, McPherson and Smith-Lovin2014), especially in contexts like schools and colleges (Currarini et al., Reference Currarini, Jackson and Pin2010; Moody, Reference Moody2001; Shrum et al., Reference Shrum, Cheek and Hunter1988; Wimmer and Lewis, Reference Wimmer and Lewis2010). The frequency of cross racial ties in the core networks of US residents was, in 1985, less than one-seventh the expected if ties were random (Marsden, Reference Marsden1988; McPherson et al., Reference McPherson, Smith-Lovin and Cook2001), and stayed similar in 2004 (J. A. Smith et al., Reference Smith, McPherson and Smith-Lovin2014). African-Americans, followed by Asians, Hispanics, and finally Whites, show the highest levels of homophily. Research with Facebook data from US college campuses and high schools find similar racial and ethnic homophily patterns as for offline relationships, although only a portion of this homophily is attributed to choice homophily (Lewis et al., Reference Lewis, Gonzalez and Kaufman2012; Mayer and Puller, Reference Mayer and Puller2008; Wimmer and Lewis, Reference Wimmer and Lewis2010). Race homophily has also been found in other online environments, such as MySpace or Grindr, with some variation in the groups displaying more homophily (Mazur and Richards, Reference Mazur and Richards2011; Salamanca et al., Reference Salamanca, Janulis and Elliott2019; Thelwall, Reference Thelwall2009). Twitter follower networks present homophily for this attribute; however, it is generally lower than for offline relationships (Cesare et al., Reference Cesare, Lee, McCormick and Spiro2017; De Choudhury, Reference De Choudhury2011; Messias et al., Reference Messias, Vikatos and Benevenuto2017). These studies also find higher African-American homophily than for Whites or Asians.
Regarding gender, the homophily patterns across different contexts and types of relationships are more complex. Gender homophily is generally significant before adulthood and then decreases, mainly due to cross-gender kin ties (McPherson et al., Reference McPherson, Smith-Lovin and Cook2001; Shrum et al., Reference Shrum, Cheek and Hunter1988; J. A. Smith et al., Reference Smith, McPherson and Smith-Lovin2014). Non-kin confidant ties remain significantly homogeneous by gender and sex, though less than for race/ethnicity or age. The role of sex and gender in online spaces is mixed, and generally minor. Early research on MySpace, Facebook, and online videogames found small or no gender homophily (Huang et al., Reference Huang, Shen and Contractor2013; Mayer and Puller, Reference Mayer and Puller2008; Mazur and Richards, Reference Mazur and Richards2011; Thelwall, Reference Thelwall2009; Ugander et al., Reference Ugander, Karrer, Backstrom and Marlow2011; Utz and Jankowski, Reference Utz and Jankowski2016), and similarly on Twitter (De Choudhury, Reference De Choudhury2011; Messias et al., Reference Messias, Vikatos and Benevenuto2017), although some studies do find substantial homophily for females (Laniado et al., Reference Laniado, Volkovich, Kappler and Kaltenbrunner2016; Pignolet et al., Reference Pignolet, Schmid and Seelisch2024). In addition, some research documents inequalities in the probability of a tie by these attributes; for example, men tend to gather more followers on Twitter than women (Messias et al., Reference Messias, Vikatos and Benevenuto2017; Shugars et al., Reference Shugars, Quintana-Mathé, Lange and Lazer2024).
Homophily by age is generally high for offline ties, with variation by type of tie; namely, kin ties are heterogeneous regarding age (Marsden, Reference Marsden1988; McPherson et al., Reference McPherson, Smith-Lovin and Cook2001). Online relationships tend to involve substantial homophily for this demographic, especially in social media platforms that most closely mimic offline ties, such as Myspace or Facebook, but also for anonymous spaces like virtual worlds (Kang and Chung, Reference Kang and Chung2017; Liao et al., Reference Liao, Jiang, Lim and Huang2014; Mazur and Richards, Reference Mazur and Richards2011; Thelwall, Reference Thelwall2009; Ugander et al., Reference Ugander, Karrer, Backstrom and Marlow2011; Utz and Jankowski, Reference Utz and Jankowski2016). Interestingly, Ugander et al. (Reference Ugander, Karrer, Backstrom and Marlow2011) find that the likelihood of a Facebook user being friends with someone of a similar age cohort decreases as age increases. Only two studies explore age homophily on Twitter, pointing to its importance for ties in this platform (Liao et al., Reference Liao, Jiang, Lim and Huang2014; Zamal et al., Reference Zamal, Liu and Ruths2012). However, they are focused on the task of inferring age from neighbors and use tweets with birthday wishes or bios as a measure of age, leading to a strong bias toward younger users, particularly those that are eighteen years old.
The current research on sociodemographic homophily in social media has focused on specific populations like students or young adults (Hofstra et al., Reference Hofstra, Corten, van Tubergen and Ellison2017; Laniado et al., Reference Laniado, Volkovich, Kappler and Kaltenbrunner2016; Lewis et al., Reference Lewis, Gonzalez and Kaufman2012; Mayer and Puller, Reference Mayer and Puller2008; Salamanca et al., Reference Salamanca, Janulis and Elliott2019; Utz and Jankowski, Reference Utz and Jankowski2016; Wimmer and Lewis, Reference Wimmer and Lewis2010), has suffered from small samples, or focused on platforms with small user bases (Cesare et al., Reference Cesare, Lee, McCormick and Spiro2017; Kang and Chung, Reference Kang and Chung2017; Liao et al., Reference Liao, Jiang, Lim and Huang2014; Mazur and Richards, Reference Mazur and Richards2011; Thelwall, Reference Thelwall2009; Utz and Jankowski, Reference Utz and Jankowski2016) or potentially biased inference methods based on names and profile pictures (Cesare et al., Reference Cesare, Lee, McCormick and Spiro2017; De Choudhury, Reference De Choudhury2011; Kozlowski et al., Reference Kozlowski, Murray and Bell2022; Liao et al., Reference Liao, Jiang, Lim and Huang2014; Messias et al., Reference Messias, Vikatos and Benevenuto2017; Pignolet et al., Reference Pignolet, Schmid and Seelisch2024; Santamaría and Mihaljević, Reference Santamaría and Mihaljević2018; Zamal et al., Reference Zamal, Liu and Ruths2012). The only exception to these limitations is the work by Ugander et al. (Reference Ugander, Karrer, Backstrom and Marlow2011), who studied the entire Facebook friendship network in 2011 with self-reported age and gender attributes. However, their data is old and focuses on a now outdated model of Social Media, centered on friendship relationships. This limitation is also shared by a large portion of the research reviewed, with the exception of some studies (Cesare et al., Reference Cesare, Lee, McCormick and Spiro2017; De Choudhury, Reference De Choudhury2011; Liao et al., Reference Liao, Jiang, Lim and Huang2014; Messias et al., Reference Messias, Vikatos and Benevenuto2017; Pignolet et al., Reference Pignolet, Schmid and Seelisch2024; Zamal et al., Reference Zamal, Liu and Ruths2012), that, however, rely either on inference methods or on small or nonrepresentative samples and are also generally old.
Altogether, this means that an up-to-date assessment of sociodemographic homophily on social media, with large-scale accurate data and for a modern platform, is missing. We fill this gap by leveraging a dataset of social media users linked to demographic information, which is self-reported in the case of sex and age or based on inferences using offline voter file data in the case of race/ethnicity. We are the first to analyze homophily by age, gender, and race together in the same study. In addition, we also combine these attributes with partisanship. To address the potential biases of our sample due to the panel matching procedure and of our race/ethnicity inferences, we validate our measures and results with survey data that includes self-reported sociodemographics.
1.3 Geography Online
A crucial difference between online and offline ties regards the opportunity structures delineating who is potentially available to establish a relationship, as these are much narrower offline than online due to the role of geography. The increasing importance of the internet led some scholars to argue that geographical constraints would play a secondary role for social relationships (Cairncross, Reference Cairncross1997; Rainie and Wellman, Reference Rainie and Wellman2012). However, location still strongly impacts different types of social interaction, such as mobile phone calls and messages, and social networks in general (Lengyel et al., Reference Lengyel, Varga, Ságvári, Jakobi and Kertész2015; Mok et al., Reference Mok, Wellman and Carrasco2010). While traveling and communication technologies allow for geographically dispersed social networks, physical co-presence still significantly conditions socialization (Bidart et al., Reference Bidart, Maisonobe and Viry2022; Small and Adler, Reference Small and Adler2019). The evidence in online spaces is also clear: Shorter distances or spatial co-occurrence are strongly associated with having a tie in a variety of platforms, such as LiveJournal (Liben-Nowell et al., Reference Liben-Nowell, Novak, Kumar, Raghavan and Tomkins2005), Facebook (Backstrom et al., Reference Backstrom, Sun and Marlow2010; Bailey et al., Reference Bailey, Cao, Kuchler, Stroebel and Wong2018; Spiro et al., Reference Spiro, Almquist and Butts2016) and even virtual worlds (Huang et al., Reference Huang, Shen and Contractor2013), although social media ties seem to be less associated with distance than phone communication ties (Lengyel et al., Reference Lengyel, Varga, Ságvári, Jakobi and Kertész2015). The association between distance and online ties tends to follow a power-law, so that users living at 10 km or less are orders of magnitude more likely to be connected than users at a distance of 1000 km or more (Backstrom et al., Reference Backstrom, Sun and Marlow2010; Grabowicz et al., Reference Grabowicz, Ramasco, Gonçalves and Eguíluz2014; Huang et al., Reference Huang, Shen and Contractor2013; Liben-Nowell et al., Reference Liben-Nowell, Novak, Kumar, Raghavan and Tomkins2005).
In principle, the informational focus of follower-based platforms should imply a lower influence of geography than for social media platforms based on offline ties like Facebook. Although this seems to be true (Grabowicz et al., Reference Grabowicz, Ramasco, Gonçalves and Eguíluz2014), the relationship between physical location and different types of interactions on Twitter is strong. On the platform, networks of mentions between locations can be mapped to existing sociocultural and political regions (Arthur and Williams, Reference Arthur and Williams2019; Hedayatifar et al., Reference Hedayatifar, Rigg, Bar-Yam and Morales2019), and echo-chamber like conversations are geographically confined to areas of around 50 km in radius (Bastos et al., Reference 58Bastos, Mercea and Baronchelli2018). In addition, ties on Twitter reproduce or even amplify residential segregation by socioeconomic status (Dong et al., Reference Dong, Morales and Jahani2020; Morales et al., Reference Morales, Dong, Bar-Yam and Pentland2019). Follower relationships are tied to physical distance and offline connections: Takhteyev et al. (Reference Takhteyev, Gruzd and Wellman2012) find 39% of ties to fall within regional clusters of 100 km or less. Users at shorter distances are also more likely to reciprocate ties and to be embedded in smaller and denser networks (Quercia et al., Reference Quercia, Capra and Crowcroft2012; Stephens and Poorthuis, Reference Stephens and Poorthuis2015). Still, long-distance and transnational ties are also common (De Choudhury, Reference De Choudhury2011; Kulshrestha et al., Reference Kulshrestha, Kooti, Nikravesh and Gummadi2012; Takhteyev et al., Reference Takhteyev, Gruzd and Wellman2012).
Another important insight from this literature is that distance alone cannot explain the impact of geography on ties because users are not evenly distributed in space (Liben-Nowell et al., Reference Liben-Nowell, Novak, Kumar, Raghavan and Tomkins2005). In this regard, a key factor to understand how ties form between two individuals is the volume of alternative options between the locations of these individuals, what we call geographical opportunity structures. This volume of options can be summarized as the population density in between two locations, which is associated with commuting, migration, phone calls, and commodity flows (Simini et al., Reference Simini, González, Maritan and Barabási2012). In other words, what impacts the relationships between individuals or locations is not so much the distance between them, but the number of other opportunities at a similar or lesser distance. This relationship reflects a (structurally induced) process of choosing those with whom to establish a tie that favors individuals that are closer compared to other alternative individuals, rather than closer in raw distance. In practice, this implies that individuals living in rural or low-density areas will tend to have ties to individuals living at more distance than those living in cities. Online, the number of users living closer to each other than to another user has been found to predict ties better than distance for friendship-based platforms (Backstrom et al., Reference Backstrom, Sun and Marlow2010; Liben-Nowell et al., Reference Liben-Nowell, Novak, Kumar, Raghavan and Tomkins2005). This association is relatively unsurprising in this type of social media, where ties typically reproduced offline relationships. In this Element, we test it on Twitter, a follower-based platform where this effect is less expected and find that geographical opportunity structures also dominate over distance.
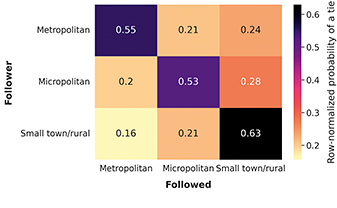
In addition to opportunity structures, other factors, such as state lines, country borders, language, the presence of highways, or the number of air flights, also associate with the likelihood of a tie on social media (Aiello et al., Reference Aiello, Vybornova, Juhász, Szell and Bokányi2025; Bailey et al., Reference Bailey, Cao, Kuchler, Stroebel and Wong2018; Kulshrestha et al., Reference Kulshrestha, Kooti, Nikravesh and Gummadi2012; Takhteyev et al., Reference Takhteyev, Gruzd and Wellman2012). In this work, we find that follower ties are significantly more likely to be within state boundaries and that the urbanicity of users’ residential area (a previously unstudied factor) also associates with follower ties. These relationships hold even when accounting for physical proximity, implying that both urbanicity and state borders are associated with social foci on Twitter. The scale and detail of our data allow us to add to previous research on geography and follower ties, which generally relied on small samples of ego networks. Only Grabowicz et al. (Reference Grabowicz, Ramasco, Gonçalves and Eguíluz2014) take into account the distribution of distances among random dyads of Twitter users and calculate probabilities of a tie, as we do in our analysis. More generally, the lack of detailed geographical data linked to online activity is an enduring challenge of Internet research (Bastos, Reference Bastos2021), and most of the reviewed research relies on user defined location or geolocated tweets. In contrast, we have access to the precise location of users’ residence from the voter file.
2 Studying Attention Networks
As we mentioned previously, the central innovation of our work allowing us to expand upon previous evidence on follower ties is the usage of a dataset linking Twitter users with voter file records. In this section, we detail the construction of this dataset, inspect the quality of the attributes present in the voter file and explain how we construct the geographical variables we use. While our approach is not without limitations, we also use a dataset of users linked to survey responses for validation purposes. After describing the data and variables, we then unpack the methods we use to study follower patterns on Twitter, which speak to some of the mechanisms from the social networks’ literature explained in Section 1.
2.1 Data Description
Our main dataset is constructed from a panel consisting of 1,643,182 US registered voters on Twitter, used in previous work to study the information ecosystem on this platform (Gallagher et al., Reference Gallagher, Doroshenko, Shugars, Lazer and Foucault Welles2021; Grinberg et al., Reference Grinberg, Joseph, Friedland, Swire-Thompson and Lazer2019; Özturan et al., Reference Özturan, Quintana-Mathé, Grinberg, Ognyanova and Lazer2025; Shugars et al., Reference Shugars, Gitomer and McCabe2021; Yang et al., Reference Yang, Goel and Quintana-Mathé2025). This panel was built from the Twitter Decahose, a collection of daily 10% samples of all tweets posted, between January 2014 and March 2017 (Hughes et al., Reference Hughes, McCabe and Hobbs2021), using a methodology similar to Grinberg et al. (Reference Grinberg, Joseph, Friedland, Swire-Thompson and Lazer2019). All unique users in this dataset were extracted, signifying a near exhaustive list of profiles that were active during that period. The Twitter profiles of these accounts with identifiable names and US locations were matched to public voter records accumulated by the vendor TargetSmart in October 2017. Individuals in the voter file were linked when a single Twitter user matched the name and city or the name and state of the individual (Hughes et al., Reference Hughes, McCabe and Hobbs2021). In addition to allowing access to demographic and partisanship information, the linkage to voter records ensures that members of our sample on Twitter correspond to real people offline (without bots and organizations). We only study users registered to vote, providing a sampling frame for our study (US registered voters on Twitter) and therefore overcoming a common pitfall of social media research (Tufekci, Reference Tufekci2014). However, a disadvantage of our voter file matching approach is the potential for several biases. First, due to the linking procedure, individuals with rare names are more likely to be included in the panel. In addition, the panel inherits the biases of voter files such as race/ethnicity disparities in who is listed in these datasets (Jackman and Spahn, Reference Jackman and Spahn2021). Given these risks, previous work compared the demographic composition of the panel to representative survey samples of US voters on Twitter (Hughes et al., Reference Hughes, McCabe and Hobbs2021), and found that it was generally similar. Still, the panel overrepresents White users and underrepresents Hispanics and Asians. It also includes slightly more females and misses Twitter users below eighteen years old when the panel was built in 2017.
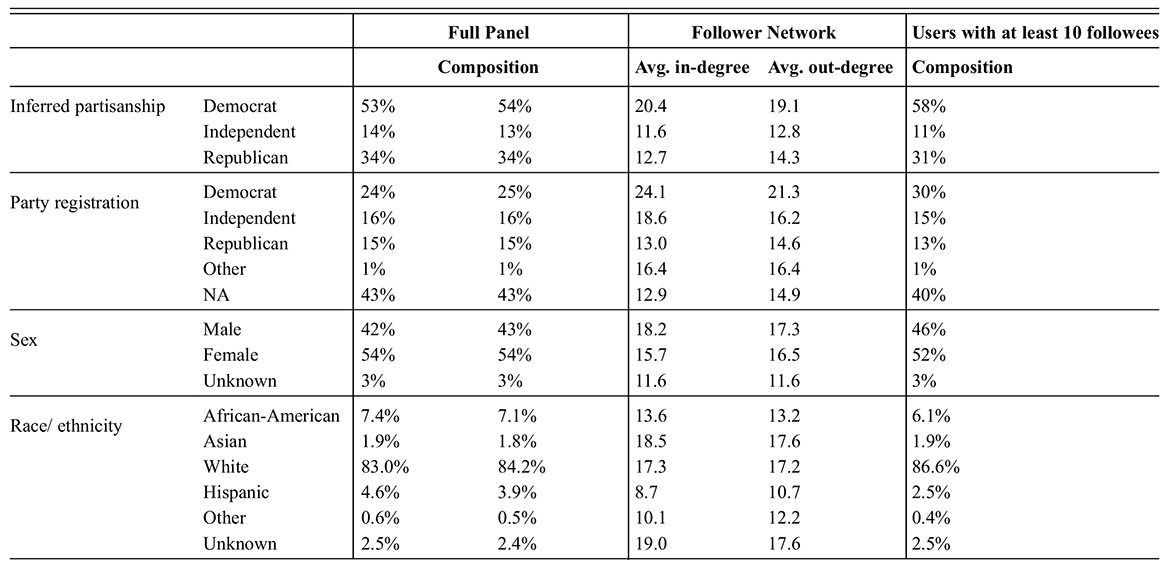
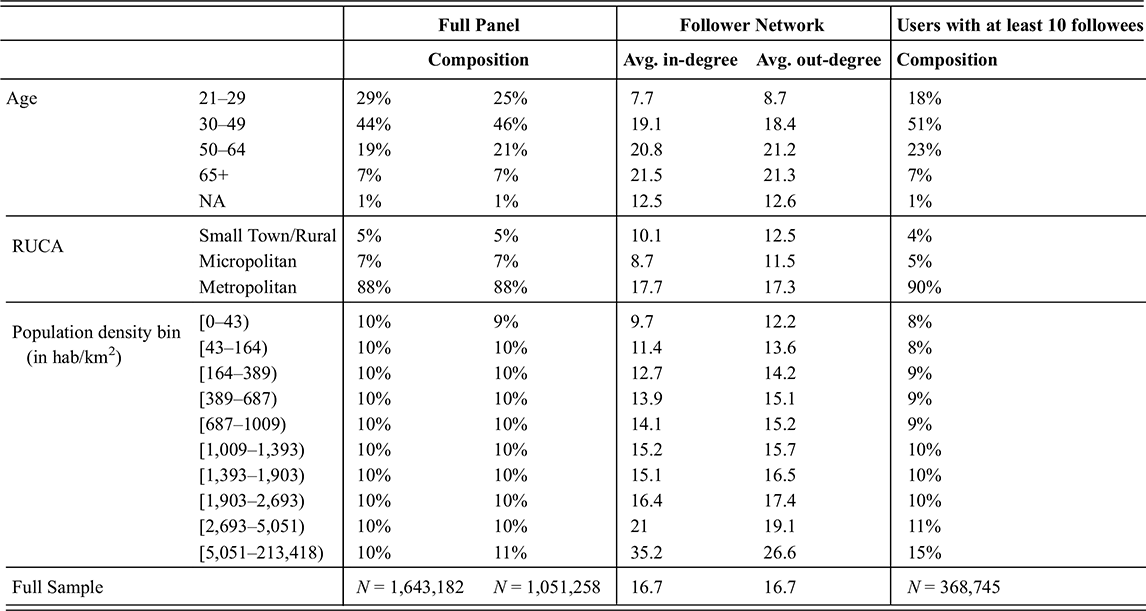
The main focus of this Element is the follower network between the users of the panel just described. To construct it, we collected the lists of users followed by each member of the panel through the Twitter API between September 2020 and January 2021, obtaining data for 1,216,842 users. Users in the original panel for which we did not obtain follower information either followed no users, deleted their account, had it suspended, or made it private. We construct a network by incorporating directed edges when one panel member follows another. We do not include isolated nodes, corresponding to users who do not follow and are not followed by any other panel member. In practice, this means that we restrict our analysis to users with some degree of following activity on Twitter. The resulting network comprises 1,051,258 million nodes (about 1.4% of all US Twitter users in 2021Footnote 1) and 17,547,086 million connections, and we use it as a sample of the network of relationships among US registered voters on Twitter. In particular, the edges in this network comprise 3.3% of all the follower ties of the users included. We provide in Table 1 a description of the demographic composition of the whole Twitter panel and of the subset included in the network studied. The composition of both samples is very similar, confirming that the users in the follower network on which we focus this work are generally representative of US registered voters on Twitter. In Online Appendix 11, we display the degree distributions of the network and study how concentrated follower ties are among a small number of users. The in-degree distribution is heavy tailed, despite the filtering to US registered voters on the platform (and the exclusion of organizational accounts). Attention is heavily concentrated on a small set of users: The top 1% users by follower count account for 42% of the follower ties.

Table 1a Long description
This table contains one row for each category of the variables (Inferred partisanship, Party registration, Sex, Race/ethnicity, Age, RUCA Code, Population density), and a last row for the full sample. These variables are detailed in column 1. Column 2 details the categories of each variable (such as Democrat, Male, or 21–29). Column 3 includes the percentage of the full Twitter panel in each category, Column 4 the percentage of the network studied in each category, Columns 5 and 6 the average in and out degree (respectively) of members of each category in the network, and Column 7 the percentage of users with at least 10 followees in each category.

Table 1b Long description
This table contains one row for each category of the variables (Inferred partisanship, Party registration, Sex, Race/ethnicity, Age, RUCA Code, Population density), and a last row for the full sample. These variables are detailed in column 1. Column 2 details the categories of each variable (such as Democrat, Male, or 21–29). Column 3 includes the percentage of the full Twitter panel in each category, Column 4 the percentage of the network studied in each category, Columns 5 and 6 the average in and out degree (respectively) of members of each category in the network, and Column 7 the percentage of users with at least 10 followees in each category.
In addition to this panel dataset, we also use data from the Covid States project,Footnote 2 a large-scale survey where we asked respondents to provide their Twitter handle (see Online Appendix 1 for a description of this dataset). We expect the self-reported attributes from the survey to be of high accuracy. Therefore, we use the survey to validate the voter file measures, using the Twitter users present in both datasets (more information later in this subsection and in Online Appendix 1). A drawback of the survey dataset is its relatively small size, which prevents a robust understanding of follower patterns – because follower ties among two random users are very rare. Still, we also use it to validate some of the analysis with the voter file by reproducing it with the survey users (see Online Appendix 2) and find qualitatively similar results.
Regarding the variables present in the voter file, we have access through it to administrative data on age and sex. We add three years to the voter file age to match the period through which we collected the follower data. Our sex variable is a binary measure, self-reported during voter registration. It is unable to describe gender beyond the gender binary and may not account for transgender individuals (Shugars et al., Reference Shugars, Quintana-Mathé, Lange and Lazer2024), therefore, we refer to it as sex. The race/ethnicity variable provided in the voter file is self-reported for states affected by the Voting Rights Act (VRA),Footnote 3 and is inferred by TargetSmart for the other states based on the voter registration information. In addition, the voter file provides two types of partisanship information: party registration, and the probability of supporting the Democratic Party inferred from the voter file records. We bin this probability as recommended by TargetSmart into Republican (0–0.35), Independent (0.35–0.65), and Democrat (0.65–1). Party registration is available in thirty of the fifty US states with substantial variation in how it is registered by state (Ansolabehere and Hersh, Reference Ansolabehere and Hersh2012; Hughes et al., Reference Hughes, McCabe and Hobbs2021). In contrast, the inferred measure of partisanship provides coverage across all the United States and a more consistent measurement across states, and we use it as our main partisanship measure.
The voter file measures of race/ethnicity and partisanship were validated at the county level for partisanship and against a different voter file based inference for race/ethnicity, with overall good results (Shugars et al., Reference Shugars, Gitomer and McCabe2021). In addition, individual-level validation against survey data was realized for a small sample of 182 panel members, finding good matching for gender, but more significant mismatch for race/ethnicity minorities and partisanship (Hughes et al., Reference Hughes, McCabe and Hobbs2021). Here we use the sample of Twitter users from the Covid States survey data for further validation, using the set of 792 Twitter handles that are in both the panel and the survey data (see Online Appendix 1). We find excellent matching for gender and age, good matching for Democrats and Whites, decent matching for African-Americans and Republicans, and significant discrepancies for Hispanics and Asians. We also observe that party registration matches the survey responses better than inferred partisanship, so we replicate our results with party registration in Online Appendix 4 as a robustness check. The matching for race/ethnicity is not higher in states under VRA preclearance; however, the number of users from these states in both survey and panel datasets is small. We replicate some of our race/ethnicity results for users in these states in Online Appendix 6.
2.2 Geographical Variables
In addition to demographic and partisanship information, we use a set of geographical variables derived from the census tract and the latitude and longitude where each panel member resides. While voter file records are not without issues, we expect these variables to be of relatively high accuracy (Jackman and Spahn, Reference Jackman and Spahn2021), except for the fraction of users who changed residence between 2017, the year of collection of the voter records, and 2020, the year of collection of the follower data. Our first measure of geographical proximity between two users a and b is simply the distance (in km) between them. We use the latitude and longitude information to calculate it between all the pairs of users with a tie in our network, and also for a random set of about 110 M pairs of nodes (also called dyads), that we use to approximate the probabilities of a tie at different distance bins (as calculating the distance between the more than one trillion of dyads in our network is computationally prohibitive). We exclude panel members residing in Hawaii and Alaska from this calculation.
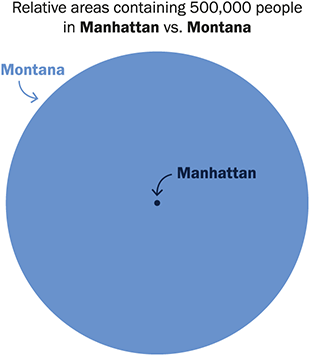
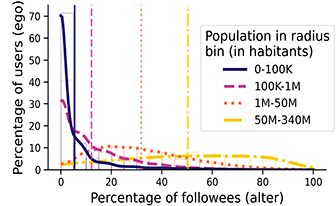
While distance is useful as a first measure of geographical proximity, accounting for opportunity structures is a crucial factor when studying the relationship of physical space with social relationships (see Section 1.3). For example, someone residing in a dense metropolitan area has a lot of opportunities for contact at short distances, while someone residing in a rural area has very few opportunities at short distances. To illustrate this fact, we depict in Figure 1 the relative areas needed to contain 500 K habitants around the city of Helena in Montana (the capital of one of the states with less population density in the United States), and around the Empire State building in Manhattan (the most densely populated area in the United States). From this graphic, it becomes apparent that someone in Montana is much more likely to have social ties with others that live at 1 or 2 km than someone in Manhattan. The question we are set to answer is how the impact that opportunity structures have on offline social ties translates to online follower ties, which are of a distinct nature. The radius of the circle around Helena in Figure 1 is 160 km: There are 1,777 users in the follower network that we study within this circle and the probability of a follower tie among two users is 0.0021. In contrast, the probability of a follower among two users in the circle of radius 160 km around the Empire State Building is 9.2 × 10⁻⁵, so 23 times lower – and there are 105 K users in this circle. This example clearly shows the importance that geographical opportunity structures can have on follower ties; to systematically study it with our data, we develop a measure that we call population in radius.
Depiction of the relative areas needed to contain 500,000 habitants around the city center of Helena, the capital city of Montana, and around the Empire State Building in Manhattan. The diameter of the circle around the Empire State Building is 2.6 km, while it is 160 km around Helena (62 times greater).

We compute, for a given pair of user a and b, the total population residing in a circle around a of radius the distance between a and b, and call this value the population in radius between two users. This measure provides an estimation of the opportunities that a has to build a tie to someone else residing closer or as close to them as b. To calculate it, we geolocate the census tract of panel member a, and sum the population of all the census tracts intersecting with a radius r around the centroid of a’s census tract, where r is the distance between a and b. We run this calculation for all pairs of panel members with a tie between them and for a random subsample of about 17 M dyads, also excluding users residing in Hawaii and Alaska. In addition to these two proximity variables, we also use a simple dyadic variable on whether two users are within the same state in Section 5, to study the role of state borders on follower ties.
We are also interested in how the rural or urban status of the residential area of users is associated with their following patterns. We use the Rural-Urban Commuting area (RUCA) codes of the census tract of users as a measure of the rural status of their tract. This categorization of census tract considers commuting flows in addition to population density and urbanization.Footnote 4 For example, low density census tracts with large commuting flows to a metropolitan area are categorized as metropolitan areas. We group codes 1–3 as Metropolitan areas, codes 4–6 as Micropolitan areas, and codes 7–10 as Small Town/Rural areas. In addition to RUCA codes, we also use the population density of users’ census tract, binned in deciles calculated from the full Twitter panel (see Table 1 for the resulting population density values of each bin). While the RUCA categorization is effective at detecting rural areas isolated from metropolitan areas, it categorizes most census tracts as metropolitan. Using the census tract population density allows differentiating highly dense metropolitan areas, such as city centers, from other lower density metropolitan areas.
In sum, our analysis focuses on the follower network among 1,051,258 twitter accounts matched to US voter records, from where we use the age, sex, race/ethnicity, inferred partisanship, and location attributes. We use five variables based on users’ location in our analysis: three dyadic measures (distance, population in radius, and residing in the same state), and two individual measures of urbanicity: RUCA codes and population density of the census tract. Table 1 provides summary descriptives on all individual-level variables, including the average in- and out-degree of each group. Given the potential issues in this dataset, we provide validation checks with alternative measures and data. First, with a dataset of Twitter accounts volunteered from survey users that we use to both validate the panel measures and the follower analysis. Second, we run additional robustness checks for partisanship and race/ethnicity, the attributes from the voter file that seem less reliable: We replicate our results with the party registration attribute, and for Race/ethnicity in the Voter Registration Act states where it is self-reported.
2.3 Methods
At the beginning of Section 1, we summarized various network formation mechanisms from the Social Networks literature, focusing on how they can generate tie similarity in a network. Tie similarity can simply be measured as the percentage of ties that are among same group members. Our analysis does not aim at causally describing follower tie formation and dissolution; however, we use four measures or methods that incrementally build up from simply describing ego-network composition and raw tie similarity to shed some light on the potential role of some mechanisms. Some of our measures describe following patterns in general (Measures 1 and 3), and therefore we use them with geographical variables as well as with other attributes, while others focus on homophily (Measure 2), and we use them only with the demographic and partisanship attributes. Before diving into the details of each measure, we describe and contextualize the different processes generating tie similarity that our measures address.
A first process is simply baseline homophily (McPherson et al., Reference McPherson, Smith-Lovin and Cook2001), due to the unequal sizes of the categories of an attribute. In the stylized case of an attribute with two categories, the larger category will, in aggregate, send and receive more ties while the smaller groups will send and receive less. Because of that, ties for members of the larger group will be more likely to be homogenous than for members of the smaller group. From the lens of attention networks, we start by studying how users’ attention is split up between different groups depending on each user’s own group (Measure 1), and regardless of the number of users in each group. If a group is dominant on Twitter, we expect that it will attract, on aggregate, large amounts of attention (i.e. followers). However, we are also interested in the tendency to pay attention to some groups or to others once group sizes are accounted for, because these tendencies are informative of how users allocate attention to some groups or others. In the Social Networks literature, the homophily above baseline homophily is termed inbreeding homophily; in this work we generally refer to it as simply homophily. Measures 2–4 deal with this effect by focusing on the estimation of probabilities of a tie.
In a directed network, the differential propensity of groups to send and receive ties can lead to inbreeding homophily and/or heterophily (the tendency of ties to connect dissimilar individuals). We call these differential propensities differential activity and popularity that are termed sociality for undirected networks (Goodreau et al., Reference Goodreau, Kitts and Morris2009; Wimmer and Lewis, Reference Wimmer and Lewis2010). If ties are distributed randomly in a network, with the only constraint being the degree of each node, and a given group tends to have higher in or out-degree, this group will display inbreeding homophily while the other groups will display inbreeding heterophily. In other words, in-group follower ties may be highly likely for a group attracting large amounts of attention just because ties often link to popular individuals that also happen to be in-group members. For the same reason, members of the other groups may display inbreeding heterophily. Equivalent effects may appear due to the different propensity to send ties of each group. In short, the tendency to pay attention to popular users or to allocate attention to more/less other users can lead to segregated attention patterns for some groups without any preference for similar others. Considering the different number of accounts that each user follows (the activity of each user) is also important from the standpoint of the attention distribution, because the attention available for each user is divided among each account followed. Therefore, users who follow less accounts should, in principle, pay more attention to each of them than users following more accounts. We address differential activity and popularity with logistic regressions in measures 2 and 4. We also deal with differential activity in measure 3 by row-normalizing the probabilities of a tie.
Finally, a third mechanism between observed levels of inbreeding homophily by one attribute is homophily or heterophily by another attribute. For example, if two attributes are correlated, like in our case partisanship and race/ethnicity, a preference for same group ties for one attribute will generate inbreeding homophily for the other attribute even without homophilous preferences for this second attribute. This effect is closely related to Blau’s (Reference Blau1977) work on consolidation, and, while substantially studied for offline ties, has been generally overlooked in the research on homophily online. Similarly, inbreeding homophily by one attribute may be the result of confounding by other variables, such as physical proximity. Interests in social media that are geographically driven can lead to following similar users, or political interests may lead to partisanship homophily and subsequently to racial homophily. We partially address these effects, focused on the multivariate relationship among variables with follower ties, with logistic regressions in measure 4. The details of our measures are as follows:
1. We describe the composition of the followee sets of users for attribute A by calculating, for all users, the percentage of their followees that are in each group a1, …, an of A. We plot the distribution of these values for each group and compute their averages, allowing a close look at the percentage of followees of users of group ai that are members of each group. To reduce the influence of the large set of low out-degree users, we only include in the results the users who follow at least 10 other users in our panel, resulting in 368,745 users (see Table 1 for the demographic composition of this subgroup that is similar to the larger network). With the goal of correcting for the lack of representativity of our sample regarding sex and race, we weight the calculation using the comparison to representative survey samples of US voters on Twitter from Hughes et al. (Reference Hughes, McCabe and Hobbs2021). We discretize distance, population in radius, and age in four bins and look at how the percentages of followees falling in each bin are distributed.
2. We fit simple logistic regressions at the dyad level with the following form:
where y is an indicator variable of having a tie in the network. Given attribute A, H is a categorical variable that takes value 0 when the group of the sender and the receiver of the tie are different, and the value of the matching group when they are equal. For example, in the case of sex, H takes value 0 when the tie is non-homophilous, Male when the tie is between two males, and Female when the tie is between two females. as is a variable for the group of the sender of the tie and ar for the group of the receiver of the tie.
 stands for a set of as many parameters as the number of groups in A, and similarly for
and
. This model can be quickly fitted after calculating the number of ties and the number of dyads without a tie for each combination of the groups (that is, with the data in a frequency format). The resulting parameters
,
, and approximate relative risks after exponentiation, given that ties are orders of magnitude more likely than no-ties (King and Zeng, Reference King and Zeng2002; Kossinets and Watts, Reference Kossinets and Watts2009). The estimates exp(
, one for each category a1, a2, …, an of A, are interpreted as the number of times an homophilous tie for the category is more likely than a non-homophilous tie. The
and
parameters model how the fact that the sender and receiver of the tie are members of each group is associated with the probability of a tie. Hence, when as and/or ar are included in the model, the exp(
estimates are measures of inbreeding homophily controlling for the differential propensity of each group to send and/or receive ties. In the case of age, a numerical variable, we model homophily as the absolute difference in age between members of the dyad, We also operationalize age homophily with a second specification, as
, accounting for the fact that younger users are significantly more likely to follow similar age users than older users (see Figure 3 in Section 3). We control for differential activity and popularity by including the age (or
) of the sender and receiver of the tie in the regression.
stands for a set of as many parameters as the number of groups in A, and similarly for
and
. This model can be quickly fitted after calculating the number of ties and the number of dyads without a tie for each combination of the groups (that is, with the data in a frequency format). The resulting parameters
,
, and approximate relative risks after exponentiation, given that ties are orders of magnitude more likely than no-ties (King and Zeng, Reference King and Zeng2002; Kossinets and Watts, Reference Kossinets and Watts2009). The estimates exp(
, one for each category a1, a2, …, an of A, are interpreted as the number of times an homophilous tie for the category is more likely than a non-homophilous tie. The
and
parameters model how the fact that the sender and receiver of the tie are members of each group is associated with the probability of a tie. Hence, when as and/or ar are included in the model, the exp(
estimates are measures of inbreeding homophily controlling for the differential propensity of each group to send and/or receive ties. In the case of age, a numerical variable, we model homophily as the absolute difference in age between members of the dyad, We also operationalize age homophily with a second specification, as
, accounting for the fact that younger users are significantly more likely to follow similar age users than older users (see Figure 3 in Section 3). We control for differential activity and popularity by including the age (or
) of the sender and receiver of the tie in the regression.


3. We calculate the probability that a user in group ai follows another user in group aj by counting the number of ties between users of groups ai and aj and dividing it by the number of dyads (that is, possible ties) of users of groups ai and aj. We display these probabilities of a tie in row-normalized heatmaps that allow visualizing the likelihood that there is a tie between two random members of each pair of groups. We row-normalize by dividing the probability of a tie from group ai to group aj by the sum of probabilities of a tie from group ai to groups a1, …, an. This normalization controls for the differential activity of each group and displays, from the point of view of one group, the relative probability of a tie with each other group. In other words, row-normalizing provides a view on how attention is divided among the users followed by taking into account that users of different groups may follow more/less accounts, similarly as the activity control in point 2 does. We display non-normalized probabilities in Online Appendix 7. In the case of geographical proximity variables, we calculate the probability of a tie for a large set of small-sized bins. Given the huge number of dyads in the network, we approximate the number of dyads in each bin from a random sample of dyads (see Section 2.1). In addition to bivariate heatmaps, in Sections 4.2 and 4.3 we also plot heatmaps for one variable broken down by population in radius to explore the interaction between physical proximity and follower patterns. We group the follower ties and dyads in different bins of population in radius values and calculate row-normalized probabilities of a tie separately for each bin. Online Appendix 8 includes details on the calculation and interpretation of these heatmaps; their key feature is that they display the follower tendencies at a given range of population in radius values.
4. Finally, we fit logistic regressions adding multiple variables in the same model in a stepwise fashion, to detect when the association between one variable and the probability of a tie is driven by another variable. As in point 2, the exponentiated parameters from the model approximate relative risks. This allows interpreting them as the factor by which the probability of a tie is multiplied when increasing a continuous variable by one unit or when a categorical variable takes a given value instead of the reference value. We include the categorical variables in the model as homophily variables with activity and popularity controls as in point 2. Therefore, the coefficients resulting from these regressions are measures of homophily that account for the association among the variables introduced, for differential sociality and activity, and for baseline homophily. We add in our models the population in radius, a dyadic variable that is computationally intractable to calculate for all dyads in the network. Hence, we apply the case-control methodology by randomly sampling as many dyads without a tie as the number of edges (King and Zeng, Reference King and Zeng2001, Reference King and Zeng2002; Kossinets and Watts, Reference Kossinets and Watts2009). We filter dyads where at least one of the nodes has no data for any of the variables used, resulting in a total of 31,191,744 dyads to which the models are fit. To our knowledge, using network-specific models such as Exponential Random Graph Models (ERGMs), which would be more statistically appropriate, on a network as large as ours with a variable requiring a dyadic calculation is not practical. Recent advances in the efficiency of ERGM estimation (Stivala et al., Reference Stivala, Robins and Lomi2020) may allow fitting an ERGM to our network, but without measures of geographical distance (because they cannot be derived from nodal attributes). These are the variables with the largest explanatory power in our results, previously studied in isolation from other correlates of ties online. Therefore, we prioritized including them against using the (otherwise) optimal statistical framework.
Given the very large number of edges in the network, we focus the interpretation of the results on effect sizes rather than on statistical significance, and provide summaries of uncertainty measures. The next three sections walk through our results. Section 3 contains the bivariate results on demographics and partisanship, from measures 1–3. Section 4 presents results on geography, also using measures 1–3. Finally, Section 5 contains the multivariate logistic regressions of measure 4.
Distribution of followee sets by (a) inferred partisanship, (b) race, (c) age, (d) sex. Vertical lines correspond to average values for each distribution. See Section 2.3 for a description of the calculation.
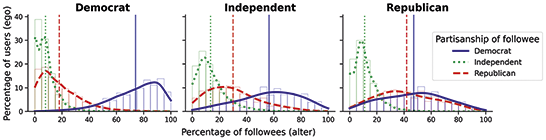
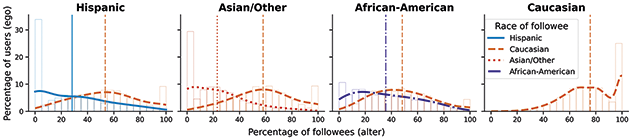
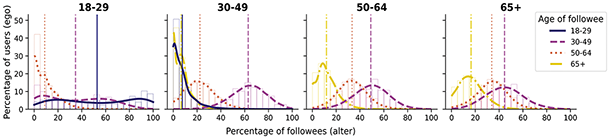

Heatmaps with row-normalized probabilities of a tie by age, race/ethnicity, inferred partisanship, and sex, in panels (a), (b), (c), and (d), respectively. Color scales change for each panel.

3 The Role of Demographics and Partisanship
In this section we describe how attention patterns on Twitter associate in bivariate analysis with demographics and partisanship. We focus on homophily, shedding light to the extent that social media tends to amplify social divides, and comparing the importance of similarity by sex, age, race/ethnicity, and partisanship in structuring attention networks online. In addition, we also study if some subgroups tend to attract large amounts of attention. We start with the results on the composition of the users followed with respect to each focal user (point 1 of Section 2.3). Then, we describe the follower patterns taking group size into account (points 2 and 3 of Section 2.3) for partisanship, sex, race/ethnicity, and age.
3.1 Followee Set Composition
As described in Section 2.3, we examine the categorical composition of the followee sets (the set of users followed) of users of each demographic group – for example, the proportion of male users’ followees that are male versus female. This analysis shows how attention is distributed by the variables studied without accounting for the Twitter userbase composition. In other words, it answers questions such as “Which partisanship groups are Republicans paying attention to?” or “Do female users pay more attention to females or males?” regardless of why attention is distributed this way (an important reason being that some groups constitute a minority or majority of the pool of available options). Figure 2 shows how the followee sets of users with out-degree at least 10 are distributed by partisanship, race/ethnicity, age, and sex. Democrats are the majority partisanship in followee across all three parties and are substantially segregated: 88% of Democrats have at least 50% of Democrats in the users they follow. Followee set composition varies considerably: They are politically very homogenous for some users, while very diverse for others. Results using party registration show similar network segregation for Republicans and Democrats (see Online Appendix Figure 3).
Males follow significantly more males than females, while females follow males and females equally: 83% of males have majority-male followees, while only 50% of females have majority-female followees. This pattern is striking given the roughly equal gender representation on Twitter (Hughes et al., Reference Hughes, McCabe and Hobbs2021), and echoes previously reported gender disparities in who gets attention on the platform (Messias et al., Reference Messias, Vikatos and Benevenuto2017; Nilizadeh et al., Reference Nilizadeh, Groggel and Lista2021). Regarding race and ethnicity, Whites dominate all groups’ followee set, reflecting that most US Twitter are White (see Table 1). However, same-race/ethnicity following varies widely: While many minority users follow few same-race/ethnicity users, a relatively significant portion have followee sets where their group constitutes a majority or Whites are not the majority. This is especially true for African-Americans: 17% follow 10% or fewer African-Americans, while 30% follow 50% or more. Regarding age, users between 30 and 49 dominate followee sets across all age cohorts except 18- to 29-year-olds. This younger cohort shows enormous variation: 17% of 18- to 29-year-olds have over 90% of followees in their age group, while 10% have under 10%.
Overall, we find that users from some groups (Democrats, Whites, males and 30- to 49-year-olds uses) primarily pay attention to in-group members. These groups dominate in our sample, and their segregated attention patterns reflect (at least in part) simple majority effects. However, the tendency to follow similar others may still play a role, as we explore next. Other groups pay attention to dissimilar others, for example, Republicans follow slightly more Democrats than Republicans on average, and racial minorities follow more White users than same-race/ethnicity users. Similarly, these patterns, driven by group sizes, may mask homophilic tendencies. We observe significant variation in attention segregation across most variables studied, with sizable portions of groups like Republicans or African-Americans primarily following similar others.
3.2 Probabilities of a Tie
In this subsection we present bivariate results focusing on probabilities of a follower tie, therefore accounting for group sizes (points 2 and 3 of Section 2.3). Table 2 shows the exponentiated coefficients of the logistic regressions detailed in point 2. The main coefficients from these regressions are the homophily coefficients, that are estimates of the number of times a tie among members of a given group is more likely than among dissimilar users. These regressions include controls for differential activity and popularity across groups, accounting for inbreeding homophily and heterophily arising from variation in the average ties sent and received per group. Table 2 displays only the homophily coefficients; full results with activity and popularity parameters appear in Online Appendix 3 alongside model details. Although Table 2 summarizes homophily patterns across partisanship and demographics, it does not reveal how following is distributed beyond tendencies toward tie similarity. For example, we may be interested in understanding which groups tend to attract more/less attention. To this end, Figure 3 displays heatmaps with row-normalized probabilities of a tie (point 3 of Section 2.3), offering a detailed view at the follower patterns among the categories of each variable (we also display non-normalized heatmaps in Online Appendix 7).
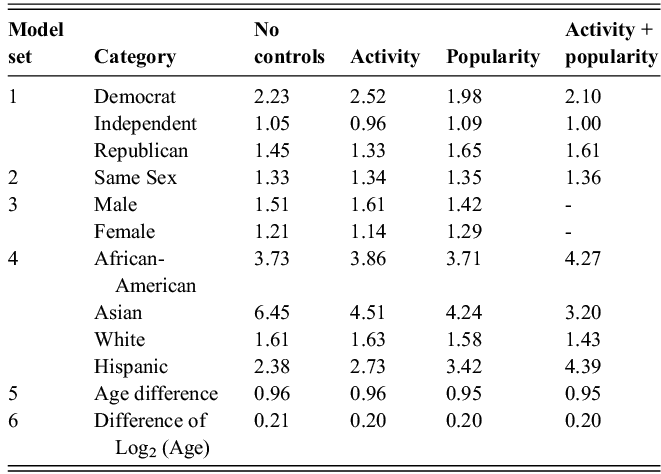
Table 2 Long description
The first column of the table describes the model set of the coefficients, from 1 to 6. Model set 1 is for Inferred Partisanship, Model set 2 for Sex with a same-sex homophily coefficient, Model set 3 for Sex with separate Male and Female homophily coefficients, Model set 4 for Race/ethnicity, Model set 5 for Age difference as the absolute difference in age between ego and alter, and Model set 6 for the difference between the Log2 of ego and alter age. The second column describes the category of the coefficient (Democrat, Male, Asian, etc.), the third column includes the homophily coefficients without any control, column 4 the coefficients controlling by Activity, column 5 controlling by Popularity, and column 6 controlling by Activity and Popularity.
Focusing first on partisanship (using the voter file inferred measure), we find that Democrats show stronger same-party following tendencies than Republicans (Table 2). In addition, Republicans are more likely to follow Democrats than Democrats to follow Republicans (Figure 3, Online Appendix 7). After controlling for popularity and activity, the homophily levels of Democrats and Republicans become closer. This is in line with Democrats’ larger follower and followee count (Table 1): Democrats tend to have more followers and follow more users, generating more within-group ties. As noted in Section 1.1, previous research found that politically active users on Twitter were significantly more polarized than others. We test this finding in our data by examining how partisanship follower patterns vary by the number of tweets about the 2020 election posted (Online Appendix 5). For both inferred partisanship and party registration, Democrats who tweeted about the election show significantly higher homophily. Among Republicans, only those posting over 50 election tweets display higher homophily than non-posters, while those posting 1–50 tweets show slightly lower homophily.
We also study partisanship using party registration instead of inferred partisanship (Online Appendix 4), finding similar homophily levels. While noting that logistic regression coefficients cannot be compared across models fit on different data (Breen et al., Reference Breen, Karlson and Holm2018), these results indicate that our main measure of partisanship, inferred by the voter file vendor, is not leading to an underestimation of partisanship homophily. A difference between both measures worth noting is that registered Republicans are significantly more homophilous than registered Democrats when controlling by activity and popularity. Still, Online Appendix Figure 4 also shows that registered Republicans are more likely to follow registered Democrats than vice versa. Overall, we find that users tend to pay attention to same party members, after accounting for Democrats’ larger presence on Twitter and their tendency to form more ties. We also confirm that politically interested users display higher homophily, particularly Democrats.
Distribution of followee sets by (a) Distance and (b) Population in radius. Vertical lines correspond to average values for each distribution.
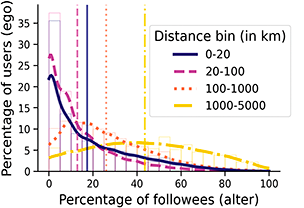

Regarding sex, the binary nature of this variable in our data prevents fitting logistic regressions with separate Male/Female homophily parameters together with activity and popularity controls because there are not enough degrees of freedom in the model (see point 2 of Section 2.3). We therefore fit two different types of logistic regressions: first, with a single homophily parameter encompassing both males and females (Model set 2), and second, with two separate homophily parameters but no activity and popularity controls together in the model (Model set 3). We find moderate sex homophily when aggregated across both groups, with very similar values when controlling for the differential likelihood to send and receive ties (Table 2). However, males show higher homophily than females. This difference diminishes when controlling for popularity, as men have more followers than women (Table 1). In other words, some of the homophilous tendencies of females may be masked by the tendency to follow popular users, who are predominantly male. These patterns point to attention patterns by sex that are better characterized by a domination of male users than by homophily. Accordingly, the raw probabilities of a tie of Online Appendix Figure 8 show that female-male ties are more likely than male-female ties. Overall, these findings match previous literature showing that males tend to gather more attention online (Messias et al., Reference Messias, Vikatos and Benevenuto2017; Nilizadeh et al., Reference Nilizadeh, Groggel and Lista2021).
Turning to race/ethnicity, we find high homophily for minorities and moderate homophily for Whites (Table 2). After accounting for Whites’ and Asians’ higher likelihood to send and receive ties (Table 1), homophily decreases for these groups but increases for African-Americans and Hispanics. Minority Race/ethnicity homophily is very high in VRA preclearance states (Online Appendix 6), where the voter file race/ethnicity measures should be more accurate. We conclude that racial and ethnic minorities have a significant tendency to pay attention to similar users when the large fraction of users who are White as well as unequal popularity and number of followees are accounted for.
Age strongly conditions attention patterns on Twitter. First, we model homophily as a linear relationship between age difference age and tie probability, controlling for differential activity and popularity (Age difference in Table 2). Under this specification, a tie between same-age users is about three times more likely than between users twenty years apart, and about eight times more likely than between users forty years apart. However, Figure 3 reveals that the tie probability by age difference varies significantly by age cohort. Younger users, especially those under thirty, have markedly fewer followers and followees (Table 1). They display very high homophily in the age heatmap of Figure 3, where row-normalization accounts for their lower followee count. If not accounting for it, the raw tie probability between users 60 and 70 years old is roughly two times higher than between users 21 and 25 years old (Online Appendix Figure 8). From the point of view of attention allocation, following less users means that more attention is devoted to each user followed; hence, Figure 3 represents more accurately the high tendency of young users to pay attention to others of a similar age. In contrast, 30- to 50-year-old users tend to follow users further away in terms of age difference, and 50- to 65-year-old users are more likely to follow 65- to 75-year-olds than users of their same age cohort. Overall, the association between age difference and probability of a tie decreases monotonically with age, echoing Ugander et al. (Reference Ugander, Karrer, Backstrom and Marlow2011).
This suggests that the social significance of a given difference in age looms larger when individuals are younger. We model this pattern with a second specification for age homophily (last row of Table 2), the difference of the
 of ages (see Section 2.3 for details). The predictive power of this specification in logistic regressions on tie probability, controlling for activity and popularity, is stronger than for simple age difference (Pseudo R-square of 0.084 compared to 0.074). The coefficient of 0.2 from Table 2 implies that a follower tie between a 25- and a 45-year-old user is about 4 times less likely than between users the same age, while a tie between 55- and 75-year-old users is only 2 times less likely despite the age difference being 20 in both cases. Figure 3 also reveals that ties from young to old users are significantly more likely than ties in the opposite direction, especially for users below 30. Attention patterns by age are therefore well characterized by homophily, with, however, a general tendency to pay more attention to older users. Furthermore, younger users are more likely to pay attention to others of a similar age. We interpret that interest foci in attention networks tend to be segmented by age, with particularly distinct interests for users below 30. This segmentation becomes blurred as age grows, to the point that users above 50 seem to share the interests of users above 65+.
In sum, we find high homophily for racial/ethnic minorities and age, lower but still significant homophily for partisanship, especially for Democrats, moderate homophily for males, and slightly lower for females. Partisanship homophily is weaker than race/ethnicity and age: the maximum gap in tie probability within partisanship categories, a Democrat–Democrat tie compared to a Democrat–Republican tie, consists in multiplying the probability by about 2.5 (Figure 3). In contrast, African-American to African-American ties are 3.5 times more likely than an African-American to White ties, and Asian-Asian ties are 4.1 times more likely than Asian-White ties. For age, 21–29 to 21–29-year-old ties are 3.6 times more likely than 21–29 to 50–64-year-old ties, and 30–49 to 30–49 ties are 4.6 times more likely than 30–49 to 21–29 ties. Beyond homophily, Figure 3 shows that male, Democrat, and older (+65, roughly) users attract disproportionate amounts of attention, suggesting that they tend to be opinion leaders of social foci on the platform. Overall, these results highlight the presence of social divides online with partisanship playing a secondary role compared to race/ethnicity and age. We also find that some groups tend to dominate attention on Twitter.
In Section 2.1, we discussed the presence of biases and inaccuracies in some of the variables we use (mainly race/ethnicity and partisanship). To confirm the findings just described, we run a similar analysis with the follower ties among Covid States survey users in Online Appendix 2. This dataset provides complementary strength and weaknesses: The attributes are self-reported in surveys and should be of higher quality than in the voter file; however, the network of follower ties among these users is a lot smaller and less representative of the follower ties among US Twitter users. We also explore homophily by SES with this dataset, an attribute only available in the survey. The results echo the findings from this section: Race/ethnicity and age homophily are higher than partisanship homophily, and sex homophily is low. Regarding race/ethnicity (the voter file attribute with larger inaccuracies, see Section 2.1 and Online Appendix 1), the survey homophily analysis confirms that African-American and Asian homophily is higher than White homophily, and that White homophily is moderate. However, a noteworthy difference is that Hispanic homophily is low in the survey data. Our tentative findings on SES show the presence of relatively strong SES homophily, particularly for high SES users, that also tend to gather more attention from other users.
4 How Does Geography Structure Follower Ties?
Geography is, generally, the great shaper of social networks. Festinger et al.’s (Reference Festinger, Schachter and Back1950) famous work on the role of housing layout is a classic marker in the literature, where simply living a few feet around the corner was associated with a much reduced likelihood of a tie. In this section we study how the effect of proximity and geography plays out for online follower ties, a markedly different context than offline socialization. We start with our results on physical proximity (Section 4.1) and then focus on the role of the urbanicity of users’ residential area (Section 4.2). The literature on space and social relationships has largely focused on the effects of near versus far on the probability of a tie; and it has rarely looked at how near versus far interplays with other dimensions of similarity beyond how urban spatial segregation impacts social segregation. We address this issue for attention networks in Section 4.3, by studying how the follower patterns by race/ethnicity, partisanship, age and sex vary for proximate compared to distant ties. Overall, our results from this section highlight the central role that geography plays for the distribution of attention online. In addition to physical proximity, urbanicity significantly associates with follower ties: Rural users display homophily, while urban users in dense metropolitan areas attract disproportionate amounts of attention. Finally, we find markedly different follower patterns by physical proximity: Ties to nearby users tend to be homophilous, while ties to users residing far tend to be directed to the dominant groups detected in Section 3.2: +65 users, Democrats, urban residents, and, to a lesser extent, men.
4.1 Distance and Opportunity Structures
We begin with the two dyadic measures of physical proximity: distance (in km) and population in radius, our measure approximating geographical opportunity structures (see Sections 1.3 and 2.2). Figure 4 shows the followee set composition of users with at least ten followers (point 1 of Section 2.3). Distant users dominate followee sets: The median tie spans 915 km and 74 M population in radius. However, there is significant dispersion in the distributions, and many users have relatively local networks: 22% of users have at least 50% of their followees within 100 km. Figure 5 displays how the probability of a following relationship decreases with distance and population in radius. Both variables are very strongly associated with ties on Twitter, displaying heavy-tailed distributions on a log-log scale. The much higher likelihood of a tie among nearby users contrasts with the fact that followees tend reside far away. Although close-distance relationships are much more likely, long-distance ties dominate because most user pairs are separated by large distances: We estimate that only 2% of dyads in our network are within 100 km. Thus, while a large portion of the total attention is on average devoted to distant users, nearby users are disproportionately more likely to get attention.
Probability of a following tie by distance (in km), in panel (a), and by population in radius, in panel (b). Both plots are in log-log scale.

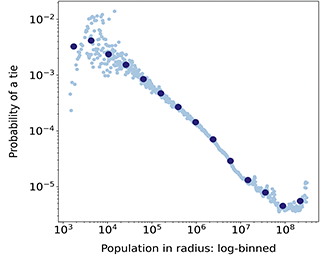
The plots of Figure 5 can be well approximated with straight lines in log-log scale, pointing to a power-law relationship particularly for population in radius and distance up to 1,000 km. The association between distance and probability of a tie vanishes for distances between 1,000 km and 3,500 km and becomes positive for larger distancesFootnote 5. This pattern is consistent with research across different platforms and countries, where distance also ceases to be negatively associated with online relationships beyond 1000 km (Backstrom et al., Reference Backstrom, Sun and Marlow2010; Grabowicz et al., Reference Grabowicz, Ramasco, Gonçalves and Eguíluz2014; Liben-Nowell et al., Reference Liben-Nowell, Novak, Kumar, Raghavan and Tomkins2005). Unlike distance, population in radius is predictive of Twitter ties across nearly its entire range of values, suggesting a stronger association than for distance. To verify this, we run logistic regressions on having a tie, in a similar fashion as in point 4 of Section 2.3, first with each of the variables separately as only predictors and then with both of them together. We take the base 10 logarithm of both variables. The individual regressions yield exponentiated coefficients of 0.35 for distance and 0.37 for population in radius. When including both variables in the regression, the coefficient increases to 1.02 for distance and stays similar, at 0.36, for population in radius, implying no association between distance and follower ties when opportunity structures are accounted for. We conclude that opportunity structures clearly dominate over distance in terms of structuring attention allocation on Twitter.
4.2 Urbanicity and Attention Online
We now examine the two urbanicity measures: RUCA codes, designed to properly distinguish rural areas, and census tract population density, useful to differentiate dense city areas from less urbanized metropolitan areas. The row-normalized heatmaps in Figure 6 show that users tend to follow others residing in similarly urbanized areas. This is especially the case for RUCA categories and for users in the highest density decile. Users in census tracts in the lowest population density decile – only 33% of which are small town/rural tracts by RUCA code – are also significantly likely to follow others in low density areas. These patterns for RUCA codes could be driven by the high tendency to follow nearby users shown in Figure 5, since nearby users typically share the same RUCA code. To test whether this “homophily” by RUCA code persists for ties among users residing far, we plot Figure 6b) broken down by population in radius in Online Appendix Figure 9 (see Section 2.3 and Online Appendix 8 for details on these heatmaps). Users in Small town/rural areas maintain their tendency to pay attention to other rural users up to 10 M population in radius (roughly the population of one large US state or a few smaller states). Moreover, for ties above 100 M population in radius, the row-normalized probability of a Small town/rural homophilous tie exceeds that of a Metropolitan to Small town/rural tie. We interpret that users in rural areas share communities of interest on Twitter that cross relatively large distances.
Heatmaps with row-normalized probabilities of a tie by population density of census tract in deciles (panel (a)) and grouped RUCA category (panel (b)).
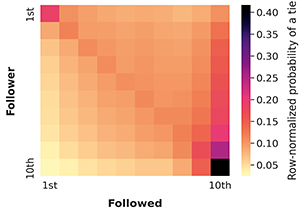

Another pattern apparent in Online Appendix Figure 9 is that long-range following relationships tend to target users in Metropolitan areas. Furthermore, the likelihood of Metropolitan-Metropolitan ties increases monotonically with population in radius (see Online Appendix 8 for details), indicating that the tendency of Metropolitan users to dedicate attention to other Metropolitan users is not driven by short distance following, but by following others in distant cities. Figure 6b) shows that users in high-density areas tend to attract disproportionate attention: Users from nearly all population density deciles are more likely to follow others in the highest density decile than in their own decile. Users in this top decile have, on average, more than twice as many followers in our network than the average user (Table 1). This highest decile of tract population density – exceeding 5,050 inhabitants per square km – corresponds to city centers of major metropolitan areas, with 62% of these census tracts located in the counties of Los Angeles, San Francisco, New York City, Chicago and Boston. Interestingly, the row-normalized probability of following users in these high density areas is positively associated with the density of the focal user’s census tract. Taken together, these results imply that users in metropolitan areas and dense city centers tend to, first, drive foci of general high interest on the platform, and, second, to attract attention from users proportionally to how urban their residential area is. Overall, our findings reveal rural-urban divides in attention networks, particularly for rural users, which seem to share area specific interests.
4.3 Geography, Partisanship, and Demographics
The strong association between physical proximity and follower ties points to the locality of some interest-based communities on Twitter, and may also reflect offline relationships reproduced on the platform. In both cases, this implies that follower ties at short distances are of a different nature than those at long distances. We expect local attention networks to mirror the underlying sociology. Who merits attention in a community reflects friendships and prominence, which, in turn, reflects where people live and work. Following a mayor or a local news reporter from a town a thousand kilometers away is a recipe for a flow of boring and irrelevant civic information; while following one’s own mayor or a local reporter provides relevant civic content. Following the average person a thousand kilometers away is likely dull and unnecessary; but following the average person in one’s town, who happens to be family or friend, a social necessity. We thus anticipate that attention structures of the near are systematically different from those that are far. Proximate follower ties also originate from localized interests (such as sports or local politics). In contrast, long-distance relationships are more likely to stem from general, national-level foci gathering widespread attention.
Given these differences, homophily is likely to vary for nearby compared to distant users. Finding that the tendency to pay attention to similar others is independent of proximity points to robust homophily tendencies that persist across multiple types of foci. We explore these questions by examining how follower patterns by race/ethnicity, partisanship, age and sex interact with population in radius. We plot row-normalized heatmaps broken down by population in radius bins, as detailed in Online Appendix 8. In each heatmap, the probabilities of a tie are calculated for pairs of users within a given range of population in radius; therefore, the heatmaps display the relative tendencies of follower ties at different proximity level from the perspective of the group sending the tie.
Race/ethnicity homophily shows no clear monotonic pattern as population in radius increases (Figure 7), with generally small differences. White and Hispanic homophily is somewhat higher for more local ties, while African-American homophily is higher for distant ties. We conclude that the shared interests underlying racial and ethnic homophily are not primarily localized, and that the tendency to follow same race/ethnicity users on Twitter remains strong regardless of physical proximity – especially for Asians and African-Americans. A caveat worth noting is that our inferred measure of race/ethnicity, based on registered voter’s location, may lead to biases in Figure 7. However, these issues should, in principle, not substantially impact follower patterns over long distances (see Online Appendix 8 for further discussion). The heatmaps by sex display little variation in homophily by population in radius (Online Appendix Figure 10). However, the direction of the variation follows a similar pattern than for partisanship and age: The dominant group (males) tends to attract more attention for distant ties, while females have somewhat higher homophily for proximate ties.
Heatmaps of row-normalized probability of a tie by race/ethnicity, broken down by the population in radius between members of the dyad.
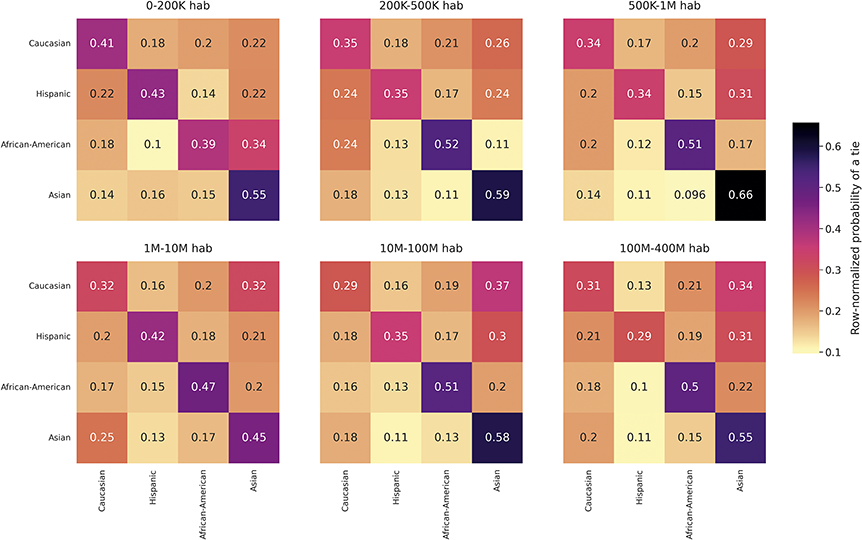
For partisanship, we use party registration instead of inferred partisanship to avoid geographical biases due to the voter file vendor’s algorithm. Republican homophily decreases monotonically with population in radius, while Democrats show the opposite pattern (Figure 8). Republican homophily peaks for ties at 200 K or less population in radius, while Democrat homophily peaks for ties at 100 M or more. Ties spanning large population in radius values favor Democrats, to the extent that Republicans are only slightly more likely to follow other Republicans than Democrats for ties above 100 M habitants. These results show that Republican homophily is not very robust on Twitter, and that local social structures tend to drive Republican homophily. In contrast, Democrats dominate over distant follower ties, suggesting that they tend to drive foci of general interest on the platform. This aligns with Democrats having, on average, almost twice as many followers as Republicans (Table 1). Overall, these findings reveal clearly distinct roles and behaviors for Democrats and Republicans on Twitter.
Heatmaps of row-normalized probability of a tie by party registration, broken down by the population in radius between members of the dyad.

For age, we plot the heatmap in Figure 9 with four age bins. Follower tendencies by age vary substantially for distant compared to proximate ties. The homophily of users below 30 decreases dramatically as population in radius grows, while the homophily of users above 65 follows the opposite pattern, peaking for ties above 10 M population in radius. In general, younger users attract less attention for distant ties while older users attract more: The probability of following 18- to 29-year-old users decreases monotonically with population in radius, while the probability of following 65+ users increases, particularly for ties spanning 10 M habitants or more. Among ties above 100 M population in radius, only 65+ users show significant in-group following tendencies; all other groups are equally or more likely to follow older users. In Section 3, we concluded that the follower patterns by age reflect two patterns: following users of similar age and following older users. Figure 9 reveals that homophily dominates for proximate ties, while the tendency to follow older users strengthens with distance. Although 65+ users are a minority on Twitter (Table 1) and do not dominate in terms of aggregate attention (Figure 2), they tend to gather more attention than other age groups once group sizes are accounted for. We conclude that the age segmentation of online foci in attention networks is more pronounced for local ties, and may be partially driven by offline ties, while attention tends to be directed to older users regarding general-interest topics.
Heatmaps of row-normalized probability of a tie by age, broken down by the population in radius between members of the dyad.
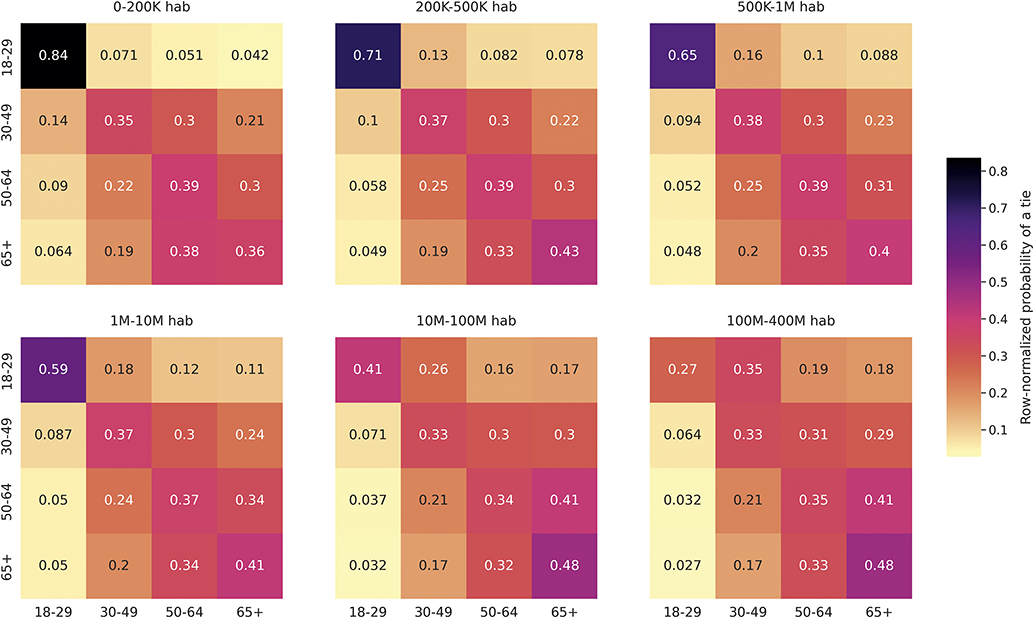
In summary, the results from this subsection show that race/ethnicity homophily in follower ties is roughly constant by physical proximity while there is substantial variation for partisanship and for age. This variation reflects the combination of two tendencies: first, homophily, which dominates for proximate users; and second, the direction of attention toward two specific groups (Democrats and 65+ users), that are less homophilous for close ties and dominate at large distances. We interpret that these groups dominate national foci of general interest, while other groups display within-group attention mostly for proximate ties, meaning that their shared foci of interest tend to be localized. In contrast, the consistently high tendency of Asians and African-Americans – two historically marginalized communities – to pay attention to in-group members is striking. These findings suggest the presence of strong communities of interest and identities structured around these groups; and, potentially, where choice homophily plays a significant role. This phenomenon has been well documented for African-American Twitter users, who constructed a powerful internet community often called Black Twitter (Brock, Reference Brock2020; Clark, Reference Clark2025). Our findings suggest that African-Americans (and other minority groups) successfully prevented the domination of attention by white users, thereby “decentering whiteness as the default internet identity” (Brock, Reference Brock2020).
5 Multivariate Analysis
Through the two previous sections, we have carefully examined how each of the variables we study is associated with follower patterns. In this final part of the analysis, we combine all variables in a single model using multivariate logit models (see point 4 of Section 2). This allows us to compare the importance of different variables in structuring the distribution of attention. By fitting nested models, we also shed evidence on how some variables may drive the associations of others. Specifically, we study the role of consolidation among attributes (Blau, Reference Blau1977), where following similar users by one attribute leads to following similar users by another correlated attribute. Comparing nested models also allows testing if the association of geography with follower ties leads to following similar others. Overall, this section’s results confirm previous findings. Partisanship does not strongly condition attention patterns, and age and race/ethnicity are more important. Geography stands out in multiple ways: Spatial opportunity structures and state borders strongly associate with follower ties, urbanicity plays a significant role, and following nearby users accounts for a significant portion of race/ethnicity and partisanship homophily.
We start by specifying which variables we introduce in the model and how. We include partisanship, age, race/ethnicity, and sex as homophily variables, controlled by activity and popularity as in Table 2. We model age homophily as the difference in the logarithm of age, since this specification showed a stronger association with tie probability than age deviation in Section 3. We use inferred partisanship as the main measure of partisanship but also provide results with partisanship registration in Online Appendix 4. For census tract population density and RUCA code, we use the combinations of values found as having high probability of a tie in Section 4.2. Specifically, for RUCA code, we include a variable with three values (Metropolitan-Metropolitan, Micropolitan-Micropolitan, and Small town/rural-Small town/rural), with all dyads with users in different RUCA code tracts as the reference category. For population density, we use a categorical variable with three options: dyads where both users are in the 1st decile, dyads where both are in the 10th decile, and dyads from any other decile to the 10th decile, with all other combinations as the reference category. The regressions use population in radius rather than distance given its higher predictive power in Section 4.1. Finally, we include a dummy variable when both dyad members reside in the same state to evaluate whether state boundaries matter beyond physical proximity.
We first fit Model 1 with partisanship alone and Model 2 with only demographic variables. Then, we fit Model 3 with these variables together, followed by Models 4, 5 and 6 where we progressively add the geographical variables. This allows us to inspect how partisanship and demographic homophily influence each other and how geography drives both. Table 3 displays exponentiated coefficients that we interpret as relative risks. However, changes in logistic regression coefficients across nested models may reflect not only confounding or mediation but also rescaling, and the coefficients are not directly comparable across models (Karlson et al., Reference Karlson, Holm and Breen2012). Specifically, comparing logit coefficients between nested models underestimates the true degree of confounding or mediation. We address this using a reformulation of the KHB method (Breen et al., Reference Breen, Bernt Karlson and Holm2021) and provide in Online Appendix 9 the relative coefficient change attributable to the true degree of confounding/mediation that introducing new variables to a model generates.
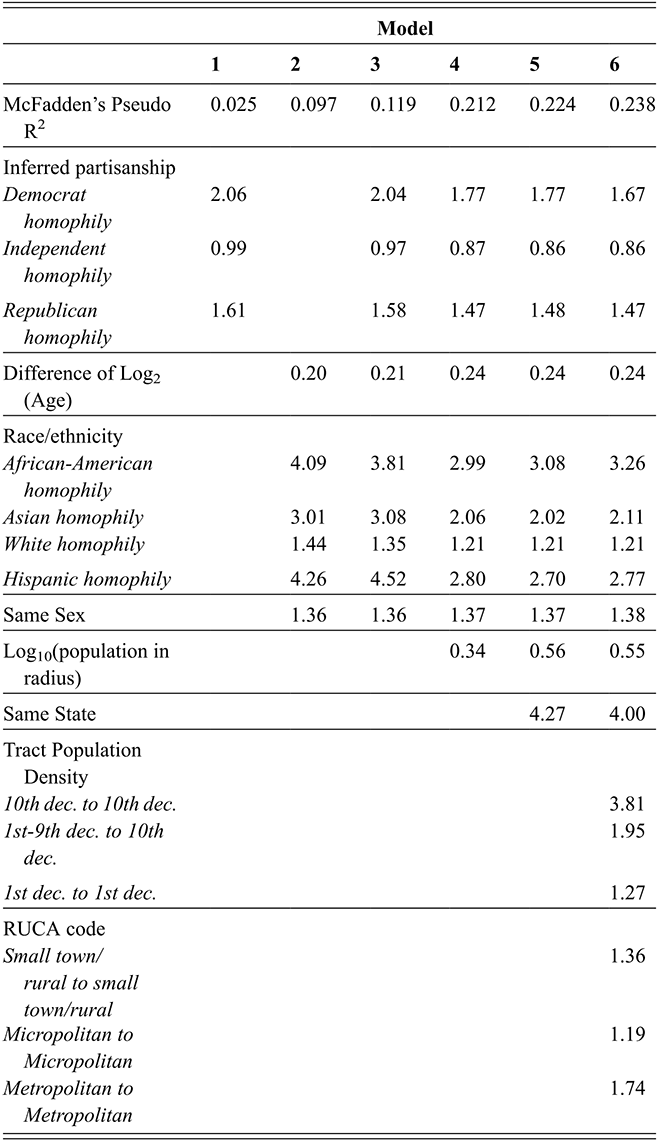
Table 3 Long description
There are 7 columns, the first column describes the row, while columns 2 to 7 correspond each to a different Model (there are 6), and include the exponentiated coefficients of each variable described in Column 1. Row 1 includes the McFadden’s Pseudo R2 of each model. The following rows correspond to (in this order): homophily coefficients for inferred partisanship, Difference in Log2(Age), homophily coefficients for Race/Ethnicity, Same Sex homophily coefficient, Log10 of population in radius, the Same State variable, Census Tract population density variables, and RUCA code variables.
Focusing first on confounding/mediation effects, we find that partisanship homophily decreases by about 32% (Online Appendix Table 18) when including population in radius, suggesting that residential segregation and users’ tendency to follow nearby accounts drive a significant portion of this homophily. We interpret that users tend to be interested in localized interest foci or follow offline ties, and, because of that, end up paying attention to others of the same partisanship. In addition, the coefficient for Democrat homophily is reduced by 16% when adding census tract population density and RUCA code (Online Appendix Table 20), implying that some of this homophily is explained by the shared foci of urban users discussed in Section 4. Overall, geographic variables reduce Democratic homophily by 43% and Republican homophily by 30% (Online Appendix Table 21). Using partisanship registration yields similar reductions, of 32% and 34%, respectively (Online Appendix Table 23). The KHB method also reveals that demographic homophily drives some partisanship homophily – 13% for Democrats and 17% for Republicans (Online Appendix Table 17) – which is not appreciated in Table 3 due to rescaling. These effects remain similar with party registration (Online Appendix Table 22). While they point to some relationship between interests based on race/ethnicity or age and partisanship, the confounding effect of geography is clearly larger.
Race/ethnicity homophily is almost halved when population in the radius is introduced in the model (Online Appendix Table 18), except African-American homophily, which decreases by 32%. We interpret these reductions as due to residential segregation, similarly as for partisanship: Users follow others that live close, who tend to share their race or ethnicity. In addition, partisanship homophily drives some White homophily, as this coefficient decreases by 22% when adding inferred partisanship (Online Appendix Table 17). Sex homophily stays similar when introducing partisanship and the geography variables, while age homophily decreases by 19% when population in radius is introduced (Online Appendix Table 18). The population in radius coefficient drops by 46% when including the same-state variable (Online Appendix Table 19), showing that state boundaries drive a substantial portion of the association between physical proximity and follower relationships. State limits therefore shape some Twitter foci: Users near state borders may pay attention to their state’s politics or sports team even if these foci are based relatively far within the state.
Focusing now on Model 6, we find that most of the patterns identified in bivariate analysis hold, albeit with generally smaller effect sizes. A clear highlight is the striking importance of the different location variables. Model 6 predicts that residing in the same state multiplies the probability of a tie by four, and that follower relationships among users with ~10,000 habitants between them are about 6 and 10 times more likely than among users with 1 M and 10 M habitants between them, respectively. These effect sizes dwarf the partisanship effects: A Democrat–Democrat tie is less than two times more likely than an Independent–Independent tie, the largest partisanship difference in the model. The measure of model fit, McFadden Pseudo R2, doubles when adding population in radius and same-state, confirming the importance of these variables in structuring attention networks on Twitter. Age also plays a significant role, with little variation in its coefficient after introducing other variables. Model 6 predicts that ties between same age users are twice as likely as between users aged 25 and 35 (or between users aged 50 and 70). African-American, Asian, and Hispanic homophily are substantial and exceed partisanship homophily. The Pseudo R2 of Model 1, with only demographic variables, is almost four times larger than for Model 2, with only partisanship.
Fitting a model like Model 6 with partisanship registration yields qualitatively similar results, though with stronger Republican homophily, that becomes higher than Asian homophily (see Online Appendix 4). To further confirm the minor role of partisanship homophily in US Twitter follower networks, we run a robustness test using the inferred partisanship values as provided by the voter file vendor, without binning, and find similarly low partisanship homophily (Online Appendix 10). We conclude that similarity by age and race/ethnicity and location are more relevant than partisanship to understand attention networks in the United States. This finding matches previous research reporting that political foci driving in-group partisan following play a relatively minor role on the Twitter as a whole (Mukerjee et al., Reference Mukerjee, Jaidka and Lelkes2022; Wojcieszak et al., Reference Wojcieszak, Casas, Yu, Nagler and Tucker2022). In contrast, divides in online interests by age and for some racial or ethnic groups seem more important for structuring the distribution of attention on the platform. Furthermore, the primary role of geographical variables, particularly population in radius, indicates that localized foci are important. Finally, a central finding in this section is that the tendency to pay attention to proximate users combined with residential segregation by partisanship and race/ethnicity produces tie similarity along these variables.
6 Discussion and Conclusions
Modern information ecosystems are characterized by the vast arrays of options they present to users. These choices are curated through complex social processes, such as algorithmic content recommendations and network-based discovery, crystallizing into the formation of online interest communities. These digital foci ultimately shape and organize the distribution of attention among users. Each user brings its own particularities to digital spaces, such as different goals, interests, and social backgrounds, that interact with the platform functioning. In the case of follower-based platforms, this implies that attention networks are deeply conditioned by the offline characteristics of users. However, such offline attributes are not easily accessible and are rarely taken into account in their full complexity by large-scale studies on social media beyond isolated attributes like political orientation. This Element seeks to enhance the understanding of how attention networks are shaped by key user characteristics, focusing on demographic, political, and geographical variables that fundamentally structure social behavior.
Our results speak to the common concern of whether the processes curating choices online lead to divided relationships. We find that users tend to pay attention to similar others online, particularly for age, race/ethnicity, and, to a lesser extent, partisanship. However, the homophily and segregation levels we identify for partisanship and race/ethnicity – traditional splits in US society – seem lower than those identified for offline ties (Butters and Hare, Reference Butters and Hare2022; B. Lee and Bearman, Reference Lee and Bearman2020; J. A. Smith et al., Reference Smith, McPherson and Smith-Lovin2014). For instance, the probability of a racially homogenous tie in our data is much lower than for core discussion ties. While age homophily is comparable to core networks, sex-based following patterns appear to reflect gender disparities rather than homophilous preferences. We focus this comparison to strong offline ties because they concentrate most of the evidence on societal level homophily. Evidence on weak ties offline, which more closely resemble online relationships, remains inconclusive: Population-level research finds higher segregation among weak versus strong ties (DiPrete et al., Reference DiPrete, McCormick, Teitler and Zheng2011), while studies of young adults and adolescents report similar or higher homophily and segregation for strong ties (Hofstra et al., Reference Hofstra, Corten, van Tubergen and Ellison2017; Kretschmer et al., Reference Kretschmer, Leszczensky and McMillan2024). Overall, our results present a mixed picture for follower relationships: They display homophily, but apparently less than offline ties, challenging the notion that social media amplifies already existing social divides.
Beyond homophily, a consistent pattern in our results is the asymmetric tendency of some groups to gather large amounts of attention. The distribution of attention by a given attribute is well summarized as a combination of these two tendencies, with varying importance depending on the attribute and the physical proximity between users. Race/ethnicity patterns consist exclusively of homophily, while gender-based following is characterized by the dominance of male users. Age, partisanship, and urbanicity display both patterns: Homophily prevails, especially for age, but users above sixty-five, Democrats, and urban residents attract disproportionate attention from other groups. These findings align with research showing that social media reproduces and amplifies existing social inequalities (Gallagher et al., Reference Gallagher, Doroshenko, Shugars, Lazer and Foucault Welles2021; Karimi et al., Reference Karimi, Génois, Wagner, Singer and Strohmaier2018; E. Lee et al., Reference Lee, Karimi and Wagner2019; Messias et al., Reference Messias, Vikatos and Benevenuto2017; Nilizadeh et al., Reference Nilizadeh, Groggel and Lista2021). Furthermore, homophily stands out for ties among geographically proximate users while distant connections favor dominant groups (Section 4.3). We interpret that distant ties represent topics of general interest where certain groups gather disproportionate attention, whereas proximate ties reflect localized interests where homophily predominates. These two patterns reveal two general tendencies in the spread of attention on social media: Users form communities around shared interests and similarity while simultaneously focusing on influential users and prominent issues.
Race/ethnicity patterns are distinct from other variables, with no dominant group and predominantly homophilous connections. As noted earlier, authors like Brock (Reference Brock2020) and Clark (Reference Clark2025) show how a rich racial and ethnic cyberculture, Black Twitter, emerged on this platform thanks to the construction of shared meanings it enables. These authors highlight Black Twitter as a success story for African-Americans, who resisted mainstream White domination online. This example illustrates that viewing homophily as inherently negative may be an oversimplification. While highly homophilous attention networks raise concerns over social fragmentation and social cohesion (González-Bailón and Lelkes, Reference González-Bailón and Lelkes2023), some homophily is necessary for social organization and the formation of group identities. For example, social media are conducive to race and gender social justice movements that require individuals to pay attention to others with similar race, gender, and ideology (Jackson et al., Reference Jackson, Bailey and Foucault Welles2020). Though these struggles for equality may fuel political divides, such divisions may be necessary consequences (Kreiss and McGregor, Reference Kreiss and McGregor2024). Normatively, different sources of tie similarity carry different implications. Homophily may be less problematic insofar as it reflects individual preferences to connect with similar others. To some extent, users choosing to build a community around shared interests and traits is a natural process, and some of the tendencies toward similarity we find likely reflect the unfolding of this process in social media.
In contrast, structural mechanisms that do not reflect user choices or strongly condition them – such as echo chambers generated through recommendation algorithms – are more concerning. In this regard, a central insight from this Element is that we provide evidence of previously unstudied structural processes generating tie similarity online. Geography is key: A significant portion of partisanship and race/ethnicity homophily, which might be misinterpreted as the result of preferences, can be attributed to the location of users. Following nearby users produces tie similarity by these attributes, meaning that residential segregation impacts exposure to diverse others online. This finding speaks to the rich literature on residential segregation (Brown and Enos, Reference Brown and Enos2021; Bruch and Mare, Reference Bruch and Mare2006; Intrator et al., Reference Intrator, Tannen and Massey2016; Krysan and Crowder, Reference Krysan and Crowder2017), showing that its consequences extended well beyond offline relationships. Additionally, the correlation between demographic and political attributes leads to some homophily along these attributes. To our knowledge, this is the first study demonstrating that these mechanisms, previously documented offline, operate online as well. We also find effects from the differential tendency to follow and be followed by other users, which is specific to online ties.
Our results on geography are one of our major contributions: Not only distance, but also geographical opportunity structures, state borders, and urbanicity are strongly associated with attention networks. While the notion that online behavior is intertwined with physical presence is not new (Bastos, Reference Bastos2021; Marvin, Reference Marvin, Welles and González-Bailón2020), we extend on previous work and show that studying online attention without considering proximity and geographical contexts risks missing an important part of the picture. Though we cannot provide a definitive answer on the causal role physical proximity without including additional variables, our results suggest online tie-building processes mirroring the offline world. The dominance of population in radius over distance shows that geographical opportunity structures influence online ties more than simple proximity, similarly as offline. However, unlike in the offline world, the reason behind the association of physical closeness with following cannot simply be that “proximity breeds connection.” While users may follow some offline contacts, we believe that this relationship reflects the local nature of many online foci fueled by algorithmic curation around these interests. Another interesting finding is the dominance of Twitter attention patterns by urban users, indicating that influencers and opinion leaders concentrate in city centers. This intersects with Democrat homophily on the platform, with urbanicity driving some partisanship homophily. The appeal of urban users is proportional to the urbanicity of the target user, and rural users seem to share specific foci online.
The strong relationship we find between users’ interests and location contrasts strikingly with the decay of local news (Darr et al., Reference Darr, Hitt and Dunaway2018, Reference Darr, Hitt and Dunaway2021; Hayes and Lawless, Reference Hayes and Lawless2018) and the nationalization of media and politics in the United States (Hopkins, Reference Hopkins2018). Specifically, residing in the same state is strongly predictive of follower ties and accounts for a substantial portion of the residential opportunity structure effect (Section 5). This implies that interests in the platform are often state-bounded and that state-level structures (regarding government, for example) significantly shape attention networks online. Our data does not include organizational accounts such as news that are often the focus of research on media nationalization. It is, therefore, possible that social media platforms like Twitter have partially substituted local news by allowing local content producers to gather communities of followers around local issues. Furthermore, our analysis of how follower patterns vary with population in radius (Section 4.3) shows that homophily predominates for local ties, particularly for Republicans and younger users – contrasting with literature on how local news counter polarization (Darr et al., Reference Darr, Hitt and Dunaway2018, Reference Darr, Hitt and Dunaway2021). While we cannot provide precise insights on why interests are localized based on our analysis, our findings suggest that comparing the provision of local information in social media with local news warrants future research.
Another striking finding is the relatively minor role of partisanship in structuring attention networks. While our measures of partisanship are imperfect, we are confident that the combination of different measurements and data sources reflects a real pattern. Moreover, our sample of registered voters should be more polarized than average US Twitter users. It is worth noting that we exclusively study ties among real people, departing from the standard focus on users’ relationships to political elites of political science (Barberá et al., Reference Barberá, Jost, Nagler, Tucker and Bonneau2015, Reference Barberá, Casas and Nagler2019; Imai et al., Reference Imai, Lo and Olmsted2016; McCabe et al., Reference McCabe, Green, Goel and Lazer2023; Schöll et al., Reference Schöll, Gallego and Le Mens2024; Silva and Proksch, Reference Silva and Proksch2021). Consequently, we miss potentially less cross-cutting follower ties like those directed at news outlets. Still, previous research shows that most elite accounts on Twitter are not political (Mukerjee et al., Reference Mukerjee, Jaidka and Lelkes2022), and that most users do not follow a single political elite or major news account (Wojcieszak et al., Reference Wojcieszak, Casas, Yu, Nagler and Tucker2022), suggesting that including organizational accounts would not substantially alter our findings. In addition, our data does include political “elites”: A small number of accounts gather a lot of followers (see Online Appendix 11), and some of these accounts are likely political. The contrast between our results and other evidence finding significant polarization online (Barberá et al., Reference Barberá, Jost, Nagler, Tucker and Bonneau2015; González-Bailón et al., Reference González-Bailón, Lazer and Barberá2023; Green et al., Reference 62Green, Mccabe and Shugars2025) is likely due to differences in the populations studied. We examine the divides among general users instead of focusing on political news (González-Bailón et al., Reference González-Bailón, Lazer and Barberá2023; Green et al., Reference 62Green, Mccabe and Shugars2025) or political conversations (Barberá et al., Reference Barberá, Jost, Nagler, Tucker and Bonneau2015). Accordingly, users tweeting more about the elections in our data are more homophilous. Overall, our analysis indicates that the attention patterns of the median Twitter user are not guided by a preference for politically like-minded others. This is especially true in comparison with variables like age that do strongly correlate with follower ties in the multivariate analysis.
A few additional points merit consideration when reflecting on the broader implications of our findings on partisanship. First, partisanship homophily, even if concentrated among politicized users, carries distinct normative consequences compare to the other variables studied. Second, we do identify strong segregation patterns among Democrats. The primary structural determinant of tie similarity by race/ethnicity and partisanship in our results is simply group size, highlighting the importance of political splits in the choice of which platforms to use. Fears about algorithmically driven echo chambers, based on tie-formation processes, are not confirmed by our findings. Nevertheless, segregated attention networks have consequences like fragmented information spread, and our results indicate that Democrats and Whites predominantly followed similar users during the study period. Third, our work only investigates following behavior. While follower networks are the backbone of social media platforms, these are weak social ties, and partisan homophily may be substantially higher for more meaningful (and less frequent) behaviors like re-sharing content. We believe that studying tie similarity for stronger online relationships would be a valuable follow-up to this work.
This work has several limitations. First, we focus on Twitter in 2020, raising concerns about the application of our findings to other platforms and later periods (Munger, Reference Munger2023). The platform has changed notably since Elon Musk’s October 2023 acquisition (Özturan et al., Reference Özturan, Quintana-Mathé, Grinberg, Ognyanova and Lazer2025). Our data depicts a Democrat- and urban-dominated platform with differential attention patterns by partisanship. This composition seems to be shifting as Democrats leave the platform (Schulman et al., Reference Schulman, Qu and Lazer2023), likely altering partisan network segregation. However, our two central findings – the importance of geography and the low importance of partisanship – based on methods that account for user base composition, should generalize to online attention networks more broadly. We study Twitter as a “model organism” (Tufekci, Reference Tufekci2014) for follower-based platforms. The theoretical framework developed in Section 2, with online foci at the center, generalizes to other platforms, with Instagram as a notable example. Twitter’s design maximizes preference over structure, yet geography – a traditional social network influence – remains crucial, suggesting this pattern extends to attention networks generally. Specifically, we predict that residential segregation also leads to homophily in the follower network of other platforms. Moreover, Twitter was one of the social media where political content and news were the most prevalent (Boulianne et al., Reference Boulianne, Hoffmann and Bossetta2024; McClain et al., Reference McClain, Anderson and Gelles-Watnick2024; Mitchell et al., Reference Mitchell, Shearer and Stocking2021; Shearer et al., Reference Shearer, Barthel, Gottfried and Mitchell2015), in a particularly polarized period in the United States, and we still find low partisanship homophily, implying that the low relevance of partisanship replicates in other attention networks online. We also believe that the segmentation of follower patterns by age and race/ethnicity and the dominance of attention by older and male users reflect broader societal patterns. Finally, our finding that homophily is more prevalent for ties among nearby users while distant ties tend to target dominant groups is likely to characterize platforms beyond Twitter.
Another limitation of this work is the usage of inferred measures of race/ethnicity and partisanship. These inferences can impact the homophily estimates we obtain for these attributes: Berry et al. (Reference Berry, Sirianni, Weber, An and Macy2021) show that node-level predictions can lead to biased dyad-level estimates of homophily because of the correlation between the prediction errors along ties. Our inferred measures are external to platform activity; therefore, the risk that the model errors for pairs of users with a follower tie are correlated is in principle lower than if inferring attributes based on behavior on the platform. Still, the errors in the voter-file based inference methods can be correlated with online behavior. This may be the case for the race/ethnicity measure, which, if based on census tract composition, may be more accurate for users residing in segregated areas that may be more homophilous online. In particular, the comparison of the voter file with the Covid States survey (Online Appendix 1) shows that a small fractions of self-reported Asians and Hispanics in the survey have a matching race/ethnicity category in the voter file (23% and 29%, respectively). In other words, voter file recall is low for these categories, suggesting that the population of Asians of Hispanics we study may not be representative (and potentially more homophilous). On the other hand, a relatively low fraction of voter file Asians and Hispanics are also Asians/Hispanics in the survey (58% and 50%, respectively), what should, in principle, lead to an underestimation of homophily. It is, therefore, difficult to estimate if the voter file race/ethnicity measure leads to an overestimation or underestimation of homophily. The homophily analysis in VRA states (Online Appendix 6) and in the survey (Online Appendix 2) confirms our main takeaway on race/ethnicity homophily, namely, that it is higher than for partisanship and lower than for age. Still, our exact estimates of race/ethnicity homophily should be taken with some caution.
Finally, a fundamental limitation of our study is that we do not provide causal explanations for the processes behind follower ties. As mentioned previously, our multivariate analysis based on a logistic regression cannot identify network effects like tie reciprocity or triadic closure, which probably play an important role. The size of our network and the usage of purely dyadic attributes like distance complicate the usage of network models such as ERGMS. In addition, the network that we study is a subsample of the whole network of all follower ties among US registered voters, about which we aim to make inferences. There are modelling frameworks that can be used on sampled network data (Handcock and Gile, Reference Handcock and Gile2010; Koskinen et al., Reference Koskinen, Robins, Wang and Pattison2013) and alternative strategies to fit ERGMS on large networks (Stivala et al., Reference 71Stivala, Koskinen, Rolls, Wang and Robins2016, Reference Stivala, Robins and Lomi2020); these could potentially be combined and applied to our dataset. Another limitation is that we use a static snapshot of the network, and do not study the dynamics of tie formation and dissolution on Twitter. In particular, tie dissolution may particularly impact polarization (Tokita et al., Reference Tokita, Guess and Tarnita2021). We also do not include any variable related to the topics users tweet about, which would enable studying the relationship between online foci and offline attributes that we theorized in Section 2.
Overall, our work provides a descriptive view of attention networks on Twitter and points at some of the operating mechanisms (such as following users who reside close). Addressing these limitations would allow a deeper understanding of how processes of attention allocation unfold in social media and of the role that homophily plays in these processes. Key questions are if tie similarity and the association with geography are generated by mechanisms like transitivity, reciprocity, and algorithmic recommendations, and the precise extent that topic-based following leads to tie similarity. Such further work is critical to inform current debates on social divides and social media platforms in our contemporary societies.
Acknowledgments
We are very grateful to the long list of scholars who have provided feedback or somehow contributed to this work. First, we wish to thank Kenny Joseph and Stefan Mccabe for their help with data collection and initial processing. Special thanks to Michał Bojanowski for his help with the methods, and to Miranda Lubbers, Brooke Foucault-Welles, Cassie McMillan, and Katya Ognyanova for the comments provided. We also appreciate the thoughtful feedback from the attendants and organizers of the PNOC online seminar and the Coalesce Lab reading group: in particular, to Matthew Simonson, Marina Duque, Pablo Barberá, Lauren Ratliff Santoro, Alejandro Ciordia, Yunsub Lee, Nigel Van Herwijnen, Núria Targarona Rifà, Zhiyi Jin, and Marc Alcalà-i-Rams. We acknowledge the support from the Volkswagen Foundation and the John S. and James L. Knight Foundation. Finally, we are grateful to Nicole Samay for her help with Figure 1.
Ethics statement
The usage of data on Twitter users linked with voter file records raises significant ethical challenges, as sociodemographic and political information on users, that they may not wish to be public, is associated with them in the data. To preserve the subject’s privacy, both the voter file and the Twitter data are stored in computing clusters with restricted access. Given that we cannot obtain consent for the users linked with the voter file, we minimize potential harms by running all analysis at an aggregate level, protecting personally identifiable information, and restricting access to data. In addition, users with private accounts are excluded from data collection.
Data and Code Availability Statement
Due to the sensitive nature of the data and the substantial risk of re-identification, we cannot make the data used for this work generally available. However, we can share the network data used with other researchers after going through a data sharing agreement. Email quintanamatha.a@northeastern.edu or d.lazer@northeastern.edu for such inquiries. The code used for this work is available at https://github.com/quintanaMathe/Twitter-Followers.
Stuart Soroka
University of California, Los Angeles
Stuart Soroka is a Professor in the Departments of Communication and Political Science at the University of California, Los Angeles. His research focuses on political communication, political psychology, and the relationships between public policy, public opinion and mass media. His books with Cambridge University Press include Information and Democracy (2022, with Christopher Wlezien), The Increasing Viability of Good News (2021, with Yanna Krupnikov), Negativity in Democratic Politics (2014), and Degrees of Democracy (2010, with Christopher Wlezien).
About the Series
Cambridge Elements in Politics and Communication publishes research focused on the intersection of media, technology, and politics. The series emphasizes forward-looking reviews of the field, path-breaking theoretical and methodological innovations, and the timely application of social-scientific theory and methods to current developments in politics and communication around the world.