


Introduction
Political economy theories argue that economic self-interest determines who will favour or oppose a policy. At the same time, a large number of voters are uninformed about basic political matters (Delli Carpini and Keeter, Reference Delli Carpini and Keeter1996). As a result, if voters lack knowledge and interest in politics, when evaluating a policy, party cues may act as a cheaper, rational and as effective option to make policy decisions (Downs, Reference Downs1957; Lupia and McCubbins, Reference Lupia and McCubbins1998).
However, many empirical findings question these assumptions and suggest that political economy theories have limited explanatory power on various issues, such as preferences over immigration, populism or free trade (Hainmueller and Hopkins, Reference Hainmueller and Hopkins2014; Inglehart and Norris, Reference Inglehart and Norris2017; Mansfield and Mutz, Reference Mansfield and Mutz2009; Margalit, Reference Margalit2019). Why don’t political economy theories hold in the real world and why do people vote in favour of policies that hurt them?
In order for these theories to hold, people need to be able to determine what their self-interest is, and whenever they are not able to do so, the party cue they rely on must effectively guide them towards their interest. To determine one’s self-interest, an individual must possess the economic and financial tools to be able to weigh the costs and benefits of an economic policy and ultimately make a policy choice. In the absence of this toolkit, relying on cheaper party cues may be a rational decision-making strategy, but only as long as the voter’s interests are aligned with those of the cue provider. When politicians adopt policy positions inconsistent with those of the mass public, voters that rely on party cues end up favouring policies that directly hurt them.
I argue that financial and economic literacy affects the accuracy with which an individual evaluates the costs and benefits of an economic policy on their well-being. As such, it influences the type of information that individuals are responsive to when assessing a policy. I assume that the cost of processing information is different for financially and economically literate (FEL) and financially and economically illiterate (FEI) individuals. Hence, I expect FEL individuals to be more likely to rely on nonpartisan policy information, since this is relatively cheaper for them, due to their higher ability to evaluate the effects of the policy under analysis. On the other hand, FEI people, who are less likely to be able to evaluate the effects of a policy on their economic well-being on their own, are more likely to rely disproportionately on political ideology or cues from reference groups, rather than on nonpartisan factual information, to make their policy decisions.
Hence, in this study, I introduce a distinct type of sophistication, financial and economic literacy, and test whether FEL and FEI individuals rely on different sources of information when forming their opinions about a new policy. With a survey experiment conducted in Italy involving a policy proposal for price controlsFootnote 1 for domestic olive oil producers, I investigate if [(1)] FEL individuals are more likely to form their policy views using factual information on the costs and benefits of a policy; [(2)] FEI individuals, due to their lower ability to conduct accurate cost-benefit analyses, are more likely to rely on cues from their party leaders. In this experiment, respondents are randomly exposed to two possible treatments: either a political statement coming from the respondent’s party leader (a party cue) or a cost-benefit exercise on the short-term effects of price controls (policy information). The findings show that FEL individuals are more likely to understand factual information concerning the costs and benefits of the policy under analysis and to be responsive to it. This is not the case for FEI individuals, who instead are more receptive to party cues. Specifically, when given factual information on the societal costs and benefits of a policy, FEL individuals are 18% more likely to understand that the total economic effect of that policy on society is negative, and 23% more likely to correctly estimate the size of this effect, than FEI individuals. Furthermore, FEL individuals treated with the cost-benefit exercise are 21% less likely to support price controls than FEL individuals in the control group, while this effect is not significant for FEI individuals. And again, FEI individuals treated with the party cue are 5% more likely to support price controls than similar FEI individuals in the control group, while this effect is not significant for FEL individuals.
Critically, one might assume that this result is merely driven by differences in education between the FEL and FEI samples. To examine whether literacy has the distinct effect proposed in this theory, I take several steps. Findings show that education is only weakly correlated to financial and economic literacy. Furthermore, I find no differential effects of the treatments between highly educated and low educated voters, suggesting that financial and economic literacy has distinctive features that general education does not capture.
This is among the first studies to highlight the consequences of financial and economic literacy in a political context. Although the relationship between financial literacy and household decisionmaking is an expanding area of researchFootnote 2 the literature on the relationship between financial literacy and political and policy preferences is still in its infancy and relies for the most part on observational studies (Fornero and Lo Prete, Reference Fornero and Lo Prete2019; Magistro, Reference Magistro2020, Reference Magistro2021b; Montagnoli et al., Reference Montagnoli, Moro, Panos and Wright2016).
These findings have significant implications. When politicians have policy preferences counter to the interests of the mass public, voters that rely on party cues are more likely to express support for policies that directly hurt them. One proposed solution to this failure of representation of interests might be to increase the information available to voters. Here, I show that this can successfully shift opinions, but only provided that citizens have sufficient financial and economic literacy to understand this information and translate it into policy preferences. This suggests that financial and economic education may have the potential to increase support for welfare-enhancing reforms and to aid voter’s detection of welfare-reducing ones.
Conceptual framework
Financial and economic literacy
A key task for citizens in modern democracies is to vote for candidates and policies that represent their interests. This raises the fundamental question of whether citizens are indeed informed and understand the policies they decide upon. In this context, there have been significant issues regarding how to measure citizens’ knowledge and understanding of policies (Boudreau, Reference Boudreau2009; Gilens, Reference Gilens2001; Pietryka and MacIntosh, Reference Pietryka and MacIntosh2013). My proposed measure of financial and economic literacy, aimed at capturing one individual’s ability to evaluate the costs and benefits of an economic policy on their well-being, attempts to alleviate some limitations of two separate bodies of literature: the one on political knowledge/sophistication and the one on financial literacy.
Financial literacy is defined as the ability to understand basic economic concepts in relation to the functioning of modern economies and the achievement of individual financial well-being (Atkinson and Messy, Reference Atkinson and Messy2012; Fornero and Lo Prete, Reference Fornero and Lo Prete2019; Lusardi and Mitchell, Reference Lusardi and Mitchell2014). Most studies on financial literacy examine the relationship between financial literacy and individual-level outcomes like savings, investment or default behaviour (see Lusardi and Mitchell (Reference Lusardi and Mitchell2014) for a review). Financially, literate people are more likely to make savvier saving and investment decisions, manage debt better, plan more for retirement and participate more in the stock market (Delavande et al., Reference Delavande, Rohwedder and Willis2008; Jappelli and Padula, Reference Jappelli and Padula2013; Lusardi and Mitchell, Reference Lusardi and Mitchell2014, Reference Lusardi and Mitchell2017; van Rooij et al., Reference van Rooij, Lusardi and Alessie2012). Although the literature on the relevance of financial literacy and household decisionmaking is expanding, we understand comparatively little about the relationship between financial literacy and political and policy preferences, aside from a few exceptions investigating pension reform preferences. Fornero and Lo Prete (Reference Fornero and Lo Prete2019) find that pension reforms take less of a toll on the politicians that passed them in countries where financial literacy is higher. Furthermore, recently Fornero, Oggero, and Puglisi (2020) investigate the importance of both information and financial literacy for socially sustainable nonfinancial defined contribution (NDC) pension schemes, and they find that the media plays a key role in providing context-specific information on pension reform.
Much of the existing literature on financial literacy relies on a common index to measure financial literacy, which is based on the number of correct answers to questions on basic financial concepts, including the working of interest compounding, the difference between nominal and real values, and risk diversification (Lusardi, Reference Lusardi2015). This index provides a valid measure of a person’s basic financial knowledge, their ability to understand budgets, compound interest and inflation, and this is appropriate for the research concentrated on studying financial behaviours. However, in a political context, this conceptualisation and measure may have significant limitations. For example, it may not necessarily capture policy and country-specific knowledge, and an individual’s understanding of a policy’s effects on one’s economic well-being (Atkinson and Messy, Reference Atkinson and Messy2012). A person may very well know what compound interest is, but if they do not know how the pension system in their country works, that may not be very informative to their pension policy preference. In a similar way, an individual may well know the concept of inflation, but if they do not understand that tariffs can be inflationary, knowing what inflation is may not directly influence their policy preference over tariffs. Ultimately, while necessary, it is unclear how knowledge about compound interest or inflation alone would be sufficient, and whether it would necessarily translate into understanding how economic policies, such as immigration or trade policy, work and the trade-offs that they involve. When looking at the relationship between literacy and policy preferences – which to my knowledge, aside from pension reform, no other study has investigated – I argue it is necessary to complement the aforementioned financial literacy questions with a battery of questions measuring “economic literacy.” Economic literacy refers to an individual’s knowledge of the economic effects of certain public policies in the country in question.Footnote 3 For example, one question may ask the individual about the consequences that restricting imports from another nation that is a major trading partner would have on domestic prices. The constructed financial and economic literacy index encompasses both one’s understanding of basic economic concepts and policy-specific knowledge and is therefore expected to be a more general proxy for the respondent’s ability to estimate the effects of any economic policy. Although economic and financial literacy, as a proxy for one’s understanding of basic economic concepts and the working of policies, is expected to influence economic policy preferences, different domain-specific literacies could matter in affecting one’s ability to use information in different fields.
Conceptually, financial and economic literacy is distinct from the extensive literature on political sophistication. Political sophistication is usually proxied by an index measuring an individual’s ability to answer factual questions about politics, covering three main categories: people, party, and civics.Footnote 4 However, Boudreau (Reference Boudreau2009) argues, it is not always clear how these measures are related to the tasks that an individual performs when making a policy choice. Specifically, conventional metrics do not capture policy-specific information (Gilens, Reference Gilens2001) Departing from this, Boudreau (Reference Boudreau2009) uses SAT math scores as a measure of sophistication, arguing that this measure overcomes previous limitations by its direct relation to the task that subjects are asked to perform in her experiment (i.e. solving math problems). The argument is that, although it is often difficult when dealing with voting to identify whether a person has chosen the correct candidate or policy, in a math problem there is only one correct answer. However, there are policies for which winners and losers can be clearly identified, and knowing the individual’s economic condition would easily allow to infer the option that would give the person the highest utility. Furthermore, although SAT math scores may be correlated with financial and economic literacy, they are not a substitute for it. Although numeracy may be a necessary condition for a person to be financially and economically literate, it is unlikely to be sufficient. Having high math skills does not necessarily mean thinking in terms of costs and benefits, trade-offs, supply and demand. As a matter of fact, previous studies find that financial and economic literacy has distinctive features that more general dimensions of education, including math literacy and years of schooling, do not capture (Fornero and Lo Prete, Reference Fornero and Lo Prete2019). To examine whether financial and economic literacy has distinctive features from education, I also re-analyse the data according to respondents’ education level.
Finally, one concern may be that this index of financial and economic literacy does not capture different, additive dimensions of one’s ability to evaluate economic policies, but rather results are driven by financial literacy alone or economic literacy alone. To alleviate this concern, Magistro (Reference Magistro2021b) analyses a sample of 1,100 Italian individuals and investigates the relationship between financial and economic literacy and different policy preferences, while also running alternative specifications of the models with financial literacy only and economic literacy only, to confirm whether indeed the additive index has distinctive features that more closely capture an individual’s ability to evaluate policies. Her findings show that financial and economic literacy does influence economic policy preferences: FEL individuals are more likely to prefer remaining in the Eurozone, to favour free trade, EU immigration, non-EU immigration and the Fornero pension reform. Furthermore, the alternative specifications of the models suggest that the findings are not driven by financial literacy alone or economic literacy alone. The results indicate that when using financial literacy alone or economic literacy alone, although most of the effect sizes are smaller, their direction is unchanged: no matter which index of financial and economic literacy is used, literate people are always more likely to favour each of the policies under analysis than illiterate people. This suggests that the FEL index, by capturing different, additive dimensions of the ability to evaluate the costs and benefits of a policy, is a more encompassing proxy of such ability.
A theory of financial and economic literacy and information
In this section, I introduce a novel theory of how financial and economic literacy and different types of information interact to generate policy preferences using an illustrative model. I consider two types of voters: FEL and FEI voters, and two types of information: party cues and factual policy information. Cues are pieces of information that allow people to formulate their judgments and decisions without in-depth knowledge of policy issues (Eagly and Chaiken, Reference Eagly and Chaiken1993). For example, in political elections, it would be too costly to gather all information and compare candidates across the entire policy space. Instead, voters are said to rely on heuristics to make decisions consistent with those they would make if they were fully informed (Lupia and McCubbins, Reference Lupia and McCubbins1998). Scholars have for the most part praised this type of decisionmaking, called heuristic processing, as rational and effective. Downs (Reference Downs1957) was the first to argue in favour of using cues as heuristics, after demonstrating the irrationality of investing time, attention and resources to become politically informed. He argued that it would be rational for citizens to turn for guidance to experts who can be trusted and who share their political goals.Footnote 5 However, politicians often mislead their electorate and this may affect the effectiveness of using cues to make decisions (Kuklinski and Hurley, Reference Kuklinski and Hurley1994). When the incentives of elected officials are aligned with those of their electorate, a Downsian argument may hold in which using cues would be rational and effective. This is, however, an idealised condition that need not exist. In reality, politicians are often not striving to maximise their electorate’s welfare, but rather serving their own self-interests of maintaining power and winning re-election. This opens the door for smaller special interest groups to exert disproportionate power and influence on elected officials as they can more easily organise and obtain favours that will hurt the majority of the population. While the examples of this are numerable, this occurs notably with tariffs, price controls and tax loopholes. Industries with vested interests in certain policies and regulations are able to compensate the politician with resources that advance their primary objective of re-election. When the costs for the majority of citizens are diffuse, they will not try to capture politicians, since the intensity of their preferences is low compared to special interest groups, whose benefits are more concentrated and visible (Mitchell and Munger, Reference Mitchell and Munger1991; Olson, Reference Olson1971; Stigler, Reference Stigler1971). When this is the case, foregoing policy information and relying on cues may not be an effective decision-making strategy. In this model, I focus on the scenario in which politicians are not maximising their electorate’s welfare, but their own self-interest, and this may imply promoting welfare-reducing policies in order to gain the electoral support of small interest groups (Mitchell and Munger, Reference Mitchell and Munger1991).
In the theory that follows, I seek to explicitly incorporate the role that financial and economic literacy plays in individuals’ acquisition of and responsiveness to information. This missing piece may both explain the disparate results in the extant political economy literature and generate novel empirical implications for the effects of information on voters’ preferences over policy outcomes.
Each individual has his or her own prior probability distribution over U, the utility of an economic policy proposal. I assume that these priors are weak/uninformed and normally distributed, where the mean is equal to the expected utility a policy will bring and the variance is a measure of the confidence with which the belief is held, so the higher the uncertainty the higher the variance. Figure 1 illustrates these priors for both FEI and FEL individuals. Substantively, this reflects a novel and noncontentious policy in which individual voters do not yet have information about the costs and benefits of the policy in question. In the presence of a policy that is salient, this assumption about weak priors would not hold. If I analysed a very salient policy (something that citizens hear about constantly on the news and social media), the two groups would be more likely to have strong priors already and probably in opposite directions. With such strong priors, it is unlikely that any information signal would have much of an effect. Consider for example factual information for FEL voters: if they believe that a policy is good because they have already received plenty of signals supporting such a position, seeing factual information confirming this would not move their views and I would not be able to capture how they make their policy decisions in the first place. In order to see any updating on a salient issue, new information that communicates a change in the utility of the policy in question would have to come in: the FEIs will be more likely to update when they receive a party cue from their party communicating a change in the expected utility of a policy. Conversely, the FELs will be more likely to update when they receive new policy information communicating a change in the expected utility of a policy. This means that in an experiment setting, to see any updating on a salient policy, I would have to provide new information, while making sure that my respondents have not been exposed to this new information yet, otherwise they would have updated their views already. This is a limitation that keeps me from using a salient issue. Considering a policy that is realistic enough, but that has not been debated in the public arena, provides a better test to see what information voters rely on to make policy choices because it allows us to understand how individuals make policy decisions once they first hear about a policy. Furthermore, I also assume that the policy in question is noncontentious, meaning the policy has unanimous support from both sides of the political spectrum. Absent this assumption, my predictions would vary based on partisanship, requiring an unnecessary complication of the theory. I will discuss some implications of removing this assumption at the end of this section.
Posterior distributions for FEI and FEL individuals after receiving partisan (par.) or nonpartisan (nonpar.) signals. In this example, priors, signals and posteriors follow a truncated normal distribution (between a minimum utility (u) of 0 and a maximum of 1). The signal may suggest that the policy is either good (u = 0.8) or bad (u = 0.2).
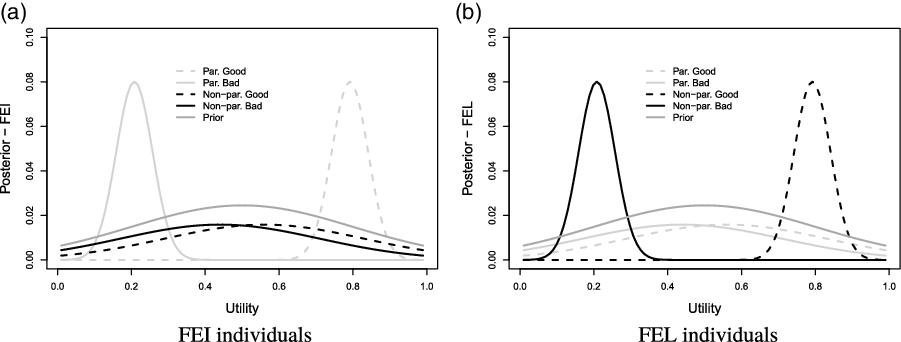
Next, I assume that the cost of processing information is different for the two types of voters. I assume that FEL individuals are more likely to rely on nonpartisan policy information, since this is relatively cheaper for them, due to their higher ability to evaluate the effects of the policy under analysis. On the other hand, FEI people, who are less likely to be able to evaluate the effects of a policy on their economic well-being on their own, are more likely to rely on cues coming from partisan sources of information, which are less expensive to them.
This assumption stands in contrast to recent research on motivated reasoning and political sophistication (Lodge and Taber, Reference Lodge and Taber2013), which finds that the more politically sophisticated are more likely to engage in motivated reasoning – reasoning driven by the motivation to reach conclusions congenial to one’s political group identity – than the less politically sophisticated. However, the type of sophistication analysed here, financial and economic literacy, is substantively different from political sophistication. The most commonly used measures of political sophistication are a battery of factual questions on politics (often asking to identify key political figures and to place political parties on the spectrum), questions on political interest (Delli Carpini and Keeter, Reference Delli Carpini and Keeter1996) or education level (Dassonneville and Grieb, Reference Dassonneville and Grieb2018; Marthaler, Reference Marthaler2008). However, these measures may not be strongly related to the tasks carried out when analysing a policy, as discussed in the section above, and hence may not be good measures of one’s ability to evaluate policies. If measures of political sophistication are just a proxy for political interest, it is not surprising to find that the politically sophisticated are more likely to engage in motivated reasoning. But if political sophistication and financial and economic literacy measure fundamentally different underlying abilities, this may explain why in contrast to the politically sophisticated, financially and economically sophisticated individuals are less likely to rely on partisan cues than the unsophisticated.
Next, I assume both types of voters receive a signal containing information about the utility of the policy in question. This information may come in the form of a partisan cue or nonpartisan factual policy information. Consider a partisan signal such as a cue coming from one’s party leader. I expect the signal to be weighted differently by FEI and FEL individuals. For FEI individuals, this information is probably definitive and clearer, due to their lower ability to do cost-benefit analysis. Hence, the signal would be quite clear and the variance quite low. Conversely, people with high FEL will find this piece of news only slightly informative and will not be placing much confidence in it (the variance will be high). Alternatively, consider nonpartisan information coming from unbiased sources, such as national institutes of statistics, peer-reviewed studies or policy evaluations. People with high FEL will find it less costly to interpret and will be more likely to rely on it when making their choices. Conversely, individuals with low literacy, due to their lower ability to evaluate this type of information and to its higher cost, will find it less informative.
After observing the information signals, the individuals will update their priors. Each type of voter, when updating their beliefs, will put more weight on the most informative signal, which results in the posterior distributions illustrated in Figure 1. Hence, the predictions are that for partisan cues, FEI individuals will update in the direction of the signal, while FEL individuals will not update. Conversely, for nonpartisan policy information, FEL individuals will update in the direction of the signal, while FEI individuals will not update.
If we relaxed the assumption about the policy being noncontentious, and let it be partisan, the predictions would vary. Let’s assume we have a scenario where the government supports a policy that the voter’s party disagrees with. I expect that if the voter is FEI he will be more likely to do what his party says (regardless of whether in fact the policy favours his economic self-interest or not, because he doesn’t know this and hence trusts his party). Conversely, if the voter is FEL she is more likely to support the policy that is best for her economic self-interest, regardless of whether that’s her party’s position. This theoretical expectation should be tested in future studies, to inform us of whether the effect of financial and financial literacy on information varies based on party affiliation.
Survey experiment setting: price controls in Italy
I test these predictions empirically using an original survey experiment in Italy. More specifically, I examine how individuals with different levels of financial and economic literacy respond to variation in the type of information they receive about a specific policy: price controls on olive oil. While there are two main types of price controls, where a price ceiling is the maximum price that can be charged and a price floor is the minimum price that can be charged for a good or service, I here decide to concentrate on the latter, also called a price support. Overall, price supports are intended to help producers, but at a cost to the rest of society. Regardless of which type of price support is implemented, these measures result in losses to society, although their corresponding distribution of benefits varies (Barkley, Reference Barkley2016). Here I decide to focus on the scenario where after the introduction of a minimum price on olive oil, the government buys the excess supply of oil (I expand on the different possible types of price supports in Online Appendix A). When the government decides to institute a minimum price for olive oil higher than the market price, producers increase the quantity supplied, but at the higher price this increased quantity does not have a buyer, so a surplus exists. The most common solution is for the government to purchase this surplus at the price support level. Consumers are unambiguously worse off as the price is now higher and quantity is lower than in the scenario with no intervention. Furthermore, the high costs of purchasing the surplus by the government are shifted to taxpayers, while producers are better off since they sell more olive oil at a higher price, resulting in net losses to society. In essence, the government is paying to make producers better off and consumers worse off, and the losses to consumers and the government outweigh the gains to producers.
I use a policy that, although realistic, has not been discussed in the public arena, and whose effects on utility most people would not be informed about. Specifically, this specific policy does not exist in Italy. However, olive oil has been historically salient in Italy, as recently there were protests when tariffs were removed on oil from Tunisia, so it would be realistic.Footnote 6 Second, I choose a noncontentious policy that I argue would have unanimous support from both sides of the political spectrum if it existed. The expectation that this policy would have unanimous support from the left and right stems from a recent policy proposal in Italy involving the introduction of minimum prices on sheep’s milk in Sardinia. This issue was not contentious as politicians from all of the main parties (the Democratic Party, the League, and the Five Star Movement) expressed support for the policy.Footnote 7 However, to alleviate concerns that the policy may be contentious I control for political ideology in all of my models.Footnote 8 The choice to avoid using a very politically contentious issue stems from the fact that choosing a partisan issue would imply an additional interaction term (and a much larger sample size), as heterogeneous effects would be expected not only across literacy, but also across political ideology. Choosing a fictitious but realistic policy that is supported across the political spectrum obviates this problem.
The two types of information that individuals are treated with are [1)] a political statement (party cue), coming from the individual’s party leader, and [2)] a cost-benefit exercise that asks the respondent to calculate what the total effect of the introduction of price controls would be on society (nonpartisan policy information). Following the theory, I expect that FEI individuals will be responsive to the party cue and update their views accordingly, while they will not be responsive to the cost-benefit exercise. Conversely, FEL individuals, who are more likely to do the cost-benefit analysis correctly, will be responsive to the cost-benefit exercise and update their views accordingly, while they will not be responsive to the political statement.
From these follow my hypotheses:
-
H1: FEL individuals are more likely to understand the net welfare effect of the policy on society, and to quantify it, than FEI individuals.
-
H2: FEI individuals are more likely to be responsive to the party cue and form their policy views accordingly, than FEL individuals.
-
H3: FEL individuals are more likely to be responsive to the cost-benefit information treatment and form their policy views accordingly, than FEI individuals.
Varying information on price controls
The survey experiment was conducted on a online sample of the Italian population in April 2019.
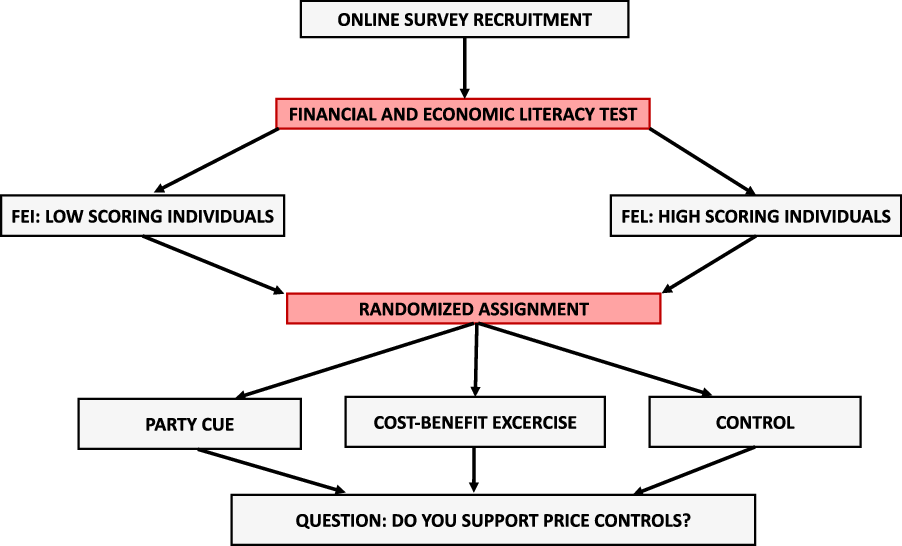
The survey was administered by Cint,Footnote 9 a survey research firm, and the sample is representative of the population in terms of age, gender and region of residence. An initial financial and economic literacy test determined who was eligible for the survey experiment, where only individuals with low or high literacy scores were retained.Footnote 10 The questions asked in the survey to determine financial and economic literacy are available in Appendix A. Figure 2 shows a summary of how the experiment was conducted, how individuals were recruited, and which were retained and randomised to three statements. The total sample includes 2,881 individuals, 1,004 in the control group, 1,017 in the political statement treatment group and 860 in the cost-benefit treatment group.
Survey experiment summary.
Respondents in the survey were randomly assigned to one of the three groups (control, political statement treatment and cost-benefit treatment). The control group saw this statement:
“Imagine the following scenario: Currently, the price of olive oil is 4€ per litre. Producers are asking the government to introduce a minimum price on oil, around 6€, in order to cover at least the costs of production. The government accepts to introduce a minimum price for oil.”
The party cue treatment group saw this statement:
“Imagine the following scenario: Currently, the price of olive oil is 4€ per liter. Producers are asking the government to introduce a minimum price on oil, around 6€, in order to cover at least the costs of production. The government accepts to introduce a minimum price for oil. The leader of the party you identify the most with argues that domestic producers need a protective shield or competition from abroad will be a gigantic risk to the future national production of oil.”Footnote 11
The cost-benefit information treatment group saw this statement: “Imagine the following scenario: Currently, the price of olive oil is 4€ per liter. Producers are asking the government to introduce a minimum price for oil, around 6€, in order to cover at least the costs of production. The government accepts to introduce a minimum price for oil. This creates an excess of oil on the market: more oil is produced than it is demanded by consumers. The government decides to buy the excess oil. After this measure is introduced, producers gain 100 million. The government pays 240 million. Finally, consumers lose 60 million. How much does society as a whole gain (+) or lose (–)?”
The latter is a multiple-choice question with five options (+100, −200, −240, +160, −60), allowing me to see not only if the respondents get the correct answer, but also if they understand the direction of the total effect, whether it is a net loss or gain for society.Footnote 12 In the party cue treatment, the name of the political leader from the party the individual feels closest to is not mentioned in order to avoid cueing source affinity.
Finally, after reading the statement to which the individual was randomly assigned, each respondent is asked whether they favour a minimum price on olive oil (Yes or No).
Covariate balance and matching
Following these questions, all respondents are asked to report their education level, income, age, gender, region in which they live, political ideology, work status and type of occupation they perform. As shown in Appendix B, although the respondents’ characteristics are quite balanced across treatment groups since people were randomly assigned into each group, financial and economic literacy is not randomly assigned, and as a result, respondents are not balanced across literacy levels. More specifically, the respondents are not balanced in terms of education, income, gender, region, political ideology and age across literacy groups. In order to address concerns about confounding in the main models, I control for these variables. Moreover, olive oil is not produced homogenously across Italian regions: the majority of its production is concentrated in Southern Italy (mostly Puglia), then followed by Central regions, and finally by Northern regions, which produce the least oil.Footnote 13 As a result of this, I create a variable, Region group, that distinguishes three groups: North, Center, and South. Since I expect that support for price controls on oil might be significantly higher in regions where it is produced the most and where some respondents may even be employed in the industry, I control for this variable in the analysis.Footnote 14
However, there are limitations to only controlling for these confounders, since although this adjusts for average differences in the outcome responses, if the treatment (financial and economic literacy in this case) is rare, many of the control observations may not be comparable. Hence, in addition to controlling for these confounding variables in the main analyses, I also conduct different matching procedures in order to create pruned samples, aimed at achieving better balance on my covariates. The goal of matching is to create a dataset that looks closer to one that would result from a perfectly blocked (and possibly randomised) experiment. To create matched samples, I use both propensity score matching (PSM) and Coarsened Exact Matching (CEM). King and Nielsen (Reference King and Nielsen2019) show that PSM methods should not be used for matching, as they can often increase imbalance, model dependence, researcher discretion and bias. Instead, Monotonic Imbalance Bounding (MIB) methods, including CEM, should be favoured, as they have been shown to dominate other matching methods in reducing imbalance, model dependence, estimation error, bias, variance, mean square error and other criteria (Iacus et al., Reference Iacus, King and Porro2011, Reference Iacus, King and Porro2012). I match financial and economic literacy and all of the potential confounders: education, income, age, gender, region and political ideology. The balances between treatment and control groups pre- and postmatching are shown in Appendix B. The results suggest that the two groups, before matching, are quite unbalanced. FEL individuals tend to have higher incomes, be more educated, male, older, slightly less right-wing and live in the North, compared to FEI individuals. The results also suggest that the CEM method outperforms the PSM methods (especially the nearest neighbour) and achieves almost perfect balance on all variables. Following King and Nielsen (Reference King and Nielsen2019), the models are then run on the full and the CEM matched samples.
It should be emphasized that matching can only adjust for observed covariates, and thus, it cannot eliminate omitted variable bias. Hence, although the information treatments are randomly assigned, since financial and economic literacy is not randomly assigned, we cannot be certain that there is not some unobserved variable affecting financial and economic literacy, information processing and the policy preference.
Findings
For each of the full and matched datasets (Magistro, Reference Magistro2021a), I estimate logistic models and test hypotheses 1 to 3. I use multiple imputation with the R package “Amelia” to deal with about 200 missing values, since multiple imputation has been shown to reduce bias and increase efficiency compared to listwise deletion.Footnote 15 I then run the analyses on 20 multiply imputed datasets.Footnote 16 Both “Amelia” and “MatchIt,” the package used for matching, are compatible with the R package “Zelig,” which I used to run the regressions and compute the quantities of interest (Choirat et al., Reference Choirat, Honaker, Imai, King and Lau2020; Ho et al., Reference Ho, Imai, King and Stuart2011). “Zelig” provides combined results across the imputed datasets calculated by Rubin’s Rules (Rubin, Reference Rubin2009), to correct the standard errors by combining the within imputation variance and the between imputation variance. Similarly, when quantities of interest are plotted, these are correctly pooled across those from each of the imputed datasets.
In the next subsections, I present regression tables for all models and figures summarising the results for the full sample and the CEM matched sample.
Cost-benefit exercise
In the first set of models, I test hypothesis 1, more specifically whether FEL individuals are more likely to understand the net welfare effect of the policy on society, and to quantify it, than FEI individuals.
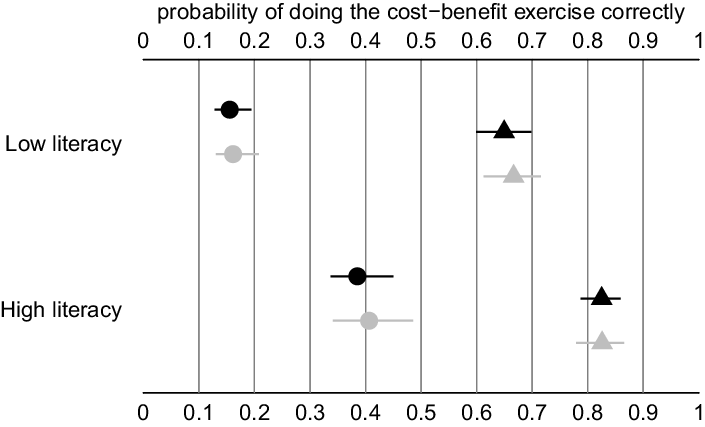
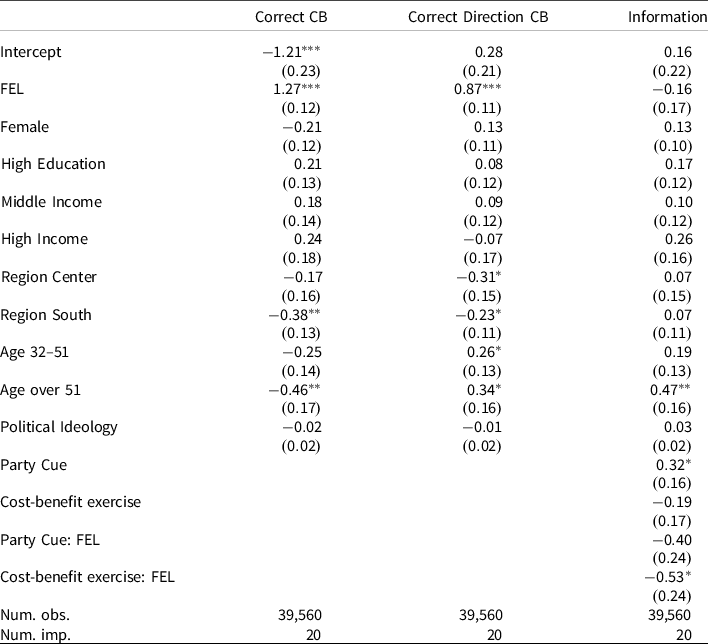
Figure 3 shows the probability that a respondent answered the cost-benefit exercise correctly and the probability that they were at least able to identify the direction of the effect, whether society as a whole loses or gains from the policy in question, while Tables 1 and 2 show the regression tables. The findings indicate that FEL individuals are more likely to answer the cost-benefit exercise correctly, and they are also more likely to correctly identify the direction of the effect of the policy, which in this case is negative for society. The findings are very similar for both the full sample and the CEM sample. Individuals with high literacy are 23% (24% in the CEM model) more likely to answer the question correctly than FEI individuals, and they are 18% (16% in the CEM model) more likely to understand the direction of the effect of the policy in question.
Expected probabilities of doing the cost-benefit exercise correctly (circle markers) and of identifying the correct direction of the policy effect (triangle markers) for the full nonmatched sample (black) and the matched sample from CEM (grey). Bars indicate the 95% confidence interval.
Logistic models for full dataset (no matching): log odds and standard errors in parentheses. The results are for the combined imputations and they are calculated by Rubin’s rules
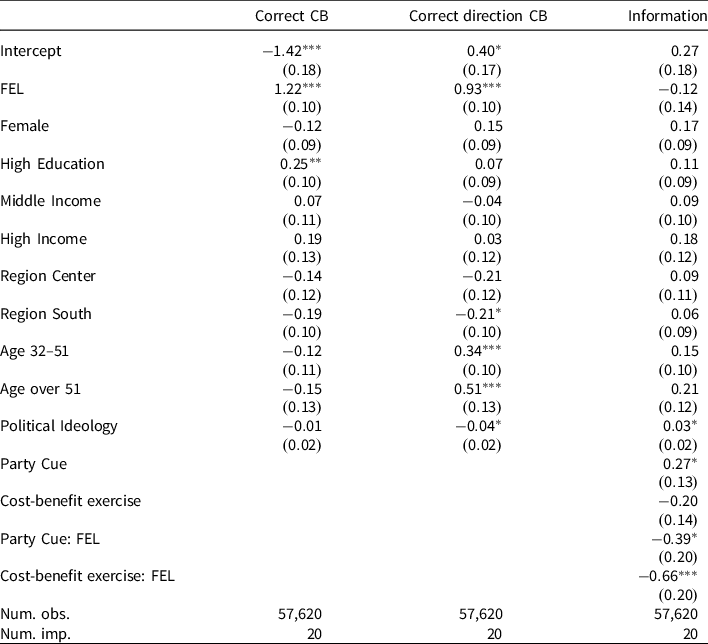
***p < 0:001, **p < 0:01, *p < 0:05.
Logistic models with CEM matching: log odds and standard errors in parentheses. The results are for the combined imputations, and they are calculated by Rubin’s rules
***p < 0:001, **p < 0:01, *p < 0:05.
Information treatments
In the second set of models, I test hypotheses 2 and 3, whether FEI individuals are more likely than FEL individuals to be responsive to the party cue and form their policy views accordingly, and whether FEL individuals are more likely than FEI individuals to be responsive to the cost-benefit information treatment and form their policy views accordingly.
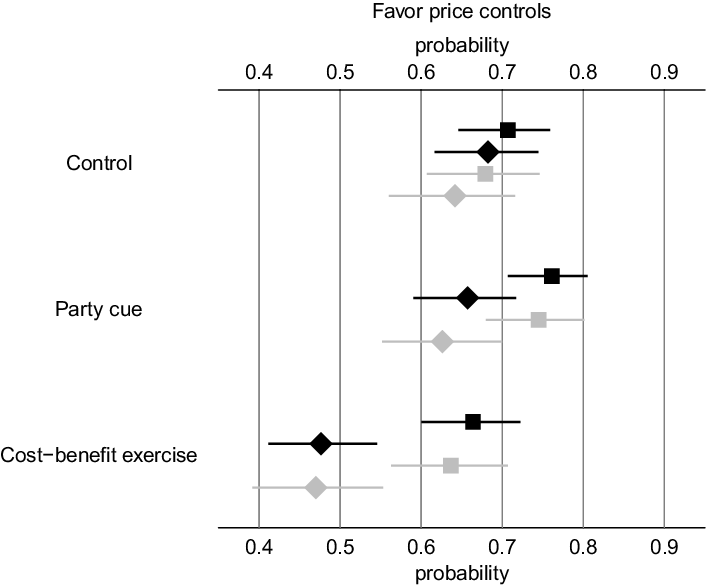
Tables 1 and 2 show regression results. Figures 4 and 5 show respectively the expected probabilities that the respondent favours price controls by treatment group and literacy group, and the first differences of the probabilities of favouring price controls by treatment group and literacy group. When looking at the results for the control group in Figure 6, it is clear that FEI and FEL individuals do not have significantly different priors on price controls. In the absence of additional information of either type, the percentage of approval of price controls in both groups is quite high (70% for FEI and 67% for FEL). However, consistent with the theoretical expectations, the effects of the information treatments are drastically different across the two groups. Turning to Figure 5, the effect of the party cue treatment is significant for FEI individuals, as those in the treatment group are 5% (7% in the CEM model) more likely to approve of price controls than those in the control group. However, the effect of the party cue treatment is not significant for FEL individuals, who are 2% less likely to approve of price controls than FEL individuals in the control group. Conversely, while the effect of the cost-benefit information treatment is not statistically significant for FEI individuals, it is statistically and substantively significant for FEL individuals: FEL individuals in the cost-benefit treatment group are 21% less likely to approve of price controls than FEL individuals in the control group (17% using CEM). To understand the substantive significance of this effect, it is helpful to look at the expected probabilities of supporting price controls by group in Figure 4: it is evident that the majority is in favour of price controls in all groups except for FEL people in the cost-benefit treatment group. After doing the cost-benefit exercise, support for price controls among the FEL is down to 47%.
Expected probabilities of favouring price controls by treatment group for FEI individuals (square markers) and for FEL individuals (diamond markers) for the full nonmatched sample (black) and the matched sample from CEM (grey). Bars indicate the 95% confidence interval.
First differences of favouring price controls by treatment group for FEI individuals (square markers) and for FEL individuals (diamond markers) for the full nonmatched sample (black) and the matched sample from CEM (grey). Bars indicate the 95% confidence interval. White markers indicate statistical nonsignificance, filled markers statistical significance.
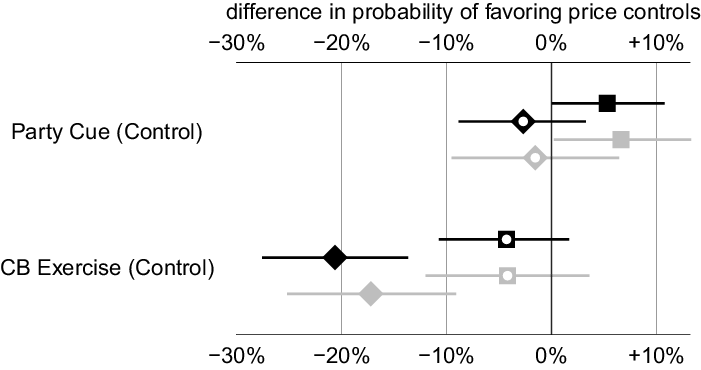
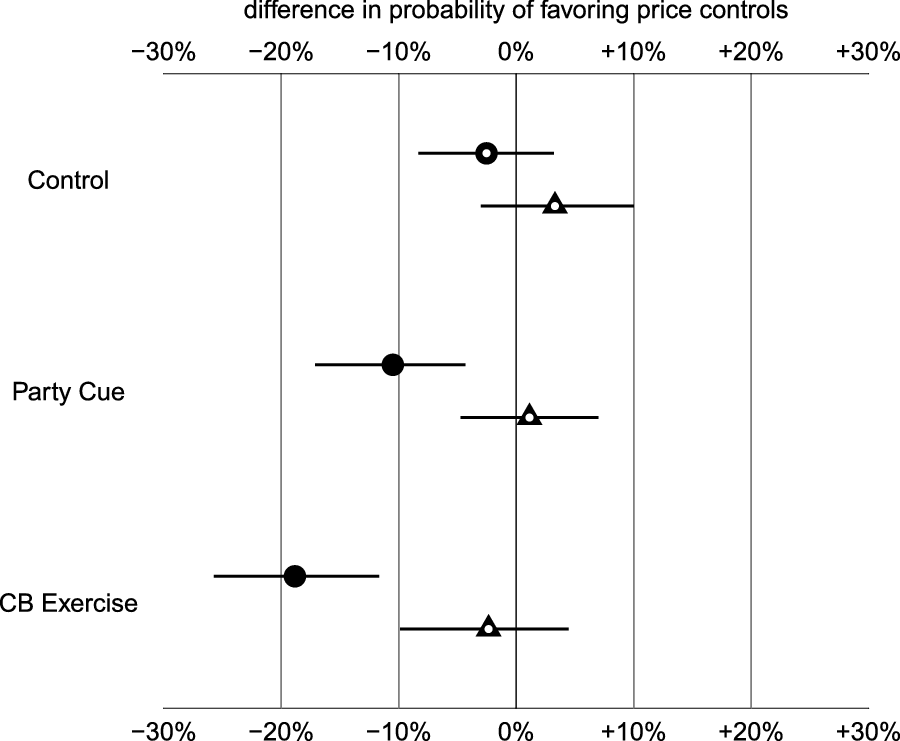
Figure 6 shows us the first differences of the probabilities of favouring price controls by literacy group. What emerges is that in the control group, as mentioned above, FEI and FEL individuals do not have significantly different priors on price controls. However, the distance grows significantly in the two treatment groups, as after the party cue treatment, FEL individuals are 11% (12% using CEM) less likely to approve of price controls than FEI individuals, while in the cost-benefit treatment FEL individuals are 18% (17% using CEM) less likely to approve of price controls.
First differences between FEL and FEI individuals of probabilities of favouring price controls for the full nonmatched sample (black) and the matched sample from CEM (grey). Bars indicate the 95% confidence interval. White markers indicate statistical nonsignificance, filled markers statistical significance.

Overall, the findings across both matched and nonmatched datasets support all three hypotheses under study and emphasize the conditional nature of information. FEL individuals are more likely to understand the net welfare effect of the policy on society, and to quantify it, than FEI individuals. FEI individuals are more likely to be responsive to the party cue and form their policy views accordingly, than FEL individuals, and finally, FEL individuals are more likely to be responsive to the cost-benefit treatment and form their policy views accordingly, than FEI individuals.
I acknowledge that since, as discussed above, matching adjusts for observed covariates but not for unobserved ones, omitted variable bias may still be an issue. In particular, in the analysis under study the party cue is in favour of the policy while the policy information underlines how the costs of the policy exceed the benefits for society. If there was some omitted factor correlated with financial and economic literacy, which in turn affected how people respond to the different information treatments in the same way as financial and economic literacy would, the results would be biased. This would occur if for instance FEL individuals had an intellectual bias of appearing smart by being more likely to be responsive to information that is “against” a policy, while FEI individuals had a bias towards being “gregarious,” and hence more likely to be responsive to information that is pro-policy. This would only have to apply to reception of information though; otherwise, we would see a pre-existing difference in the control group among FEI and FEL individuals, where the latter would be more likely to be against a policy they know little about, to confirm their “against” bias.
Education and financial and economic literacy
In this section, I also take several steps to investigate the relationship between education and financial and economic literacy. First, I run bivariate correlations between education and financial and economic literacy to examine the strength of their relationship. Second, I run all the main regressions without controlling for education, in order to avoid potential collinearity issues. Third, to investigate whether higher education might be a complement of financial and economic literacy I run a model with an interaction between education and financial and economic literacy. Finally, to see if education is just an alternative measure for financial and economic literacy I run the same models with education as the main covariate of interest rather than financial and economic literacy.
First, I analyse bivariate correlations between education and financial and economic literacy. I use both the original education variable with 6 categories and the binary education variable, with higher education and less than higher education only. Table 3 shows these bivariate correlations: regardless of the measurement we use for education, the correlation between education and financial and economic literacy is rather weak, suggesting that they do not capture the same underlying features.
Table of correlations between financial and economic literacy and education variables

Second, if financial and economic literacy were just a proxy for education, including a control for education in the main models would likely result in collinearity. Table C1 in the appendix shows the results of all of the regressions without including a control variable for education: the substantive and statistical significance of the coefficients does not change, bringing further support to the claim that education and financial and economic literacy capture different features.
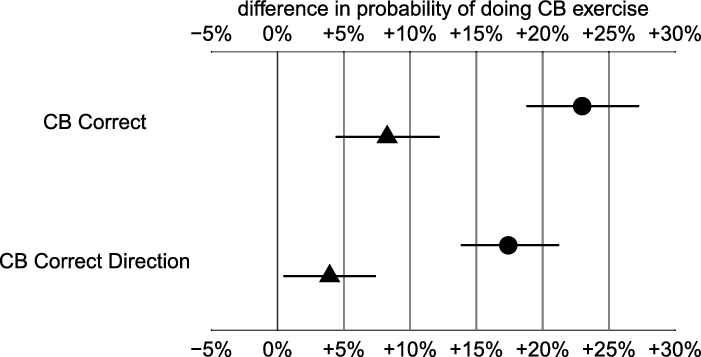
Next, I investigate whether higher education might be a complement of financial and economic literacy. Table C2 in the appendix shows that this is not the case. The effects of party cues and policy information for literate and illiterate individuals do not vary by education level. Finally, I run the main models with education instead of financial and economic literacy as the main covariate of interest. If financial and economic literacy were just a proxy for education, then we should find differential treatment effects between highly educated and low educated voters in a similar way as we do for FEI and FEL respondents. The regression table is available in Table C3 of the appendix. As far as conducting the cost-benefit exercise, Figure 7 shows that highly educated people are more likely to do the exercise correctly or guess the correct direction by respectively 8% and 4% than low educated ones; however, these effects are significantly smaller than when using financial and economic literacy, potentially suggesting that there is a partial effect of numeracy.
First differences in probability of doing the cost-benefit exercise correctly and of identifying the correct direction of the policy effect between FEL and FEI respondents (circle markers) and highly educated and low educated ones (triangle markers). Bars indicate the 95% confidence interval.
For the information treatments, what emerges from Figure 8 is that the effects of the treatments are not differential between high educated and low educated people (the first differences between highly educated and low educated individuals are never significantly different from zero), suggesting that financial and economic literacy has distinctive features that general education does not capture.
First differences of probabilities of favouring price controls between FEL and FEI respondents (circle markers) and between highly educated and low educated ones (triangle markers) by treatment group. Bars indicate the 95% confidence interval. White markers indicate statistical nonsignificance, filled markers statistical significance.
Conclusion
Political economy theories assume that individuals will act to maximise their self-interest. However, this assumption often does not hold in the real world, as many people support policies that are against their self-interest. While these theories implicitly assume that people know what the effects of these policies on their economic well-being will be, I relax this assumption. Instead, I argue that a specific type of voter sophistication, financial and economic literacy, affects an individual’s understanding of the effects of an economic policy. In turn, financial and economic literacy influences the type of information that individuals are responsive to. I hypothesise that FEL individuals are more likely to rely on nonpartisan policy information when judging a policy proposal, since this is relatively cheaper for them, due to their higher ability to evaluate the effects of the policy under analysis. Conversely, FEI people, who are less likely to be accurate at estimating the effects of a policy on their economic well-being on their own, are more likely to rely on cues coming from partisan sources of information, which are less expensive to them.
Using a survey experiment in Italy, I investigate how FEI and FEL individuals respond to different types of information, i.e. a party cue and a cost-benefit exercise, on a hypothetical policy proposal involving price controls on olive oil. Since financial and economic literacy, unlike information, is not randomly assigned, this article employs matching procedures. Findings across both matched and nonmatched samples suggest that first, FEL individuals are significantly more likely to answer the cost-benefit exercise correctly and also more likely to answer in the right direction, identifying whether the change in society’s welfare is positive or negative, than FEI individuals. What also emerges from the findings is that these two groups of individuals do not have drastically different priors on such a policy, which is novel and noncontentious, however, once exposed to the party cue or the cost-benefit exercise they form their policy views differently, relying on different types of information. While FEL individuals are more responsive to factual information concerning the costs and benefits of the policy under analysis, FEI individuals are not responsive to this type of information; instead, they are more receptive to cues coming from politicians that they support. Finally, I also analyse whether the results may be driven by differences in education between the FEL and FEI groups. Findings suggest that education is only weakly correlated to financial and economic literacy. Furthermore, I also re-analyse the data according to the respondent’s education level instead of financial and economic literacy. I find no differential effects of the treatments between highly educated and low educated voters, suggesting that financial and economic literacy has distinct features that years of schooling do not capture.
These findings have significant implications for both representative and direct democracy. Although scholars have celebrated party cues as one low-cost, rational and effective decision-making instrument, this is not the case in scenarios in which politicians’ interests are not aligned with those of the majority of the electorate. In this scenario, cues are not a rational and effective substitute for policy information. If citizens are not informed about the choices that they are making and if they blindly follow party cues, when such cues are misleading, they will end up supporting policies that do not reflect their interests. Conversely, efforts to inform the voters may successfully shift opinions, but only provided that citizens can understand and evaluate the information. In the long term, providing financial and economic courses from early education may help citizens better understand the effects of policies on their economic well-being and ultimately make democracy more responsive to their preferences.
It is also worth acknowledging some limitations. One is the choice to focus on price controls on olive oil, a novel issue. The reason why I decided to focus on a politically nonsalient policy is that I was interested in testing how people form their policy choices, specifically what type of information they are more likely to rely on in situations in which their priors are weak. Had I chosen a salient policy, one that an individual constantly hears and reads about in the news, the treatments would be much less likely to be effective since an individual would already have strong priors about the issue. For instance, if an FEL individual knows that EU membership is good for the economy of her country, if I gave her an information treatment on the costs and benefits of EU membership, she would not update her opinion, hence not permitting me to see how she formed her preference. While this may raise concerns about the external validity of these findings beyond nonsalient issues, there is ample evidence that FEI and FEL individuals have different preferences on salient issues. For instance, Magistro (Reference Magistro2021b) and Magistro (Reference Magistro2020) find that FEL individuals are more likely to support free trade, EU membership and immigration than FEI individuals, both in Italy and the UK. Furthermore, this is true regardless of objective or subjective economic self-interest, as both FEL winners and losers from globalisation are more likely to support economic openness than their illiterate counterparts.
Future research should investigate further under which conditions FEI and FEL individuals update their beliefs. Following the recent research on the effects of information, future experiments should analyse how and if findings change when using a more salient issue and a more contentious issue. In this case, priors would be likely to be strong and to differ in the first place among FEI and FEL individuals. Finally, when analysing a contentious issue, it would be interesting to manipulate the political information that different individuals are exposed to, since preference formation and updating may differ not only based on financial and economic literacy, but also based on partisanship.
Supplementary material
To view supplementary material for this article, please visit https://doi.org/10.1017/S0143814X21000234
Acknowledgements
The author would like to thank Caitlin Ainsley, Jim Caporaso, Fabio Ghironi, Anthony Gill, John Wilkerson, James Long, Victor Menaldo and participants to the Political Economy Forum at the University of Washington for helpful comments and valuable suggestions on previous versions of this article. The author would also like to thank the Editor and two anonymous reviewers, whose comments greatly improved the paper. Errors are my own.
Data availability statement
Replication materials are available in the Journal of Public Policy Dataverse at https://doi.org/10.7910/DVN/QT2RBT
Competing interests
The author(s) declare none.
Funding
This work was supported by the Kizhanatham Jagannathan Graduate Research Grant at the University of Washington.


 Open access