

INTRODUCTION
Climate change has been reported as having a significant impact on rural livelihoods in Uganda, with farmers describing changes in variability and seasonality (Apuuli et al., Reference Apuuli, Wright, Elias and Burton2000; Ericksen et al., Reference Ericksen, O'Brien and Rosentrater2008; GoU, 2007; James, Reference James2010). The interconnected nature of livelihoods means that climate change can impact both directly and indirectly on many different aspects, exacerbating existing vulnerabilities in health, water availability and agricultural production (IPCC, 2007). For example, there is evidence for increased malaria in some regions (Patz and Olson, Reference Patz and Olson2006; Wandiga et al., Reference Wandiga, Opondo, Olago, Githeko, Githui, Marshall, Downs, Opere, Oludhe, Ouma, Yanda, Kangalawe, Kabumbuli, Kathuri, Apindi, Olaka, Ogalo, Mugambi, Sigalla, Nanyunja, Baguma and Achola2010). Farmers claim increasingly unpredictable weather has led to poor yields, a reduction in crop varieties and pastures, poor animal health, rangeland related conflicts, greater expense and labour, food insecurity and reduced incomes leading to poverty (Oxfam, 2008). With only 0.1% of land irrigated, changes in rainfall and temperature greatly impact the rainfed agricultural sector as well as the ability to achieve broader development objectives in Uganda (James, Reference James2010).
There is a lack of scientific consensus on the trend for annual rainfall in Uganda. McSweeney et al. (Reference McSweeney, New and Lizcano2008) report an annual rainfall decrease of 3.5% since the 1960s, with annual rainfall due to decline further across East Africa (Apuuli et al., Reference Apuuli, Wright, Elias and Burton2000; Funk et al., Reference Funk, Dettinger, Michaelsen, Verdin, Brown, Barlow and Hoell2008), although some regions may experience increases in the future (Hepworth and Goulden, Reference Hepworth and Goulden2008; McSweeney et al., Reference McSweeney, New and Lizcano2008). Experiences to date have been different across Uganda, with regions reporting different problems. According to climate analysis in the Ugandan Government's National Adaptation Programme of Action, published in December 2007 (GoU, 2007), the wetter areas of Uganda, around the Lake Victoria basin and the east and northwest are tending to become wetter. Government meteorologists state that the droughts that periodically affect the western, northern and northeastern districts are becoming more frequent. They logged seven droughts between 1991 and 2000, with a particularly long and severe drought in 1999–2000. There is a clearer trend in temperature, with evidence that mean temperatures in Uganda have increased by 1.4 °C since the 1960s (McSweeney et al., Reference McSweeney, New and Lizcano2008). Uganda's climate is also affected by the La Niña and El Niño phenomena, through changing temperatures in the Pacific Ocean, with La Niña years tending to bring significant drying and El Niño years heavy rains. Climate change impacts on these major processes are not well enough understood to make predictions with confidence, although there is some evidence that warming will increase the intensity and frequency of these phenomena (IPCC, 2007). The most recent (moderate) La Niña occurred in 2008.
However, annual rainfall may be less critical to farmers’ production than distribution through a season, the way rain falls during rainfall events and the impacts of increased temperature on soil moisture (Mukiibi, Reference Mukiibi2001). For example, in-season dry spells or an intense rainfall event during a crop flowering period or before harvest will reduce yield. Non-governmental organizations working in Uganda report that farmers recognize an increasingly erratic rainfall pattern in the first March to May rainy season, causing drought and crop failure, but also more intense rainfall, especially in the second rains at the end of the year, causing flooding and erosion (Oxfam, 2008). McSweeney et al. (Reference McSweeney, New and Lizcano2008) also suggests that rains during the March to May rainy season are falling by 4.7% per decade.
Clarity on impacts by specific region is essential to support vulnerable communities to adapt their food systems to emerging climate change realities. The Ugandan government has prioritized investment in food security and agriculture in the National Action Plan for Adaptation, created a Parliamentary Forum on Climate Change, and formed a National Agricultural Advisory Service (NAADS) and National Agricultural Research Organisation (NARO) (GoU, 2007; NAADS, 2001; Ojacor, Reference Ojacor and Mukiibi2001). While there are Ugandan success stories about institutional innovation in response to these challenges (Mangheni, Reference Mangheni2007), there are concerns about the limited progress made towards climate-proofing development in practice (Hepworth and Goulden, Reference Hepworth and Goulden2008). The Ugandan Poverty Eradication Action Plan and the Plan for Modernisation of Agriculture provide policy frameworks to transform subsistence agriculture into commercial enterprise, although they are yet to generate the capacity to effectively support the risk-averse rural poor (Bahiigwa et al., Reference Bahiigwa, Rigby and Woodhouse2005; Ellis and Bahiigwa, Reference Ellis and Bahiigwa2003; James, Reference James2010).
Critically, government has not made explicit how to connect scientific initiatives with local knowledge, although it recognizes local knowledge as a priority area (GoU, 2007). Whilst agricultural investment by smallholder farmers in risk-prone environments has occurred in the last few decades, to build long-term resilience into livelihoods through agricultural investment, innovation and experimental learning initiatives, agricultural stakeholder organizations need to bring together different knowledges, and at the very least, recognize the role of local knowledge in flexible decision-making if they want to enhance both user tools and the adoption of more sustainable and productive farming practice (Cooper et al., Reference Cooper, Dimes, Rao, Shapiro, Shiferaw and Twomlow2008; Nelson et al. Reference Nelson, Adger and Brown2007; Osbahr et al., Reference Osbahr, Twyman, Adger and Thomas2008; Reference Osbahr, Twyman, Adger and Thomas2010). Researchers are paying increasing attention to local perceptions of climate in human adaptation to climate change (Mertz et al., Reference Mertz, Mbow, Reenberg and Diouf2009; Meze-Hausken, Reference Meze-Hausken2004; Reid and Vogel, Reference Reid and Vogel2006; Thomas et al., Reference Thomas, Twyman, Osbahr and Adger2007; Tschakert, Reference Tschakert2007; West et al., Reference West, Roncoli and Ouattara2008), recognizing that understanding local knowledge is crucial to assess how farmers value both risk and information, why they select particular services and whether they choose to invest in subsequent ownership and self-innovation of extension projects. The most important risk for production is arguably rainfall variability but stakeholders can over-estimate its negative impact of climate-induced risk when there are few empirical local-level evaluations in Uganda. Risk is associated with the likelihood and magnitude of harm, and the management of this risk is action taken to reduce vulnerability (Patt and Schroter, Reference Patt and Schroter2008). Perception of climate risk and perception in general is highly influenced by peoples’ opinions and values, which are in turn influenced by the economic, cultural and social environment (Adger et al., Reference Adger, Lorenzoni and O'Brien2009; Meze-Hausken, Reference Meze-Hausken2004; Morton, Reference Morton1997; Osbahr et al., Reference Osbahr, Twyman, Adger and Thomas2010). There is a strong link between perception and behaviour, and perception of climate risk will affect adaptation management. A first step is to identify local perceptions and evaluate how these views relate to the climate data.
This paper presents a study in southwest Uganda of farmers’ perceptions of climate trends and variability and compares this local knowledge with the climate data to uncover how perceptions of risk and opportunity are associated with recent climate. This knowledge is useful to agricultural and meteorological researchers and planners to help them make optimal choices with respect to direct and indirect impacts of climate variability and change. More broadly it is valuable in helping to improve agricultural innovations that support farmers to better manage uncertainty. The research presented in this paper will contribute to this debate in three ways. First, it examines farmers’ perceptions of climate parameters and their historical patterns, in particular subtle perceptions of trends and variability over time and changes within seasons (including patterns of heavy rainfall events and temperature). Second, it identifies the patterns of change and variability in climate parameters from the 1960s to present, including trends in daily rainfall and temperature, seasonality, changing probabilities of risk and intensity of rainfall events. The paper also explores interpretations of ‘normal variability’ versus specific changes. Third, by comparing patterns in the climate data with farmer perceptions, we will reflect on why there are differences and consider the implications for communicating information about risk to users in order to support agricultural innovation.
RESEARCH APPROACH AND METHODS
Site description
The research was carried out in Mbarara District, southwest Uganda; the district is served by a weather station (longitude 30.683, latitude −0.600; altitude 1420 m asl) and the field location was selected within this catchment zone. Part of the region is characterized by hilly dry vegetation and access to this land remains essential to pastoral herders (Mukiibi, Reference Mukiibi2001; Turner, Reference Turner2005). A turbulent history over the last 50 years, particularly between the late 1960s and 1980s due to economic collapse, political instability and conflict, and economic reforms from the late 1980s have been linked to continuing poverty (Hansen and Twaddle, Reference Hanson and Twaddle1998). This history has created a legacy of on-going problems in land rights, identity and gender discrimination, as well as concerns about improving food security. Agricultural production in the southwest of Uganda is constrained by the high cost of inputs, poor infrastructure, distance to market, land shortages and degradation (Nyende et al., Reference Nyende, Nyakuni, Opio and Odogola2007).
Agriculture is predominantly rainfed and its two cropping seasons a year are dependent on bimodal rains (Table 1) from March to May (season 1) and again in October to December (season 2) (Komutunga and Musiitwa, Reference Komutunga, Musiitwa and Mukiibi2001). The total rain for the six months of the two rainy seasons is around 969 mm or around two-thirds of the annual total. Agriculture and cattle are the dominant economic activities in the region, banana and coffee the main cash crops, and subsistence food crops include maize, beans, cassava, groundnut, fruit and vegetables (Musiitwa and Komutunga, Reference Musiitwa, Komutunga and Mukiibi2001). Most settled households manage mixed farms, growing both cash and subsistence crops and keeping small stock, use labour-intensive subsistence practices on small areas averaging 2 ha and have few technological inputs (Mangheni, Reference Mangheni2007; Ojukwu et al., Reference Ojukwu, Mousseau, Ahmed, Nuwagira, Exel and Yamoah2006). The southwestern region is reported as the fastest warming region, experiencing increasing malaria, lower dairy cattle yields due to heat stress and more frequent drought, with areas becoming unsuitable for coffee production and traditional crops (Apuuli et al., Reference Apuuli, Wright, Elias and Burton2000). Farmer needs assessments were carried out in the region by NAADS farmer forums on food security (NAADS, 2001), which led to NARO starting on-farm demonstration experiments with drought resistant legumes and short-variety cassava in 2008.
Minimum, mean and maximum rainfall in mm for Mbarara District†.

†The results in Table 1 are from 35 years, with 11 years omitted where at least one month was missing. For consistency these same years have been omitted for the seasonal totals as well as the annual totals.
Method
Location of fieldwork and investigation of farmer perceptions. Fieldwork was completed in July and August 2009 in the administration of Nyanja Parish, Bukiro Sub-County, which was selected with advice from NARO Zonal Office staff. The selection of a Parish as the large-scale unit of analysis relates to the unit of delivery by the Ugandan Extension Services. The three villages in the Parish were small and located close together; villages work together on agricultural projects under one administrative area and share facilities, such as a school, government and farmer forum offices and a clinic. Bwizibwera was the nearest trading centre for the sale of produce, but although some distance on a dirt road, traders also came to the villages.
An introductory Parish meeting and three focus groups were conducted at the start of the fieldwork to allow the researchers an insight into formal and informal institutions present within the communities, communication networks, the local agricultural cycle for different crops and activities, and general perceptions of historical change, including extreme weather events and changing climatic trends. Farm walks were used to compare farmers’ statements to observed activities. Data collection focused on a semi-structured questionnaire, administered to 90 households within the Parish. A record of all farmers in the Parish held by the Farmer Forum was stratified into households participating in current agricultural projects and those who did not, and then households from each group were randomly selected for interview. Local guides helped with household identification and provided introductions. Meteorological Service and NARO staff were trained in qualitative research tools, engaged in the reflective testing of the instruments and their administration, and acted as translators. The semi-structured questionnaire used a standard qualitative research approach (Bryman, Reference Bryman2008; Hillyer and Ambrose-Oji, Reference Hillyer and Ambrose-Oji2005) to collect data on household socio-economics and farming characteristics, involvement with agricultural projects, perceptions of problems, weather-related change and specific events, indicators of change, information sources, coping and adaptive responses, investment and future priorities. The questionnaire focused on livelihood and farming at the outset in order to avoid leading questions about climate change and used open-ended questions to allow farmers to introduce weather-related issues into discussion or years that they remembered. The analysis presented in this paper will focus only on perceptions of climate trends, seasonality and weather-related events for specific years. Qualitative data was analysed using a system of coding to establish patterns and trends, and both quantitative and qualitative responses were compared in SPSS and Excel.
Investigation of climate data. Daily weather data for Mbarara District was provided to the researchers by the Uganda Meteorological Department. The study location was selected as close to the station (40 km) to minimize the impact of spatial variability. Data consisted of daily rainfall totals from January 1963 to December 2008 and daily maximum and minimum temperatures from March 1960 to February 2009. There were complete rainfall records in 35 of the years, and complete temperature records in 27 of the years. Where records were incomplete missing values were usually for whole months and there were no temperature records for three of the years in the 1980s. Therefore, initial trends were explored by month because annual results would have required all years with more than a few missing values to be omitted or adjustments made.
For the temperature data, the daily maximum values were summarized on a monthly basis giving the extreme maximum each month, the mean of the daily maximums and the lowest maximum. The same were calculated for the minimum temperatures. The values for each month were plotted as a time series and trend lines were fitted to examine the extent of temperature change during the period. The fitting used ordinary regression modelling because the data for each month is not expected to be serially correlated with values from the previous year.
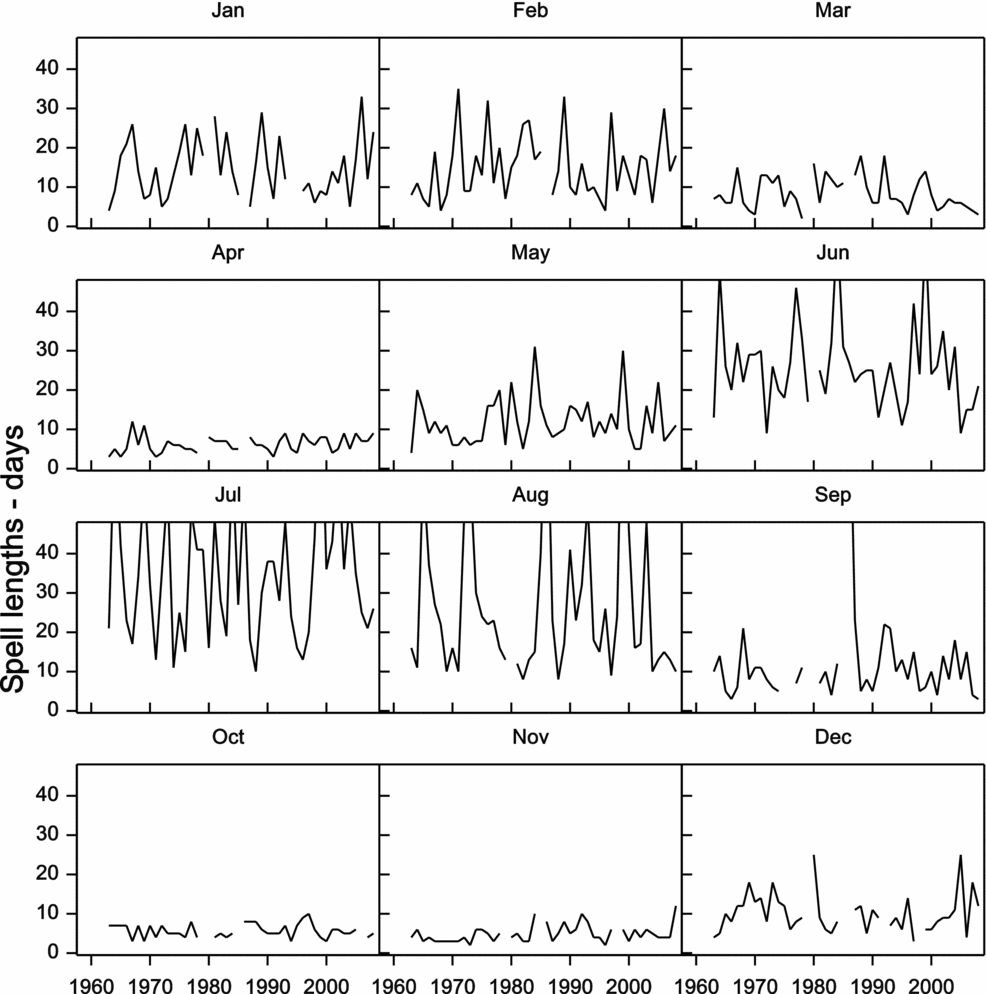
Three different monthly summaries were calculated from the daily rainfall data. They were the monthly rainfall total, the number of rain days and the length of the longest dry spell. In the latter two cases a threshold of 0.85 mm was used to define a rainy day. In calculating the longest dry spell in any month, if the preceding month finished with a dry spell, then this is ‘inherited’ by the next month. For example, in 1964, 12 May to 31 May was dry, hence 1 June was already the twenty-first consecutive dry day and by the time rain was recorded in June 1964 the dry spell was 50 days. This explains why a month may have a longest dry spell that exceeds 30 days.
A variety of other ‘events’ were also calculated, as described in Stern et al. (Reference Stern, Dennett and Dale1982a). The first is the date of the start of the season, defined as the first date after 15 February (taken as the earliest possible date) on which there is more than 20 mm rainfall within a three-day period. A second definition was the same as the first, but with an addition that there should not be a dry spell of more than 7 days in the 30 days after planting. During the first season, taken as March to May, further results give the length of the longest dry spell, and the maximum daily rainfall. Similar results were calculated for the second season. In this case, the earliest date for the start was taken as 15 September and the period for the dry spell and the extreme rainfall was October to December. All the events were graphed as time series, to permit an assessment of the evidence for change in the 45 years of the record.
A second method of analysis was also undertaken, to investigate whether the lack of a clear trend in the pattern of rainfall is the result of a lack of evidence or because the change is small and cannot be detected due to high year-to-year and season-to-season variability of the rainfall data. This method uses the daily rainfall data directly, and fits a Markov chain model to the occurrence of rainfall, as described in Stern et al. (Reference Stern, Dennett and Dale1982b). Separate curves were fitted to the chance of rain following a dry and following a rainy day. The rainfall amounts on rainy days were also modelled. This method of modelling rainfall data has become standard and is used in several software packages, such as MarkSim and the Weatherman module that is part of the DSSAT crop modelling software. A detailed explanation of Markov chain modelling is given in Stern et al. (Reference Stern, Dennett and Dale1982b), Coe and Stern (Reference Coe and Stern1982) and Stern and Coe (Reference Stern and Coe1984). This method of analysis makes more ‘complete’ use of the rainfall data, and hence should be able to detect smaller changes in the pattern of rainfall than can be detected from the more direct methods used in this paper, and described in Stern et al. (Reference Stern, Dennett and Dale1982a).
RESULTS
Farmer perceptions
Farmers were asked what the weather was like a long time ago, which led to the introduction of their perception of the ‘normal’ seasonal rainfall pattern, and afterwards what the weather was like today. Their comments about variability, pattern and change over time were elaborated through discussion about rainfall duration through specific months, trends and spatial distribution. Farmers’ perceptions of general change over time reflected seasonality, distribution, amount, intensity and temperature (Table 2). Nearly half of respondents felt that there had been a change in seasonality during the past 20 years. This change in seasonality refers to farmers’ perceptions of the monthly pattern of the rains, including when they should start and end. Both the first and second rainy seasons were perceived to be starting later and ending earlier. Farmers’ reported that the first season had shifted from a start in February to March and now ended in April rather than May. Meanwhile, they claimed the second season had shifted from a start in August to September and now ended in November rather than December. Sixteen percent of farmers’ claimed that the amount of rain that fell over both seasons had decreased and 15% felt that the rain that did fall was more variable with more heavy rainfall events at the start of the season. Over a quarter of respondents perceived there to be an increased problem in the distribution of rain within a rainy season.
Farmers’ perceptions of climate change during the past 20 years.

Increased temperature in Table 2 refers to heat during the year and does not include opinions about the heat in the normal ‘hot’ season (dry season between June and August). Only a small number of respondents reported that temperature had increased significantly during the past 20 years. When asked whether there were specific years when they remember the weather and why (Table 3), many more respondents highlighted years where temperatures were considered above normal. Of the respondents, 20% specifically remembered higher temperatures in the 1999 second season, 22% remembered the 2008 second season and 39% remembered the 2009 first season. Farmers also recalled other weather characteristics by season through these specific years (Table 3).
Farmers’ views of memorable years since 1990.
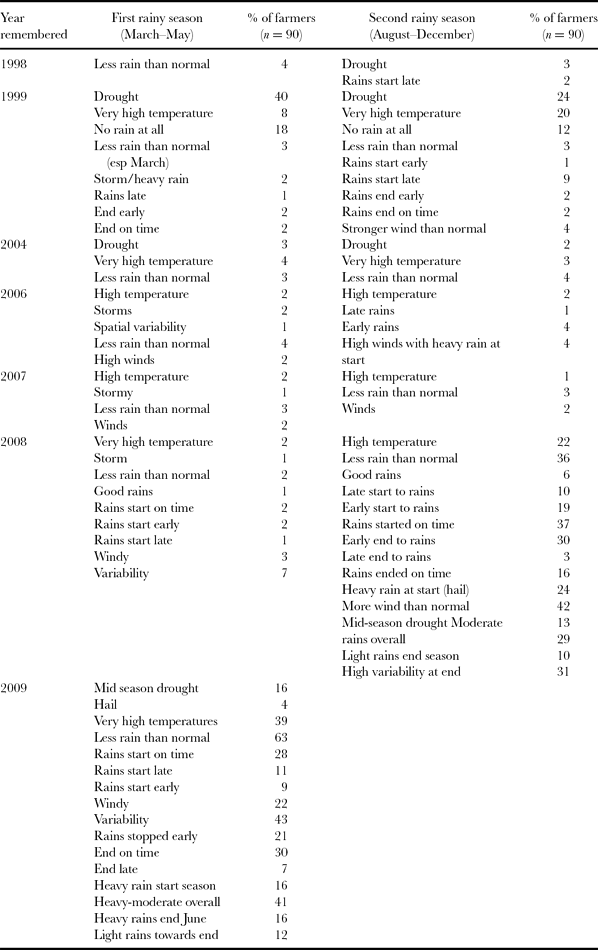
There is generally good agreement between respondents in Table 3, particularly regarding drought or amounts of rainfall. There are however some contradictory views and these are predominantly about when rainy seasons started and ended. For example for the second season in 2008, 10% of respondents stated that rains had started late, 19% that they had started early and 37% that they had started on time. This may indicate that there are different perceptions of when the normal start and end of the rains are, or that start and end dates are less important or memorable than drought. It was also evident when conducting the survey that some farmers had very good memories regarding farming and climate-related events whilst others did not. It is to be expected that within any population there will be considerable variation regarding accuracy of recall.
Table 4 summarizes responses to the question posed to farmers of whether they remember specific years that were different to normal, although the table includes years since 1960 only to enable comparison with available climate data. While farmers’ remembered specific years from the 1940s, these were seasons when a weather-related event was perceived to have had an impact on crop yield, livestock health and food security. For example, drought and crop pests were reported to have caused food insecurity in 1954. In particular, farmers’ reported consecutive problem years where variable rainfall, drought or heavy rain had an impact on their livelihood situation during the following season. For example, heavy rain in 1944 was reported to have destroyed much needed harvest following a drought in 1943, while mid-season dry spells in 1997–1999 and 2008–2009 were reported to have reduced cash crop as well as groundnut and bean harvests. Extreme events had an important position in peoples’ memories when referring to past events, such as political change and war, or a family marriage. In this way, the community had generated a collective rather than an individual memory for some weather-related events, such as a serious drought, that had significance for their collective identity through impact on livelihoods. Furthermore, the actual climate in a specific year was described by people as a deviation from their ideal weather for a successful livelihood, and not necessarily from the most predominant characteristics; farmers were asked for their perceptions of a ‘good’ or ‘normal’ season. As a result, farmers’ perceptions of climate were generally linked to the usefulness of the rain: impact of the rainy season is what farmers valued as important (Quote 1). As the quotes illustrate, perceptions of normal tends to reflect the needs of farmers to provide for their livelihood or improve their yield and any deviation from this is perceived as a problem. Perceptions of this ideal can also vary between different groups of farmers, depending on their livelihood strategy, with for example cash crop farmers idealizing regular moderate rains while those depending on livestock only requiring the rains to support adequate pasture.
Specific years with significant weather characteristic remembered by farmers (note: only includes years remembered after 1960 to correspond to climate data series).

Quote 1. Examples of farmers’ perceptions of normal climate were influenced by their perception of ideal rainfall necessary to service needs.
‘We “need” normal rains with a steady distribution otherwise crop failure means we cannot pay our land rent. . . but even in good years we get a bad price because then there is too much competition at market. Since 1999 there has been a change in the distribution of the rains . . . there is a problem with less rain now in April . . . sometimes there is heavy rain at the start of the second season . . . the temperatures are higher than in the past.’ (N79/15/7/09)
‘In the early 2000s the rain was normal . . . the season was even and the crops grew well.’ (N82/16/7/09)
‘In the past it would rain continuously and it would be adequate for plant growth . . . the pattern is variable but now the first season can sometimes not start until April.’ (N46 29/7/09)
‘The rain in the first season in 2009 started in February but stopped at the time of crop flowering. Although there was some little rain two weeks later, this was heavy and destroyed any surviving crops so we had a lower yield than normal . . . it was a bad season.’ (N15/20/7/09)
‘I remember it was bad in the first season in 2007 because my beans dried . . . the rain germinated the crop but then it stopped before they could develop and by the time there was some more rain it was too late . . . I remember this because I had to sell household items to pay for the land I had hired to grow the beans on.’ (N16/20/7/09)
During the past 20 years, farmers highlighted specific problems of variability in the duration, timings and intensity of the rains, including in winds and heavy rains at the start of the seasons, such as in 2004, 2006, 2007, and 42% commented on wind and 24% on heavy rain at the start of the second season in 2008 (Table 3). Forty percent of the respondents highlighted drought in the first season as an increasing problem. Twenty-four percent reported this for the second season in 1999, while 63% felt there had been a poor first season in 2009, during which, despite a perceived normal start, they felt they had experienced less rain due to a mid-season drought in April. Quote 2 illustrates farmers’ views on a more challenging first season and increasing temperature, whilst suggesting that the second season has remained ‘normally’ variable.
Quote 2. Farmers’ perceptions of changes to the first rainy season.
‘The first seasons are much shorter now than in the past . . . we only have a small amount of land to farm because there is a land shortage and [harvest] is very critical . . . but in April we get no rain . . . a normal year is a good year . . . we would get a full season of moderate rain, evenly spaced and it would not be too hot.’ (N86/17/7/09)
‘The main problem is the unpredictable rains and droughts we get in the first season . . . the distribution of the rains were more reliable in the past but now the first season can even end too early, this is during the last years . . . the second season is normally variable and has not changed . . . temperature has been increasing since 1999.’ (N77/15/7/09)
‘There is no longer rain in February and the temperatures are much higher.’ (N73/20/7/09)
‘We are dependent on the rains for our crops and grazing pastures . . . since 1997 the weather has been different here . . . we get lower rainfall in the first season compared to the past . . . I think that several years of drought were the cause of disease in my coffee plants . . . they were my main source of income.’ (N78/15/7/09)
‘When the first season is bad it affects farmers decisions about what crops they plant in the second season . . . the first season is the problem . . . in 1967, 1983, 1998 to 1999 and again last year [2008] when the first season affected my coffee crop.’ (N41/28/7/09)
‘The first rains fall ok to start with but then after three weeks there is less . . . since 1997 . . . before then we used to get heavy rains that could even kill livestock . . . people forget that the past was also stormy.’ (N84/16/7/09)
‘The rain fluctuates a lot now in April compared to the past . . . the main problem in the last ten years has been with the first season.’ (N48/28/7/09)
‘Before 2005 variability caused a problem, not that there is always less rain in total but since then there has been a reduction in the total amount of rainfall with a shorter first season.’ (N85/ 16/7/09)
‘The first season starts late and ends early . . . it is now March until May . . . I remember the weather because of the impact it had on my coffee and banana crops or when I plant and the seed is lost, like in 2008.’ (N44/28/7/09)
‘In the past there were no markets but we got a harvest in the first season . . . now we get a lower production in the first season and there are better market conditions . . . it is not helpful.’ (N20/18/7/09)
‘The rains in the first season stop mid-way so the yields are too low.’ (N57/31/07/09)
Climate data
The trend in the maximum temperatures shows a clear increase (Figure 1) (the gaps in the data are when months were missing). A linear trend was adequate for the maximum temperatures. The trend appears to be similar each month (i.e. there was no evidence that the trend was seasonally dependent). The slope for the extreme maximum was 3.6 degrees per 100 years, compared to 3.0 for the mean of the maximums and 1.4 for the monthly minimums of the daily maximums.
Change in maximum temperature (on each graph top line: maximum of the maximum; middle line: mean of the maximum; bottom line: minimum of the maximum).

The model for the minimum temperature was more complicated (Figure 2). There has been an increasing trend since about 1980 but the pattern before then is less clear. As with the maximum temperatures, there was no evidence of an interaction between the trend and the time of the year. The temperature scales in Figures 1 and 2 are the same, and show that the differences in night-time temperatures (i.e. the minimums) within a month are smaller than those between the maximum temperatures.
Change in minimum temperature (on each graph top line: maximum of the minimum; middle line: mean of the minimum; bottom line: minimum of the minimum).

Initial analysis of the rainfall data did not show the types of change in the pattern of rainfall that users reported. Monthly rainfall totals and number of rainy days in a month showed no consistent pattern (Figure 3). The graph in Figure 3 of the number of rainy days shows a cubic curve that was different for each month. The bimodal pattern through the year is shown clearly, with an average of about 12 rainy days per month in March and April and again in September to November. There is perhaps an indication of a small drop in the number of rainy days in April and November.
Change in number of rainy days per month.

Initial analysis of dry spells does not indicate any particular trend within years (Figure 4 shows the length of the longest dry spell in each month). The bimodal nature of the year is again evident, with April, October and November having no long dry spells.
Change in length of longest dry spell in each month.
Further analyses of the pattern of rainfall within the seasons were performed to understand the characteristics that correspond to events of direct interest to farmers. In Figures 5 and 6 we present the analyses for the start of the rainy season for both seasons at Mbarara under the two scenarios described earlier, namely (i) the date by which more than 20 mm fell in a three-day period and (ii) the same scenario but with the caveat that planting should not be followed by more than a seven-day dry spell within the following 30 days (vertical lines). Where there is no vertical line, the dates are the same. The results indicate the great uncertainty associated with rainfed farming in Mbarara district. Planting dates range from mid-February to the end of March (Figure 5) and mid-September to the end of October (Figure 6). Furthermore, planting on the dates identified by the first scenario was followed by a dry spell of more than seven days in 35% of the years in the first season.
The pattern of dates for the start of planting in the first season. See text for explanation.

The pattern of dates for the start of planting in the second season. See text for explanation.
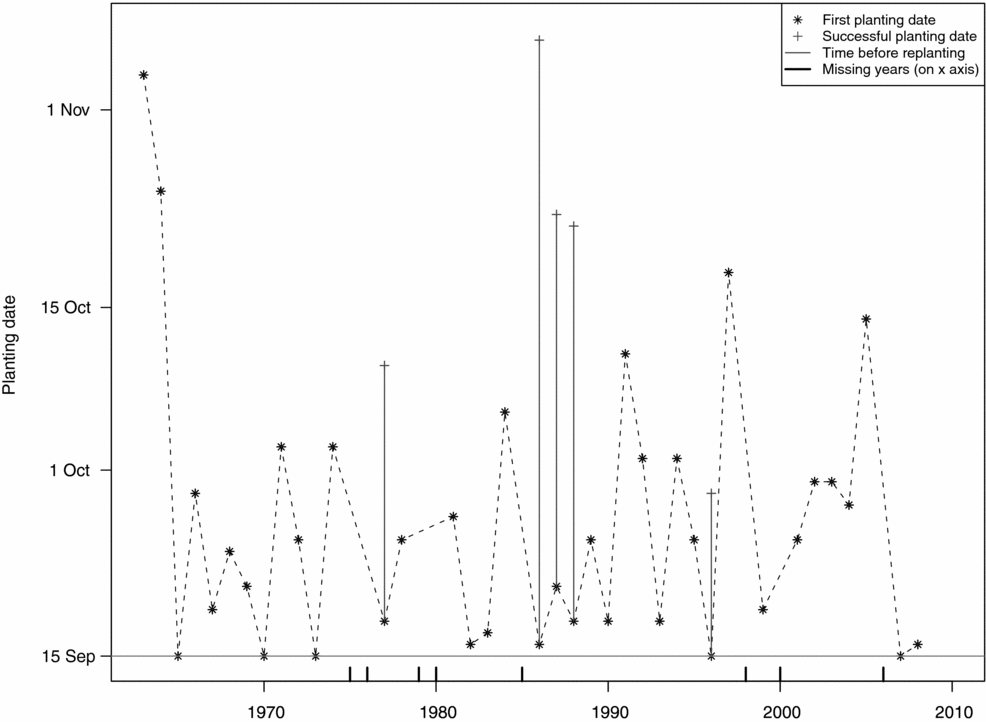
For the second season, the same definition was applied from the 15 September (Figure 6). The risk of a dry spell exceeding seven days during the 30 days after first planting is much less for the second season at 13% (or one year in eight). Neither Figures 5 nor 6 showed any obvious indication of trends in the date of the start of rainy seasons.
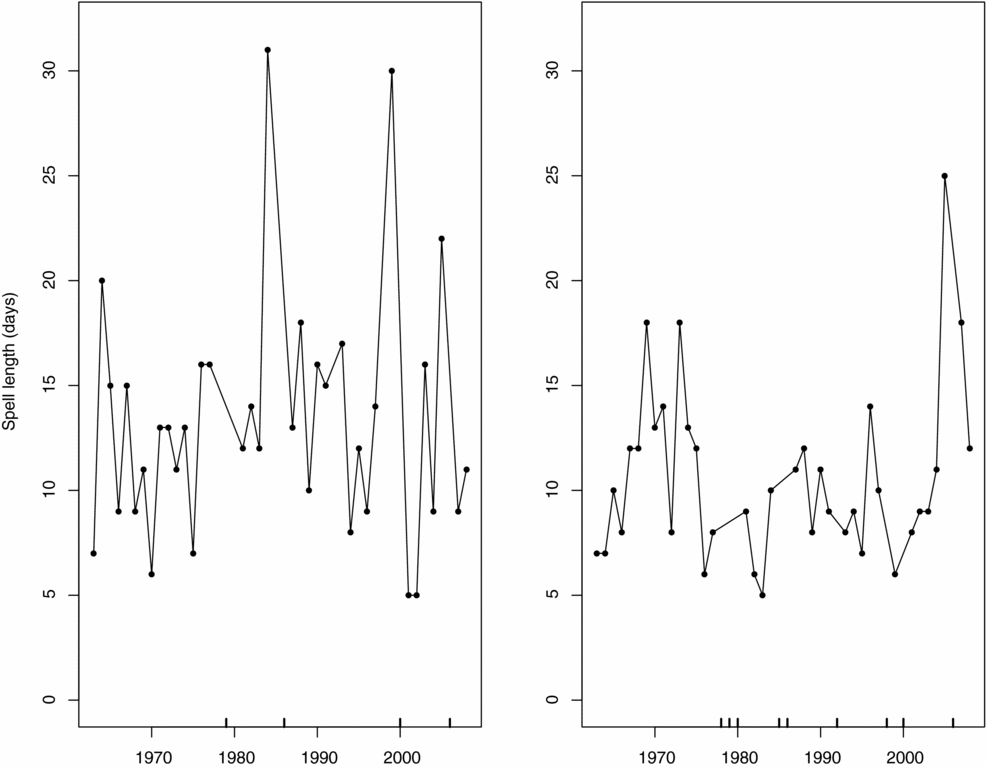
We also sought to establish if there had been a change in the length of dry spells within either season. Figure 7a shows the longest dry spells in the first season (March to May) and Figure 7b shows the second season (October to December). The second season is slightly more reliable in terms of rainfall distribution. For the first season the median length was 13 days and for the second season it was 10 days. The proportion of years where there was a dry spell greater than 15 days was 33% for the first season and 10% for the second season. These measures help to quantify how much more reliable the second season is compared to the first. In studies where multiple stations are used, these same indicators can compare the reliability at different sites. The graph highlights a drought spell in the first season in 1984 and 1999 and problems in both seasons in 2005.
Dry spells in (a) first season and (b) second season.
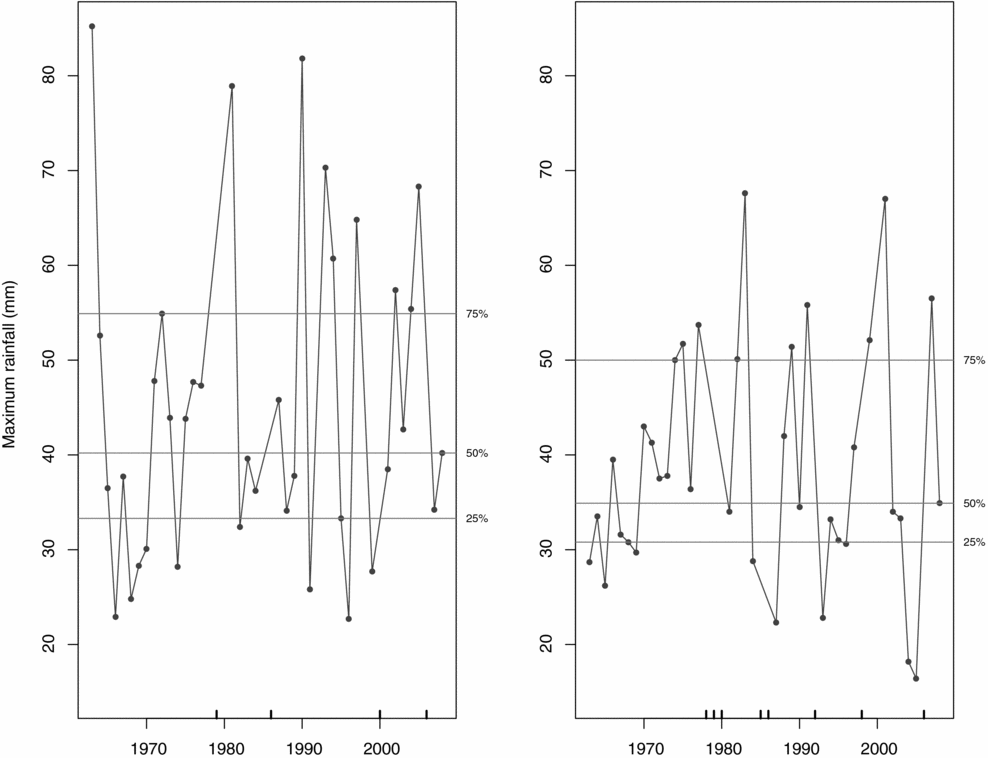
Rainfall extremes in the season are also important, and farmers are often concerned that the pattern of rainfall has become more ‘extreme’. We examined the largest rainfall in the same two rainy seasons to assess whether there was any evidence of a trend. We find there to be no evidence of a trend in either season. Figure 8 also shows the 25%, median and 75% points. The results were similar for the two seasons.
Rainfall extremes (the largest rainfall) for (a) first season and (b) second season.
The lack of evidence for climate change may be due to the large variability of the rainfall data or because there is no evidence. The results from fitting a Markov chain-type model to the daily rainfall data are shown in Figure 9. Figure 9a shows the chance of rain through the year and the bimodal nature of rainfall is again clear. The bottom curve gives the probability of rain after a dry spell of two or more days. This rises to about one rain day in three in mid-April, drops to almost zero in June and rises to about 0.45 in October. The middle curve gives the chance of rain after a single dry day but with rain two days previously. A single curve is sufficient when the previous day had rain and the top curve in Figure 9a is the chance of rain given rain, i.e. the chance that a rain spell continues for a further day. The persistence in rain on consecutive days is indicated by the extent to which the three curves are different, which is least marked in the second rainy season. A gamma distribution was fitted to the rainfall amounts, with a mean that may depend on the time of year. Figure 9b plots the mean rain on a rainy day. In December and January this is about 7 mm, rising to about 8.5 mm in April and almost 10 mm in October.
(a) Probability of rain (b) mean rain per day (mm).

The main aim of fitting these models was to investigate whether adding a time element to any of these curves would provide an improved model. There was no evidence that this was needed for any of the curves for the chance of rain or for the amounts. We conclude that, based on this data, there is no evidence of any change in the pattern of rainfall. This does not preclude that in the future with the benefit of longer records or those from additional stations, evidence for changes in patterns of rainfall may emerge.
DISCUSSION
Differences and similarities between local perceptions and climate data
In Uganda, government, aid organizations and the local people are focused on the impacts of climate change and portray abnormal rainfall and extremes as characteristics of change (GoU, 2007; Oxfam, 2008), despite the evidence apparently not being universal. While this study finds both farmers and the data reporting increasing temperatures, there is limited evidence from this location for significant changes in seasonality or extreme events that farmers report. It will be necessary to extend analyses using multiple stations across Uganda in order to investigate this further and to determine how much spatial variability exists, and therefore how close to meteorological recording stations study sites need to be. However, there are subtle patterns that do support some of the farmers’ perceptions. For example, the risk of increased mid-season drought observed in the first season by farmers was also suggested within the climate data, where the first season was found to have a less reliable distribution than the second season and the persistence of rain on consecutive days now more likely in the second season. However, overall there is a mismatch between the strength of opinion and evidence in the climate record and there may be several reasons for this. Scientific ‘truths’ of global climate change may have turned into myths about environmental change at the local level; the repeating of extension officer views about climate change is often referred to as expatriate narrative (Leach and Mearns, Reference Leach and Mearns1996; Roe, Reference Roe1999). Such arguments can construct a story based on a causal chance of events and need to be recognized.
It may be that the farmers’ perceptions of an overall rainfall decline, despite there being no evidence in the climate data, is the impact of increasing temperature. Temperature increases will result in higher evapotranspiration and greater demand on available water, faster development of water stress during dry spells, increased severity of pests and diseases but also changes to nutrient availability with faster rates of crop development and vegetation cover, all of which affect farmers’ production. This is not to negate the real and experienced negative impacts of poor soil moisture on crops during susceptible germinating and flowering periods. Quote 3 illustrates that farmers were reporting links in causality between rainfall and soil moisture and groundwater recharge, while acknowledging that there might be other factors exacerbating soil water retention, such as deforestation and land use change or increased demand on wells.
Quote 3. Farmers’ statements indicating causality of rainfall or associations of temperature and land use change
‘There is inadequate water . . . this means we have a low income . . . a problem when there are several years of drought such during the 1997 first season when a drought lasted until August in 1999 . . . we need a moderate intensity of rain to make the soil moist.’ (N39/28/7/09)
‘There is now not enough rain in each event to moisten the soil . . . land recovers from drought but it is more damaging in the long term to correct its impacts . . . the rain is unpredictable in March.’ (N81/16/7/09)
‘Now farmers are having to use the swampy areas as fields [partly due to land pressure] but in a dry year even the wells are drying up due to inadequate rains [impact on groundwater] so we have changed to resistant cassava and beans with soil and water conservation methods.’ (N54/30/07/09)
‘There is more drought which leads to the drying of wells, which was not the case before.’ [assumed causality of weather but increased land pressures, population and cattle using wells] (N59/31/7/09)
‘The big lands are used mainly for farming trees now and these are cut down so rains are no longer attracted.’ [perception that it rains in areas with trees but may reflect the impact of deforestation on runoff and less water stored in soils on hills] (N27/29/7/09)
Certainly some views suggest that farmers were indeed associating causality with climate despite historical change in the region (Quote 4). It may be because their perceived need for water has changed over time, which has increased demands on the rains, which are naturally highly variable. For example, as a result of increased population in the area with new settlers, there are higher food requirements and demands being made of the soil but inputs and farm size have remained low and poor quality marginal lands are being extended into. Similar inferences have been made by Thomas et al. (Reference Thomas, Twyman, Osbahr and Adger2007) in southern Africa. The dependence on the seasonal rains to meet a household demand for food means any negative rainfall anomaly in either season will have implications on expected food supply – the climate data results section above highlighted the importance of rainfall and seasonality matching perceived ideals.
Quote 4. Farmers’ perceptions associating causality with rainfall and ignoring broad factors
‘The pattern [of rain] has changed since 1989 because before then I had bigger harvests.’ [causality to climate despite low input and small farm] (N18/20/7/09)
‘The weather has changed because there is a food crisis [causality] . . . I have to store millet and cassava flour and sell livestock, or even move to another area and I cannot send my children to school . . . the variety of beans are too slow for the rains.’ (N23/28/7/09)
‘The weather has changed since 1999 because the coffee and banana yields are lower.’ [linked to weather, or to diseases and poor soil?] (N11/17/07/09)
In general, farmers tend to remember extreme weather events better than they are able to distinguish slow climate trends, a natural reflection of human perception and memory. In general, there was correlation between farmers’ memory and extreme years, although farmers did not recall all the years evident in the climate record. Examples of correlation include the poor rains reported in the first season in 1980 with a high number of dry spells found in the climate data, short heavy rains in the late 1990s and extremes in daily rainfall, and the drought reported in 1999 with long dry spells during the rainy seasons. Often farmers recalled problems in seasons immediately following a problem season indicated in the climate data, such as in 2006 after 2005, or 1985 after 1984. This suggests that although in most cases weather events were considered as the causal factor, they are interrelated with other factors. More explicitly, it may be production that farmers recall, rather than the climate. This may explain why not many farmers recalled the first season in 1984, or both seasons in 2005, as problematic despite Figure 7 indicating dry spells; if the timing of the dry spells did not have a significant impact on the harvest for this community then farmers did not consider these dry spells as especially significant. Meze-Hausken (Reference Meze-Hausken2004) found similar differences in Ethiopia. It is reasonable to assume that any year where production drops below a threshold for a household will be consider as a drought year. The cause of poor performance may not necessarily be linked to rainfall and can include other factors as already discussed, such as difficult economic circumstances for the household.
Thus it is the impact on livelihood that is important, rather than the cause, in defining drought from the viewpoint of local people. Although this perception comes close to the concept of ‘agricultural drought’, which includes the conditions of meteorological drought, evapo-transpiration, soil-water deficiency during different stages of crop growth and water reduction in groundwater reservoirs, it does not include market, political and institutional failure, which can lead to poor economic performance of a household. The climate data shows rainfall variability to be a normal characteristic for this area; however, it appears that farmers had a perception about the most useful pattern for crop and pasture production (timing, duration, intensity, amount, spatiality) and if the pattern deviated too much from this then they felt it was not a normal year (i.e. their desired situation with respect to harvest and economic outcome), even if the meteorological data does not find a significant change (Agnew and Chappell, Reference Agnew and Chappell1999). Perceptions, such as a change in seasonality or increased variability, are not wrong because they are social constructs (Stehr, Reference Stehr1997; Stehr and von Storch, Reference Stehr and Storch1995). However, they may have a statistically low correlation with the underlying meteorological conditions. Drought years can have similar characteristics in terms of intensity, duration or spatiality from a meteorological perspective (i.e. the data suggests no trend) but the impacts experienced over time may be different for farmers due to household vulnerability at that particular moment (i.e. perception may reflect a worsened experience from two similar climate events). For example, while farmers may increasingly expect the first rains to be less useful, the probability of both below normal and much-below normal seasons in the same year is lower and would have more serious consequences for household livelihood situation. Thus farmers perceived 1999 to be worse than 2005 due to a high loss in yield and animals.
Reflection on the methodology and implications for future communication strategies
Seeking to understand farmers’ perceptions of climate risk is an importance part of the process of how to provide relevant meteorological information. It is also important that this small-scale study has highlighted likely reasons why there are similarities and differences between farmers’ perceptions and the evidence from climate data. Perhaps it is not helpful to construct communications about normal rainfall in regions that experience high intra- and inter-annual variability. Normal has different constructs for science and local knowledge and can be used to incorrectly reinforce associated causality. Successful resource management in high variability regions is often characterized by high levels of diversity, flexibility and adaptability (Mortimore and Adams, Reference Mortimore and Adams1999; Osbahr et al., Reference Osbahr, Twyman, Adger and Thomas2010). There may be limits to adaptation by poor smallholder farmers and the consequences of rising temperatures, drought or other extreme weather events will have serious livelihood consequences.
Regardless of whether there is meteorological evidence, the experience is real for farmers (for possible reasons described above). Information needs to be provided to farmers in such a way, and in such a format, that they can usefully use it to plan their options for the forthcoming season and long-term investment strategies, options that should enhance diversity, flexibility and adaptability. While farmers felt that daily forecasts were useful, they expressed a desire for seasonal forecasts which they thought would be more useful. It is important that the Ugandan Meteorological Services value local judgement, acknowledging that there will be differences but when farmers’ perceptions do not always reflect the evidence in the climate data it does not mean that they are ‘wrong’. Ultimately, by developing tools for farmers that have the capacity to factor in engagement from rural communities, they are more meaningful to users. Support needs to enhance livelihood flexibility in farming practice. While greater support for soil-water conservation techniques and choices of resilient varieties are vital, extension services should be careful about over-emphasizing the importance of strategies during drought, as there is a danger that normal variability will become perceived as emergencies.
CONCLUSIONS
This paper has used a case study from southwest Uganda to present the similarities and differences between farmers’ perceptions of climate trends and variability and the climate data. Understanding how farmers judge climate risk is valuable to both Extension and Meteorological Services in improving farmer support to better manage climate uncertainty. The paper found that while farmers perceived change in seasonality, distribution, amount, intensity and temperature, only temperature had a clear signal in the climate record. The climate record did agree to a lesser extent with farmers’ views that the first rainy season, between March and May, had become more variable and less reliable than the second season, between September and December.
We suggest a number of reasons for these differences. Causality of climate is easier for farmers to associate although complex social, political, economic and environmental changes have interrelated impacts on production. Farmers’ perceptions about climate represent a combination of various environmental aspects. Some of these perceptions are derived from people's actual rainfall needs and are judged against them; normal variability to farmers reflects needs for desired production. For example, perceptions that there has been declining rainfall may be the impact of higher temperature, higher evapotranspiration and greater water stress. Weather events that had a livelihood impact, especially during consecutive seasons, were remembered as important rather than weather events as disaggregated from impact. The implication is that analysis of subjective observations about weather and climate requires deeper investigation of the socio-economic, cultural and environmental conditions experienced by the affected people and the ways this influences decision-making to cope with uncertainty, agricultural innovation and livelihood adaptability. Tools to support farmers to use climate information to increase productivity and minimize risk will need to recognize these issues. Given the complexity of factors, this will challenge predictions about potential impacts of climate change in the region, as they are experienced in different ways by different groups, partly as a result of diverse needs and partly because of diverse vulnerability.
Acknowledgements
This research was co-funded by ASACERA (Association for Strengthening Agricultural Research in Eastern and Central Africa) and the Walker Institute for Climate Systems Research at the University of Reading. We are grateful to the Uganda Meteorological Department (UMD) (Dr Stephen Magazi and Fortunata Lubega), and the Ugandan National Agricultural Research Organisation (NARO) in Kampala (Dr Everline Komutunga and Dr Drake Mubiru) and in Mbarara (Dr Steven Byenkya and Dr Robert Muzira). Support was provided by four Research Assistants, Marjorie Kyomugisha (NARO), Harriet Nankya and Andrew Ssali (UMD) and Medard Twinamatsiko (Department of Development Studies, Mbarara University). Our thanks also go to Charles Muchunguzi and community facilitators in Nyanja.


 Open access

