

The idea that leaders matter has a history stretching back to Machiavelli (recent reviews of this rich literature may be found in Ahlquist and Levi Reference Ahlquist and Levi.2011; Blondel and Müller-Rommel Reference Blondel, Müller-Rommel, Dalton and Klingemann2007; Borchert and Zeiss Reference Borchert and Zeiss2004; Burden Reference Burden2007; Hargrove Reference Hargrove2004). Yet while impressive in theoretical scope and ambition, the voluminous research on elites is empirically constrained. Most studies are focused on a single country or a small set of neighboring countries. Some studies approach the topic through a single organization (Selznick Reference Selznick1957), local communities (Chattopadhyay and Duflo Reference Chattopadhyay and Duflo2004), or small-group settings (Humphreys, Masters, and Sandbu Reference Humphreys, Masters and Sandbu2006) within a single country. A few studies incorporate leaders throughout the world but limit their attention to top executives (Jones and Olken Reference Jones and Olken2005).
In this article, we introduce findings from a new dataset that promises to expand the frontiers of research on political elites. The Global Leadership Project (GLP) is the first dataset to offer biographical information on leaders throughout the world—including members of the executive, the legislature, the judiciary, and other elites whose power is of an informal nature. With this data, one can compare the characteristics of leaders across countries and across regions. One can also compare the characteristics of leaders within countries, e.g., across different offices, political parties, and so forth. As such, the GLP promises to serve as a fundamental resource for researchers, policymakers, and citizens.
Information pertaining to data collection and coding for the GLP are contained in online appendices A–C. In the text, we focus on the substantive content of the project, the global leadership class as seen through their biographical characteristics. We begin, in the first section, by briefly reviewing extant datasets focused on global elites, which we compare and contrast with the GLP. We offer next a composite portrait of the global elite in tabular form. We then incorporate a larger set of variables into a latent class model to arrive at an empirical typology of political leaders around the world. In the final section, we elaborate how the GLP expands current knowledge about political elites.
To whet the reader’s appetite, here are a few of the findings presented in the following pages. We find that 81% of political elites overall are male while 92% of elites at the apex (the top one or two decisionmakers) are male. We find that 37% of the global elite are fluent in English—well above the totals for any other language. We find that the average age of political elites at-large is 55, while those at the apex or on supreme courts are older (averaging 61 in both cases)—a fact of possible importance in light of the possible role of age and generations in political decision making (Jennings and Niemi Reference Jennings and Niemi1981). We find that elites have served, on average, a little over five years in their current position while those at the apex have served about seven years. We find that nearly fifty percent of political elites—and nearly three-fifths of top leaders—are educated in the west, a striking example of soft power (Nye Reference Nye2004), one might suppose. We find that only 2% of political elites have blue-collar occupational backgrounds, and that outside Europe the share is even lower—a striking confirmation of class bias in the global elite. We find that 12% of elites previously worked as teachers or professors—perhaps a sign of the influence of the educational sector in government policymaking. We find that the pay of parliamentarians, as a share of per capita GDP, is five times higher in the developing world than in the developed world—a disparity that may help to explain differences in political representation in rich and poor countries.
Some of these findings may confirm the reader’s priors. Others may overturn those priors. And some topics are so little studied that the reader may have no strong priors at all. In any case, readers should appreciate the importance of having relatively precise estimates of these important quantities.
Background
The study of political leaders—a.k.a. elites, the political class, or leadership (terms we use interchangeably)—is one of the venerable topics in political science. Yet, it is also one of the least empirically developed, as suggested in our short review of the literature. While individual-level data is taken for granted in studying mass political behavior (as registered in cross-national polls such as the World Values Survey and various “Barometer” surveys), the behavior of governments is still approached primarily at a system-level (the state) or at the level of component organizations (the executive, the legislature, the judiciary, an agency, political parties, and so forth). There is no centralized dataset for political elites.
Recently, several crossnational projects have begun to address this longstanding data deficit. Information about heads of state around the world is compiled in the Archigos dataset (Goemans, Gleditsch, and Chiozza Reference Goemans, Gleditsch and Chiozza2009), with additional coding on the background characteristics of leaders provided by the Leader Experience and Attribute Descriptions (LEAD) project (Horowitz, Stam and Ellis Reference Horowitz, Stam and Ellis2014). Web sites like Rulers.org and Worldstatesmen.org encode information about top leaders in HTML text. Chiefs of State and Cabinet Members of Foreign Governments (Central Intelligence Agency [various years]) includes heads of state and cabinet members for the past several years. The Heads of Government dataset codes ideological orientation for each leader from 1870–2012 for thirty-three countries (Brambor, Lindvall, and Stjernquist Reference Brambor, Lindvall and Stjernquist2013). Alexiadou constructs a database of cabinet ministers across eighteen OECD democracies, observed from 1945–2010 (Alexiadou Reference Alexiadou2016). Faccio compiles a list of legislator names in forty-six (mostly OECD) countries (Faccio Reference Faccio2006, Reference Faccio2010). Braun and Raddatz collect data on the political background of cabinet members and central bank directors (but not MPs) for 150 countries (Braun and Raddatz Reference Braun and Raddatz2010). Nelson collects educational and limited professional background data for key economic policymakers in ninety developing countries between 1980 and 2000 (Nelson Reference Nelson2014).
Most crossnational projects are limited to heads-of-state—or, at best, heads of state and cabinet ministers—and thus offer thin gruel for generalizing about the leadership class. Note that even in highly authoritarian countries major decisions generally involve input from multiple people. Note also that in reducing the leadership class to a single individual, or a small group, data becomes “lumpy.” Viewed through its chief executive, India moves from a male-dominated polity (1947–1966), to a female-dominated party during Indira Gandhi’s two spells as prime minister (1966–1977, 1980–1984), and back to a male-dominated polity (1985–present). Countries with no female head of government like the United States appear to be male-dominated through their entire history (despite growing female representation in Congress). Evidently, there is only so much one can say about the nature of a country’s political leadership on the basis of one or several individuals.
A much broader leadership class is represented in legislatures, and with that notion in mind, background information on legislators has been collected in a systematic fashion for a handful of western democracies as part of the EurElite and SEDEPE projects (The EurElite project, including Datacube, is described in Best and Edinger (Reference Best and Edinger2005). The Selection and Deselection of Political Elites (SEDEPE) project is described in Dowding and Dumont (Reference Dowding and Dumont2009) and at www.sedepe.net). This has fostered an impressive research agenda focused on ministers, parliamentarians, and questions related to recruitment, usually with a historical angle (Borchert and Zeiss Reference Borchert and Zeiss2004). Unfortunately, data on legislators is limited to several dimensions (in accordance with the theoretical scope of these studies) and its format is not always standardized across surveys, limiting possibilities for cross-country comparison. None of these projects extend to the developing world. (Several features of SEDEPE are integrated into GLP so as to maintain commensurability across coding categories. However, the range of data collected by GLP is much greater than SEDEPE, so there is relatively little overlap between the two projects.)
Systematic information about legislators for a much larger universe is collected in the Inter-Parliamentary Union (IPU) database, PARLINE (www.ipu.org/parline-e/parlinesearch.asp). This includes the number of members in a parliament, the distribution of seats among political parties, and the distribution of seats according to sex. Building on PARLINE, Reynolds and Ruedin gather additional data on ethnic and gay/lesbian representation (see Reynolds Reference Reynolds2011; Ruedin Reference Ruedin2009). However, like PARLINE, these databases aggregate data at national levels, preventing a more fine-grained analysis. For example, one cannot examine the intersection of class, ethnicity, gender, and position.
In table 1, we record several features of these datasets—the types of leaders; the number of leader characteristics that are tracked; whether individual-level data is preserved; how many countries, leaders, and years are included; the format (dataset or static HTML); and whether the data is freely available. To facilitate comparison, we list the GLP in the bottom row.
Crossnational datasets of political elites

Crossnational data projects focused on political elites. Top leader = generally understood as the most important decisionmaker in a country, i.e., the head of state, head of government, or effective leader. Characteristics = background characteristics about leaders that are tracked in the project, e.g., age, sex, languages spoken. ? = unclear. * = individual-level data is stored in separate national datasets.
Currently, the GLP encompasses 145 sovereign and semi-sovereign nation-states and 38,085 leaders, each of whom is coded along 31 dimensions, producing approximately 1.1 million data points. Relative to extant projects, the GLP offers comparable breadth (including most sizeable countries in the world) and much greater depth since it covers a great variety of leader types (the apex, the next ten, the executive, cabinet members, executive staff, party leaders, assembly leaders, supreme court justices, members of parliament, unelected persons) and a large number of background characteristics, all of which are collected at the individual level and preserved in a dataset format. The main shortcoming of the GLP is its limited temporal coverage. Surveys for the first round of data collection were completed for each country at some point between 2010 and 2013. (A second round of data collection, just completed, will add a new snapshot of the world centering on 2017–2018, including some additional countries.)
We will probably never be able to recover the biographical characteristics of backbenchers and jurists who served in countries around the world over the past two hundred years. Nonetheless, going forward, it should be possible to present a much more nuanced picture of the leadership class and to do so in a more or less comprehensive fashion as data for more and more countries goes online and as data-scrapers become more sophisticated. The GLP offers a first step in this direction, and also an indication for how a deeper, more nuanced view of leadership might alter our view of this venerable topic.
Leader Attributes in Tabular Format
What can the data contained in the GLP tell us about the set of leaders who (as the phrase goes) rule the world? In this section, we present data in a tabular format showing various characteristics of the global political elite—personal attributes, language, education, occupational background, recruitment/circulation, and remuneration—as a first attempt to arrive at a comprehensive portrait.
Before beginning, we must explain several features of the data. The full dataset contains 38,085 political elites from 145 sovereign and semi-sovereign nation-states from the first round of data collection (2010–2013). Data for several additional countries is too incomplete to include in this analysis. Even for these 145 countries, coverage is more complete for some questions than for others, as explained in online appendix A. To address this issue, all analyses presented below are replicated with imputed datasets, as shown in online appendix C. Results are very similar, mitigating concerns about missingness.
Prior to calculating descriptive statistics such as the mean or standard deviation across a sample, we aggregate the data by country. For example, the mean of a sample is derived by calculating the mean for each country (for which there exists sufficient data on that question) and then a mean across a set of countries. M thus refers to a second-order mean, a mean of means. The rationale for aggregating by country prior to calculating a global statistic is that we do not want our results to over-weight countries with large leadership classes such as China. (Even so, a simple pooled analysis usually reveals very similar aggregate results, suggesting that countries with large elites are not so different from countries with small elites.)
In the “Office” section of each table, we generate statistics pertaining to each office type—the apex, i.e., the most powerful one or two elites (a total of 210 individuals in our dataset), the next ten most powerful elites (N=1220), the cabinet (N=3664), the supreme or constitutional court (N=1,032), and the lower or unicameral chamber of parliament (N=31,269). In the “Wealth” section, we compare country averages in the rich world, including current members of the OECD (N=33) and the non-OECD (N=112). In the “Region” section, we look at variation across regions—Africa (N=38), the Americas (N=24), Asia (N=26), Europe (N=41), and the Middle East and North Africa (N=16). Finally, we compare regime types. Countries are defined as democratic if they are categorized as Free or Partly Free by Freedom House in 2012 (N=113), and as autocratic if categorized as Not Free (N=32).
Readers should bear in mind that the following tables represent only a portion of the information contained in the GLP. For each leader, we code 31 dimensions, producing approximately 1.1 million data points. Many of these additional dimensions are included in the empirical typology in the section on expanding the study of political elites. A full questionnaire can be found in online appendix B.
Personal Attributes
The personal attributes of leaders attract great attention from the media and the electorate, and occasionally from scholars (refer to the previously cited work). However, global data is generally limited to top leaders, where they are collected in the LEAD dataset. For the gender of parliamentarians, scholars may consult the PARLINE database, but no dataset allows one to compare the descriptive representation of women across more than one office type.
The GLP provides information on three personal attributes of political leaders—age, sex, and marital status. Because the GLP encompasses a wide variety of leaders we can compare these attributes across positions for the first time. Summary data is illustrated in table 2, which we will now review.
Personal attributes of political elites
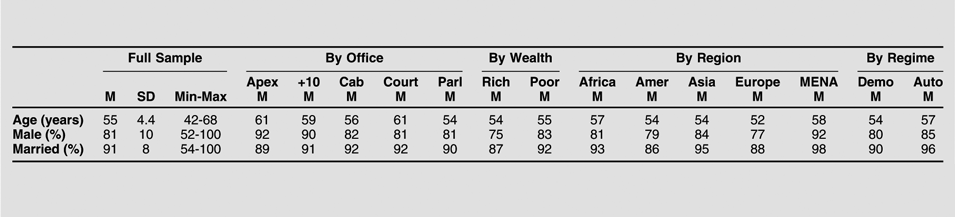
Data pooled at country levels prior to calculating statistics. Countries with a missing data dropped from the analysis. Numbers rounded to the nearest integer except for Languages and Educational attainment. M=mean. SD=standard deviation. Apex=most powerful one or two positions. +10=next ten most powerful. Cab=cabinet. Court=supreme or constitutional court. Parl=lower or unicameral house of parliament. Amer=Americas. MENA=Middle East and North Africa.
Among global leaders the average age is 55, with a fairly tight spread around the mean (standard deviation=4.4), signaling that most political leaders are middle-aged. We find considerable variations between extremes—from a minimum average age of 42 (Ethiopia) to a maximum of 64 (Cambodia). Not surprisingly, leaders at the apex tend to be at the high end of the age distribution. There is relatively little variation across regions, though Africa and MENA have slightly higher average ages, whereas Americas, Asia, and Europe have slightly lower ages. Likewise, there is minimal variation across regime types, though autocracies have a slightly older leadership class.
The global political elite is strongly gendered. Over four-fifths of leaders around the world are male. Gender bias is most marked at the top—that is, the apex and the next ten. Across countries, we find extreme divergence between the lowest male representation (53% in Rwanda and Sweden) and the highest (99% in Yemen). Across regions, the Middle East and North Africa are less hospitable to female leaders than other parts of the world. Some differences are found across the wealth divide, with the developed world less male-dominated than the developing world. Democracies are somewhat less male-dominated than autocracies. No category of offices or countries approaches gender parity.
Nine in ten global leaders are married, with a lowest rate of 65% (Argentina) and a highest rate of 100% (Mongolia, Morocco, Somaliland, and Sudan). We find relatively little variation across offices or across the OECD/non-OECD divide. But we do find significant variation across regions, with Africa, Asia, and MENA having high marriage rates and the Americas and Europe having lower rates. A sizeable marriage gap separates democracies (90%) and autocracies (96%).
Language
Humans are defined, in part, by the languages that they speak. Language also plays an important role in politics by establishing communities, both within countries and globally, and often differentiating elites from the masses they purport to represent (Joseph Reference Joseph2004; Liu Reference Liu2015). Yet despite the salience of language in politics there is no global database marking the linguistic competencies of politicians.
In table 3, we explore the languages spoken by political leaders around the world. The first row counts the total number of languages spoken by leaders, averaged across countries. Our definition considers spoken languages (including one’s mother tongue) and leaves it to country-specific sources to define what a language is, and how to define fluency. (Note that these are claims made by politicians, as stated on their web sites or on parliamentary web sites, so we can expect some degree of exaggeration.)
Languages of political elites

M=mean. SD=standard deviation. Apex=most powerful one or two positions. +10=next ten most powerful. Cab=cabinet. Court=supreme or constitutional court. Parl=lower or unicameral house of parliament. Amer=Americas. MENA=Middle East and North Africa. Numbers rounded to nearest integer except for row 1. Languages (English, French, et al.) are non-exclusive categories.
When data is aggregated by country, the average number of spoken languages across the political classes of the world is 1.9. In nine countries, all elites are reported to be fluent in only one language (that is, no foreign languages are spoken). In one country, Kosovo, leaders are reported to speak an average of 4.5 languages, the highest number in our sample. There is little discernible difference across offices, across the rich/poor divide, or across regime types. However, there are significant regional differences. Multilingualism is considerably more common in Africa, Asia, and Europe than in other regions.
In the second portion of table 3, we analyze usage patterns among the most common “world” languages, understood as those spoken widely beyond several countries. So measured, the following languages are spoken most commonly among political elites, in order of prevalence: English, French, Spanish, Arabic, Russian, German, Portuguese, and Chinese. The final row in the table is a residual category including all other languages, most of which are country-specific.
English, the global leader, is spoken by over one-third of political leaders in a country, on average, and by over one-quarter of our global sample of leaders. We suspect this is an under-estimate, given that some elites may not wish domestic audiences to be aware of their facility in a language tainted by its association with a colonial past and an imperial present. In any case, patterns of stated usage offer strong evidence for the thesis that English now serves as the lingua franca of the global political elite. We note that its prevalence is especially marked among top members of the leadership class. Nearly three-fifths of leaders at the apex are fluent in English, while considerably fewer backbenchers have this facility.
Education
Education is an accomplishment of elites that we expect to surpass that of citizens. Some studies suggest that better educated elites are an indication of higher-quality governance, with positive effects on growth (Besley, Montalvo, and Reynal-Querol Reference Besley, Montalvo and Reynal-Querol2011). Others argue that college-educated leaders are not distinguished in leadership capacity from their less educated peers (Carnes and Lupu Reference Carnes and Lupu2016). Another genre of work explores the institutional sources of elite education. Besley and Reynal-Querol (Reference Besley and Reynal-Querol2011) present evidence suggesting that democracies have more educated. For example, without purporting to review all studies on this topic, we shall simply note that work on these topics is limited in the usual respects—it is either centered on top leaders or is focused on single countries or regions, for there is no global database with information on these matters that extends beyond top leaders.
In table 4, we explore the educational backgrounds of political leaders using data from the GLP. The first row shows the mean level of educational attainment, understood as the highest level of education completed—(1) primary, (2) secondary, (3) higher education (non-university, e.g., technical school), (4) university/college, (5) post-graduate, or (6) PhD. (For present purposes, we treat this ordinal scale as an interval scale.) Although a sizeable gap separates the least educated elite (3.4 in Guinea-Bissau) and the most educated elite (4.9 in Kazakhstan), the standard deviation is small, suggesting that these are extreme outliers. Countries cluster tightly around the mean value of 4.3. Most elites have a university or post-graduate degree, but few possess a doctorate. Even so, there is variation across offices—with jurists being the most educated, followed by cabinet members, and the next ten. It turns out that leaders at the apex are not far removed from backbenchers, suggesting that education does not set these politicians apart from their less accomplished peers. Relatively little variation can be found across rich and poor countries, across regime types (contra Besley and Reynal-Querol Reference Besley and Reynal-Querol2011), or across regions (except for MENA, whose leaders possess higher level of education than leaders in other regions).
Education of political elites

M=mean. SD=standard deviation. Apex=most powerful one or two positions. +10=next ten most powerful. Cab=cabinet. Court=supreme or constitutional court. Parl=lower or unicameral house of parliament. Amer=Americas. MENA=Middle East and North Africa.
The second row presents the share (percent) of leaders who were educated in a foreign country at some point (post-secondary). Globally, about 32% were educated abroad, though the spread between the extremes—Russia (less than 1%) and Cape Verde (94%)—is enormous. We find that top leaders—members of the apex, the next ten, and the cabinet—are much more likely to have had a cosmopolitan educational experience than jurists and backbench MPs. Likewise, leaders of poor countries are much more likely to receive a portion of their education abroad than leaders of rich countries. This makes sense of the disparity across regions, where the lowest level of transnational education occurs in the richest regions (Europe and North America), and may also account for why autocratic elites (who often rule over poor countries) are more likely to be educated abroad than democratic elites.
The third row tracks the share (percent) of leaders who attended an institution of higher education in the west (defined as Europe, North America, Australia, or New Zealand). Though only 17% of the leaders in our sample are in the West, about half of the leaders in our global sample are coded positively for this attribute, suggesting the enormous influence of universities in Europe and European offshoots and offering strong prima facie evidence of the “soft power” (Nye Reference Nye2004) purveyed through western educational institutions.
A western education is more common among members of the apex, the next ten, and cabinet members than among the supreme court and MPs. Differences across the rich/poor divide, across regions, and across regime-types are probably a product of location. Countries within the west are, not surprisingly, far more likely to have leaders educated in the west.
The final section of the table explores elites’ disciplinary backgrounds, defined as the principal course of study in their undergraduate degree. This information is available for 25,190 elites (66% of the total sample), spread across 145 countries. Disciplines are grouped as follows: (1) Agronomy; (2) Engineering; (3) Math, Computer Science; (4) Biology, Chemistry, Physics; (5) Medicine; (6) Economics, Business, Management; (7) Social Sciences; (8) Law; (9) Humanities; (10) Military; and (11) Other (a residual category).
The categories with the largest membership, by far, are law (21% of global leaders) and economics (which, along with related fields, encompasses 22% of global leaders). The remaining social sciences run a distant third place (12%). Given the closeness of these three disciplinary areas, one might argue that a majority of the global political elite share a common disciplinary orientation. This dominance is even greater among top offices. On average, 67% of those occupying the apex of political power, 62% of those occupying the next ten most important positions, 55% of cabinet members, and 96% of supreme court justices are trained in these closely associated disciplines.
Nevertheless, cross-country variation is fairly large, as suggested by standard deviations and the spread between minimum and maximum values. Clearly, there is quite a bit of country-level variation in what elites choose to study (or what they are expected to study) prior to taking up a career in politics. For example, South Korea and Rwanda have the largest percentage of leaders with a social science background and Mongolia (a very poor country) has the highest percentage of leaders with an engineering background. Elites in poor countries (non-OECD) are somewhat less likely to have focused on the triumvirate of law, economics/business/management, and the social sciences than elites in rich countries, and democracies seem to prize the triumvirate more than non-democracies. Poor country elites lean more toward engineering, medicine, and the military. The military, as expected, holds a higher standing in autocracies—though perhaps not as high as one might imagine. Russia has the largest percentage of leaders with a military background, while 45 countries have no leaders at all with a military education.
Occupational Background
The occupational background of leaders is of central importance to questions of descriptive representation. Specifically, scholars (and citizens) wish to know to what extent the social class composition of the political elite departs from the sociological composition of society, and what consequences this might have for public policy (Carnes and Lupu Reference Carnes and Lupu2015; Hayo and Neumeier Reference Hayo and Neumeier2016). The occupational background of leaders may also shed light on leaders’ perspectives on public policy. Conceivably, an elite dominated by lawyers may set different goals than an elite dominated by engineers. Numerous studies have been conducted on the occupational background of leaders—all, perforce, limited to one or several countries, due to the absence of a global data source (with the exception of LEAD, which covers only top leaders).
Table 5 examines this subject on a global level and across a variety of offices. Occupational categories include (1) White collar (including self-employed, interest group, international organization), (2) Blue collar, (3) Education (primary, secondary, university), (4) Media (pundit, journalist, columnist, etc.), (5) Military, and (6) None or politics. The latter are categorized together because of the assumption that someone who has no apparent occupational background but currently occupies a political position is likely to have been pursuing a political career for some time.
Occupational background of political elites

M=mean. SD=standard deviation. Apex=most powerful one or two positions. +10=next ten most powerful. Cab=cabinet. Court=supreme or constitutional court. Parl=lower or unicameral house of parliament. Amer=Americas. MENA=Middle East and North Africa.
We draw attention to the dominance of two categories: white collar (55%) and none/politics (22%), which combine to encompass the occupational background of three-quarters of the sample. Blue collar occupations comprise only 2% of the full sample, and there is relatively little variation across regions (aside from Europe) or regimes. Leaders at the apex and on the high court are even less likely than other leaders to hail from a working class background. Rich countries demonstrate a slightly higher share of blue collar leaders, perhaps an artifact of the power of labor-based political parties in Europe. In any case, blue collar representatives are vastly outnumbered. We may conclude that insofar as politicians’ preferences are affected by their social class backgrounds, representation is heavily biased toward the upper social register.
Only 2% of leaders have a military occupational background. However, leaders at the apex and the top 10 are far more likely to have served in the military (other than as a conscript) than other leaders, so those with a military power are not typical politicians. Autocratic elites lean much more heavily toward the military than democratic elites, as one might expect. Across regions, MENA is the most susceptible to leaders with a military background.
A somewhat surprising feature of our data is the high number of elites with a background in education. Educational backgrounds are especially prevalent among cabinet members. Former teachers and professors are more likely to be found in autocracies and in poor countries; among regions, they are likely to appear in Africa and MENA. Apparently, leaders with educational backgrounds are most likely where educational systems are weakest—perhaps a reflection of the high esteem of education in societies where it remains a scarce resource. In any case, we suspect that influence of former teachers and professors in the political world is a topic worthy of further study.
Recruitment and Circulation
The intertwined issues of elite recruitment and circulation lie at the center of the study of political elites (Cotta and Best Reference Cotta and Best2007; Norris Reference Norris1997; Siavelis and Morgenstern 2008). Where do leaders come from? What sort of political experience do they have prior to attaining their current office? How long do they stay in office? Extant studies focus on countries or regions where data on these subjects is plentiful (often in the OECD), or on top leaders globally (where data may be drawn from Archigos). Consequently, we have no comprehensive assessment of patterns of recruitment and circulation among elites throughout the world.
The first row in table 6 measures leaders’ tenure in office. This is not to be confused with their tenure in politics or in top political positions. It is, quite simply, the length of time they have served in their current position, as classified by the GLP.
Recruitment/circulation of political elites
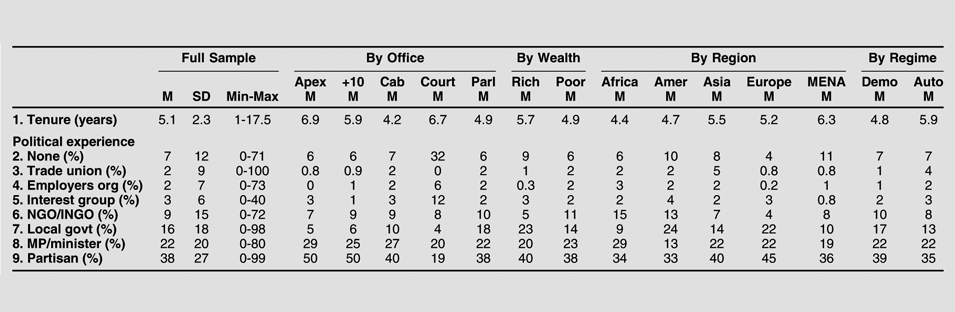
M=mean. SD=standard deviation. Apex=most powerful one or two positions. +10=next ten most powerful. Cab=cabinet. Court=supreme or constitutional court. Parl=lower or unicameral house of parliament. Amer=Americas. MENA=Middle East and North Africa.
Mean tenure in office is just above five years for our global sample, with a standard deviation of 2.3. The lowest country average is about one (Morocco) and the highest about eleven (United Kingdom). Leaders at the apex and on supreme courts enjoy the longest tenure, while cabinet members have the shortest tenure, which is not surprising given that cabinet members serve at the sufferance of their bosses—whose coalitions may be fragile—and may be held accountable for untoward events occurring on their watch. Elites in rich countries register slightly longer tenure than elites in poor countries. Elites in autocracies enjoy slightly longer tenure than elites in democracies. Across regions, elites in MENA enjoy the longest tenure while elites in Africa suffer the shortest periods in office, a fact that may be related to instability or a lack of professionalization among political elites.
The next section of table 6 explores the previous political experience of leaders. Categories are defined as (1) None, (2) Trade union, (3) Employers organization, (4) Interest group, (5) Non-governmental organization (NGO), international non-governmental organization (INGO), or social movement, (6) Local government or municipal office, (7) Previous member of parliament (MP) or minister, and (8) Partisan (political advisor or person active in party youth branch or party organization/administration).
The largest category by far is partisan (38% of the pooled sample), suggesting that many political leaders work their way up through the ranks from party service to national office. A good number also gain entry by way of prior service to local government (16%) or as an MP or minister (22%). Among top offices other than the supreme court, the dominant pattern of recruitment includes MP/minister or other partisan activities. A fair number of top officials have a background in NGO, INGO, or political movement work.
Cross-country variation is extreme, as judged by standard deviations and the range between minimum and maximum values across most of these categories. This suggests that political recruitment operates quite differently across countries. For example, Cambodia is the country with the highest percentage of leaders with prior political experience at the local or municipal government level (67%) while four countries (Namibia, Niger, Singapore, Uzbekistan) have no leaders with such experience. Australia has the highest percentage of leaders with prior experience in trade unions (5%), while in thirty-four countries no leaders (0%) have such experience. Senegal has the highest percentage of leaders with prior experience in NGOs or INGOs (72%), while nine countries have no leaders with NGO or INGO experience.
Differences across the developed and developing world are also marked. For example, local government serves as a platform for higher office to a greater extent in OECD countries (23%, on average) than in the non-OECD (14%), perhaps reflecting the greater prominence of local government in the advanced industrial world.
Remuneration
The remuneration of politicians is a vexed issue everywhere, with the electorate and public officials generally on the opposite sides of the issue (Hood and Peters Reference Hood and Guy Peters1994). Studies have examined whether pay affects performance (Besley Reference Besley2004; Braendle Reference Braendle2015), whether it affects recruitment (Carnes and Hansen Reference Carnes and Hansen2016), and what accounts for varying levels of pay (Mause Reference Mause2014). To date, all studies are single-country or single-region, since these are the only data available.
Unlike other data in the GLP, we collect salaries only for parliament, as the salaries of top executives and members of the top court are less transparent and less readily available. Table 7 presents the salaries of parliamentarians (MPs), expressed in current US dollars (row 1) and as a share of per capita GDP (row 2), across our sample of 145 countries.
Salaries of parliamentarians

Official salaries of members of parliament (MPs) expressed (1) in USD, rounded to the nearest integer, and (2) as a share of per capita GDP. M=mean. SD=standard deviation. Amer=Americas. MENA=Middle East and North Africa.
These statistics reflect official salaries for the lower (or only) house of parliament, and do not reflect non-salary compensation (e.g., pensions, tax benefits, expense reimbursements). It is true that the latter often dwarfs the former. Nonetheless, we expect that formal and informal compensation is correlated. As such, a politician’s official salary offers a useful clue as to their full compensation.
The mean annual salary of MPs in our sample is just over $54,000, with a substantial spread around the mean. In China, Cuba, and Turkmenistan parliamentarians receive no salary at all for what are considered part-time positions; in the United Arab Emirates MPs receive an annual salary of $360,000.
Across the sample, differences across the developed and less developed world are marked, with MPs in the rich countries over twice the salary of their brethren in the developing world. However, when these numbers are considered in light of the domestic economies, the contrast is reversed. Parliamentarians earn three times the per capita GDP in the OECD, while they earn nearly seventeen times the per capita GDP in the developing world.
Cross-regional differences follow this general pattern, with Africa having the lowest salaries but the highest proportional salaries (35 times the per capita income in their countries). We also find a dramatic difference in MP salaries manifested across democracies and non-democracies, though this may be largely accountable to per capita income differences.
The striking finding is that the relative pay of parliamentarians is much higher in the developing world than in the developed world. This may help to explain the lure of government service and the tenacity with which political parties, and their adherents, hold on to office. It may also help to explain the gulf that separates public officials in the poor world from the constituents that they are intended to represent.
An Empirical Typology
While GLP provides a wealth of information about political leaders, the sheer size and variation in the dataset makes it difficult to summarize. Previous tables rely on descriptive statistics and cross-tabulations. Now, we enlist data reduction techniques to construct an empirical typology of political leaders.
This section serves three purposes. First, it provides information about the broad types of politicians—both top-tier leaders and rank-and-file members—that commonly appear in the dataset. Here, we are particularly interested in regional variation. Second, it allows us to ask how similar politicians are to one another. In particular, do politicians exhibit a regular set—or sets—of characteristics, or are they difficult to lump into clearly defined groups? Finally, this exercise provides a face validity test of the dataset, allowing us to ask if leader characteristics cluster in ways that make sense. To preview, we find evidence of six broad groups of politicians, but also find that few leaders fit cleanly into any one category. Top-tier leaders such as ministers and supreme court justices generally exhibit high socio-economic status, are married, and have extensive education, although working-class politicians often hold top positions in Asia. Back-benchers, on the other hand, come in a variety of types. These types are distinguished by notable regional variation the socio-economic backgrounds of the lower-tier leadership class.
Among latent class methods, grade of membership (GoM) models assume that individual subjects—in our case, political leaders—are drawn from a heterogeneous population composed of K underlying latent groups (Woodbury, Clive, and Garson Reference Woodbury, Clive and Garson1978; Clive, Woodbury, and Siegler Reference Clive, Woodbury and Siegler1983; Erosheva Reference Erosheva2002). Unlike traditional latent class models, GoM models allow individuals to hold partial membership in one or more of the distinct types that characterize the population. GoM models thus generate a “soft clustering” of individuals in the sample (Gormley and Murphy Reference Gormley and Murphy2009, 270).
This approach allows us to tease out a small number of underlying ideal-types that effectively describe the patterns of variation in our data without forcing individuals to belong to a single group. We regard this as a flexible tool for producing a data-driven taxonomy of politician types. Because GoM models allow for soft clustering, they also allow us to ask whether politicians tend to fall into clearly defined types. A notable aspect of this estimation strategy is that it is well suited to datasets with missing values, a critical feature for dealing with biographical data. Online appendix D provides a technical description of GoM models and describes our estimation strategy, which builds on work by Erosheva (Reference Erosheva2002).
Resulting GoM models are summarized along two dimensions. First, membership grade parameters summarize the extent to which each individual belongs to a given group, k. Specifically, we represent subject i’s membership profile with a vector of scores, gi = (g i1 . . . ,g ik), where 0 ≤ g ik ≤ 1 and the sum of each vector gi equals one. Second, for each categorical item j, with l = 1, . . . . Lj categories, the parameter p jkl = P(x ij=l | g ik = 1) describes the probability that a randomly selected full member of group k will exhibit category l on item j. This parameter tells us how common a particular characteristic is for members of a given group. We can use these parameters to compute other quantities such as the posterior probability that a randomly selected leader belongs to group k, given knowledge of one or more traits, P(g i=k|xi). That is, we can ask how likely a person is to be classified into a group, if we know just one thing about that person. This is a useful way to think about the characteristics that distinguish types of politicians from one another.
Here, we adopt an empirically driven procedure for model selection. First, we fit a series of models including virtually all of the variables in the GLP dataset. We exclude only those categories that capture a miniscule percentage of the sample such as ethnic groups (which by definition are country-specific) and rare languages (spoken in a single country or a few countries). For simplicity, we transform ordinal and interval variables into binary variables, imposing arbitrary cutoffs for interval variables such as age.
With these dummy variables, we fit a series of GoM models to the data in order to determine the best fit, using the deviance information criterion (DIC), a measure of model fit, to determine the number of types that best characterize the dataset (Spiegelhalter et al. Reference Spiegelhalter, Best, Carlin and van der Linde2002). While a seven-group model described the data best, we found the extent of data reduction insufficient to aid in effective interpretation; in other words, a model based on so many variables remained highly complex. We therefore reduced the number of variables in the model, keeping only those that provided significant leverage in model fit. Specifically, given a fitted model, one can ask how much added information knowing a politician’s membership profile (each gi) provides about her individual traits. For example, if we know that 81% of world leaders are men, we can make the modal guess that any randomly selected leader will be a man and that guess will be correct 81% of the time. But after fitting the model, we can use group assignment to improve the accuracy of our guess. For example, say we know that a randomly selected leader exhibits full membership in a single model-generated group and that only 2% of the members of that group are men. In this situation, our knowledge of group classification greatly improves our ability to guess the leader’s gender.
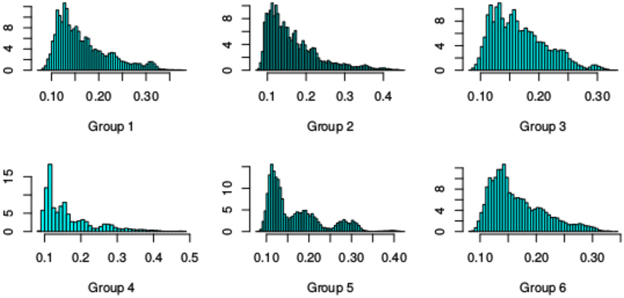
We therefore fit a second series of models including only those variables that improved predictive accuracy over modal guessing by at least 10%, again using the DIC to select the best fit. This results in a six-category model, displayed in the following figures and table. The reduced model includes information about age, education, gender, marital status, office, and socio-economic status. It also includes an indicator for region—Africa, Americas, Asia, Europe, or MENA—to provide insight into how political types might cluster across geographic space.
Figure 1 provides group membership distributions—the distribution of g ik parameters—for each of the K=6 groups in this reduced model. These histograms reveal that the political leaders in our dataset do not divide cleanly into latent classes (groups). Indeed, the modal membership in each group hovers just above 0.1, and g ik parameters rarely exceed 0.3, indicating that many politicians exhibit partial membership in multiple groups. In other words, most political leaders represent a mixture of archetypes and it is difficult to assign leaders neatly to specific categories. Nonetheless, the six groups that the model identifies highlight sets of attributes that tend to cluster within individuals. Note that the GoM approach is particularly useful in this context, as a strict assignment of politicians to fixed groups would fit the data poorly.
Group membership distributions
Overall, the model exhibits high in-sample classification accuracy. Given the vector of group membership scores gi for a given leader, one can predict a particular trait with 70% accuracy, on average. The model fits the data quite well. Of course, some traits are easier to predict than others: at the upper end of the scale the model accurately predicts whether a leader is married 91% of the time, but correctly classifies age with only 47% accuracy. Across all variables the model provides an 11% improvement over modal guessing, but this result is driven down by the fact that some characteristics—particularly office, gender, and marital status—are well predicted by the sample mode (leaderships are small and most politicians are married men). Across traits for which no one value characterizes more than 70% of the population, the average improvement in predictive accuracy jumps to around 20%. For example, guessing the mode would accurately predict socioeconomic status around 56% of the time, but the model predicts around 78% of cases correctly. Similarly, a modal guess would predict a randomly selected politician’s region correctly with a probability of 0.28, but the model-assisted guess would be right 58% of the time, reflecting strong regional variation in how types cluster together.
Figure 2 presents the p jkl parameter estimates from the model. Each column represents one of the six latent groups while each row corresponds to a leader attribute. For example, the bottom eight rows describe the probabilities of holding given offices, conditional on group membership. Each cell in the figure represents the probability from zero (white) to one (black) that a representative full member of the given group, chosen at random, would exhibit the attribute on the row, that is P(x ij=l | g ik = k).
Trait probabilities by class
Shading indicates the probability that a politician will exhibit each listed characteristic, conditional on full group membership, ranging from 0 (white) to 1 (black)
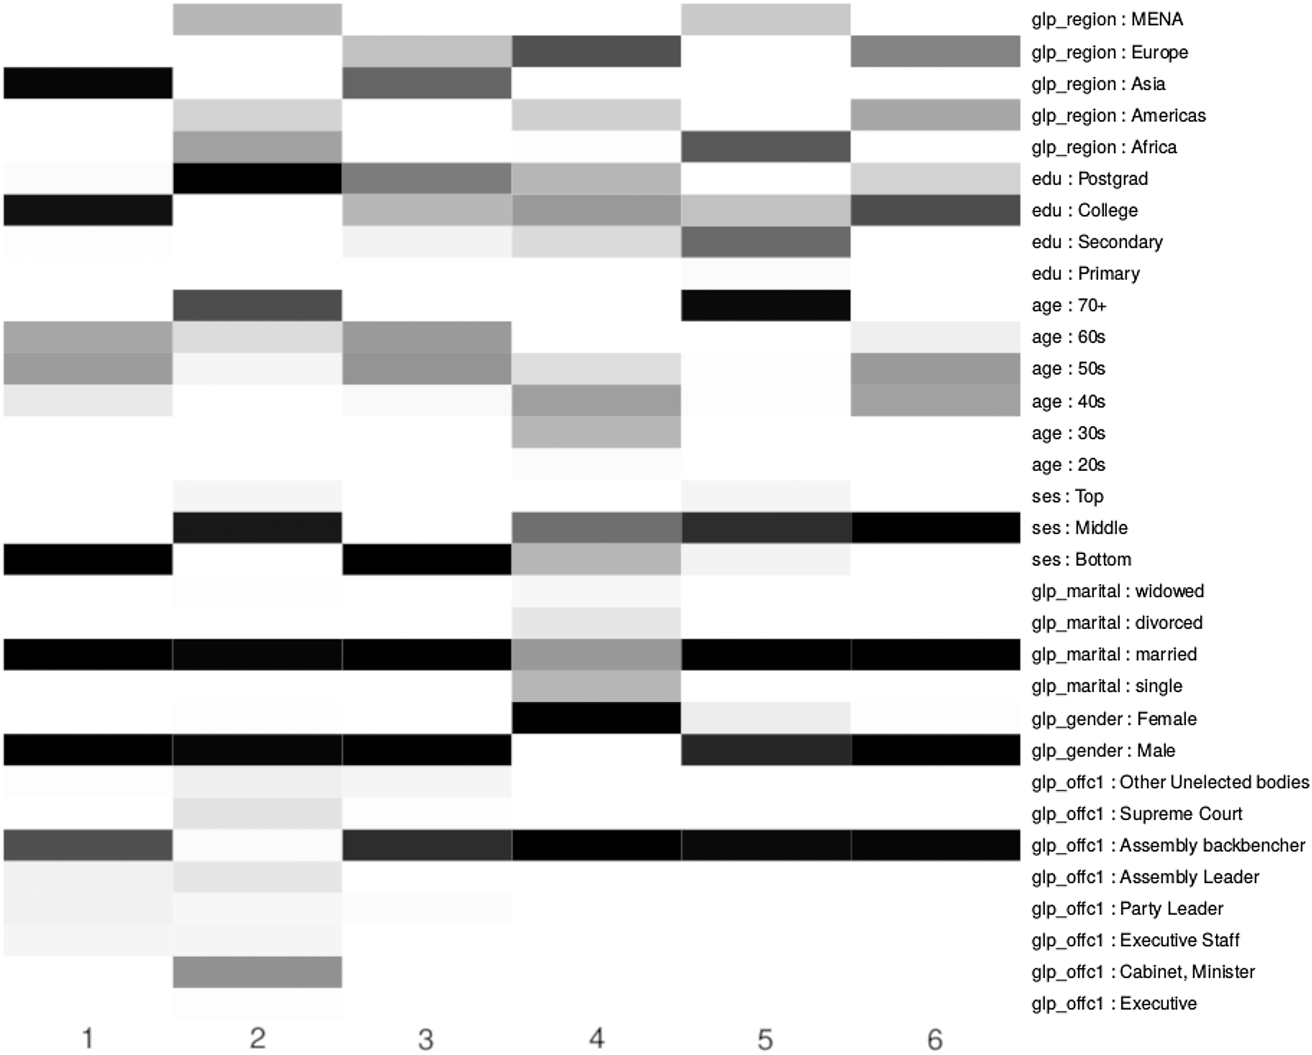
Table 8 augments the information in figure 2, presenting the most informative (i.e., defining) attributes for each of the six groups. We rank traits according to the score |P(g ik) – P(g ik | x jk=l)|. In other words, we deem trait j more informative than trait j’ if the distance between the prior probability that leader i belongs to category k and the posterior probability that leader i belongs to category k is larger when we compute that posterior probability based on trait j than we compute it based on trait j’. The table includes three columns for each group. The first lists trait values, the second provides the posterior probability that a randomly selected leader exhibiting the trait belongs to the given group, or P(g i=k|x i=l), and the third column shows the probability that a randomly selected full member of the group exhibits the given trait, or P(x ij=l|g ik = k), as depicted by figure 2. Note that characteristics can be highly informative about group membership both when they are especially common and when they are especially rare. For example, table 8 indicates that members of group 1 have close to zero chance of being middle class, from Africa, elderly, or single. Nonetheless, certain common/rare traits will be uninformative, and table 8 lists only the ten most informative traits for each group. Notably, figure 2 shows that most of our groups consist of backbenchers. However, because so many groups exhibit this trait, only in group 6 does it rank among the most informative traits for a group where leadership is rare.
Informative traits

Column 1: Traits, ranked by informative-ness with respect to group membership. Those with bold font are especially uncommon in the given group.
Column 2: P(g i=k|x i=l), the posterior probability that a randomly selected leader exhibiting the trait belongs to the group.
Column 3: P(x ij=l|g ik = k), the probability that a randomly selected full member of the group exhibits the given trait, as depicted by figure 2.
The groups depicted in table 8 exhibit strong regional variation. The first group, for instance, is strongly associated with Asia. As table 8 highlights, this is the most informative characteristic for this group: full members of this group have a probability of 0.99 of being Asian, while 59% of Asians have membership in this group. This group contains a mixture of backbenchers and other office holders, notably party leaders and executive staff, and is overwhelmingly male, married, poor, and middle-aged. The bulk of these politicians have college educations.
The second group is composed of power brokers, especially cabinet ministers, hailing from Africa, the Americas, and MENA. This group is largely male—although it includes some women—married, middle or upper class, trends older, and holds post-graduate degrees.
Working class backbenchers—and a smattering of party leaders, supreme court justices, and members of other unelected bodies—comprise the third group. Again, these are married middle-aged men, from the bottom of the income distribution. They have varied educations, ranging from secondary through postgrad, but a plurality have postgraduate degrees. Like group 1, this form of working class politician is common in Asia, but it is also commonly found in Europe.
The fourth group consists of women backbenchers. Members of this group, which is found especially in Europe, but also to a lesser extent in the Americas and Africa, are substantially more likely to be single or divorced than members of any other group, they are largely middle or lower class and trend younger than other politicians, although the modal member is in her forties. They have educations ranging from secondary school through postgrad, although most have college degrees.
African and Middle Eastern backbenchers make up the fifth group. Members are largely male, married, middle class—although there is some variation in income—and elderly. Most members have only a secondary school education, although some have gone to college.
The sixth and final group characterizes the typical Western backbencher. These politicians are male, married, middle class, and middle aged. Most have college educations, or postgraduate degrees, and they hail from the Americas and Europe.
As a snapshot summary of political leaders around the world this six-group model serves as a useful tool for summarizing the data collected in the GLP. The model shows strong regional variation in types. Notably, backbenchers in Africa and MENA differ substantially from those in the West, while there is some overlap in backbench traits across Asia and Europe. Interestingly, while politicians holding high office cluster into different groups from backbenchers in Africa, the Americas, and MENA, this is much less the case in Asia and Europe, where we see less bifurcation between front and backbench types. Where we do see bifurcation, not surprisingly, holders of top offices tend to be richer and older than their backbench counterparts. As expected, women politicians are common only in some parts of the world and, on average, exhibit traits that differ from their male counterparts.
This inductive typology does not contain many surprises. However, from the perspective of data validation the lack of novelty is reassuring. Gross patterns among leaders across the world should correspond to common sense, at least in most respects. And the groupings displayed in figures 1–2 and table 8 align nicely with prior expectations. A question for future research is whether, or to what extent, this leadership typology explains political behavior.
Expanding the Study of Political Elites
In reviewing previously available information about leadership cadres worldwide (in the first section) we noted that extant sources are limited in several respects, e.g., limited country coverage, limited background information about elites, and an exclusive focus on top elites or on particular offices (e.g., parliamentarians). To what extent have these limitations affected common understandings of the topic? To what extent, that is, do extant datasets render a biased or curtailed vision of political leadership around the world?
Global studies of political elites often focus on characteristics that are fairly easy to measure such as gender (McDonagh Reference McDonagh2010; Paxton and Hughes Reference Paxton and Hughes2015). Other aspects such as social class, ethnicity, religion, language, previous experience, educational attainment, and educational background receive short shrift, or are dealt with in a narrow empirical context (e.g., a single country or region).
Crossnational studies of elites tend to focus on first-world countries with advanced industrial economies and predominantly democratic forms of government, presumably because extant data sources also privilege these countries (table 1). It is not always possible, however, to generalize from the characteristics of rich-country politicians to the characteristics of poor-country politicians. We find, for example, that elites in poor countries are more male dominated (table 2), much more likely to be educated abroad (table 4), more likely to have backgrounds in engineering and less likely to have backgrounds in social sciences, humanities, and law (table 4), and are more likely to have political experience in NGOs and less likely to have experience in local government (table 6). Elites in poor countries are paid much less but receive a higher pay relative to per capita GDP (table 7). Thus, while elites everywhere are similar in some ways, there are important differences between the sort of individuals who gain top political positions in rich and poor countries.
As a final point of inquiry, we contrast the characteristics of top leaders with the characteristics of backbenchers. Crossnational studies of elites tend to focus on the former—kings and queens, presidents and prime ministers, and perhaps party leaders and cabinet members. These are the leaders who dominate academic studies, as signaled by the content of most extant datasets (table 1). (To the extent that lower-level elites such as backbenchers are included, information about them is generally provided only in an aggregated [country-level] format rather than at an individual level.) Needless to say, these are not the only actors who matter, and data from the GLP shows that there are marked differences across leadership echelons. For example, top echelons are older, more male-dominated, longer-serving, more likely to be educated abroad and in the West, more likely to have training in business or economics or in the military, and more likely to have held prior offices in party organizations and MP positions. Work that focuses on top elites risks misrepresenting the broader class of government leaders.
Regional differences, and differences across regime type, are also marked, though we shall not burden the reader with a recitation of contrasts contained in the foregoing tables. The general point is clear: leadership characteristics vary across offices and across contexts. Without an encompassing view of our subject, this variation is lost. Writers may over-generalize, or under-generalize (failing to see general patterns where they exist).
We do not mean to imply that every study of elites should be global in scope. Evidently, there are many reasons—logistical, methodological, and theoretical—for scoping down to particular countries or regions. But we do suspect that any country or regionally focused study will want to reflect on the generalizability of their findings. For this purpose, a global sample is indispensable.
In these respects, we expect that the GLP can contribute to progress in the study of political leadership. Why are some countries more male-dominated than others? Why are some leadership classes more cosmopolitan than others? Do democracies enlist more educated leaders than autocracies? Are certain offices more likely to be filled by leaders with higher education? In this final section of our paper we point the way toward several productive lines of inquiry.
Arguably, within-country variation provides the most satisfactory approach to measurement and to causal identification. To this end, the individual-level data provided by the GLP—including 38,085 leaders across 145 countries—offers ample opportunities for analysis.
Because data about leaders is associated with each leader’s name, the GLP database may be used in conjunction with other databases that have a similar structure. For example, one might merge the GLP with databases containing names of elites in business or the military, using common surnames to indicate family ties across these spheres. One might merge the GLP with constituency-level data on election results (e.g., from the Constituency-Level Election Archive [CLEA]) to gauge how electoral dynamics condition the types of MPs who reach office.
Note that because GLP collects individual data across a wide range of social and political dimensions, it offers the possibility of aggregating the data at a variety of different levels, e.g., social group (defined by ethnicity, language, or religion), political party, institution (executive, legislative, judicial), position (apex, next ten, executive, cabinet, executive staff, party leaders, assembly leaders, supreme court justices, backbenchers, and unelected persons), country, and region (Africa, Asia, et al.). As an example, consider the possibility of comparing attributes across parties. Here, one might wish to compare the characteristics of small parties and large parties, parties on the left and the right, parties in government and opposition parties, and so forth.
Individual-level data may also be mustered to provide measurement instruments for hard-to-measure latent concepts. By way of example, suppose one is willing to assume that education is a marker for aptitude. Building on this postulate, it follows that one ought to see an association between education and leadership position in countries where meritocratic rules apply. Where a strong association exists—that is, where top leaders are more educated than intermediate or low-level leaders—we may assume that meritocratic procedures are being applied. This, in turn, may pave the way for an analysis of fundamental causes.
While we have given a taste of some of the interesting variation in personal characteristics of leaders around the world, we are sure that scholars will be able to enlist GLP data in ways we cannot imagine. Ahlquist and Levi noted recently that the subject of leadership, after decades of neglect, is back in fashion (Ahlquist and Levi Reference Ahlquist and Levi.2011). Our hope is that the Global Leadership Project will be a fundamental empirical resource in this new resurgence of research on leadership and that it will enable policymakers, researchers, and citizens to make more accurate and precise comparisons within countries, across countries, and across regions of the world. These are our leaders. Let’s see who they are, and whom they are likely to represent.
Supplementary Materials
Appendix A. Data Collection
Appendix B. Questionnaire
Appendix C. Imputed Data
Appendix D. A Grades of Measurement Model for Mixed Data
To view supplementary material for this article, please visit https://doi.org/10.1017/S1537592719000744


