


1 Introduction
The way quantified information is presented to people could persuade them to make better decisions. Imagine that an individual is considering whether to buy a cereal bar that is ‘high in protein’. Would the cereal bar be more appealing if it stated that it had ‘70% of protein’ instead? Understanding how and why variations in the format of such quantity phrases, or ‘quantifiers’, affect judgement and decision-making is important to design effective communication across many domains (e.g., food and nutrition: Reference Liu, Juanchich, Sirota and OrbellLiu, Juanchich, Sirota & Orbell, 2019; medical risks: Reference Berry, Knapp and RaynorBerry, Knapp & Raynor, 2002; climate change: Reference Budescu, Por, Broomell and SmithsonBudescu, Por, Broomell & Smithson, 2014; weather forecasting: Reference Patt and SchragPatt and Schrag, 2003).
Varying the format of quantity phrases, or ‘quantifiers’, by presenting it in numerical format (i.e., ‘70%’) or verbal format (i.e., ‘high’) may alter people’s judgements and decisions (Reference Liu, Juanchich, Sirota and OrbellLiu, Juanchich, Sirota & Orbell, 2020a, 2020b; Reference Windschitl and WellsWindschitl & Wells, 1996). People’s response patterns showed that with verbal quantifiers, their decisions are more influenced by what the quantifier described (‘protein’, in the above example) than with numerical quantifiers (Liu et al., 2020a, 2020b). There is also evidence that people rely more on the actual quantity when making decisions with numerical vs. verbal quantifiers (Reference González-Vallejo, Erev and WallstenGonzález-Vallejo, Erev, & Wallsten, 1994). One interpretation of such results is that verbal quantifiers are more intuitively and easily processed (Reference Wallsten, Budescu, Zwick and KempWallsten, Budescu, Zwick & Kemp, 1993), and thus prone to biases in judgement (Reference Windschitl and WellsWindschitl & Wells, 1996). Another is that verbal quantifiers are more sensitive to contextual information with verbal than numerical quantifiers thus this context is harder to separate for verbal quantifiers. For example, one should be more aware of the fact that the context is protein with ‘high in protein’ than ‘70% of protein’ (Reference MoxeyMoxey, 2017; Reference Moxey and SanfordMoxey & Sanford, 1993). The two explanations give two very different views of how people use verbal and numerical quantifiers: in the former instance, verbal quantifiers are used in a more sub-optimal way, and worse for decision-making (Reference Windschitl and WellsWindschitl & Wells, 1996); in the latter, verbal quantifiers highlight information that is relevant to the decision and could lead to better decision-making when the context is supportive of it (Reference Moxey and SanfordMoxey & Sanford, 1993). However, it is difficult to ascertain which explanation is more applicable, because they both point to similar response patterns.
Part of the difficulty in explaining processing differences between verbal and numerical quantifiers is that the evidence has been based on behavioural outcomes, which provide only indirect evidence of the processes that produce them (e.g., González-Vallejo et al., 1994; Reference Windschitl and WellsWindschitl & Wells, 1996; Liu et al., 2020a, 2020b). Based on these indirect measures, it is difficult to draw conclusions about the nature of this cognitive processing: for example, if people are making a quicker, more intuitive decision with verbal quantifiers, or deliberately integrating the context into the decision. The aim of this paper was therefore to use a process-tracing approach with eye-tracking methodology to investigate differences in how people process verbal and numerical quantifiers.
1.1 Differences between verbal and numerical quantifiers
The term ‘quantifiers’ refers to a collection of expressions that convey information about amounts (Reference Paterson, Filik and MoxeyPaterson, Filik & Moxey, 2009) — for example, proportions (e.g., 20% of a total) or probabilities (e.g., a 20% chance). Quantifiers may be numeric (numerical quantifiers, such as percentages) or linguistic expressions (verbal quantifiers, such as ‘low’, ‘likely’, ‘some’). People’s behavioural responses differ when they make judgements and decisions based on verbal or numerical quantifiers. For instance, people gave higher preference ratings on a verbal as opposed to a numerical rating scale (Reference Nicolas, Marquilly and O’MahonyNicolas, Marquilly & O’Mahony, 2010), ranked products differently when given verbal or numerical scales (Reference Maciejovsky and BudescuMaciejovsky & Budescu, 2013), and described the same chance event (e.g., winning a lottery) with different verbal probabilities despite the numerical probabilities being the same (Reference Windschitl and WellsWindschitl & Wells, 1996). These differences between verbal and numerical quantifiers are well documented, but the reason why they differ is still unclear. One possibility is that verbal quantifiers are processed more intuitively than numerical quantifiers (Reference Windschitl and WellsWindschitl & Wells, 1996), which would suggest they should take less decision time and processing effort, but invite judgement biases related to the use of mental shortcuts (Reference KahnemanKahneman, 2011). Yet another possibility is that verbal and numerical quantifiers signal different focus to people (Reference Moxey and SanfordMoxey & Sanford, 1986; Reference Teigen and BrunTeigen & Brun, 1995), thus acting as pragmatic signals for whether to pay more attention to certain elements in the information. We consider these two explanations in turn.
1.1.1 Are verbal quantifiers more intuitive than numerical ones?
There is a tacit agreement that verbal quantifiers are more natural, and thus easier for people to use (Reference Wallsten, Budescu, Zwick and KempWallsten et al., 1993). Most adults will process words automatically and unconsciously, for instance, in the traditional Stroop task, where people automatically generate the meaning of a colour word, such as ‘blue’, which interferes with their naming of the word font if it is not blue (Reference MacLeodMacLeod, 1991). Verbal quantifiers also possess inherently evaluative qualities: for example, one immediately knows that ‘low’ lies at the bottom end of a scale; not so for a numerical quantifier such as ‘20%’, which requires more effort to ascertain if the amount is big or small in a given context (Reference Viswanathan and ChildersViswanathan & Childers, 1996). This combination of properties — automatic, easy, quick — fit a classification advanced by dual-process theories of cognition. These theories propose that people process information in two styles that differ in automaticity, effort, and speed (see De Neys, 2017, and Evans, 2008, for an overview of dual-process theories). Intuitive processes are typically defined as being quick, automatic, and requiring little cognitive effort (vs. slow, deliberate, and effortful; Reference De NeysDe Neys, 2017; Reference EvansEvans, 2008), and are often driven by instinctive feelings about the information (vs. rational logic; Reference Shiv and FedorikhinShiv & Fedorikhin, 1999). Intuitive processing is also commonly related to the use of mental shortcuts (Reference Morewedge and KahnemanMorewedge & Kahneman, 2010), rather than considering all the information by weighted analysis (often considered to be a superior process for decision-making, e.g., Czerlinski et al., 1999). Using mental shortcuts can lead to what is often termed ‘biases’ (Reference Tversky and KahnemanTversky & Kahneman, 1974), although whether the decision outcomes are actually erroneous is debatable (Reference Gigerenzer and ToddGigerenzer & Todd, 1999).
Empirical evidence for processing differences between verbal and numerical quantifiers has been inconsistent. Studies with reaction time measures have found faster decisions with verbal quantifiers (Reference Budescu and WallstenBudescu & Wallsten, 1990; Reference Viswanathan and ChildersViswanathan & Childers, 1996), but also faster decisions with numerical quantifiers (Reference Jaffe-Katz, Budescu and WallstenJaffe-Katz, Budescu & Wallsten, 1989; Reference Viswanathan and NarayananViswanathan & Narayanan, 1994). Applying a concurrent working memory load during decision-making — which should constrain the ability to make analytical, but not intuitive, decisions — also showed no effects between the quantifier formats (Reference Liu, Juanchich, Sirota and OrbellLiu et al., 2020b). Studies looking at the outcomes of decisions found no overall difference in decision quality between the formats (Reference González-Vallejo, Erev and WallstenGonzález-Vallejo et al., 1994), but also that people showed more biases typical of decision shortcuts with verbal than numerical quantifiers (Reference Welkenhuysen, Evers-Kiebooms and d’YdewalleWelkenhuysen, Evers-Kiebooms & d’Ydewalle, 2001; Reference Windschitl and WellsWindschitl & Wells, 1996). For example, participants described the verbal probability of winning a lottery with ten in a hundred balls as higher than one with one in ten balls, but they were less prone to this bias with numerical probabilities — a cognitive bias that is typically associated with quick, intuitive judgements (Reference Windschitl and WellsWindschitl & Wells, 1996). Participants were also more likely to take a pre-natal test when presented with a verbal probability (‘a moderate chance’) of disease vs. the complementary verbal probability (‘a high chance’) of no disease; again, they did not display this bias with the equivalent numerical probabilities (Reference Welkenhuysen, Evers-Kiebooms and d’YdewalleWelkenhuysen et al., 2001).
Overall, the literature shows conflicting evidence, with some indicators of intuitive processing (e.g., speed, effort) finding no consistent differences between formats, while others (e.g., use of mental shortcuts) suggesting verbal quantifiers are more intuitive. There could therefore be more complex processing differences to consider between verbal and numerical quantifiers.
1.1.2 Do verbal or numerical quantifiers provide a stronger signal to the informational context?
The outcomes in decision-making tasks with verbal and numerical quantifiers show that despite overall similarity in response time measures, people took different paths to reach their decision. For example, González-Vallejo et al. (1994) found that in games of chance with verbal and numerical quantifiers, participants might reach similar decision outcomes on average, but they tended to pick gambles with numerical quantifiers that had higher probabilities, and gambles with verbal quantifiers that had higher outcome values (i.e., larger pay-outs). A similar pattern was found in a decision-making task where participants judged whether a combination of two quantities of nutrients exceeded a healthy consumption limit (Liu et al., 2020a, 2020b). In these studies, participants should ideally make their decisions based on the quantifiers (probability of winning, or amount of nutrient), but with verbal quantifiers, participants tended to rely on the context (the winning event, or the identity of the nutrient). One could explain this as people using more shortcuts to reach their decisions quickly; however, it is as possible that verbal and numerical quantifiers have different pragmatic properties that signal what one should be attending to more.
The interpretation of verbal quantifiers is highly influenced by the context in which it appears (Reference Beyth-MaromBeyth-Marom, 1982). Verbal quantifiers are said to have ‘vague’ meanings, i.e., they are ascribed different numerical values among people (Reference Budescu and WallstenBudescu & Wallsten, 1995), and also depending on the contextual information (Reference PierceyPiercey, 2009). Where a likely event may mean a 60% chance to one individual, another may believe it to mean a 70% chance; this may also differ depending on whether one is discussing the chance it will rain vs. the chance it will snow (Reference Patt and SchragPatt & Schrag, 2003; Reference Weber and HiltonWeber & Hilton, 1990). Because context assists in the interpretation of verbal quantifiers, the verbal format may signal to people that they should process the context more.
Verbal quantifiers are also believed to carry more embedded meaning than numerical quantifiers (Reference Sanford, Dawydiak and MoxeySanford, Dawydiak & Moxey, 2007; Reference Teigen and BrunTeigen & Brun, 1999). Beyond signalling that the context important, one’s choice of quantifier could also signal the type of contextual information that one should be paying attention to. For example, given a 30% chance of success, people could focus on why one might succeed or fail (a positive or negative focus), but when presented as ‘some possibility’ of success, people unambiguously focused on the reasons for success (a positive focus) with the verbal quantifier — despite translating the two quantifiers as equivalent probabilities (Reference Teigen and BrunTeigen & Brun, 2000). A verbal quantifier thus has an additional focusing property (Reference Sanford and MoxeySanford & Moxey, 2003; also known as ‘directionality’, Reference Teigen and BrunTeigen & Brun, 1999) that could act as a signal that people need to focus more on the positive context.
Additionally, some evidence also shows that people more readily process verbal quantifiers together with contextual information than numerical quantifiers, which tend to be processed more in isolation. Readers of quantified phrases were more likely to notice when the context changed (e.g., a change from ‘low fat’ to ‘low sugar’) when the quantities were verbal vs. numerical (Reference MoxeyMoxey, 2017). In contrast, people noticed a change to the quantifier more when the quantifier was numerical than verbal (e.g., a change from ‘5% fat’ to ‘15% fat’; Reference MoxeyMoxey, 2017). These findings indicate a greater processing of the context for verbal quantifiers but greater processing of the quantifier for numerical quantifiers. However, these results do not exclude the explanation that people are more intuitive with verbal quantifiers, which posits that numerical quantifiers would receive more processing than verbal ones. Moreover, people could still be taking more time overall with the numerical than verbal sentence. To ascertain if only some, or all, of these possibilities might be occurring, it is necessary to trace the processes over the course of people’s judgements and decision-making.
1.2 Which process governs decision-making with verbal vs. numerical quantifiers?
We have discussed two explanations for the different behavioural responses to verbal and numerical quantifier: one suggests that verbal quantifiers engage a more intuitive process than numerical ones: quicker, and with less effort; the other suggests that verbal quantifiers direct more processing efforts to the context, or even specifically to positive contexts. Because measures like reaction time and decision outcomes alone do not adequately distinguish between these explanations, we proposed to study the processes underpinning judgements and decisions with verbal and numerical quantifiers using eye-tracking methodology to elicit visual fixation measures for different parts of a quantifier phrase (quantifier and context).
One’s gaze is believed to be a strong indicator of what one is paying attention to, which in turn gives an indication that one is processing the information (Reference Russo, Schulte-Mecklenbeck, Kühberger, Johnson and RanyardRusso, 2011). Tracking people’s eye movements is thus increasingly being used to understand how information is processed during judgement tasks in many decision-making domains (Reference Orquin, Holmqvist, Schulte-Mecklenbeck and JohnsonOrquin & Holmqvist, 2018; Reference Schulte-Mecklenbeck, Johnson, Böckenholt, Goldstein, Russo and SullivanSchulte-Mecklenbeck et al., 2017a). Although researchers are still debating the extent to which gaze is an indicator of cognitive processing (Reference Orquin and LooseOrquin & Loose, 2013; Reference Schulte-Mecklenbeck, Kühberger, Gagl and HutzlerSchulte-Mecklenbeck, Kühberger, Gagl & Hutzler, 2017b), in general studies find that longer gaze durations correspond with greater and more costly cognitive processing (Reference Horstmann, Ahlgrimm and GlöcknerHorstmann, Ahlgrimm & Glöckner, 2009; Reference Orquin and LooseOrquin & Loose, 2013). There is evidence of a link between the exertion of cognitive effort and increased gaze duration across many domains (e.g., Reference Ehrlich and RaynerEhrlich & Rayner, 1981; Reference Grant and SpiveyGrant & Spivey, 2003; Reference Just and CarpenterJust & Carpenter, 1976). We therefore expected that a more intuitive process could be reflected by the duration of gaze, with longer durations indicating less intuition (as more cognitive effort is exerted).
In this paper, we report two eye-tracking experiments that investigated the role of quantifier format — verbal or numerical — in how long people spend fixating on a quantifier and on its context, and how this affects subsequent judgements and decisions. The experiments used two types of quantifiers (proportional and probabilities) in two different domains (nutrition information and weather forecasts) where we could vary both the quantifier and valence of the context. We were interested in three main questions.
First, do people process verbal quantifiers more intuitively? Because of the link between fixation durations and cognitive effort (e.g., Reference Grant and SpiveyGrant & Spivey, 2003; Reference Orquin and LooseOrquin & Loose, 2013), we expected that this would be indicated by longer fixations on numerical quantifiers than verbal quantifiers (H1, tested in Experiment 1).
Second, do verbal and numerical quantifiers signal people to process certain elements more? We first tested if people would process positive contextual information more with verbal than numerical quantifiers — as indicated by longer fixations to the context in these instances (H2, tested in Experiment 1). Motivated by studies of the pragmatic properties of verbal quantifiers (e.g., Reference Teigen and BrunTeigen & Brun, 2000), we also considered if people would fixate longer on the context with verbal than numerical quantifiers (H3, tested in Experiment 2), as this would indicate that verbal quantifiers simply put more focus on the context than do numerical ones (Reference MoxeyMoxey, 2017).
Finally, we expected that participants’ judgement and decision-making processes would lead them to make more polarised judgements and decisions for verbal compared to numerical quantifiers (e.g., a positive judgement would be more positive for the verbal than numerical quantifier; H4, tested in both experiments), as was found in past work (e.g., Gonźalez-Vallejo et al., 1994, Liu et al., 2020a, 2020b).
In line with recent scientific guidelines, the hypotheses, methods, and statistical analyses for the two experiments we report in this paper were registered prior to conducting each experiment.Footnote 1 The pre-registration protocols are available along with data and materials on the Open Science Framework (OSF; https://osf.io/54tpd). All experiments received approval from a University ethics committee prior to commencement of data collection.
2 Experiment 1
2.1 Method
2.1.1 Participants
The study was powered to detect a small effect of f = .10 (α = .05, 1−β = .80, two-tailed test).Footnote 2 Participants were 149 students with normal or corrected-to-normal vision, who completed the study for course credit (78% female; age range 18–46 years, M = 20.5, SD = 4.7). Data from one participant was excluded due to a programming glitch during their session.
2.1.2 Design
We tracked participants’ eye movements as they judged 48 nutrient labels, each with a single quantity and a single nutrient (see Figure 1 for an illustration). The 48 labels resulted from the crossing of three variables in a within-subjects design with four trials per condition: 2 (format: verbal or numerical) × 2 (context valence: positive [protein or minerals] or negative [saturated fat or sugar]) × 3 (quantity: low/20%, medium/40%, or high/70%).

Materials and procedure
Participants were tested individually in the laboratory. Upon arrival, participants signed a consent form outlining the experimental procedure. Participants’ heads were stabilised on a chin rest to limit movement. We used an EyeLink1000 eye-tracker (http://www.sr-research.com) mounted on the desk below a 17-inch PC monitor (screen resolution 1024×768) to track pupil image and corneal reflection of participants’ right eye. The display distance was approximately 60cm, with dim background lighting. The experimenter performed a 9-point calibration check prior to starting the experiment.
The task was presented using SR Research’s Experiment Builder software (script available on the OSF). Participants read instructions about the task on the screen, which stated that their goal was to evaluate the healthiness of a food with the nutrient amount stated in the label. The instructions also included an example of what the labels looked like, and explained that the numerical percentages they were about to see meant the percentage contribution to their total recommended daily intake for the nutrient specified. Participants also read a definition of each nutrient they would see during the experiment (e.g., ‘Sugar refers to any of several sweet carbohydrate substances’). In each trial, participants viewed a label and assessed how healthy they thought the food with the presented label was.
We designed simplified nutrition labels that featured the quantity of a nutrient in terms of its percentage contribution to one’s Guideline Daily Amount (GDA), which reflects the total amount one should eat in a day (i.e., ‘20% fat’ means 20% of the total fat one should consume in a day). This choice meant that we were able to directly compare quantities of nutrients because GDAs are standardised values that do not place an additional burden on individuals to know or remember what is a recommended value for different nutrients (Reference Rayner, Scarborough and WilliamsRayner, Scarborough & Williams, 2004).
To derive comparable quantities for the verbal and numerical quantifiers, we selected numerical quantities that are perceived on average psychologically equivalent to the verbal quantifiers used (low, medium, and high %) according to the first study in Liu et al. (2019), which is the only study to our knowledge that investigated average translations of these terms for the same nutrients among a similar participant sample (students at a UK university). This method, where average numerical translations of verbal quantifiers are obtained prior to the study to determine equivalent values in the verbal and numerical conditions, has previously been used to compare judgements with verbal and numerical quantifiers (Reference Teigen and BrunTeigen & Brun, 2000; Reference Welkenhuysen, Evers-Kiebooms and d’YdewalleWelkenhuysen et al., 2001). We considered the possibility of using a verbal-numerical pairing provided by national nutritional guidelines (e.g., Department of Health, 2016), but opted not to because prior research showed that people do not interpret verbal quantifiers as the standard indicates (Reference Liu, Juanchich, Sirota and OrbellLiu et al., 2019); we would thus expect participants’ psychological interpretations to widely differ from official translations (as is the case for probabilities, e.g., Reference Budescu, Por and BroomellBudescu, Por & Broomell, 2012, and frequency quantifiers, e.g., Berry et al., 2002) and opted instead to use the average translated values, rounded to the nearest 10 (Reference Liu, Juanchich, Sirota and OrbellLiu et al., 2019).
Fixation duration for different quantifier formats may also be affected by differences in stimuli length or character types (i.e., numbers vs. letters; Reference Orquin and HolmqvistOrquin & Holmqvist, 2017). We reduced ‘MEDIUM %’ to ‘MED %’ to limit the possibility that a longer word could result in longer gaze. After this modification, all the quantifiers were between three and five characters long (e.g., LOW % had four characters while 20 % had three characters).
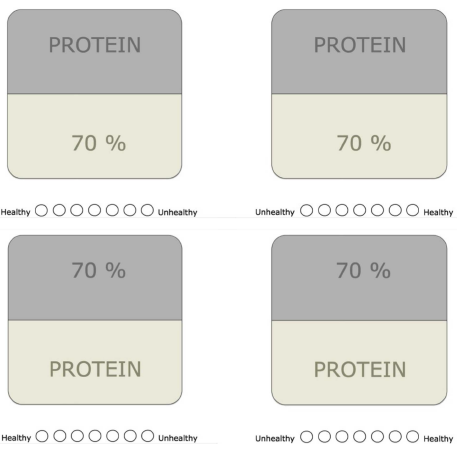
The quantifiers were paired with one nutrient at a time. The nutrients were protein, minerals, sugar and saturated fat (presented as ‘sat fat’ so that the nutrients had similar character lengths on the labels). We selected these nutrients because two have positive valence (protein and minerals) and two have negative valence (sugar and saturated fat: Liu et al., 2019; Reference OakesOakes, 2005). For half the participants, the nutrient was at the top of the label, with the quantifier below, and for the other half, it was the opposite (see the Appendix for an example of a numerical label in the four counterbalanced conditions). We measured participants’ eye fixations within two Areas of Interest (AOIs): the quantifier and the context (nutrient) portion of the label. Each AOI was the same size and subtended approximately 21 by 10 degrees of visual angle (horizontally: from the left to right boundary lines of the food label in Figure 1; vertically: from the edge of the fixation dot to either the top boundary line or bottom boundary line of the respective label portion).
Participants used a mouse to give their judgement on a 7-point Likert scale below the label (unhealthy to healthy or healthy to unhealthy; randomly assigned between participants). Each trial started with a fixation dot appearing on the screen between the position of the quantifier and context interest areas to ensure participants’ gaze would fall on the centre of the nutrition label at the start of each trial (see Figure 1). Participants fixated the dot and pressed the spacebar to begin the trial. The trial ended once they made their judgement.
Participants first completed a practice set of six trials and had the opportunity to ask questions before beginning the experimental trials. Participants performed two blocks of twenty-four trials with a break in between. They were reminded of the instructions and the definition of GDA and the nutrients before they started the second block. The experimenter performed another calibration check before continuing with the second block if the participant moved their head during the break. In the first block, participants were randomly assigned to view either verbal (e.g., ‘low %’) or numerical (e.g., ‘20 %’) percentages. In the second block, the quantifiers were in the other format. Within a block (randomly presented), the nutrients were either positive (minerals or protein) or negative (saturated fat: ‘sat fat’, or sugar), and the quantifiers were low/20%, med/40%, or high/70%.
At the end of the experimental task, participants completed a questionnaire that assessed socio-demographic information.
2.2 Variables and analysis strategy
For each trial, we measured the following variables: total fixation duration and number of fixations on the quantifier and nutrient AOIs, and healthiness judgement. Fixations were determined according to the standard EyeLink algorithm in cognitive configuration. This detects saccades whenever the eye exceeds velocity, acceleration, and motion thresholds of 30º/sec, 8000º/sec, and 0.15º/sec respectively (SR Research, 2007). This resulted in a minimum threshold of 80ms to define a fixation. Total fixation duration was defined as the sum duration of all fixations on the AOI for the trial.
We tested our hypotheses for the fixation and judgement variables in pre-registered multilevel models using SPSS, after excluding data from nine (0.13%) trials where no fixations were recorded, as this indicated that participants’ judgements were made without looking at the label, and their fixation patterns were thus not informative in these trials. We included fixed effects for format, context (nutrient) valence, and quantity, and their interactions. The analyses were first conducted with the maximum random effect structure (i.e., all random slopes and intercepts; Reference Barr, Levy, Scheepers and TilyBarr, Levy, Scheepers & Tily, 2013). When a model did not converge, hence we simplified the model by removing random slopes that caused the convergence problems. The syntax to run the final analyses is provided on the OSF.
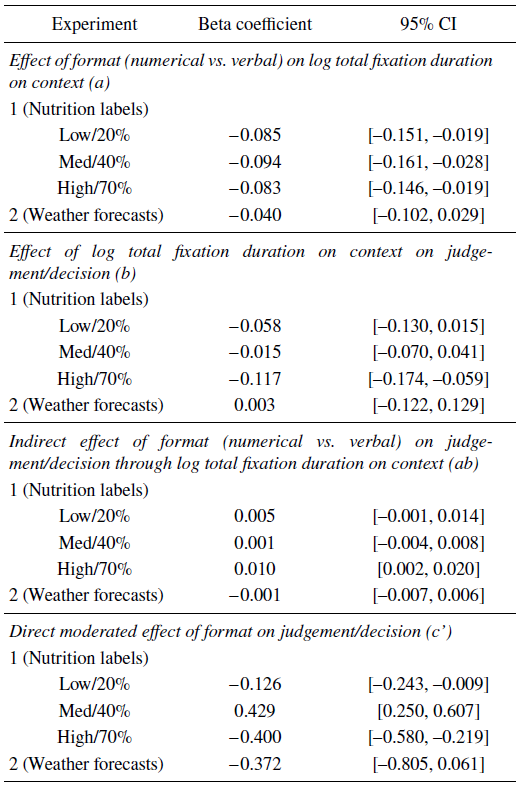
To further test the extent to which total fixation durations for the context (nutrient) AOI were responsible for explaining healthiness judgements, we performed pre-registered secondary mediation analyses using the PROCESS macro for SPSS (Model 5; Reference HayesHayes, 2013). In this analysis, we included context valence as a moderator of the direct effect between format and judgement. The analyses used bootstrapped confidence intervals based on 5,000 samples to investigate the effect of format on judgement as mediated by log fixation duration on the context AOI for each of the three quantities, while controlling for the moderating effect of context valence in the direct relationship. Figure 2 illustrates the mediation model.
Mediation model for the effect of format on judgements and decisions through fixations on the context. The context was the nutrient in Experiment 1 and the weather in Experiment 2. The model was tested on each of the different quantifier levels (high, medium, and low) in Experiment 1, and across all quantifiers in Experiment 2. Only the mediation pathway (ab) for high/70% quantities in Experiment 1 was significant, indicating that longer fixations on the nutrient led to higher healthiness judgements for positive nutrients and lower healthiness judgements for negative nutrients. Values for the beta coefficients of each pathway and their 95% confidence intervals for the different quantifiers and experiments are given in the Appendix (Table A4).

The full multilevel model and mediation analyses are reported, respectively, in Appendix Tables A1-A4. The results reported herein give an overview of general fixation patterns, and focus on reporting the pre-registered hypotheses.
2.3 Results
2.3.1 General fixation patterns
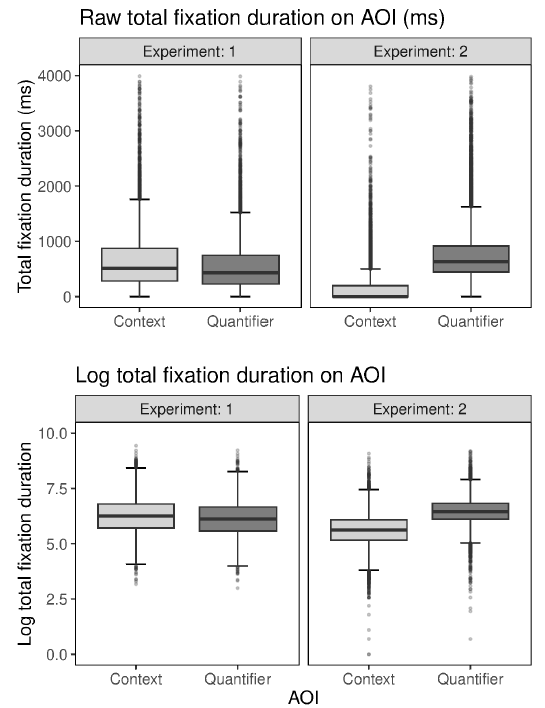
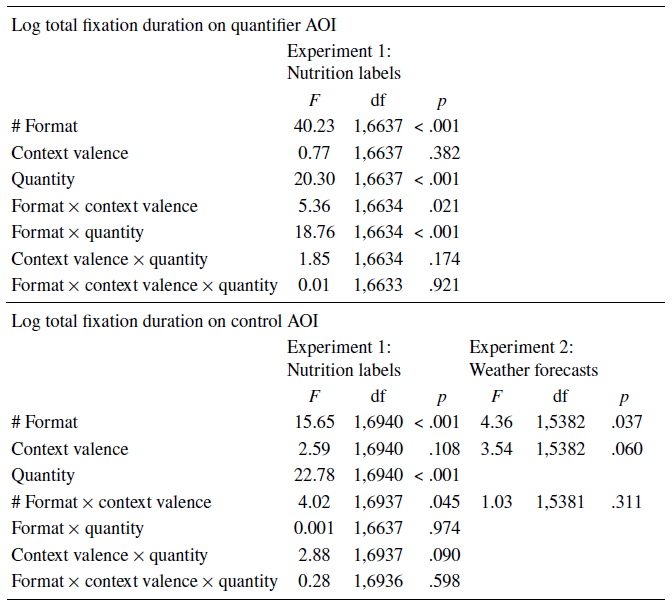
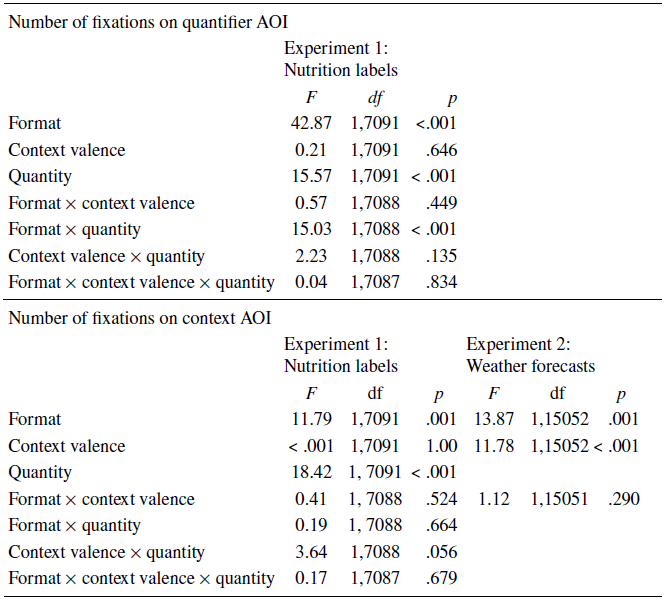
Participants spent on average 594ms (SD = 607) per trial fixating on the quantifier AOI and 710ms (SD = 721) fixating on the context (nutrient) AOI. These were about 20% and 24% of the average time spent fixating in a trial, with the remainder of the fixations on other areas (e.g., the judgement rating scale). The top left panel of Figure 3 shows the distribution of participants’ total fixation durations on each of these AOIs. The top panels of Figure 4 illustrate the fixation patterns across different areas of the stimulus screen for verbal and numerical conditions. As expected, total fixation duration was correlated with number of fixations (quantifier: r = .88, p < .001; context: r = .86, p < .001). We focus on reporting results for total fixation duration (per AOI) here. Results of the same analyses on number of fixations are reported in the Appendix (Table A3). Because the raw total fixation durations for context and quantifier AOIs were highly skewed (skewness = 3.99 and 3.80, kurtosis = 30.66 and 29.79), we log-transformed total fixation durations before analysisFootnote 3. The distribution shapes before and after transformation are shown in Figure 3.
Boxplots showing distributions of raw total fixation duration (top panels) and log total fixation duration (bottom panels) on the context (light grey) and quantifier (dark grey) AOIs across Experiments 1 (left panels) and 2 (right panels).
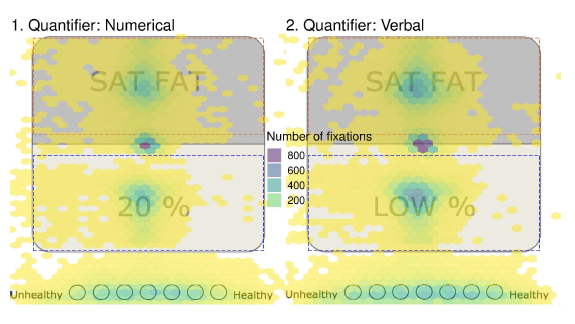
Fixation density plot illustrating the combined number of fixations on context (depicted above, AOI superimposed in orange) and quantifier (depicted below, AOI superimposed in blue) AOIs across participants for trials with numerical labels (left) vs. verbal (right) in Experiments 1. Darker colouring indicates a greater number of fixations. Number of fixations was highly correlated with total fixation duration.
2.3.2 Are verbal quantifiers more intuitive than numerical quantifiers?
Our pre-registered hypothesis predicted that our proxy measure for less intuitive processing — longer total fixation durations — would be greater for numerical quantifiers than verbal ones. Contrary to this, participants fixated longer in total on the quantifier AOIs for verbal than numerical quantifiers (F(1, 6637) = 40.23, p < .001). The means, standard deviations, and 95% confidence intervals of raw and log total fixation durations to the quantifier AOI for each format are shown in Table 1.
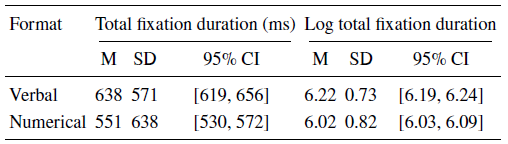
Note. Total fixation durations to quantifier AOIs were on average about 20% of the total fixation duration (on all areas) in a trial, and 16% of total trial decision time.
As total fixation duration on the quantifier AOI was correlated with the length of the quantifier (raw total fixation duration: r = .05, log total fixation duration: r = 0.08, both ps < .001), we conducted additional checks to ascertain if this was an artefact of the typically longer verbal quantifier lengths compared to numerical. The effect was still significant when we controlled for character length as a covariate in the analysis (F(1, 6636) = 16.04, p < .001). However, the effect size of the difference between verbal and numerical quantifiers was reduced, from Cohen’s d = 0.52 to 0.19 in the analysis controlling for character length, indicating that the longer verbal quantifier length was at least in part responsible for increasing the total fixation duration. We had expected longer total fixations to indicate analytical processing. This measure sums up all the fixations within an AOI, so may not take into account the possibility that a higher number of short fixations would be required for pre-attentive scanning processes (Velichkovsky et al., 1996, 2000) Therefore, in addition to the pre-registered analysis, we conducted exploratory analyses to ascertain if we would find the same pattern of results using different measures for intuitive processing (Reference EvansEvans, 2008; Reference Fiedler and GlöcknerFiedler & Glöckner, 2012; Reference Horstmann, Ahlgrimm and GlöcknerHorstmann et al., 2009; Reference Velichkovsky, Dornhoefer, Pannasch and UnemaVelichkovsky et al., 2000). We complemented our analyses of total fixation time by testing the effect of quantifier format on trial response times, total duration of all fixations for a trial (including those outside the AOI, for example, fixations on the judgement rating scale), and average duration of fixations on the quantifier AOIs.
Trial response times were slightly greater for the verbal labels, but not significantly different from the numerical labels (M verbal = 3.72s, SD = 2.05, M numerical = 3.67s, SD = 2.20; F(1, 7093) = 0.95, p = .330). A similar pattern was found for total trial fixation duration (M verbal = 2.97s, SD = 1.59, M numerical = 2.91s, SD = 1.74; F(1, 7102) = 2.22, p = .137). The average fixation durations on the quantifier AOI were higher for verbal than numerical quantifiers (M verbal = 214ms, SD = 99; M numerical = 202ms, SD = 131). As with the analyses on total fixation duration, we ran the analysis on log average duration of fixations to account for the high skew of the dataFootnote 4. We did not find a significant difference in the log average duration of fixations on the verbal quantifier AOI (M = 5.33, SD = 0.36) compared to the numerical quantifier AOI (M = 5.32, SD = 0.43; F(1, 6629) = 2.04, p = .153). Our exploratory analyses therefore did not indicate a difference in the level or processing involved with verbal vs. numerical quantifiers.
2.3.3 Do verbal and numerical quantifiers affect focus on contextual information?
Our pre-registered hypothesis regarding fixation duration for the context predicted an interaction effect between format and context valence, where we expected participants to fixate longer on positive nutrients for verbal than numerical quantifiers (and vice versa). We found an interaction, but the pattern was different from expected. Our data showed that participants fixated longer in total on the context AOIs described with a verbal than numerical quantifier (main effect; F(1, 6940) = 15.65, p < .001). The significant interaction effect (F(1, 6937) = 4.02, p = .045) showed that the longer fixations to context AOIs with verbal than numerical formats was more pronounced for negative nutrients (F(1, 6937) = 19.49, p < .001) than positive nutrients (F(1, 6937) = 5.14, p = .023). Table 2 reports the means, standard deviations, and 95% confidence intervals for raw and log total fixation durations for the context AOI in each condition.
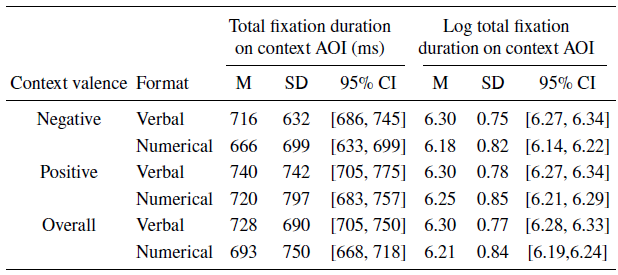
Note. Fixations to the context AOIs were about 24% of the total fixation durations in a trial.
As an exploratory robustness check, we also ran an analysis on the log average duration of fixations to the context (nutrient) AOI. This analysis found no significant difference between the (log) average duration of each fixation to the context AOI for verbal (F(1, 6932) = 0.15, p = .702). The differences in fixation patterns for the context AOI thus appeared to be driven by more frequent fixations of short duration for verbal quantifiers, rather than fixations of longer duration — indicating that this area was scanned more, but not necessarily with a deeper level of processing.
2.3.4 Do different fixation durations on the context result in more polarised judgements for verbal than numerical quantifiers?
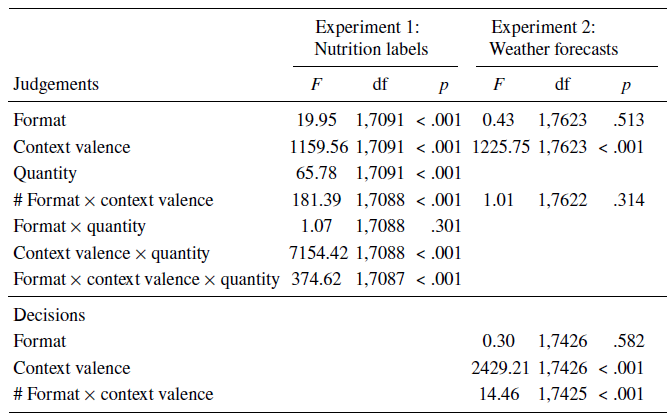
As predicted, we found an interaction effect between format and context valence for healthiness judgements (see Figure 5). Participants judged positive nutrients healthier with verbal than numerical quantifiers, but negative nutrients less healthy with verbal than numerical quantifiers (F(1, 7088) = 181.39, p < .001). This effect was better explained by a significant three-way interaction between format, context valence, and quantity (F(1, 7087) = 374.62, p < .001). As shown by the differences in healthiness judgements between verbal and numerical quantifiers in Table 3, participants consistently rated labels with overall positive valence (e.g., ‘low fat’ or ‘high minerals’) as healthier in verbal than numerical format, but labels with overall negative valence (e.g., ‘low minerals’ or ‘high fat’) as healthier in numerical than verbal format — indicating that they modified the valence of the nutrient according to how much there was of it.
Differences in mean participant judgements of the food labels in Experiment 1 with verbal and numerical quantifiers (x-axis) of positive and negative nutrients (green circles and purple triangles) at each quantity (low/20%, med/40%, and high/70%). Error bars reflect 95% confidence intervals.
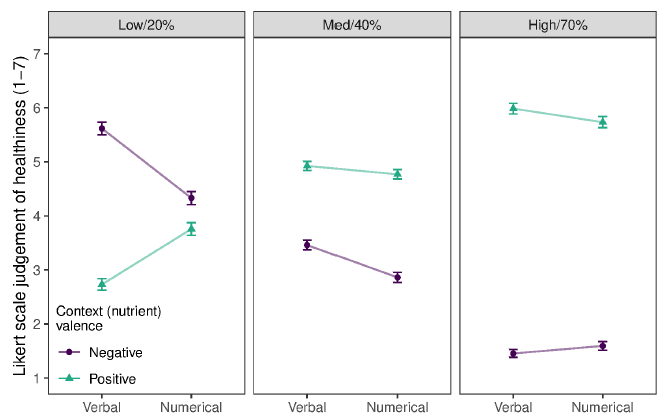
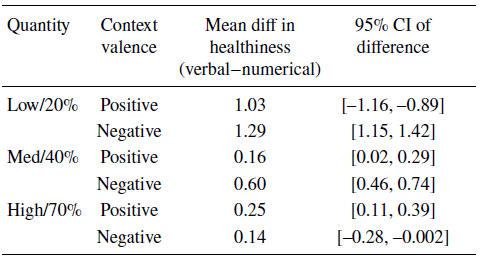
Note. Healthiness judgements were made on a 1–7 Likert scale.
Our moderated mediation analysis tested whether (log) total fixation duration for the context AOI mediated the effect of format on judgements. There was a significant mediation for high/70% labels, shown by a significant indirect effect of format on healthiness judgements through participants’ fixations on the nutrient (b = 0.01, 95% CI [0.002, 0.02]). This indicated that for large quantities, the increased fixation duration on the nutrient with verbal quantifiers (compared to numerical) led to participants judging negative nutrients less healthily and positive nutrients more healthily. However, we did not find the corresponding mediation with low/20% and medium/40% quantities (b low = 0.01, 95% CI [–0.001, 0.01]; b med = 0.001, 95% CI [–0.004, 0.01]). The correlation coefficients for all paths in the mediation analysis (illustrated in Figure 2) are reported in the Appendix (Table A4).
2.4 Discussion
Overall, Experiment 1 suggested that people were not more intuitive in processing information with verbal quantifiers, but people fixated for longer on the context with verbal compared to numerical quantifiers. This could have resulted in people making more polarised judgements with verbal quantifiers (e.g., high protein is more positive than 70% protein, whereas high fat is more negative than 20% fat). However, it was also possible that individuals interpreted the verbal quantifiers differently for each nutrient context, and not in the same way as the numerical quantifiers. This is especially since foods tend to possess different base rates of occurrence for each nutrient, which could affect the interpretation of verbal quantifiers (Reference Weber and HiltonWeber & Hilton, 1990). It was therefore necessary to replicate Experiment 1 in a scenario where the quantifiers were equally likely to occur for all contexts.
To build on our findings while addressing the limitations of Experiment 1, we designed a second experiment to test in a different context (weather forecasts) whether verbal quantifiers (compared to numerical) would result in more focus on the context and thus more polarised judgements and decisions. Specifically, we predicted the following:
(1) Participants would fixate longer on the weather event (context) in a forecast when the forecast probability (quantifier) was verbal than numerical.
(2) Compared to numerical forecasts, verbal forecasts would lead to participants showing a bigger difference between judgements of sunny and rainy forecasts (larger effect of valence), and making decisions more in line with the valence of the forecasted event (e.g., more decisions to bring an umbrella with a rainy forecast).
3 Experiment 2
Experiment 2 made three methodological improvements to Experiment 1. First, bearing in mind that people vary in their individual interpretations of verbal quantifiers (Reference Budescu and WallstenBudescu & Wallsten, 1985) and interpreations across contexts (e.g., Reference Patt and SchragPatt & Schrag, 2003; Reference PierceyPiercey, 2009; Reference Weber and HiltonWeber & Hilton, 1990), we controlled for this by having participants provide their own numerical interpretations of verbal probabilities in each context (sun and rain). This ensured that participants would see the verbal and numerical quantifiers as equivalent. Second, we used an image of a weather event instead of a verbal descriptor so that the context would be neither verbal nor numerical in presentation. Third, we measured participants’ judgements as well as decisions, to ascertain whether these would correspond.
We piloted the revised procedures on 25 participants and used this data to select two visual stimuli and three verbal probability phrases for the weather forecasts. Details of the pilot study are documented and shared on the OSF.
3.1 Method
3.1.1 Participants
We recruited 137 participants from a university participant pool, who received either course credit (for psychology undergraduates) or £5 for participation. Four participants were dropped due to corrupted data files in the process of data collection, leaving data from 133 participants (age range: 18–54 years, M = 23.14, SD = 5.43; 66% female). Prior to data collection, we ran 1000 simulations of all sample sizes between 130 and 150 and number of trials between 96 and 108 for a multilevel analysis with fixed and random parameters from Experiment 1. In the simulation, a sample of 133 participants with 108 trials would have 83% power to detect an effect of format. We checked if participants often consulted weather forecasts: on a seven-point scale (1: not at all, 7: very often), the mean of our sample was 5.14 (SD = 1.73), indicating that our sample was generally familiar with weather forecasts.
3.1.2 Design
We tracked participants’ eye movements as they viewed 120 weather forecasts that consisted of an image depicting the weather event (sun or rain) and the probability of its occurrence (verbal or numerical, three probability levels). The 120 trials comprised of the crossing of 4 variables, with five trials per condition: 2 (format: verbal or numerical) × 2 (forecast: sun [positive valence] or rain [negative valence]) × 3 (probability: possible, likely, or very likely). These trials were repeated twice: in one set, participants made a judgement; in the other set, participants made a decision. They therefore saw 120 trials in total, in a fully within-subjects design.
3.1.3 Materials and procedure
The initial procedure and calibration of the EyeLink1000 was the same as Experiment 1, except that the screen resolution of the PC was set to 1920×1080. Participants performed three tasks: translation, judgement, and decision (see Figure 6). All tasks were presented using Psychtoolbox-3 in MatLab (The MathWorks, 2017).
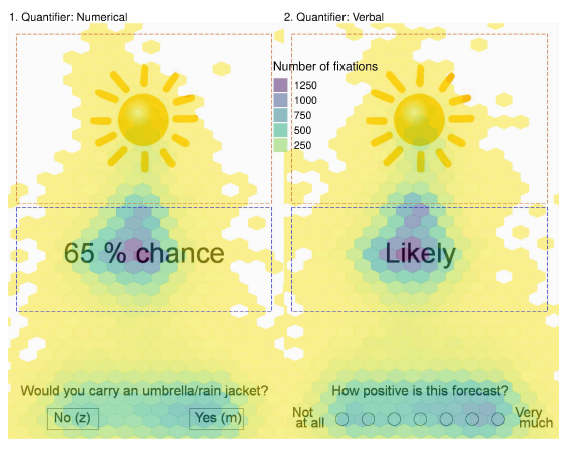
Procedure for the translation task (top panel), judgement task (bottom left panel), and decision task (bottom right panel) in Experiment 2, showing an example of a ‘likely’ sunny forecast with numerical values provided by a participant in the translation task. The pre-trial fixation dot was in the centre of the screen, equidistant between the weather image and quantifier.
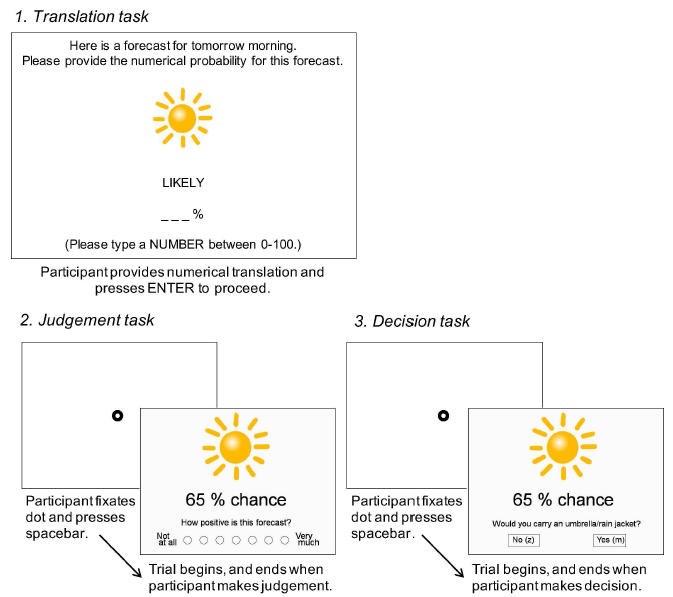
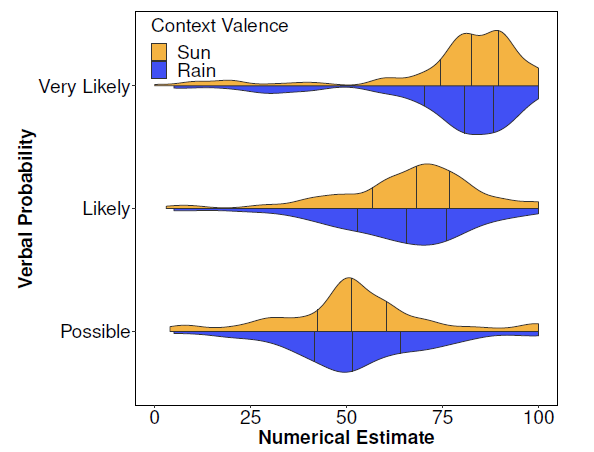
To derive equivalent probabilities for the verbal and numerical probabilities, each participant first provided a percentage numerical translation of each of the three verbal probability forecasts for sun and rain using the number keys: sun possible, sun likely, sun very likely, rain possible, rain likely, and rain very likely (see top panel of Figure 6). This resulted in six numerical probability translations shown in Figure 7.Footnote 5 This procedure meant that we could account for the fact that individuals interpret verbal probabilities differently between individuals and as a function of the nature of the event (Reference Budescu, Por and BroomellBudescu, Por & Broomell, 2012; Reference Patt and SchragPatt & Schrag, 2003; Reference Smits and HoorensSmits & Hoorens, 2005). We later displayed these translations to participants in the numerical condition of the judgement and decision tasks.
Smoothed violin plots showing the distribution of numerical probability translations provided by participants for three verbal probabilities (possible, likely, and very likely) in the context of sun (orange) and rain (blue).
After providing their translations, participants read instructions for the judgement task, which stated that they were to judge how positive they thought each forecast was, with each forecast specifying an independent hypothetical event. The instructions specified that the forecast would be for 10–11am the next morning, and would give them a likelihood of the weather being either sunny or rainy. A trial began with a fixation dot appearing in the centre of the screen. Participants fixated the dot and pressed the spacebar to begin the trial.
Based on the pilot study, we designed two types of forecasts with a weather image to depict the weather event: sun or rain (see the Appendix, Figure A2, for the images used). Each forecast consisted of the weather image and a probability of its occurrence. The image was sized at 250×250px and positioned such that the bottom edge of the picture was 100px above the midline of a screen with resolution 1920×1080, resulting in a visual angle of approximately 13º by 4º. In the verbal condition, the probability for the forecast was possible, likely, or very likely. In the numerical condition, the probability was X% chance, where X was the number that participants had provided during the translation task. This presentation for the numerical probabilities was chosen so that the length of the probabilities was similar in verbal and numerical condition. The probability was presented in 48-point Arial font, with the top edge of the characters 100px below the midline. We kept this display constant for all participants because the counterbalanced condition is unusual in a weather forecasting context.
We measured participants’ eye fixations during the trial within two AOIs: the weather image and the probability. Each AOI spanned 295px to the left and right of the horizontal centre. The weather AOI was defined as starting five pixels above the vertical centre and ending five pixels above the image. The probability AOI mirrored the weather AOI below the vertical centre. Each AOI was thus subtended by approximately 20 by 12 degrees of visual angle.
Participants made their judgements by clicking with the mouse on a seven-point Likert scale at the bottom of the screen (not at all positive on the left, very much on the right). The trial ended once they made their judgement. Participants performed four practice trials for the judgement task based on the following forecast probabilities: probable, unlikely, slight chance, good chance.
Participants then read instructions for the decision task, where they were to decide based on the forecast (also for 10–11am the next morning) whether to bring an umbrella or rain jacket. The procedure and forecasts for the decision trials were the same as for the judgement trials, except participants pressed the z key to decide ‘no’ and the m key for ‘yes’, and the trial ended once they had made their decision. Participants performed four practice trials for the decision task using the same training forecasts as for the judgement task practice. They then had the chance to ask questions about the procedure before moving on to the experimental trials.
In the experimental judgement and decision trials, participants were randomly assigned to either the verbal or numerical condition first. In each condition, they completed 30 judgement trials first, followed by 30 decision trials (3 probabilities × 2 weather events × 5 trials). Participants were given a break between blocks of trials. If the participant moved their head during the break, the experimenter performed another calibration check.
At the end of the experimental task, participants completed an online questionnaire that assessed socio-demographic information and whether they consulted weather forecasts.
3.2 Variables and analysis strategy
To measure fixations to the context, we focused on total fixation duration to the weather AOI, after excluding trials where participants had no fixations on either AOI (5% of trials). To measure polarisation of judgements and decisions, we analysed participants’ responses to the forecasts. We tested our hypotheses in a multilevel model in SPSS (using a linear regression function for judgements and a generalised linear regression with a binomial link function for decisions). The models included format (verbal or numerical) and weather valence (sun [positive] or rain [negative]) as fixed factors, and individual intercepts and slopes as random factors.Footnote 6
To test the extent to which total fixation duration on the context AOI explained judgements and decisions, we pre-registered secondary mediation analyses using the PROCESS macro for SPSS (Model 5; Reference HayesHayes, 2013). This model, illustrated in Figure 2, tested the effect of format on decision as mediated by fixations to the context and moderated by context valence.
The results reported herein focus on the pre-registered hypotheses. The full multilevel model and mediation analyses are reported, respectively, in Tables A1-A4.
3.3 Results
3.3.1 General fixation and judgement patterns
Participants spent on average 140.39ms (SD = 330.04) per trial fixating on the context (weather image) AOIs, and 765.79ms (SD = 570.06) per trial fixating on the quantifier (probability) AOIs. These were approximately 6% and 35% of total trial fixation durations respectively — reflecting a greater proportion of fixations to the quantifier AOI and a much smaller proportion of fixations to the context AOI compared to Experiment 1. The right top panel of Figure 3 shows the distribution of participants’ fixation durations on each of these AOIs. We log-transformed fixation durations before analysis to account for the skewed distributions.Footnote 7 The distribution shapes after transformation are shown in the bottom right panel of Figure 3. Figure 8 illustrates the fixation patterns across different areas of the stimulus screen for the verbal and numerical conditions.Footnote 8
Fixation density plot illustrating the combined number of fixations on context (depicted above, AOI superimposed in orange) and quantifier (depicted below, AOI superimposed in blue) AOIs across participants for trials with numerical labels (left) vs. verbal (right) in Experiment 2. An example of a decision trial is shown on the left and an example of a judgement trial on the right. Participants saw equal numbers of each response trial for all conditions. Darker colouring indicates a greater number of fixations. Number of fixations was highly correlated with total fixation duration.
3.3.2 Do people fixate longer on the context with verbal than numerical quantifiers?
As shown in Table 4, participants’ total (raw and log) fixation durations on the weather AOI was greater per trial for the verbal than numerical forecasts. The difference between forecast formats was about 5% of the total time participants spent fixating in a trial (2.19s), reflecting an overall less time spent on the context AOI. Nonetheless, as we expected, the multilevel model analysis of log total fixation durations for the context AOI showed that participants had significantly longer fixations on the weather image when it was paired with a verbal vs. a numerical probability (F(1, 5382) = 4.36, p = .037).
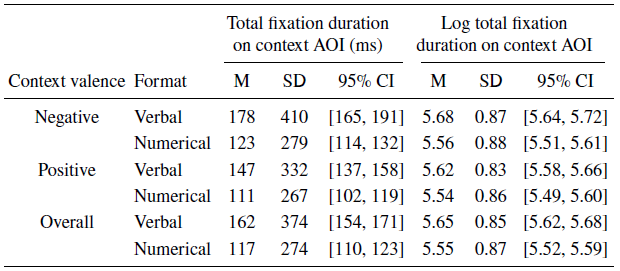
Although the pairwise difference between total fixation time on weather images for verbal and numerical was greater for negative forecasts (F(1, 5381) = 5.35, p = .021) than positive forecasts (F(1, 5381) = 1.42, p = .233), this interaction effect was not significant (F(1, 5381) = 1.03, p = .311).
We exploratorily replicated the analyses using an alternative measure, the log average duration of fixations to the context AOI, and found the same pattern of results: fixations on the context were on average longer for verbal than numerical forecasts, but this difference was not significant (F(1, 5381) = 2.31, p = .129).
3.3.3 Did differences in context fixation time result in more polarised judgements for verbal than numerical quantifiers?
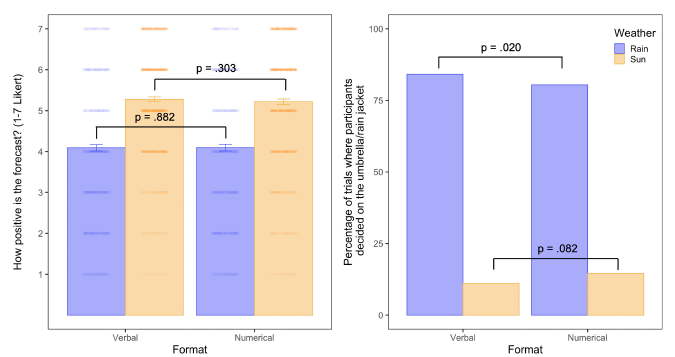
As shown in Figure 9, participants judged the sunny forecast more positively than the rainy one, and were more likely to take protective equipment (rain jacket or umbrella) for the rainy forecast. We expected that the longer fixations on the context (i.e., the weather image) with verbal quantifiers would accentuate the effect of the weather event’s valence. Therefore, we hypothesised an interaction between format and context valence on participants’ judgements and decisions from the forecast, with judgements and decisions in the verbal condition being more polarised (i.e., more extreme responses) than in the numerical condition. This was not the case for participants’ judgements (F(1, 7622) = 1.01, p = .314). However, the interaction was significant for participants’ decisions (F(1, 7425) = 14.46, p < .001). When rain was forecasted, people were more likely to bring rain protection with a verbal than a numerical forecast (F(1, 7425) = 5.45, p = .020); when sun was forecasted, however, there was no significant difference between the formats on people’s decisions (F(1, 7425) = 3.03, p = .082).
Distributions of participants’ perceptions of how positive the forecast was (left) and their decision to bring an umbrella/rain jacket (right) as a function of format and context valence of the weather forecast in Experiment 2. In the left panel (judgements), dots show the distribution of participant responses on the Likert scale points, with denser scatters indicating higher number of responses. Error bars reflect 95% confidence intervals around mean judgements. The p-values of pairwise comparisons between verbal and numerical formats is shown for each weather context (sun and rain).
3.3.4 Did longer fixations on the weather image mediate decisions?
In the moderated mediation analysis, the verbal quantifier format showed the predicted increase for log total fixation duration to the weather image compared to the numerical format. However, log total fixation duration was not significantly correlated with decisions (b = −0.04, 95% CI [–0.10, 0.03]). We found no significant mediation of the format effect on decisions by log total fixation duration, as measured by an estimate of the indirect effect (b = -0.001, 95% CI [–0.01, 0.01]). All beta coefficients for the pathways in the moderated mediation model (illustrated in Figure 2) are reported in the Appendix (Table A4).
In summary, Experiment 2 supported two hypotheses derived from Experiment 1: verbal quantifiers increased fixation durations on the context, and decisions were more polarised for verbal than numerical quantifiers. However, we did not find that judgements about the forecasts were similarly polarised, and fixation duration on the context AOI did not significantly mediate the effect of format on participants’ decisions to act based on the forecast.
4 General discussion
The goal of our studies was to provide process-tracing evidence via eye fixations to evaluate two explanations for how people respond to verbal vs. numerical quantifiers. First, we considered if people used verbal quantifiers more intuitively (i.e., quicker and with less processing effort) compared to numerical quantifiers, which could amplify judgement and decision-making biases (Reference Windschitl and WellsWindschitl & Wells, 1996). Second, we considered if verbal quantifiers emphasised contextual information compared to numerical quantifiers, which could amplify the role of context in judgements and decisions (Reference Moxey and SanfordMoxey & Sanford, 1993). Our findings are more in line with the second explanation: for the same context (whether it was a nutrient in Experiment 1 or a weather image in Experiment 2), participants spent longer fixating on it when it was paired with a verbal vs. numerical quantifier. Participants also did not fixate for longer on numerical than verbal quantifiers, suggesting that they were not processing the verbal quantifiers more intuitively.
4.1 Are verbal quantifiers more intuitive than numerical quantifiers?
Despite the popular assumption that verbal quantifiers are easier to use (Reference Wallsten, Budescu, Zwick and KempWallsten et al., 1993), we did not find evidence that they were more intuitively processed. To the contrary, Experiment 1 found that participants spent longer fixating on verbal than numerical quantifiers — suggesting more cognitive effort in processing them (e.g., Reference Grant and SpiveyGrant & Spivey, 2003; Reference Horstmann, Ahlgrimm and GlöcknerHorstmann, Ahlgrimm & Glöckner, 2009). This could be explained by verbal quantifiers being typically longer than numerical ones (in this case, by one or two characters). Typically, small differences in character lengths should be mitigated by the tendency for people to identify words as a unit rather than by each letter (Reference HealyHealy, 1976). In contrast, people need to identify each numerical unit individually (Reference Orquin and LooseOrquin & Loose, 2013), so should need more reading time for numbers of the same character length as words. Yet when we repeated our analyses with character length held constant, we found a reduced effect, meaning that the additional characters in the words did contribute to longer total fixation times.
An alternative possibility is that the measure we used, the total fixation duration, did not distinguish between the number of fixations and their average respective duration. For example, total fixation duration would be the same for a larger number of shorter fixations that reflect more scanning of the information rather than a smaller number of longer but more attentive fixations (see, e.g., Velichkovsky et al., 2000, for a discussion of fixation time distributions with different levels of processing). If verbal quantifiers did receive such shorter but more numerous fixations and numerical quantifiers fewer but longer ones, we should see longer average fixation durations in trials with numerical quantifiers. However, our exploratory analysis using this measure did not find significant differences between the quantifiers. We also conducted exploratory analyses on other measures that might indicate intuitive processing, such as the overall response time, and the total fixation duration per trial. These analyses also found no evidence that participants differed in the amount of time they spent making judgements in verbal vs. numerical conditions. We therefore find no evidence to support more intuitive processing of verbal than numerical quantifiers.
4.2 Do verbal quantifiers focus one’s gaze on contextual information?
Both our experiments showed that participants spent more time in total fixating on the context — the nutrient in Experiment 1 and the weather image in Experiment 2 — when it was paired with a verbal vs. a numerical quantifier. Interestingly, an exploratory analysis of the average duration of fixations indicated that the same text or image received more fixations in total with a verbal quantifier, rather than each fixation lasting for longer. This suggests that participants spent more time processing the contexts in the verbal condition, but this was not necessarily more effortful.
We found the same pattern of results for total fixation time on the context when it was presented as text and as an image. Therefore, the greater total fixation time on the context for verbal compared to numerical quantifiers was not simply due to the context information being presented in the same format as one quantifier (e.g., nutrient and verbal quantifier both in text) but not the other. Further, because we always compared the same context across quantifiers (e.g., ‘SUGAR’ in Experiment 1 or an image of rain in Experiment 2), there were no inherent differences in stimuli characteristics (e.g., word length or alphabets vs. numbers) across format conditions that would could explain differences in participants’ fixation patterns. Neither did participants reduce the time they spent fixating on the quantifier in order to fixate on the context. Our results thus indicate that the verbal quantifiers did prompt participants to give more fixation time overall to the context.
Our findings provide process evidence that contextual information is integrated more into a judgement with verbal quantifiers than numerical quantifiers. This is in line with research that highlights the importance of context in processing verbal quantifiers (e.g., Moxey, 2017; Reference Teigen and BrunTeigen & Brun, 2000; Reference Sanford, Dawydiak and MoxeySanford, Dawydiak & Moxey, 2007). For instance, other work has found that more of the context is readily remembered and people pick up on contextual changes more with verbal than numerical quantifiers (Reference MoxeyMoxey, 2017; Reference Moxey and SanfordMoxey & Sanford, 1993). We add to the existing literature by showing that with verbal quantifiers (compared to numerical), not only do people spend more time looking at the context, they also spend more time looking at the (verbal) quantifier. Therefore, it seems more plausible that verbal quantifiers are a signal to pay attention to all the information holistically, rather than a prompt to take a shortcut in reaching a judgement or decision. However, one limitation to consider is that participants had no restriction on the amount of time they could spend processing the information in order to respond. If such a limit were set in future, such that participants have to divide their time between processing the quantifier and the context, a different pattern could emerge.
The process by which the context is integrated into decision-making may indeed be intuitive. We did not find evidence that greater fixation times were accompanied by longer durations per fixation that would have indicated deeper levels of processing. Overall, our evidence on a number of other measures does not point towards more intuitive processing for verbal quantifiers, but it should be noted that according to some accounts, a greater sensitivity to the context is consistent with elements of intuition (Reference EvansEvans, 2008). For example, the intuitive system is often characterised as involving prior knowledge and beliefs to contextualise a problem. Intuition can also rely on different judgement processes that lead to different correlates of intuition being observed (Reference Glöckner and WittemanGlöckner & Witteman, 2010). In one conception of intuition, people sample information more quickly during the judgement process, resulting in shorter decision times; in another, people draw from associated knowledge to form mental representations of the task at hand, resulting in greater use of contextual information (Reference Glöckner and WittemanGlöckner & Witteman, 2010). It is possible that verbal quantifiers support some of these aspects and processes in intuition, but not all.
4.3 How do verbal and numerical quantifiers affect judgements and decisions?
We compared participants’ fixations on contextual information paired with verbal and numerical quantifiers to test models of judgement and decision-making that predict similar end outcomes: the same judgements and decisions with the same quantity would more strongly match the contextual valence when this quantity is verbal vs. numerical. However, participants’ judgements and decisions were not clear-cut. In Experiment 1, participants judged the same positive information (e.g., ‘high % minerals’) as more positive than the average numerical translation (e.g., ‘70% minerals’), and vice versa for negative information (e.g., ‘low % fat’ was more positive than ‘20% fat’). This effect of quantifier format on judgements on the weather was not replicated in Experiment 2, but despite judging the verbal and numerical forecasts similarly, participants were still more likely to take avoiding action against rain for the verbal probability than the same numerical one. Thus, given forecast probabilities participants themselves indicated to be equivalent, participants decided to act more with the verbal quantifier.
The difference in findings between experiments could mean that participants in Experiment 1 perceived the verbal quantifiers to mean different numerical amounts than those shown (e.g., that a high % referred to less than 70%), and so their judgements simply reflected the difference in interpretation. We believe this is not the case because participants consistently perceived high amounts of positive nutrients to be healthiest for both quantifier formats. Since participants likely believed larger amounts of protein were healthier, if they interpreted ‘high %’ as less than 70%, we should have observed (but did not) that large numerical quantities of protein were not as healthy as verbal ones. However, we cannot rule out the possibility that this did drive differences for the ‘low %’ vs. ‘20%’ judgements.
An alternative explanation is that the judgements in the experiments reflect different levels of objectivity. Evaluating the healthiness of food requires one to consider an objective nutritional standard, whereas judging the weather is more subjective for the individual. Deciding whether one needs rain protection, however, does require one to consider objectively if one will get wet. Therefore, taken together, the experimental findings suggest that quantifier format would influence people’s objective judgements and decisions even when the quantities are equivalent.
Our results for context fixation durations and judgement and decision patterns broadly align with the idea that context plays a more important role with verbal quantifiers. Therefore, it is surprising that our mediation analyses did not support this explanation. We found only one instance (large nutrient quantities) where fixation duration on the context AOI accounted for more extreme judgements with verbal vs. numerical quantifiers. Longer fixations on the context are thus unlikely to be the main driver of differences in judgement and decisions between the quantifier formats. Instead, the fact that participants also fixated for longer on the verbal quantifier than the numerical might show how people use verbal quantifiers practically when considering information to guide their decisions (Reference Horn and WardHorn & Ward, 2006).
Our results found that both context and quantifier AOIs received longer fixations with verbal than numerical quantifiers. These longer fixations may be a function of the additional linguistic properties of verbal quantifiers. For example, verbal quantifiers put a focus on the presence or absence of an attribute in the context (Reference Teigen and BrunTeigen & Brun, 2000; Reference Sanford and MoxeySanford & Moxey, 2003). For instance, rain being likely may highlight the occurrence of rainy weather more than a 60% chance of rain (Reference Teigen and BrunTeigen & Brun, 2000). One might thus attend to the verbal quantifier to infer information: low % protein indicates protein is absent, as opposed to 20% protein, which focuses on protein being present (Reference Teigen and BrunTeigen & Brun, 2000). The choice of verbal quantifier could also reveal inferences about the action one should take from the information (Reference HiltonHilton, 2008; Reference KerenKeren, 2007; Reference Schmeltzer and HiltonSchmeltzer & Hilton, 2014; Reference van Buiten and Kerenvan Buiten & Keren, 2009). For example, people might infer that someone forecasting the probability of rain verbally is delivering a warning and therefore encouraging them to act. In the case of the nutrients, a similar consideration might apply to judging nutrition, which is a task that people generally find difficult and confusing (Reference Campos, Doxey and HammondCampos, Doxey & Hammond, 2011; Reference Miller, Cassady, Beckett, Applegate, Wilson and GibsonMiller et al., 2015; Reference WorsleyWorsley, 2002). High % protein might therefore provide more direction for judgement than an equivalent numerical amount of protein. Future research might examine whether varying the social circumstances prior to providing information (e.g., a weather forecaster vs. a website presenting the forecast) affects people’s fixation patterns, judgements, and decisions.
4.4 Implications for communicating information
A practical question following our findings is whether gaze and judgement and decision-making patterns for verbal and numerical quantifiers result in better decisions. One perspective on this is that equivalent information should not result in different decisions just because the format of that information is different. In line with this principle of invariance (Reference Tversky and KahnemanTversky & Kahneman, 1986), as long as people perceived the same probability of sun or rain, they should not have a different decision whether that probability is expressed in a different format. One could consider our participants to have violated this normative principle by deciding to bring an umbrella when rain was possible, but not doing so for an equivalent 40% chance of rain.
However, before concluding that verbal quantifiers lead to suboptimal decisions, the goal of the decision-maker should be taken into consideration. In practice, whether a difference in judgement (or decision) is better or worse should depend on the goal of the communication and the structure of the decision environment (Reference Gigerenzer and ToddGigerenzer & Todd, 1999; Reference SimonSimon, 1990). If the goal is to avoid getting wet, reacting to the possibility of rain would achieve that goal better than not reacting to the 40% chance of rain. Similarly, health issues surrounding food consumption in developed nations tend to revolve around overconsumption and its contribution to obesity (World Health Organization, 2016). From this standpoint, verbal quantifiers that encourage reduced consumption of fat and sugar could be beneficial (i.e., at medium and high levels). Conversely, where verbal quantifiers encourage increased consumption (i.e., low fat/sugar, which may be perceived as healthier than actual fact), the numerical quantifiers could be more beneficial.
Of course, one important practical consideration is that verbal and numerical quantifiers can be presented simultaneously (e.g., ‘5% fat, LOW’), or both presented on the same label but describing different nutrients (e.g., ‘5% fat, HIGH protein’). We did not test fixation patterns when both quantifier formats are present. Future research might wish to investigate whether verbal or numerical formats would take precedence in influencing visual gaze and judgement and decision-making patterns when both are present at the same time.
4.5 Conclusion
This work extends previous research on quantifier processing by using eye-tracking methodology to show that people’s judgement and decision processes differ when given verbal or numerical quantifiers. Verbal quantifiers led to longer total fixation durations on contextual information, and also more polarised judgements (in the case of nutrition labels) and decisions (in the case of weather forecasts). The findings show how simply changing the format of the quantifier can change how people process the information. This has implications for the communication of quantified information, as virtually all such communications, such as risk information, event forecasting, or news reporting place quantifiers in a differently valenced context. We suggest that the use of verbal or numerical quantifiers to communicate quantity information should depend on the goals and context of the communication.
5 Appendix
Example of a numerical protein label and judgement scale shown in four counterbalanced viewing conditions. Participants were randomly assigned to one of the four viewing conditions.
Experimental stimuli (rain and sun) used in Experiment 2.

Note. For Experiment 1, the multilevel models used format, context (nutrient) valence, and quantity and their interactions as fixed factors, and random slopes with by-participant random intercepts for format and context valence. For Experiment 2, the multilevel model used format and context (weather) valence and their interaction as fixed factors, and random slopes with by-participant random intercepts for format and context valence. All models entered first main effects, then second-order interactions, and finally third-order interactions into the analysis.
Note. The models used format, context (nutrient) valence, and quantity and their interactions as fixed factors, and random slopes for format with by-participant random intercepts. A linear mixed-effects model was used for judgements, and a logistic mixed-effects model with a binomial link function for decisions. All models entered first main effects, then second-order interactions, and finally third-order interactions into the analysis.
Note. For Experiment 1, the multilevel models used format, context (nutrient) valence, and quantity and their interactions as fixed factors, and by-participant random intercepts. For Experiment 2, the multilevel model used format and context (weather) valence and their interaction as fixed factors, and random slopes for format and context valence with by-participant random intercepts. All models entered first main effects, then second-order interactions, and finally third-order interactions into the analysis.
Note. A negative coefficient for format indicates lower values for the numerical as compared to verbal condition. For an illustration of the direct and indirect pathways described in this table, see Figure 2.


 Open access