




No CrossRef data available.
Article contents
- Abstract
- A shared genetic pathway patterns large epidermal cells in sepals and leaves
- Cell size heterogeneity is a whole-leaf feature, not an abaxial curiosity
- Testing randomness in a cellular lattice requires a null model that preserves cell geometry
- When a pattern becomes non-random without changing contacts
- A minimal stochastic model links gene-expression noise, cell-cycle decisions and tissue growth
- What to take forward in computational morphodynamics
- Open peer review
- Competing interest
- Data availability statement
- Author contributions
- Funding statement
- Footnotes
- References
How stochastic cell fate and endoreduplication yield non-random epidermal patterns
Part of:
Computational Morphodynamics
Published online by Cambridge University Press: 10 April 2026
Article contents
- Abstract
- A shared genetic pathway patterns large epidermal cells in sepals and leaves
- Cell size heterogeneity is a whole-leaf feature, not an abaxial curiosity
- Testing randomness in a cellular lattice requires a null model that preserves cell geometry
- When a pattern becomes non-random without changing contacts
- A minimal stochastic model links gene-expression noise, cell-cycle decisions and tissue growth
- What to take forward in computational morphodynamics
- Open peer review
- Competing interest
- Data availability statement
- Author contributions
- Funding statement
- Footnotes
- References
Abstract

Pavement cells in the Arabidopsis thaliana epidermis span a wide range of sizes and ploidy levels, but rules that generate this heterogeneity across an organ remain unclear. Clark et al. identify a shared genetic pathway that promotes large, polyploid pavement cells in both sepals and leaves, then ask whether the familiar “scattered” distribution of giant cells is truly random. By combining whole-tissue imaging with two independent computational randomization approaches that regenerate tissues from segmented images while preserving cell size distributions and key boundary constraints, together with a stochastic cell-autonomous model, the authors show how an initially random pattern can later appear clustered relative to a changing random baseline as tissues grow and subdivide. The study provides a quantitative framework for testing spatial organization in cellular mosaics where point-based methods fail, and it shows how proliferation history can convert early stochastic fate decisions into a statistically non-random mature pattern.
Information
- Type
- Insights
- Information
- Creative Commons

 This is an Open Access article, distributed under the terms of the Creative Commons Attribution licence (https://creativecommons.org/licenses/by/4.0), which permits unrestricted re-use, distribution and reproduction, provided the original article is properly cited.
- Copyright
- © The Author(s), 2026. Published by Cambridge University Press in association with John Innes Centre
Footnotes
Associate Editor: Dr. Daphné Autran
References
Clark, F. K., Weissbart, G., Wang, X., Harline, K., Li, C.-B., Formosa-Jordan, P., & Roeder, A. H. K. (2025). A common pathway controls cell size in the sepal and leaf epidermis leading to a nonrandom pattern of giant cells. PLOS Biology, 23(11), e3003469. https://doi.org/10.1371/journal.pbio.3003469
Google Scholar
Clark, P. J., & Evans, F. C. (1954). Distance to nearest neighbor as a measure of spatial relationships in populations. Ecology, 35(4), 445–453.Google Scholar
Hervieux, N., Dumond, M., Sapala, A., Routier-Kierzkowska, A.-L., Kierzkowski, D., Roeder, Adrienne, H. K., Smith, Richard, S., Boudaoud, A., & Hamant, O. (2016). A mechanical feedback restricts sepal growth and shape in Arabidopsis. Current Biology, 26(8), 1019–1028. https://doi.org/10.1016/j.cub.2016.03.004
Google Scholar
Horiguchi, G., & Tsukaya, H. (2011). Organ size regulation in plants: Insights from compensation [Mini Review]. Frontiers in Plant Science, 2. https://doi.org/10.3389/fpls.2011.00024
Google Scholar
Katagiri, Y., Hasegawa, J., Fujikura, U., Hoshino, R., Matsunaga, S., & Tsukaya, H. (2016). The coordination of ploidy and cell size differs between cell layers in leaves. Development, 143(7), 1120–1125.Google Scholar
Kawade, K., & Tsukaya, H. (2017). Probing the stochastic property of endoreduplication in cell size determination of Arabidopsis thaliana leaf epidermal tissue. PloS One, 12(9), e0185050. https://doi.org/10.1371/journal.pone.0185050
Google Scholar
Kuan, C., Yang, S.-L., & Ho, C.-M. K. (2022). Using quantitative methods to understand leaf epidermal development. Quantitative Plant Biology, 3, e28. https://doi.org/10.1017/qpb.2022.25
Google Scholar
Laruelle, E., & Genovesio, A. (2022). Non-Convex Cell Epithelial Modeling Unveils Cellular Interactions. In 2022 IEEE 19th International Symposium on Biomedical Imaging (ISBI) (pp. 1–5). IEEE. https://doi.org/10.1109/ISBI52829.2022.9761452
Google Scholar
Laruelle, E., Spassky, N., & Genovesio, A. (2020). Unraveling spatial cellular pattern by computational tissue shuffling. Communications Biology, 3(1), 605. https://doi.org/10.1038/s42003-020-01323-3
Google Scholar
Li, X.-M., Jenke, H., Strauss, S., Bazakos, C., Mosca, G., Lymbouridou, R., Kierzkowski, D., Neumann, U., Naik, P., Huijser, P., Laurent, S., Smith, R. S., Runions, A., & Tsiantis, M. (2024). Cell-cycle-linked growth reprogramming encodes developmental time into leaf morphogenesis. Current Biology, 34(3), 541–556.e15. https://doi.org/10.1016/j.cub.2023.12.050
Google Scholar
Melaragno, J. E., Mehrotra, B., & Coleman, A. W. (1993). Relationship between endopolyploidy and cell size in epidermal tissue of Arabidopsis. The Plant Cell, 5(11), 1661–1668.Google Scholar
Meyer, H. M., Teles, J., Formosa-Jordan, P., Refahi, Y., San-Bento, R., Ingram, G., Jönsson, H., Locke, J. C., & Roeder, A. H. (2017). Fluctuations of the transcription factor ATML1 generate the pattern of giant cells in the Arabidopsis sepal. Elife, 6, e19131.Google Scholar
Roeder, A. H., Chickarmane, V., Cunha, A., Obara, B., Manjunath, B., & Meyerowitz, E. M. (2010). Variability in the control of cell division underlies sepal epidermal patterning in Arabidopsis thaliana. PLoS Biology, 8(5), e1000367.Google Scholar
Roeder, A. H., Cunha, A., Ohno, C. K., & Meyerowitz, E. M. (2012). Cell cycle regulates cell type in the Arabidopsis sepal. Development, 139(23), 4416–4427.Google Scholar
Summers, H. D., Wills, J. W., & Rees, P. (2022). Spatial statistics is a comprehensive tool for quantifying cell neighbor relationships and biological processes via tissue image analysis. Cell Reports Methods, 2(11). https://doi.org/10.1016/j.crmeth.2022.100348
Google Scholar
Trinh, D.-C., Lionnet, C., Trehin, C., & Hamant, O. (2024). Sepal shape variability is robust to cell size heterogeneity in Arabidopsis. Biology Letters, 20(5).Google Scholar
Trozzi, N., Lane, B., Perruchoud, A., Clark, F., Hoermayer, L., Meraviglia, A., Reichgelt, T., Roeder, A. H. K., Kwiatkowska, D., Runions, A., Smith, R. S., & Majda, M. (2026). Growth history leaves a geometric trace in puzzle cells. EMBO Reports. https://doi.org/10.1038/s44319-026-00755-yGoogle Scholar
Zuch, D. T., Doyle, S. M., Majda, M., Smith, R. S., Robert, S., & Torii, K. U. (2022). Cell biology of the leaf epidermis: Fate specification, morphogenesis, and coordination. The Plant Cell, 34(1), 209–227.Google Scholar
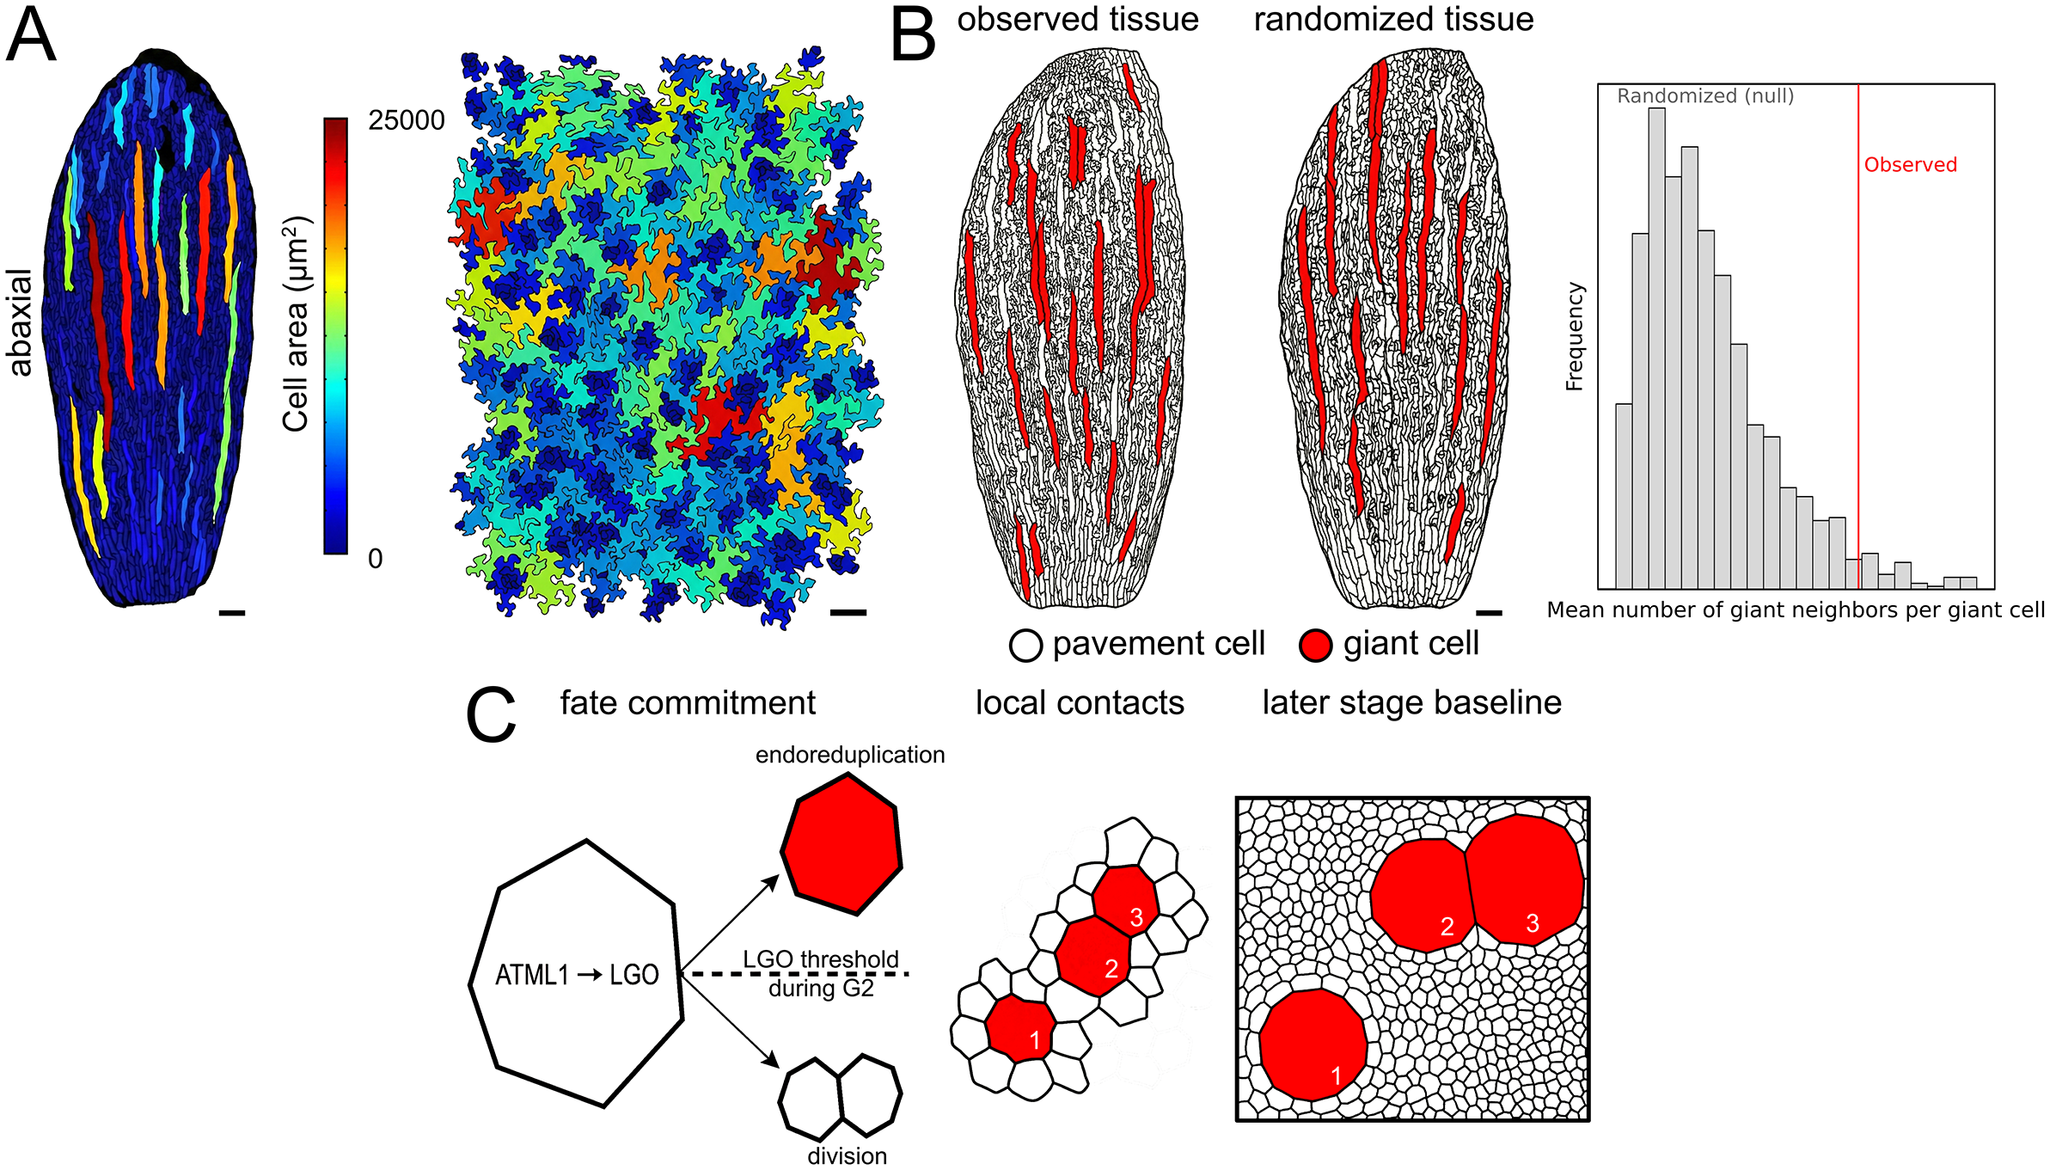
Figure 1. From stochastic fate commitment to tissue-scale clustering. (a) Representative epidermal maps illustrating the wide range of pavement cell areas in leaves and sepals, with large cells occupying a disproportionate fraction of tissue area (images adapted from Clark et al., 2025). (b) Statistical quantification of clustering. Left, the observed tissue displays the actual spatial arrangement of giant cells (red). Middle, schematic example of a dmSET-like randomized tissue, where cell positions are shuffled while preserving cell size distribution and boundary constraints. Right, schematic illustration of the randomization test, comparing the observed mean number of giant neighbours per giant cell (red line) with a conceptual null distribution from repeated randomizations (grey bars), to show how apparent clustering can be evaluated against a randomized baseline. Axis values and p-values are omitted because the panel is intended to convey the concept rather than report a quantitative analysis. (c) Cell-autonomous model for giant cell formation and apparent clustering. Left, fluctuations in ATML1 activity activate LGO, and an LGO threshold during G2 biases a cell towards endoreduplication (red giant fate) or division (white pavement cells). Middle, local contacts among newly specified giant cells at the time of fate commitment (numbered 1–3). Right, later-stage baseline after tissue growth and cell division. Numbered landmarks (1–3) track the same giant cells to show that while topological contacts are preserved (e.g., between cells 2 and 3), the extensive division of the surrounding pavement cells shifts the null expectation, making the original cluster appear statistically significant relative to the late-stage baseline. Scale bars, 100 μm.
Author comment: How stochastic cell fate and endoreduplication yield non-random epidermal patterns — R0/PR1
Comments
Dear Editors of Quantitative Plant Biology,
Please consider our Insight manuscript, “How stochastic cell fate and endoreduplication yield nonrandom epidermal patterns”, for publication in Quantitative Plant Biology.
In this Insight, we discuss recent work by Clark et al. (2025) showing how stochastic fate commitment, coupled to endoreduplication-driven size differences and tissue growth, can yield a mature epidermal pattern that is statistically nonrandom relative to an evolving random baseline. We focus on the quantitative logic behind the spatial tests, including the need for geometry-preserving null models in a cellular lattice, and we explain how apparent clustering can emerge over time without requiring changes in local neighbor contacts.
This submission is original, has not been published previously, and is not under consideration elsewhere. All authors approved the submitted version. The manuscript includes the required declarations, including a Conflicts of Interest statement, and we have provided one figure and a graphical abstract as a separate uploaded file.
Thank you for your consideration.
Sincerely,
Mateusz Majda
Review: How stochastic cell fate and endoreduplication yield non-random epidermal patterns — R0/PR2
Conflict of interest statement
Reviewer declares none.
Comments
Comments to the Author
The manuscript entitled “How stochastic cell fate and endoreduplication yield nonrandom epidermal patterns” discusses the recent paper of Clark et al., 2025 published on PLOS Biology. In my view, this Insight does a good job of summarizing the paper and helping readers understand it better. I would like to support this manuscript for publication in Quantitative Plant Biology, with some minor comments below.
Comments:
- The authors should provide the full name of genes/proteins/mutants on the first mention.
- Lines 51-53 discuss the possible impacts of giant cells on organ shape. I think the paper of Trinh et al., 2024 on Biology Letters touches on this subject and probably can be included in the discussion.
- Sepals and leaves have different distribution of giant cells on the adaxial and adaxial surfaces (line 60). What does it tell us about the shared genetic pathways patterning giant cells in the two organs? Please expand the discussion of possible.
- Line 72: the transition to this part seems abrupt.
- Line 103-104: “A set of giant-cell contacts that looked unremarkable early can therefore become unlikely later when evaluated against the later stage null distribution”. I think the clarity of this sentence can be improved by replacing “looked unremarkable” and “unlikely” by more concrete words.
- Has the observation (random at early stage, non-random at later stage) been described elsewhere? The authors can clarify the novelty of this observation somewhere in the review.
Review: How stochastic cell fate and endoreduplication yield non-random epidermal patterns — R0/PR3
Conflict of interest statement
Reviewer declares none.
Comments
In this Insight article, Trozzi and Majda provide a critical analysis of Clark, Weissbart and Wang et al. (2025), which investigated how giant cells arise and are spatially patterned in plant aerial organs such as leaves and sepals. The original study reported that common genetic pathways operate to create giant cells in the Arabidopsis leaf epidermis and sepals. Trozzi and Majda offer balanced insights into both the genetic and computational analyses presented in the original study. The final section, “What to take forward in computational morphodynamics,” is particularly compelling, and the broader developmental biology and computational modelling communities may benefit from the perspectives it offers. The manuscript may benefit further from considering the following:
1. Lines 73-76 “Standard point pattern methods are poorly suited to this problem because epidermal cells tile the plane, neighbor relationships are explicit, and cell sizes and shapes vary strongly (Kuan et al., 2022; Summers et al., 2022).”
I think readers will benefit from a brief description of Standard point pattern methods, for example: they are based on distance to nearest neighbours where an individual cell of interest is considered as a point. Also, please cite Clark and Evans, 1954 (https://doi.org/10.2307/1931034)
2. Line 95 “Because plant epithelia rarely rearrange neighbor relationships (Zuch et al., 2022)”
It is not clear what authors mean by plant epithelia rarely rearrange neighbor relationships. It is likely that authors are referring to absence of intercalation/cell migration in plants, unlike animals. Rephrasing the sentence to improve clarity would be helpful. Also, for consistency throughout the text it would be better to use the term epidermis instead of epithelia.
3. Lines 111-112 “Late-stage deviations from randomness do not automatically imply late-stage signaling, because proliferation alone can shift the statistical baseline and make early stochastic events appear structured.”
This is an interesting point, and the authors may consider briefly discussing how differential proliferation patterns associated with leaf age may relate to the emergence and spacing of giant cells in leaf epidermis. The original research article focuses on leaf 1 and 2, where cells undergo an early proliferation burst and then rapidly transition into differentiation. In contrast, later forming leaves exhibit more sustained proliferation, and if and how that could influence giant cell emergence and their spacing patterns remains to be investigated (10.1016/j.cub.2023.12.050).
Recommendation: How stochastic cell fate and endoreduplication yield non-random epidermal patterns — R0/PR4
Published online by Cambridge University Press:
10 April 2026
DOI:
https://doi.org/10.1017/qpb.2026.10043.pr4
[Opens in a new window]
Date of review:
21 February 2026
Revision round: 0
Role: Associate Editor
Recommendation/decision: minor-revision
Comments
Dear Dr Strozzi and Dr Majda,
We have now received the reviewers comments on your manuscript. Both are positive, yet asking minor revisions. I fully align with their comments.
Looking forward to receiving your new version of the manuscript.
Many thanks for contributing to Quantitative Plant Biology.
Best regards,
Decision: How stochastic cell fate and endoreduplication yield non-random epidermal patterns — R0/PR5
Published online by Cambridge University Press:
10 April 2026
DOI:
https://doi.org/10.1017/qpb.2026.10043.pr5
[Opens in a new window] Revision round: 0
Role: Editor in Chief
Recommendation/decision: minor-revision
Comments
No accompanying comment.
Author comment: How stochastic cell fate and endoreduplication yield non-random epidermal patterns — R1/PR6
Comments
No accompanying comment.
Review: How stochastic cell fate and endoreduplication yield non-random epidermal patterns — R1/PR7
Published online by Cambridge University Press:
10 April 2026
DOI:
https://doi.org/10.1017/qpb.2026.10043.pr7
[Opens in a new window]
Date of review:
21 March 2026
Revision round: 1
Role: reviewer
Recommendation/decision: accept
Conflict of interest statement
Reviewer declares none.
Comments
I thank the reviewers for addressing all my comments.
Review: How stochastic cell fate and endoreduplication yield non-random epidermal patterns — R1/PR8
Published online by Cambridge University Press:
10 April 2026
DOI:
https://doi.org/10.1017/qpb.2026.10043.pr8
[Opens in a new window]
Date of review:
26 March 2026
Revision round: 1
Role: reviewer
Recommendation/decision: accept
Conflict of interest statement
Reviewer declares none.
Comments
The authors have addressed all concerns raised previously. The article will be of good value to readers.
Recommendation: How stochastic cell fate and endoreduplication yield non-random epidermal patterns — R1/PR9
Published online by Cambridge University Press:
10 April 2026
DOI:
https://doi.org/10.1017/qpb.2026.10043.pr9
[Opens in a new window]
Date of review:
01 April 2026
Revision round: 1
Role: Associate Editor
Recommendation/decision: accept
Comments
I thank the authors for addressing all the comments and for their interesting contribution,
Looking forward to reading the article in QPB,
Decision: How stochastic cell fate and endoreduplication yield non-random epidermal patterns — R1/PR10
Published online by Cambridge University Press:
10 April 2026
DOI:
https://doi.org/10.1017/qpb.2026.10043.pr10
[Opens in a new window] Revision round: 1
Role: Editor in Chief
Recommendation/decision: accept
Comments
No accompanying comment.
 You have
Access
You have
Access
 Open access
The epidermis of a mature Arabidopsis thaliana leaf blade can appear uniform at first glance, a sheet of interlocking pavement cells interrupted by stomata and occasional trichomes. Quantitative imaging has long shown, however, that pavement cells vary widely in size (Katagiri et al., Reference Katagiri, Hasegawa, Fujikura, Hoshino, Matsunaga and Tsukaya2016; Melaragno et al., Reference Melaragno, Mehrotra and Coleman1993). Cell area follows a long-tailed distribution and correlates with endoreduplication, suggesting that a subset of epidermal cells exits the mitotic cycle early and instead continues to grow (Kawade & Tsukaya, Reference Kawade and Tsukaya2017). In sepals, these outliers are especially conspicuous. Giant cells can reach high ploidy levels and elongate dramatically, standing out clearly from their neighbours (Roeder et al., Reference Roeder, Chickarmane, Cunha, Obara, Manjunath and Meyerowitz2010). Forward genetic studies have identified a pathway that promotes giant cell fate in sepals (Roeder et al., Reference Roeder, Chickarmane, Cunha, Obara, Manjunath and Meyerowitz2010, Reference Roeder, Cunha, Ohno and Meyerowitz2012) but two questions remained open. Does the same logic shape pavement cell size in leaves, and are giant cell positions random across an organ?
A shared genetic pathway patterns large epidermal cells in sepals and leaves
In sepals, giant cell fate depends on dose-sensitive activity of Arabidopsis thaliana Meristem Layer1 (ATML1), an epidermis-expressed homeodomain transcription factor that acts upstream of Loss of Giant Cells from Organs (LGO), a cyclin-dependent kinase inhibitor that promotes endoreduplication at the expense of division (Roeder et al., Reference Roeder, Chickarmane, Cunha, Obara, Manjunath and Meyerowitz2010; Roeder et al., Reference Roeder, Cunha, Ohno and Meyerowitz2012). Clark et al. (Reference Clark, Weissbart, Wang, Harline, Li, Formosa-Jordan and Roeder2025) ask whether upstream components of this pathway also influence pavement cell size in leaves. Genetic perturbations reveal a consistent pattern. Loss of function in Arabidopsis CRINKLY4 (Acr4), Defective KERNEL1 (Dek1), ATML1 or LGO reduces the formation of leaf giant cells, whereas LGO overexpression increases their number. ATML1 overexpression does not necessarily increase the number of giant cells per unit area. Instead, it increases the fraction of tissue occupied by giant cells because individual giant cells become exceptionally large.
The organ-level consequences are also informative. Leaves with larger cells do not necessarily grow into larger organs. Across wild type, atml1-3 and lgo-2, overall leaf size is broadly similar, whereas ATML1 or LGO overexpression lines are smaller at maturity (Clark et al., Reference Clark, Weissbart, Wang, Harline, Li, Formosa-Jordan and Roeder2025). A consistent interpretation is that mitotic division can compensate for reduced endoreduplication, buffering overall organ size (Horiguchi & Tsukaya, Reference Horiguchi and Tsukaya2011). In sepals, quantitative analysis similarly supports robustness of final organ shape to cell size heterogeneity, even when giant cells are more abundant, although the magnitude of shape change can increase in backgrounds with elevated growth variability (Trinh et al., Reference Trinh, Lionnet, Trehin and Hamant2024). Leaf shape appears more sensitive than leaf size. Highly anisotropic giant cells in ATML1 overexpression coincide with more pointed, oblong juvenile leaves, whereas more isotropic giant cells in LGO overexpression align with a rounder outline.
Cell size heterogeneity is a whole-leaf feature, not an abaxial curiosity
A second contribution of the study is descriptive but important. The authors clarify where large pavement cells occur in leaves and how size distributions change during development. Mature rosette leaves show a broad, long-tailed distribution of pavement cell areas. Sepals, by contrast, have many uniformly small pavement cells plus a scattered subset of giant cells, and the largest sepal and leaf cells reach similar maximum areas (Clark et al., Reference Clark, Weissbart, Wang, Harline, Li, Formosa-Jordan and Roeder2025) (Figure 1a). Unlike sepals, which restrict giant cells to the abaxial epidermis, leaves contain large pavement cells on both abaxial and adaxial surfaces. This contrast suggests that giant cell formation uses shared machinery, but upstream regulation differs between organs. In sepals, polarity or organ identity cues may gate the ATML1 to LGO module in a surface-specific manner, whereas leaves may deploy the same module on both sides. Mechanical context could also contribute, since sepals curve and enclose under spatially patterned constraints, whereas leaves expand as a flatter lamina. Timing is a third possibility if the endoreduplication window overlaps differently with proliferation on the two surfaces. Histone reporter fluorescence measured from images can serve as a proxy for nuclear ploidy, and Clark et al. (Reference Clark, Weissbart, Wang, Harline, Li, Formosa-Jordan and Roeder2025) use that approach to confirm a positive area–DNA content relationship in leaves.
From stochastic fate commitment to tissue-scale clustering. (a) Representative epidermal maps illustrating the wide range of pavement cell areas in leaves and sepals, with large cells occupying a disproportionate fraction of tissue area (images adapted from Clark et al., Reference Clark, Weissbart, Wang, Harline, Li, Formosa-Jordan and Roeder2025). (b) Statistical quantification of clustering. Left, the observed tissue displays the actual spatial arrangement of giant cells (red). Middle, schematic example of a dmSET-like randomized tissue, where cell positions are shuffled while preserving cell size distribution and boundary constraints. Right, schematic illustration of the randomization test, comparing the observed mean number of giant neighbours per giant cell (red line) with a conceptual null distribution from repeated randomizations (grey bars), to show how apparent clustering can be evaluated against a randomized baseline. Axis values and p-values are omitted because the panel is intended to convey the concept rather than report a quantitative analysis. (c) Cell-autonomous model for giant cell formation and apparent clustering. Left, fluctuations in ATML1 activity activate LGO, and an LGO threshold during G2 biases a cell towards endoreduplication (red giant fate) or division (white pavement cells). Middle, local contacts among newly specified giant cells at the time of fate commitment (numbered 1–3). Right, later-stage baseline after tissue growth and cell division. Numbered landmarks (1–3) track the same giant cells to show that while topological contacts are preserved (e.g., between cells 2 and 3), the extensive division of the surrounding pavement cells shifts the null expectation, making the original cluster appear statistically significant relative to the late-stage baseline. Scale bars, 100 μm.
A practical issue underlies these observations. Leaf pavement cells are highly lobed and irregular, so large cells are not always obvious by eye. The authors therefore define leaf giant cells using a size threshold anchored in atml1-3 tissues, and apply a supervised classifier to separate stomata from pavement cells before labelling giant cells. This pipeline matters because the spatial analyses that follow depend on consistent cell classification across genotypes and developmental stages. With giant cells defined consistently, the next question is whether their apparent scattering reflects random placement or a structured spatial pattern.
Testing randomness in a cellular lattice requires a null model that preserves cell geometry
The core conceptual challenge is simple to state. Giant cells appear scattered and sometimes contact each other, but are these contacts expected by chance (Figure 1b)? Standard point pattern methods, which treat cells as points and test randomness using distance-based statistics such as nearest-neighbour spacing, are poorly suited to this problem (Clark & Evans, Reference Clark and Evans1954) because epidermal cells tile the plane, neighbour relationships are explicit and cell sizes and shapes vary strongly (Kuan et al., Reference Kuan, Yang and Ho2022; Summers et al., Reference Summers, Wills and Rees2022). A useful null model must respect that geometry and heterogeneity while breaking any true spatial organization.
To test this, the authors compare observed tissues to randomized tissues generated using dmSET, an image-based shuffling method. dmSET generates randomized tissues from segmented images by shuffling cell positions while preserving the cell size distribution and key boundary constraints, with border cells fixed, producing a null model that respects tissue heterogeneity (Laruelle & Genovesio, Reference Laruelle and Genovesio2022; Laruelle et al., Reference Laruelle, Spassky and Genovesio2020). The analysis focuses on a statistic with direct biological meaning, which is the mean number of giant-cell neighbours per giant cell. By building a null distribution from hundreds of randomizations per replicate, the authors test whether the observed value is compatible with random spatial organization, given the heterogeneous cell size distribution of the tissue. In leaves, dmSET can distort cell shape, and the authors used controls to confirm that shape artifacts do not explain the giant-neighbour statistic.
Using this approach, mature sepals and mature leaves show more clustering than expected under the null model. Giant cells have, on average, more giant cell neighbours than randomized tissues predict. The study, therefore, reframes “scattered” as a visual impression that does not rule out statistically detectable clustering.
When a pattern becomes non-random without changing contacts
One of the most interesting aspects of the study addresses how clustering can emerge over time. Because the plant epidermis lacks intercalation and cell migration, unlike many animal epithelia, it is natural to assume that clustering must be imposed early by an active spacing mechanism (Clark et al., Reference Clark, Weissbart, Wang, Harline, Li, Formosa-Jordan and Roeder2025; Zuch et al., Reference Zuch, Doyle, Majda, Smith, Robert and Torii2022). However, it has been shown that a pattern can shift from statistically random to statistically clustered over time without requiring active cell rearrangements, because growth shifts the null baseline (Figure 1c).
The explanation hinges on how the random baseline evolves as the tissue grows. As cell divisions accumulate, the number of possible cellular configurations increases, which shifts the null expectation for neighbour counts. Under this evolving null distribution, high giant-neighbour counts occupy a progressively smaller fraction of the random outcomes. A pattern that falls near the center of the early-stage null distribution can therefore move into the upper tail of the late-stage null distribution when evaluated at later developmental stages. Clark et al. (Reference Clark, Weissbart, Wang, Harline, Li, Formosa-Jordan and Roeder2025) show in simulations that, as divisions accumulate, a giant-neighbour count that is compatible with randomness early can become statistically incompatible with the later-stage null distribution, even when local neighbour relationships change little. A comparable trend is also observed in time-lapse imaging of sepals (Hervieux et al., Reference Hervieux, Dumond, Sapala, Routier-Kierzkowska, Kierzkowski, Roeder, Adrienne, Smith, Richard, Boudaoud and Hamant2016).
This point matters beyond giant cells. Late-stage deviations from randomness do not automatically imply late-stage signalling, because proliferation alone can shift the statistical baseline and make early stochastic events appear structured. Leaf age adds another layer to this logic. Juvenile leaves show an early proliferation burst followed by an abrupt decline, whereas adult leaves sustain proliferative growth for longer (Li et al., Reference Li, Jenke, Strauss, Bazakos, Mosca, Lymbouridou, Kierzkowski, Neumann, Naik, Huijser, Laurent, Smith, Runions and Tsiantis2024). Such age-dependent proliferation programmes should shift the null baseline differently across successive leaves, and therefore change when, and how strongly, clustering becomes detectable even if giant cell initiation rules are unchanged.
A minimal stochastic model links gene-expression noise, cell-cycle decisions and tissue growth
To connect the statistical observations to the mechanism, the authors use a previously published stochastic, cell-autonomous multicellular model (Meyer et al., Reference Meyer, Teles, Formosa-Jordan, Refahi, San-Bento, Ingram, Jönsson, Locke and Roeder2017). In the model, ATML1 activity fluctuates stochastically and promotes LGO activity. Cells progress through the cell cycle with variable timing. After DNA replication, a cell that crosses a threshold level of LGO during the G2 phase of the cell cycle does not divide and instead enters an endoreduplication programme, producing a giant cell. Simulations based on this framework reproduce the observed organization, including the gradual emergence of clustering as the tissue proliferates. Notably, the model does not require explicit cell-to-cell communication to generate a non-random tissue-scale outcome.
This modelling choice helps disentangle two ideas that are often conflated in qualitative discussions. Randomness in fate initiation can coexist with non-random spatial organization at later stages once tissue growth is taken into account. This point is made explicit in Clark et al. (Reference Clark, Weissbart, Wang, Harline, Li, Formosa-Jordan and Roeder2025) by combining tissue-preserving randomizations, time-resolved analysis and a minimal stochastic model that produces late-stage clustering without requiring explicit cell-to-cell communication.
What to take forward in computational morphodynamics
Two aspects of the work appear broadly applicable to other developing systems. The first is the null model strategy. Any study that assigns cell states on a segmented tissue and asks whether spatial organization differs from chance requires a randomization method that preserves key geometric features that bias neighbour statistics, especially heterogeneous cell sizes and shapes. The dmSET approach provides a practical route to hypothesis testing for patterns that cannot be treated as point processes (Laruelle & Genovesio, Reference Laruelle and Genovesio2022).
The second is the time-aware interpretation of pattern metrics. If a statistic compares observed organization to a null distribution, then growth can shift that null distribution even when the observed configuration remains locally stable. Analyses of epidermal mosaics will be stronger if they report developmental trajectories, not only endpoints, because endpoint geometry can reflect earlier growth dynamics and is easier to interpret with temporal context (Trozzi et al., Reference Trozzi, Lane, Perruchoud, Clark, Hoermayer, Meraviglia, Reichgelt, Roeder, Kwiatkowska, Runions, Smith and Majda2026).
Several follow-ups could further sharpen the mechanism. Lineage-resolved live imaging in leaves could test whether local division histories around early giant cells quantitatively predict the later shift in clustering under the null model. Modelling could also incorporate spatial growth gradients, since real leaves develop strong gradients that may bias where the first giant cells arise. The success of the current model indicates that these additions are not required to explain clustering in principle, but added realism could reveal where the minimal explanation stops being sufficient.
Overall, this study links a conserved pathway for endoreduplication-driven cell enlargement to a subtle, time-dependent patterning phenomenon. The study shows how a mature, statistically clustered arrangement can arise from stochastic initiation combined with tissue growth, and it provides a clear framework for testing similar questions in other cellular mosaics.
Open peer review
To view the open peer review materials for this article, please visit http://doi.org/10.1017/qpb.2026.10043.
Acknowledgements
The authors would like to thank Adrienne H. K. Roeder and Pau Formosa-Jordan for careful reading of the manuscript and for helpful comments.
Competing interest
The authors declare none.
Data availability statement
No new experimental data or reusable code were generated for this Insight. Figure 1 includes schematic illustrations created for explanatory purposes based on Clark et al. (Reference Clark, Weissbart, Wang, Harline, Li, Formosa-Jordan and Roeder2025) and does not present a new quantitative analysis.
Author contributions
N.T. and M.M. wrote the manuscript.
Funding statement
This work was supported by the University of Lausanne and by the Swiss National Science Foundation (SNSF) Starting Grant PS00-3_234905 awarded to MM.