




1. Introduction and background
The importance of investing in early health and non-cognitive, soft skills to enrich childhood development and shape later-life outcomes is becoming well established (see Almond et al., Reference Almond, Currie and Duque2018; Borghans et al., Reference Borghans, Duckworth, Heckman and ter Weel2008; Conti et al., Reference Conti, Heckman and Pinto2016; Cunha et al., Reference Cunha and Heckman2008; Currie, Reference Currie2020; Heckman, Reference Heckman2004; Heckman & Kautz, Reference Heckman and Kautz2013; Heckman & Rubinstein, Reference Heckman, Kautz, J. J., J. E. and T.2014; Heckman et al., Reference Heckman, Strixrud and Urzua2006). Several studies have additionally documented the complementary nature of soft skills and cognitive skills in improving lifetime outcomes (Cobb-Clarke, Reference Cobb-Clarke2015; Cobb-Clarke & Tan, Reference Cobb-Clarke and Tan2011; Gensowski, Reference Gensowski2018; Roberts et al., Reference Roberts, Kuncel, Shiner, Caspi and Goldberg2007; Schurer, Reference Schurer2017). Additionally, studies highlight the complementary nature of investments in health and soft skills, with the synergy across these domains producing greater outcome gains than if the focus was purely on the gains to the individual traits (Cunha & Heckman, Reference Cunha, Heckman and Schennach2010; Cunha et al., Reference Cunha and Heckman2008; Heckman et al., Reference Heckman2004; Josten & Lordan, Reference Josten and Lordan2021). Given the anticipated beneficial influence of improvements in health and soft skills on later life outcomes, the present study investigates whether formal, curriculum-based teaching of soft skills aimed at adolescents within a high school setting can improve health and wellbeing.
This study is important for several reasons. There is increasing evidence that soft skills are malleable through targeted investment in education, but most of the school-based assessments rely on evidence from early (pre-school) childhood and elementary school years (Heckman & Rubinstein, Reference Heckman, Kautz, J. J., J. E. and T.2014; Kautz et al., Reference Kautz, Heckman, Diris, ter Weel and Borghans2014). In their comprehensive reviews of the literature on early human capital investment returns Heckman and Kautz (Reference Heckman and Kautz2013), Conti et al. (Reference Conti, Heckman and Pinto2016) and Almond et al. (Reference Almond, Currie and Duque2018), in addition to discussing the role of cognitive skills, also document the various interventions aimed at improving health and soft skills and assess their impact on later lifetime outcomes. The overwhelming conclusion is that investments in health and soft skills have positive, long-lasting and widespread returns. Such evidence includes data from the well-researched Perry Pre-School Program (Heckman et al., Reference Heckman and Rubinstein2001), the Abecedarian Program (Campbell et al., Reference Campbell, Conti, Heckman, Moon, Pinto, Pungello and Pan2014; Garcia et al., Reference Garcia, Heckman and Ziff2018) and Project STAR (Chetty et al., Reference Chetty, Freidman, Hilger, Saez, Schanzenbach and Yagan2011; Dee & West, Reference Dee and West2011; Schanzenbach, Reference Schanzenbach2006). This literature continues to flourish. Alan et al. (Reference Alan, Boneva and Ertac2019), for example, show that an incentivised behavioural programme run across elementary schools aimed at improving perseverance improves soft skills in young children.
Yet as the review of this literature by Almond et al. (Reference Almond, Currie and Duque2018) emphasises there is an absence of such evidence on interventions that improve soft skills during what they term the ‘missing middle’ years of adolescence. Currie (Reference Currie2020) in her review focusing on health as a fundamental aspect of human capital, returns to the same theme highlighting the lack of evidence on interventions aimed at improving the health trajectory of adolescents.
Adolescence is a critical period of growth and development, so assessment of whether health and wellbeing trajectories can indeed be influenced through school-based investments is crucial. This is the aim of the present study. Not only is such evidence fundamental to our understanding of whether such early childhood and adolescent interventions are potentially complementary, but it also adds to our knowledge on the general effectiveness of such investments.
There are, of course, specific papers that consider the relationship between education and health in adolescents. These are mainly based on quasi-experimental approaches, rely on specific model specifications, and subsequently remain susceptible to residual confounding and other forms of potential bias (Clark & Royer, Reference Clark and Royer2013). It is not surprising therefore that Janke et al. (Reference Janke, Johnston, Propper and Shields2020) find the quasi-experimental literature, which attempts to establish a causal link between education and health, reports mixed results. For example, in their study, Clark and Royer (Reference Clark and Royer2013) find no causal effect to exist between education and health. While Janke et al. (Reference Janke, Johnston, Propper and Shields2020) find minor effects for some, but not all dimensions of health in their own analysis. More recently, Atkins et al. (Reference Atkins, Turner, Chandola and Sutton2020) provided quasi-experimental evidence that soft skills gained in adolescence are more generally associated with improved health in later life. All this literature relies largely on changes in compulsory schooling laws for identification. There is no detailed information on how children spent their time when exposed to additional schooling. The literature generally does not clarify whether schools extended or modified their curricula in mapping changes onto health or non-cognitive outcomes.
There is also a small, but growing literature that does consider school-based interventions, some targeting adolescent high school pupils, on specific physical and soft skills, rather than the broadly defined soft skills we analyse. Such studies have, for example, considered the impact of changing the diet of children through school meals and of increased activity levels through scheduled physical education on various specific outcomes (see Brown & Summerbell, Reference Brown and Summerbell2008; Van Cauwenberghe et al., Reference Van Cauwenberghe, Maes, Spittaels, Van Lenthe, Brug, Oppert and De Bourdeaudhuij2011 for reviews). Ttofi et al. (Reference Ttofi and Farrington2011) and Denford et al. (Reference Denford, Abraham, Campbell and Busse2017) both provide reviews of specialised school-based interventions to specifically improve sexual health and reduce bullying. Most of these studies are not associated with curriculum changes. They are also short term, with the majority considering interventions lasting less than a year. So, while broadly there are suggestions of improvements in specific outcomes, there is little authoritative evidence that is attributable to a defined, structured curriculum change.
The general aim of PSHE is to provide a mechanism to improve self-awareness and equip pupils with the knowledge, understanding and skills to make better-informed judgements aimed at improving their health as well as their emotional wellbeing and behaviour. To assess whether a high school curriculum can deliver soft skills and associated positive outcomes through a mechanism of improved self-awareness we assess evidence on a taught structured intervention of 4-years duration aimed at adolescents in English high schools. While a curricula-based programme might crowd out traditional academic achievement, we know of no evidence, compelling or otherwise, that suggests this. Heckman and Kautz (Reference Kautz, Heckman, Diris, ter Weel and Borghans2014) provide reviews outlining mechanisms and empirical support to argue that augmenting health and soft skills through a school-based intervention improves, rather than crowds out, educational achievement.Footnote 1
The present study evaluates a large-scale, 4-year trial based on the formal teaching of health and soft skills through an explicitly designed, structured curriculum delivered by specifically trained teachers within the English high school setting, referred to as Healthy Minds. While a number of English high schools had been teaching Personal, Social, Health and Economic (PSHE) related subject matter, it became a mandated subject in English state-funded high schools in September 2020. While PSHE subject matter is meant to cover such topics as health education, personal relationships, and sex education, it has been taught with no agreed standard curriculum content, flexible delivery, and no specific additional teacher training. Before 2020, not only was delivery particular within each school, but the subject also was not compulsory and many schools did not offer such lessons. Since 2020 high schools must timetable the subject, but delivery remains specific to each school leading to a proliferation of individual offerings and consequent difficulties in assessing differences in outcomes. Our study and evaluation pre-date the mandate.
The 4-year Healthy Minds programme was rolled out as a randomised controlled trial (RCT) and introduced into 23 school-cohorts in England in 2013 or 2014, depending on the timing of recruitment. These 23 school-cohorts formed our treatment group. In all treated schools the curriculum was initiated during the first year of entry to state-funded high school. It was delivered through weekly lessons of one hour each, taught by teachers who had been trained to provide the cumulative curriculum over a 4-year period. In comparison, 16 state-funded school-cohorts already teaching PSHE, continued with their individual, non-standardised offerings, delivered by teachers with no specific training, acting as control cohorts for the intervention.Footnote 2 The enrolled schools were targeted to be at the lower end of education attainment and generally serving a lower-income school population.
As health and soft skills address multiple outcomes our results consider several categories of health, behaviour and emotional wellbeing. While acknowledging the multi-outcome nature of the trial, it remained necessary to choose a primary outcome to calculate the sample size for the trial. We chose self-assessed health, as a simple, unidimensional outcome that PSHE education aims to improve. Overall, we find that pupils exposed to Healthy Minds have global health attainment, measured by this outcome, which is 0.235 standard deviations higher than children in the control group, a result consistent with a 10-percentile increase in adolescents’ self-assessed health. This primary result is robust to an extensive number of checks aimed at dealing with the multiple issues arising from running a complex, school cluster-designed trial focused on examining individual pupil effects.
An overall summary of our full set of results would be that the Healthy Minds curriculum is positive in its effect on health, with additional evidence that points to positive effects on behaviour, but no discernible impact on adolescent emotional wellbeing. We also find evidence of heterogeneous treatment effects by gender, with boys having many more gains across the domains than girls, and some evidence of an adverse impact on girls’ outcomes. This emphasises the attention that schools should pay to gender differences as these may affect learning styles when rolling out programmes designed to enhance health and soft skills. We do note however that because the treatment and control groups were principally disadvantaged school populations there are limits to the external validity of our estimates. Overall, we are most confident that they apply to schools with below-average attainment in the UK.
The remainder of the paper is organised as follows. Section 2 describes the treatment intervention, the PSHE-taught curriculum, and details the data collection and data used in the analysis of the intervention. Section 3 outlines the methodology adopted, explaining our adjustments for multiple hypothesis testing, missing data, attrition and compliance. Section 4 reports our full set of results, including all primary and secondary analyses on gender differences and highlights the potential scalability of the intervention. We end with our overall conclusions.
2. The treatment intervention: The Healthy Minds curriculum
High schools in England have been pressed to teach a curriculum known as PSHE to provide adolescents with the necessary skills to become more self-aware and aid their ability to make more informed life choices as they mature (UK House of Commons Education Committee, 2015). It has, however, not been compulsory to do so until recently, and there is no knowledge about how to deliver this type of programme effectively.Footnote 3 On the contrary, a UK House of Commons (2015) report highlighted that the quality of PSHE, as then taught as a non-compulsory subject in high schools, was sub-optimal, implying that there is ample room for improvement. Teaching delivery required improvement in at least 40% of high schools in which it was offered according to one regulatory report (Ofsted, 2013). One of the specific recommendations of the House of Commons (2015) report was for PSHE to be a compulsory, non-examined subject for all public sector high school children aged 11–16. In recognition of the importance of PSHE, and partly in response to the acknowledged poor performance of schools in PSHE, the UK government made PSHE education statutory in England in 2017 and compulsory from 2020/21 (PSHE Association, 2017; UK House of Commons Librar, 2019). Since then, high school PSHE education in England has been meant to provide a dedicated timetabled slot and curriculum that teaches skills that lead to healthy adolescent development and relationships (MacDonald, Reference MacDonald2008). However, other than a general specification of objectives and subject matter to be delivered, no curriculum guidance was given.
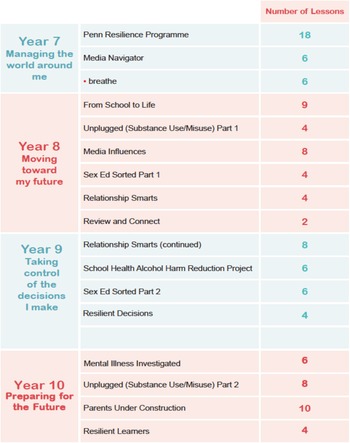
The Healthy Minds curriculum is a specifically designed syllabus to deliver a structured PSHE education in one-hour, weekly teaching slots within the regular high school timetable, taught by specially trained teachers over four years. An independent charitable company provided an evidence-based, integrated PSHE curriculum drawing on a systematic review by Colemanet al. (Reference Coleman, Hale and Layard2011) to improve the haphazard and idiosyncratic approach to PSHE teaching adopted by many schools.Footnote 4 The Healthy Minds curriculum was subsequently based on, but not merely a replication of, 14 pre-existing individual teaching modules. These modules were aggregated in a manner that allowed them to be combined collectively to form a comprehensive PSHE curriculum (Coleman et al., Reference Coleman, Hale and Layard2011 provide details of the review). The curriculum was designed to be self-reinforcing and, through raising awareness of healthy behaviour and lifestyle, motivate adolescents to change their conduct in a long-lasting manner that would positively impact their health and soft skills, such as behaviour and emotional wellbeing. This curriculum documented in Figure 1 was to be introduced into English high schools within the PSHE teaching slot to deliver gains in adolescent health and social skills.Footnote 5
Healthy Minds programme flow

This Healthy Minds curriculum, taught formally by teachers specifically trained to deliver the material, is the treatment intervention that is assessed. The curriculum was taught as a 113-hour comprehensive programme delivered over the first 4-years of high school in a randomised sample of English classrooms, using one hour per week of timetabled lessons. Healthy Minds replaced the existing non-standardised PSHE lesson that had been historically timetabled for the same cohort.
The Healthy Minds curriculum is built around the themes of ‘Managing the world around me’ (Year 7; the entry year for English high schools), ‘Moving toward my future’ (Year 8); ‘Taking control of the decisions I take’ (Year 9); and ‘Preparing for the future’ (Year 10). Table 1 provides more detail on the programme roll-out. For the school cohorts randomised to the Healthy Minds curriculum, the schoolteachers teaching the curriculum were given formal training in delivering the curriculum. The training covered 7 days of teacher training for Year 7, 6 days of teacher training in Year 8, 2 days of teacher training in Year 9 and 4 days of teacher training in Year 10. The training covered all aspects of the 14 modules. This training was provided off-site by an independent charity and covered both the material and appropriate teaching methods for the Healthy Minds curriculum.Footnote 6 The curriculum was delivered to adolescents as they first entered English high schools in Year 7, normally aged 11 or 12, and continued over 4 years until Year 10 when pupils are 15 or 16. The following year, Year 11, is when formal examinations (GCSE exams) are taken.Footnote 7 These GCSE examinations are compulsory and examine a standard 2-year curriculum taught to all students. Given schools’ focus on GCSE examinations, particularly as they form part of the government’s quality assessment of English high schools, the non-examined PSHE Healthy Minds curriculum was delivered within the early years of high school with 20 lessons in Year 7, 26 lessons in Year 8, 24 lessons in Year 9 and 28 lessons in Year 10, stopping before the year in which GCSE examinations are sat (Year 11).
Study timeline

The evaluation presented here is a direct test of the hypothesis that this structured, formally taught curriculum, would convey health and social skills to adolescents that subsequently lead to improvements across a range of health and behavioural outcomes. The intervention, introduced before the mandatory introduction of PSHE teaching, encompasses the curriculum content, the teaching training, and the delivery. Control school-cohorts all continued as before, delivering their own PSHE content in an unstructured manner. Recruitment concentrated on schools with poor attainment in above-average areas of deprivation, which aided matching.Footnote 8 A comprehensive set of robustness checks aimed at mitigating potential bias are considered. Specifically, while implementing a school cluster, intent-to-treat analysis as the primary analysis, we also ran robustness checks to address baseline imbalance on outcomes at the pupil level; school curriculum compliance issues; curriculum adherence issues through potential spillover effects within school cohorts that were part of a waitlist control design. Ultimately, we find that our primary conclusions are fully supported by these checks.
2.1. Experimental approach and data
It is challenging to construct a single comprehensive measure that captures the full impact of an intervention aimed at improving multiple soft skill dimensions. Therefore, we adopt a multi-dimensional outcome approach to evaluate Healthy Minds. We use a well-validated questionnaire, the CHQ-CF87, developed specifically for children and adolescents. This questionnaire has been shown to be reliable and sensitive to measured changes across the various health-related quality of life (HRQoL) and associated soft-skill domains for 10 to 18-year-old adolescents across several countries, including the UK, and to have high response rates (Schmidt et al., Reference Schmidt, Garratt and Fitzpatrick2001). The CHQ-CF87 questionnaire has also been validated within a high school context (op. cit., 2001). It asks for 87 responses across 14 domains relating to general health, mental health, general health perceptions, physical functioning, socio-emotional roles, social-behavioural roles, social-physical roles, pain, general behaviour, self-esteem and family activities and is therefore well suited to cover the various health and soft skill outcomes that the Healthy Minds intervention was aimed at improving.
A single measure is, however, required for power analysis to estimate the sample size needed to deliver adequate statistical power within an RCT setting. Our chosen primary outcome measure is based on self-assessed health status returned from a stand-alone question embedded within the CHQ-CF87 (detailed in the section below). As well as allowing a sample size calculation, self-reported health provides a sufficient statistic that captures a large amount of latent information about an individual’s health (Benitez-Silva et al., Reference Benitez-Silva, Buchinsky, Man Chan, Cheidvasser and Rust2004). Self-reported health measures have separately been found to be predictive of many long-term outcomes and behaviours (see Almond et al., Reference Almond, Currie and Duque2018; Heckman et al., Reference Heckman, Pinto and Savelyev2013). While they may be considered noisy measures of underlying health, the measurement error issues associated with this form of endogeneity have been argued to generally underestimate the impact of interventions (Benitez-Silva et al., Reference Benitez-Silva, Buchinsky, Man Chan, Cheidvasser and Rust2004). In any case, any such bias will be randomly allocated to treatment and control groups in an RCT setting such as ours. In such settings, self-measurement will not affect the consistency of our estimates (Hausman, Reference Hausman2001).
It is also challenging to conduct long-term RCT evaluations within a school setting. To evaluate the aggregated Healthy Minds curriculum, it was rolled out as a clustered randomised trial. The need for a cluster design is obvious, as while the intervention is aimed at individual high school students, it is implemented at the school (curriculum) level. While this design leads to increasing the required sample size, our sample size calculation to estimate the number of schools required for the trial started with the observation that the average English high school has approximately 150 pupils per year. To allow for absentees and pupils leaving the school over the trial period, we based our calculations on 100 pupils per year per school cohort. Applying conventional statistical significance of 0.05 and power of 0.80, and assuming a conservative intra-class correlation of 0.06Footnote 9 and equal numbers of treatment and control schools (schools rather than school cohorts again to allow a conservative estimate), a sample size of 25 schools was calculated to be required to detect a treatment effect size of a change of 0.3 standard deviations in the primary measure of self-assessed health. With 30 schools, we estimated we could detect an effect size of a change of 0.28 standard deviations.Footnote 10
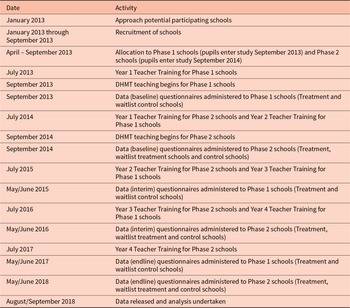
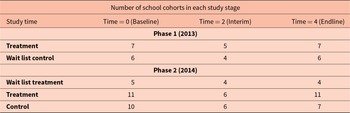
To aid the school cluster trial design, minimisation of school differences was undertaken through identifying schools according to several national indicators that matched an intention of recruiting state schools with poor educational attainment, in above-average areas of deprivation.Footnote 11 A total of 40 state schools throughout England were subsequently written to with a description of the trial and asked to participate. Pupil entrance to English state high schools is controlled through pre-specified geographical school catchment areas, with few pupils moving across catchment boundaries (over 90% of English school pupils remained within their catchment areas on entry in 2013). Given that geographic locality dominates admission and minimisation focused on poor achievement, the school cluster design implemented as a practical operational measure, does not ensure clear randomisation over adolescent pupils. Moreover, ultimately recruitment was further constrained as it proved time-consuming and complex to secure individual school recruitment.Footnote 12 While many schools expressed interest, only 35 schools of the invited 40 finally committed to participating in a 4-year study. Recruitment and randomisation were undertaken over a 2-year period.Footnote 13 The complete study timeline is given in Table 1.
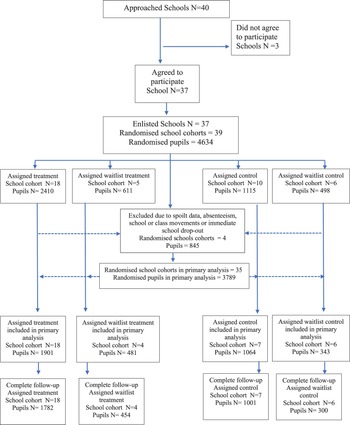
Given the length of the trial, to minimise further anticipated, subsequent dropout the initial control schools recruited in 2013 (part of the set of schools referred to as Phase 1 schools) were enlisted on a ‘waitlist control’ basis. For these waitlist control schools, the year 7 intake for 2013, where year 7 is the first year of high school for pupils in England, acted as a control group, and their next year 7 entrants in 2014 were allocated to the treatment group. Phase 2 schools (initiated in 2014) were allocated either to pure treatment or control school cohorts (i.e. to the end date of the study the control schools of Phase 2 did not receive the treatment). Overall, the study recruited 13 participating school cohorts in Phase 1 (2013), with 6 allocated to the (waitlist) control arm and 5 to the treatment arm, and 28 participating school cohorts in Phase 2 (2014), with 10 assigned to the control arm and 18 schools to the treatment arm. This provided a total of 39 school cohorts allocated randomly to treatment or control on a matched cluster basis. Subsequently, 4 school cohorts dropped out, causing a loss of 845 pupils in total. The final sample thus relates to 35 randomised school cohorts with a total of 3,789 school pupils who supplied valid primary outcome data at the point of randomisation. A participant flow diagram is provided in Fig. 2,Footnote 14 and Table 2 documents the number of school cohorts at each study stage.
Participant flow diagram (for Primary Analysis)

School cohorts by study stage

As we have noted four school cohorts dropped out, causing a loss of 845 pupils in total. This was no doubt a function of the length of the trial period but possibly also reflected roll-out during a period of severe austerity within the English high school sector. Spending per pupil fell by approximately 1% in state high schools between 2011–12 and 2015–16 and was frozen in cash terms between 2015–16 and 2017–18. The result was that English high school real spending per pupil in 2019–20 was around 5% lower than it was in 2011–12 (Belfield et al., Reference Belfield, Farquharson and Sibieta2018). Over time some of our schools were simply unable to maintain the full teaching commitment. Others were unable to provide adequate support for the questionnaire administration, which formed the basis of the data collection. Given these retention issues, after clawback, there were 35 of the originally recruited school cohorts available for the intention-to-treat analysis.
Our primary (school) cluster balanced analysis is accordingly based on 35 school cohorts with 7,252 valid questionnaires. This is made up of 3,789 pupils at the point of randomisation and 3,463 at the endpoint of the study. Focusing only on pupil dropout and missing data on the primary outcome would have provided 7,326 questionnaires (based on 3,789 pupils at the point of randomisation and 3,537 pupils at the endpoint of the study).
However, given we wished to detail secondary outcomes as an important part of our analysis the 7,326 valid questionnaires dropped to 7,252 after adjusting for pupils answering too few of the secondary, multi-item questionnaires to allow for imputation. We note that running the primary model on the 7,326 questionnaires does not change the point estimates to the third decimal place, and the remainder of the paper presents an analysis that focuses on data on the 7,252 questionnaires.
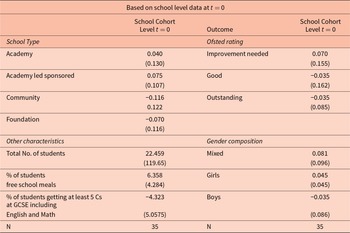
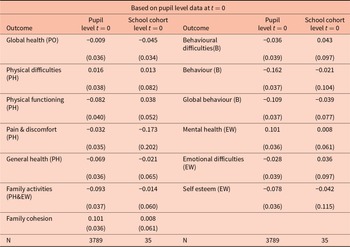
To consider whether there is balance across the treatment and control group, Table 3 documents the differences in means along with the associated difference in standard errors for a range of school level variables. Specifically, we draw on data at baseline (t = 0) that captured the treated and control school’s type (academy, academy-led sponsored, community or foundation), the total number of students on the school roll, the percentage of students eligible for free school meals, the percentage of students attaining at least 5 Cs (pass grades) at GCSE including English and Maths, the government (Ofsted) official rating of the school and its gender composition. We note that when considering a 2-sample t-test there are no significant differences between the treatment and control schools baseline characteristics mean values for any of these variables. This implies that the treatment and control schools exhibit balance across these characteristics at t = 0.
Baseline differences in average outcomes for a range of school level variables

Notes: Table 3 documents the differences in means along with the associated difference in standard errors. Specifically, we draw on school level data at baseline (t = 0). We did calculate two sample t-tests on these differences. While *, **, *** denote significance at the 10%, 5% and 1% levels specifically, we note that there is no case of a difference in mean that is statistically significant at any of the traditional levels of significance.
However, while the impact is assessed through a cluster design, as the curriculum intervention operates at the school level, individual pupil outcomes are of primary interest. Matching schools is essential given we are assessing a taught curriculum. Given that English state school entrance is based on a pupil population drawn from pre-defined geographical catchment areas, it will ultimately determine the student population. While balance was achieved at the school level, as we shall report later in this article, there was some imbalance across the baseline data collected at the individual pupil level. This reflects that we could identify school-level characteristics at the time of randomisation, but not the within-school individual pupil characteristics.Footnote 15 The individual pupil imbalance largely reflected lower levels of soft skills in the intervention sample at baseline, which, as it turns out, were more than compensated for by the intervention. Our preferred model specifications, therefore, rely on pupil fixed effects to accommodate this imbalance. We also estimate additional robustness models, including matching models at the pupil baseline health level with supportive results.
Compliance was a further issue, as the school cohorts in the treatment group did not necessarily administer the curriculum in its entirety. Therefore, our primary analysis estimates the local average treatment effect on an intention-to-treat basis incorporating attrition. We argue this is the most appropriate analysis, anyway, given that even statutory programmes still have compliance issues. As we have full details on compliance, in terms of the number of years a school fully participated in the programme, we subsequently provide estimates of the delivered local average treatment effects.
2.2. Outcome measurement
Data collection was undertaken through questionnaires issued to individual pupils and administered in person on the school sites. Baseline data collection therefore occurred in September 2013 or 2014 (depending on school recruitment). We then did additional data collection at 21 months (June 2015 or 2016) and 42 months (June 2017, with the final questionnaires delivered during 2018). Individual questionnaires were completed under standard exam conditions within schools, with pupils informed at the start of the session that the survey data would be collated anonymously and that parents, teachers or other pupils would not have any access to the data. Anonymous coding also ensured that the analysts did not have access to individual pupil identities.Footnote 16
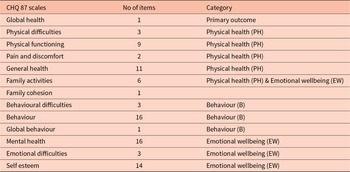
As noted previously, there is no single, comprehensive measure that can capture health and soft skills. Our primary and secondary outcome measures were taken from a fully validated children’s/adolescent questionnaire to assess HRQoL broadly, the CHQ-CF87 (Schmidt et al., Reference Schmidt, Garratt and Fitzpatrick2001). As outlined above, it is based on 87 items that measure various physical and psychosocial health and behaviour and emotional wellbeing domains, divided across 14 multi-item scales on physical functioning, socio-emotional role, social-behavioural role, social-physical role, pain, general behaviour, mental health, self-esteem, general health perceptions and family activities.Footnote 17 A list of the sub-scales and their number of associated items is documented in Table 4.Footnote 18 It takes an estimated 20 minutes to complete (Schmidt et al., Reference Schmidt, Garratt and Fitzpatrick2001). These sub-scales are created by following the aggregation approach recommended in the CHQ-CF87 manual, which results in all of the 14 dimensions being transformed into variables that range from 0 to 100. To ease interpretability, they are also standardised to have a mean of zero and standard deviation of 1.
Questionnaire scales and item number

Notes: Table 4 details the number of items (or questions) that make up each of the CHQ-87 scales that are the outcomes considered in this work. It also assigns each secondary outcome to a category we draw to reduce the dimensionality of the secondary outcome data using exploratory factor analysis.
The CHQ-CF87 incorporates a single scale relating to self-assessed general health, which forms the trial’s primary outcome. This measure was used as the basis of the ex-ante calculation for the study sample size as reported above. The self-reported health measure corresponds to the following text ‘In general, how would you say your health is?’ and is recorded across 5 levels ranging from bad to excellent. Self-assessed health has been shown to strongly correlate with objective measures of health (Idler & Benyamini, Reference Idler and Benyamini1997), and our randomisation process controls for any observed heterogeneity (Lindeboom & van Doorslaer, Reference Lindeboom and van Doorslaer2004) and, if subject to classical measurement error will not affect the unbiasedness or consistency of our results (Hausman, Reference Hausman2001). The remaining CHQ-CF87 scales, formed through domain aggregations of answers to individual questions, are treated as secondary outcomes. As they are based on the aggregation of individual scale responses, these were not considered appropriate as a primary outcome. They do however remain essential dimensions of soft skills.
To condense the takeaway message from this study we also further reduce the dimensionality of the 12 secondary outcomes (we exclude the primary outcome from the dimensionality reduction) into 3 aggregate variables that are intuitively labelled physical health (PH), emotional wellbeing (EW) and behaviour (B) for additional analyses. To achieve this, we follow the approach of Heckman et al. (Reference Heckman and Rubinstein2001). Specifically, we choose the items in the CHQ-CF87 secondary outcomes, which directly relate to these 3 distinct domains. Physical health comprises the individual domains of physical health, family activities, general health and physical functioning. Emotional health comprises the separate domains of self-esteem, mental health and emotional difficulties. Finally, behaviour comprises of behavioural problems, global behaviour, family activities and behaviour.Footnote 19 These variables are combined into these 3 distinct aggregates using exploratory factor analysis (for full details, see Appendix C, and the categorisation of each secondary outcome is also documented in Table 4).Footnote 20
The CHQ-CF87 coding manual details the recommended approach to deal with missing values. Specifically, most of the scales are based on an aggregation of multiple items (see Table 4), so in cases where one answer is missing, the total is imputed from those answers that are returned, assuming a pre-specified number of questions in the instrument have been answered.Footnote 21 To give balanced samples across our reported regressions of secondary outcomes, we restrict samples to those where the primary outcome question is answered. However, we do relax this restriction in a robustness analysis.Footnote 22 None of the resulting point estimates are discerningly different. In addition, in the main tables we document estimates that match treated and control groups based on baseline CHQ-CF87 characteristics at the pupil level. None of our overall conclusions change when we consider this analysis (e.g. see Table 8 column 5).
3. Methodology
The primary analysis we choose to focus on is an intention-to-treat analysis. This is justified for three reasons. First, following an intention-to-treat approach is intuitive given the recent statutory requirement for programmes like the Healthy Minds curriculum to be formally introduced into high schools in England. Second, we expect that our estimated effects may be conservative, as they allow for varying teaching quality under conditions where the programme was taught in schools as a non-compulsory subject at the time of introduction. That is, even though teacher training was given as part of the intervention, delivery may have been taken less seriously by some of the teachers administering it as compared to others. Third, an intention-to-treat approach is more flexible to allow for the possibility of (positive) spillover effects as a result of the wait list control design. This arises given that control cohorts, although in different year-groups, existed in the same school as treated cohorts. We note that a robustness analysis also excludes the wait list control schools.
Difference-in-difference estimation is the appropriate statistical approach for this study’s analyses given the time lag between observing baseline and final outcomes, which may result in too much changing between initiation and completion of the intervention to rely on the raw differences in means. We still document the raw difference in means before proceeding with our preferred models.
To consider whether there is balance across the treatment and control group, Table 3 documents the differences in means along with the associated difference in standard errors for a range of school level variables. Specifically, we draw on data at baseline (t = 0) that captured the treated and control school’s type (academy, academy-led sponsored, community or foundation), the total number of students on the school roll, the percentage of students eligible for free school meals, the percentage of students attaining at least 5 Cs (pass grades) at GCSE including English and Maths, the government (Ofsted) official rating of the school and its gender composition. We note that when considering a two-sample t-test there are no significant differences between the treatment and control schools baseline characteristics mean values for any of these variables. This implies that the treatment and control schools exhibit balance across these characteristics at t = 0.
Difference-in-difference relies on satisfying the parallel trends assumption, which implies that in the absence of the treatment the differences between the treatment and control groups are constant over time. We do not have adequate data available to test the parallel trends assumption directly. However, there are a few things to note that make this assumption likely to hold. First, in Table 3 we highlight no discernible differences in school traits at baseline. Further, based on identical data taken 4 years before baseline we also repeated this analysis and can confirm that the same conclusions hold. This implies, that these school characteristics have been stable across the treatment and control groups for at least 4 years before the initiation of Healthy Minds. Second, from Table 5, the differences in the 13 outcomes we consider in this evaluation are centred around zero and not statistically different from zero at baseline at the school level where randomisation occurred. Last, throughout the curriculum period we stayed in close contact with the treatment and control schools. We can confirm that no known changes occurred that were significant in any school, except the Healthy Minds curriculum in the treated schools. We therefore have some confidence that the parallel trends assumption holds.
Baseline differences in average outcomes for pupil level outcomes

Notes: Table 5 documents the differences in means along with the associated difference in standard errors for all our outcome variables. Specifically we draw on the pupil level outcomes at baseline (t = 0). We also calculated two sample t-tests based on these differences: *,**, *** denote significance at the 10%, 5% and 1% levels specifically.
The primary empirical analysis that we focus on (specified ex-anteFootnote 23) is therefore aimed at recovering the local average intention to treat effect, as based on the following difference-in-difference specification:
 \begin{equation}\text{yist}\,=\,\beta_\text{s}\,+\,\beta_1\,\text{treatmen}{\text{t}}_\text{s}\,\ast post_s\,+\,\beta_{2\,}\text{yea}{\text{r}}_\text{t}\,+\,\varepsilon_\text{ist}\end{equation}
where: yist is the CHQ-CF87 primary outcome variable (self-assessed health) with i indexing the individual pupil, s the school and t the time period,  ${\beta _s}$ is a set of school fixed effects, treatments is equal to 1 if a school cohort was randomised to the Healthy Minds curriculum, regardless of whether they adhered to the treatment and zero otherwise, yeart is a set of yearly dummy variables based on the year the data was collected. Treatment = 1 if the school is a treated school and post is then a dummy variable that is equal to 1 if data relates to a period after the intervention was finished. Equation (1) is estimated with baseline and final year data, including the clawed-back data. The coefficient ${\beta _1}$ then captures the average effect of being randomly assigned to the treatment with the intention of delivering the full PSHE curriculum. In other words, it represents an intention-to-treat effect. We note that the treatment dummy, included as standard in difference-in-difference equations, drops out given the inclusion of fixed effects. Standard errors are clustered at the school cohort level and estimated via wild bootstrapping.
Similar regressions are run for the CHQ-CF87 secondary outcomes. This raises the issue of multiple hypothesis testing. Therefore, we apply a correction for multiple testing, including to our primary outcome regressions. The approach adopted is that proposed by Benjamini and Hochberg (Reference Benjamini and Hochberg1995) based on testing for the false discovery rate, as calculated on the proportion of falsely rejected hypotheses in a joint test of a set of hypotheses, to adjust for the effect of multiple testing.Footnote 24
We are also able to consider how the effects of Healthy Minds differ based on the level of compliance of a school. Here, compliance is defined by identifying the schools stopping the curriculum delivery within the 4-year period, through additional data gathered on the details of the content of the programme delivered in schools over any 1-year period. In all cases of stoppage, schools did not resume teaching the programme. As the within-year taught modules are topic-specific, we therefore can calculate the proportion of the Healthy Minds curriculum that a particular school cohort achieved over time, counting each year of the 4-year programme as 0.25 completion of the intervention. Given the 4-year length of the trial, the completion rate then ranges from 0 to 1. Drawing on this measure of compliance we can estimate:
 \begin{equation}{{\text{Y}}_{{\text{ist}}}}\, = \,{{{\beta }}_{\text{s}}}\, + \,{{{\beta }}_{\text{1}}}complianc{e_s}*pos{t_s} + {{{\beta }}_{\text{2}}}{\text{yea}}{{\text{r}}_{\text{t}}}\, + \,{{{\varepsilon }}_{{\text{ist}}}}\end{equation}
 In Equation (2) 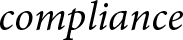 $compliance\,$denotes the proportion of the Healthy Minds programme completed by an individual school (s), with all other variables defined as for Equation (1).
There are possibly systematic differences between the schools that comply and those that do not. Therefore, we retrieve  ${\beta _1}\,$as an average treatment effect utilising assignment to treatment as an instrumental variable.Footnote 25 Given that assignment to treatment is randomised this justifies the instrument’s validity. Unsurprisingly, this instrument is strong (the F-statistic of the first stage is 125).
As indicated in Table 2, some pupils dropped out of the study, rendering their outcomes in the subsequent follow-up phases unobserved. Another robustness analysis can therefore explicitly allow for this. We can proceed by first estimating the probability of dropout among continuing individuals to construct inverse-probability weights (IPWs) to adjust for adherence. Given that we do not observe individual student demographics in the initial data collection, the weights are constructed by regressing a discrete variable, indicating whether a student remained in the study or not, on the data for their initial 13 CHQ-CF87 scales and a set of school fixed effects. These weights are then applied to adjust for adherence when re-estimating Equation (1).
A unique identifier was also assigned to pupils who answered questionnaires as part of Healthy Minds data collection, although anonymisation was retained. This allowed inclusion of pupil fixed effects in our regressions. Given the systematic differences identified at the pupil level at baseline across a range of secondary outcome measures as shown in Table 5, we therefore consider an additional robustness model that includes these pupil fixed effects, That is, we estimate:
 \begin{equation}{{\text{Y}}_{{\text{ist}}}} = {{{\beta }}_{\text{i}}}{\text{ + }}{{{\beta }}_{\text{1}}}\,treatmen{t_s}*pos{t_s}{\text{ + }}\,{{{\beta }}_{\text{2}}}{\text{yea}}{{\text{r}}_{\text{t}}}{{ + \varepsilon }}{}_{{\text{ist}}}\end{equation}
 Where  ${\beta _i}$ is a pupil fixed effect, and all other variables are defined as in Equation (1).
When estimating Equation (3) there are 5,660 observations available to us. The difference in the number of pupils as compared to the baseline model is explained by students leaving and joining the schools that were recruited into the study, in addition to some students who had their unique identifier entered incorrectly. Given that treatment assignment is random and assigned at the school level, treatment*post is orthogonal to the random noise term and the individual fixed effects. Here interest is in  ${\beta _1}$, and a random effects model would seem appropriate. Therefore, in applying this equation across the range of outcomes, we routinely test this choice explicitly using the Hausman test and estimate fixed effects models in the very few cases where random effects are not fully supported statistically.
We expect the model described in (3) to allow for systematic differences between treated and control pupils at baseline. However, to address the pupil imbalance issue further and ensure that the treated and control individuals are as similar as possible, we match the two pupil groups based on the data gathered at baseline (t = 0) that relates to the 13 CHQ-CF87 scales using propensity score matching. We then estimate the following model based on the resultant matched sample:
 \begin{equation}{{\text{Y}}_{{\text{ist}}}}{\text{ = }}{{{\beta }}_{\text{0}}}{\text{ + }}{{{\beta }}_{\text{1}}}treatmen{t_s} + {{{\beta }}_{\text{2}}}{\text{yea}}{{\text{r}}_{\text{t}}}{\text{ + }}{{{\varepsilon }}_{{\text{ist}}}}\end{equation}
Note that in Equation 4, the samples relate to the final data collection only and the model, given the matching process, contains neither school nor pupil fixed effects to allow for the identification of β1. Observations were matched using propensity scores based on baseline data, and observations not on common support were excluded from the analysis, leading to observations on 19 control pupils and 33 treated pupils being dropped. We used 1:1 matching with replacement, allowing the same case to be used as a control for multiple treated individuals, and employed a narrow calliper of 0.001. Our estimates are not sensitive to the choice of calliper. This left a sample of 3,485 pupils for this analysis (2203 = treated and 1282 = control).
Finally, there is a risk that there may be spillovers in the control groups that are waitlisted controls from simply being onboarded onto Healthy Minds. There is a possibility that this subset of controls, in expectation of being part of the study and the possibility of contaminated exposure to intervention teachers as the study progressed, altered their teaching or behaviour in some way despite not having the Healthy Minds training. We therefore further present estimates of our baseline model (see Equation 1) excluding the waitlist control schools (i.e. we consider models that exclude both the waitlist controls and waitlist treated students), based on a sample of 5,674 total observations for analysis.
4. Results
Our main estimation sample is based on 22 treatment high school cohorts (including waitlist control cohorts clawed-back for final analysis) and 13 controls. As noted above, this provided a total of 3,789 school pupils at randomisation but with dropout and clawback, 3,537 pupils with baseline and endline questionnaires for the complete period of the study (see Fig. 2 for details of allocation across treatment and control arms). This gives a total of 7,326 valid questionnaires for analysis (recorded separately for t = 0 and T = 4 in the bottom panel of Fig. 2), as this is the number of respondents who answered the primary outcome single-item question. As noted above, after further adjustment for missing secondary outcome values, our primary, cluster-balanced analysis is based on 7,252 pupils. This is made up of 3,789 pupils at the point of randomisation and 3,463 at the endpoint of the study.
This sample of 7,252 baseline and final data points is used to provide the results of our preferred intent to treat specification (Eq. 1); the sample for the estimated average treatment effect associated with the compliance model (Eq. 2); the robustness check associated with adherence based on our inverse probability weighting (IPW) and the robustness check utilising pupil fixed effects (PE). For the robustness check, after matching using the matching estimator, a sample of 3,485 returns was retrieved (2,203 = treated and 1,282 = control). For the robustness check where the waitlist cohort schools are excluded, a sample of 5,674 observations was retrieved (i.e. these observations are based on the 7,252 less the number of returns that are either treated or controls in the waitlist cohort school (total = 935 waitlist treated returns, and 643 waitlist control returns). Finally, for the analysis that considers pupil fixed effects a total sample of 5,660 was utilised (2,812 = treated, 2,848 = controls).
Table 5 documents the raw, unadjusted differences in the mean scale levels for the items in the CHQ-CF87 questionnaire between the 35 treatment and control school cohorts at baseline for the total of 3,789 pupils (the total of all pupils from t = 0 from the bottom of Fig. 2), and also at the school cohort level. Scales have been standardised to a mean of zero and standard deviation of one. A negative sign denotes that the average treated child had a worse outcome at baseline, conversely a positive sign denotes that they were better off. Table 5 also documents standard errors for these differences in brackets.
Noting that for the cluster design matching was at the school level, at the pupil level 5 of the 13 outcomes show no significant differences between the average treated and control child at baseline if we consider two-sample t-tests. This finding of no difference at baseline includes our primary outcome (self-assessed health).
However, significant differences are observed in 8 outcomes (denoted by *, **, *** to represent significance at the 10%, 5% and 1% levels respectively). Noting that we randomised at the school-cohort level, as we could identify school characteristics at the point of recruitment, rather than at the pupil characteristic level, these differences reflect within school pupil variation in baseline characteristics that were unknown ex-ante. As noted above we examine robustness to many specifications that can reasonably be assumed to accommodate these differences, including a matched analysis based on these baseline characteristics. One argument, following Imbens and Rubins’s book (Reference Imbens and Rubin2015), is that an increase in sample size leads to an increase in t-values falsely hinting at no-balance. In our case, as the number of students is substantially higher than the number of schools, differences might indeed be driven by sample size. In this case DiD is not necessary, and focus can be placed on the differences in means (which we still report). However, given the time lag between the treatment initiation and finishing we still prefer DiD as it allows for the control of trends in the education sector and society that are common across the schools.
In terms of interpretation of our results, the children assigned to the intervention, the Healthy Minds curriculum, appear to be moderately worse off at initiation in physical functioning, a further measure of general health, behaviour, global behaviour, mental health and self-esteem scales. The pupils allocated to the intervention are very slightly better off in the family activities and family cohesion scales. Our difference-in-difference modelling strategy (see Equation (1)) assumes that without the Healthy Minds curriculum these background differences would remain fixed. Other analyses (notably the pupil effects analysis described in Equation 3, along with the matching estimator described in Equation (4)) consider alternative approaches to allow for this pupil level imbalance. Our overall conclusions always remain robust to these adjustments for pupil level imbalance.
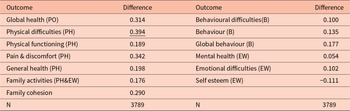
Table 6 documents the simple difference in average student outcomes between the baseline data collection (t = 0) and when the Healthy Minds curriculum ended. We note that these simple differences suggest a positive and substantive impact of Healthy Minds on the primary outcome of global health. In addition, the difference is positive for all other outcomes except for self-esteem (−0.111).
Simple differences in average pupil outcomes between t = 0 and t = 4

Notes: Table 6 documents the differences in means in average pupil outcomes for t = 0 (taken before the treatment) and t = 4 (at the end of the treatment).
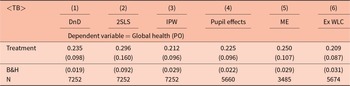
Table 7 documents the primary results of our analysis from our intent-to-treat model (see Equation 1), along with all other robustness checks described above for our primary outcome measure, self-reported general health. Given that the primary outcome is one of the 13 scales analysed from the CHQ-CF87 questionnaire, we also report standard errors adjusted for multiple comparisons, given in the rows denoted by MCC (Multiple Comparison Confidence intervals).
Estimates for global health (Primary outcome)

Notes: DnD = Difference in Differences. 2SLS = two stage least squares. IPW = Inverse Probability Weights. ME = matched estimator. Ex WLC is = excluding Wait List Controls. All models include school fixed effect, with the exception of ME. All outcomes are standardised to have a mean of 0 and a standard deviation of 1. Standard errors are in brackets and are wild bootstrapped and clustered by student with school. B&H rows document the probability of significance after the Benjamini and Hochberg correction. (Benjamini & Hochberg, Reference Benjamini and Hochberg1995) multiple comparison correction based on the 13 outcomes documented across Tables 6 and 7. We note for the random effects model that the Hausman test concluded that the estimates were consistent (p = 0.563).
For our primary outcome, as reported in Table 7, the effect of the Healthy Minds curriculum is positive and significant. The effect size is relatively stable across the six different modelling approaches we consider as an intent-to-treat analysis; an average treatment effect accounting for compliance; an adherence adjustment based on an inverse probability weighting; a robustness check based on pupil fixed effects; a robustness check based on a pupil level matching estimator; and a robustness check based on the exclusion of waitlist control schools in the case of spillover occurring (see columns (1) – (6)). For example, considering column (1) in Table 7, which documents the estimates from our primary intent to treat difference-in-difference regression described in equation (1), pupils exposed to Healthy Minds have global health attainment that is 0.235 standard deviations higher than children in the control group. This effect is significant at the 5% level of significance based on the Benjamini and Hochberg (Reference Benjamini and Hochberg1995) multiple comparison correction (B&H in Table 7 and from herein). Our estimates imply that the Healthy Minds intervention caused self-reported health to rise by 10 percentile points across the treated group. In addition, across all specifications our primary results show that the average global health attainment attributable to the Healthy Minds curriculum lies in the range of a 0.209 standard deviation (s.d.) improvement to a 0.296 s.d. improvement.
Further, interpreting the standard deviation as a measure of the effect size, we can also interpret the coefficient as equivalent to a ‘Z-score’ assuming a normal distribution of effects in the treatment and control group. Therefore, our finding of an effect size of 0.235 implies that the score of the average person in the experimental group is 0.235 standard deviations above the average person in the control group. Assuming a normal distribution around the treatment and control scores, this is consistent with 60% of the individuals in the treatment group exceeding the average score in the control group.
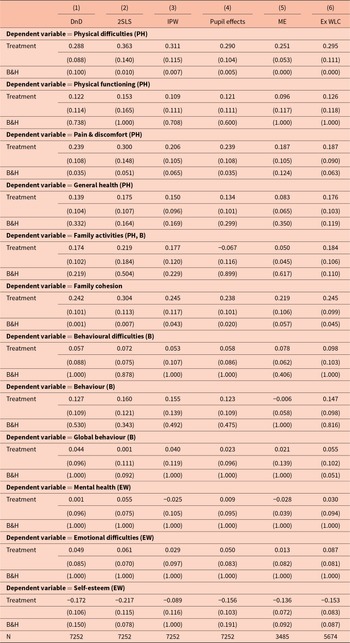
Table 8 documents the estimates for the 12 secondary outcomes that were also collected as part of the administration of the CHQ-CF87 questionnaire and follows formatting consistent with Table 7. These estimates provide evidence of significant, positive and substantive gains in a number of these secondary outcomes. In particular, the physical difficulties, pain and discomfort, family activities and family cohesion scales show significant gains. If we consider the baseline and the difference estimates, the size of these effects is to the order of 0.288, 0.239, 0.174 and 0.242 respectively. The conclusion that Healthy Minds had positive and notable effects on these secondary domains is mostly robust to considering alternate estimation strategies (see Table 8 columns (2) – (6)). The exception is family activities that become centred around zero and is not significant when we consider the pupil effects and matching estimator (ME) models.
Estimates for secondary outcomes

Notes: See Notes to Table 7. We also note that the Hausman test concluded that the estimates were consistent for physical difficulties (p = 0.65), physical functioning (p = 0.12), pain and discomfort (p = 0.22), general health (p = 0.24), family cohesion (p = 0.76), behavioural difficulties (p = 0.41), behaviour (p = 0.17), global behaviour (p = 0.10), mental health (p = 0.56), emotional difficulties (p = 0.64) and self-esteem p = (0.50), and so estimates are random effects. For family activities p = 0.01, so estimates are fixed effects.
We do note in Table 8 there is a negative estimate associated with self-esteem across all six modelling approaches, implying that the curriculum intervention has a negative impact on an individual’s self-esteem, although this finding is rarely significant when we draw on traditional t-testing or the B&H correction (it is significant at 10% level in columns (5) and (6). Still, the point estimate is relatively substantive and, assuming that this is indicative of an effect attributable to the intervention, it might be suggestive of greater self-reflection amongst adolescents as a result of receiving the intervention, although equally, it may indicate a negative effect of the programme on this particular domain (i.e. the programme draws attention to self-esteem issues which are internalised, rather than addressing them). We note, however, that all other emotional wellbeing outcomes are positive but centred close to zero (emotional difficulties and mental health). The remaining estimates across behaviour and physical health are also all positive, and while often substantive in size (for example, physical functioning, general health and behaviour) are not significant because of large standard errors.
The overall pattern in Table 8 mainly suggests that the application of Healthy Minds achieves gains in physical health, potentially some gains to behaviour (although clouded by large standard errors) and no gains to emotional wellbeing. To consider this further, we draw on the three latent factors created to reduce the dimensionality of the secondary outcome data by grouping variables as noted in Table 4, that capture physical health, behaviour and emotional wellbeing. Figure 3 then summarise our findings across these three latent factors, alongside the primary global health outcome, as a summary of the overall effects of Healthy Minds. Overall, Fig. 3a through 3d present clear evidence that Healthy Minds augments the primary outcome (global health) and also physical health. The effects for behaviour are also substantive but only consistently significant at the 10% level of significance. The overall impact on emotional wellbeing is zero and not significant across all four models.
Effects of reduced items (a) Intention to treat effects, (b) Average treatment effect on compliers, (c) IPW weights, (d) Pupil effects

4.1. Differences by Gender Footnote 26
Given that other programmes aimed at augmenting health-related life skills have found differential effects in boys as compared to girls,Footnote 27 we also investigate whether Healthy Minds has a differential impact on boys as compared to girls. This is the only marker of diversity that is available in our data. Differences in outcomes may occur, for example, if the curriculum resonates more with boys as compared to girls (or vice versa). Or indeed, if exposure to a 1-hour class discussing aspects of health and soft skills causes mean reversion.
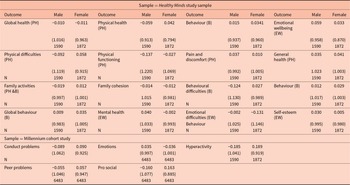
The potential for mean reversion may account for the already realised health and soft skills gaps in baseline attainment between boys and girls in the UK at age 12 when Healthy Minds begins. In Table 9 we document gender differences at age 11/12 across each of the 13 CHQ sub-scales, along with their associated standard errors. The overall message from Table 9 is that at the time of Healthy Minds baseline data collection (t = 0) males have lower starting points on behaviour, but higher starting points on emotional wellbeing. We note that these differences are also realised in the general adolescent population of the UK. In Table 9 we also present gender differences in three behavioural outcomes drawn from the Millennium Cohort Study panel that documents the general population differences at age 11/12. Specific to the Healthy Minds baseline data observed, initial gender differences vary across the CHQ sub-scale chosen, with males having a worse starting point on the primary outcome (global health) as well as physical functioning and physical differences. However, they do have a better starting point for pain and discomfort.
Gender differences for children aged 11/12: Drawn from the Healthy Minds data and the Millennium Cohort Study

Notes: In the top panel the data is drawn from the Healthy Minds survey data that is core to this study. In the bottom panel we draw on additional data from the Millennium Cohort Study (MCS), which follows the lives of around 19,000 children born in the UK in 2000 and 2001. The data from the MCS used is from parent responses on the SDQ questionnaire when the child was 11/12, which measures emotional problems. See https://www.sdqinfo.org/ for further details on the SDQ. All outcomes are back coded so higher scores indicate better outcomes. We document the gender differences for each outcome, along with their standard errors in brackets.
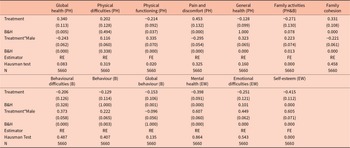
To explore the potential for heterogeneous treatment effects by gender in Healthy Minds, we add a male dummy variable and an interaction between this dummy and the treatment effect in the pupil effects analysis described in Equation (3). Table 10 documents the results. It is notable, that Healthy Minds augments many more outcomes for boys significantly and substantively.Footnote 28 Overall, boys have significantly lower gains as compared to girls in the primary outcome global health (−0.243), in addition to family cohesion (−0.221) and pain and discomfort (−0.295). However, boys do gain significantly more than girls in 9 secondary outcomes These are: physical difficulties, physical functioning, general health, family activities, behavioural difficulties, behaviour, mental health, emotional difficulties and self-esteem. The gender differences observed for the treatment effect on global behaviour are not significant.
Difference in difference estimates with gender interactions

Notes: RE is an abbreviation for random effects. See also Notes to Table 5.
We conclude that teaching health and soft skills in mixed-sex schools is not straightforward. We interpret the evidence from Table 10 as highlighting either that adolescent boys and girls learn health and soft skills differently or that teaching these skills within schools using this curriculum causes mean reversion. The data available to us does not allow us to rule out one of these explanations over the other.
4.2. Scalability of the curriculum and overall cost-effectiveness
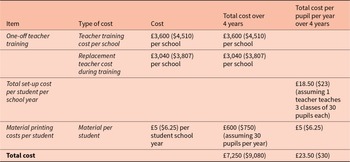
Table 11 details the costs of delivering Healthy Minds. The teacher training costs associated with the delivery of the Healthy Minds curriculum total £3,600 ($4,510)Footnote 29 per school over the 4-year programme. When replacement teacher costs are included, the amount almost doubles to £6,640 ($8,315) per school. Including reasonable estimates for materials, the total cost of delivery over the 4-year programme runs to £7,250 ($9,080) per school or £1,812.50 ($2,270) per school per year. Or assuming a single teacher teaches the curriculum to 3 classes per year of 30 pupils, this is approximately £20.10 ($25) per student taught per year. According to Belfield et al. (Reference Belfield, Crawford and Sibieta2018), secondary school spending per pupil is estimated to be £6,000 ($7,515) in 2018/19, so the Healthy Minds programme would add under 0.4% per pupil expenditure per annum to English high schools.
Cost of delivering healthy minds

Note: £–$ conversions made at April 2020 rates and subject to rounding.
To put this into context we can convert these figures into the widely adopted Quality Adjusted Life Year (QALY) gained outcome metric used in the UK healthcare sector. If we assume the scores are from a normal distribution (consistent with our use of OLS) then the cumulative distribution of the scores runs from 0 to 1. Assuming this maps against a QALY score running between 0 (worse health) and 1 (perfect health), we may use this as a proxy for a QALY score. Taking our reported result of an increase of 0.235 standard deviations in pupils’ self-reported general health, we can assume this to represent a proxy measure of the QALY gain across a [0,1] scale. We can then estimate a pessimistic QALY gain attributed to the Healthy Minds curriculum as 0.055 QALYs gained (very conservatively calculated as 0.235 * 0.235), while an optimistic estimate attributed to the treatment could be taken as 0.235 QALYs gained over each of the 4-year programme windows.
The cost of achieving these QALY outcomes is £80.40 ($101) based on a per-pupil cost per year of £20.10 ($25). Rounding this cost up to £100 ($125), then the cost per QALY achieved through the taught Healthy Minds curriculum would range between a pessimistic estimate of approximately £1,811 per QALY ($2,268 per QALY) and an optimistic estimate of £426 per QALY ($534 per QALY) gained. This range is far below the lower limit of £20,000 to £30,000 per QALY ($25,050 to $37,570 per QALY) gained threshold defined by the UK’s National Institute for Health and Care Excellence (NICE) that new healthcare treatments must fall below when introduced into the English National Health Service (NICE, 2013). It is therefore a cost-effective public health intervention if we consider NICE guidelines.
5. Conclusions
Our work evaluates an evidenced-based curriculum, Healthy Minds, delivered by trained teachers, that taught health and soft skills to adolescents. The curriculum was rolled out as a cluster randomised trial involving 35 state-funded English high schools over a 4-year period. We focus on the impact that this Healthy Minds curriculum has on the domains of health, behaviour and emotional wellbeing as measured by the validated CHQ-87 instrument. We find that the Healthy Minds curriculum increases the primary outcome of this study, self-assessed health, by 0.235 standard deviations. This is consistent with more than 60% of individuals in the treatment arm returning a self-assessed general health improvement, our primary outcome, above that of the average achieved in the control arm. In addition, we find robust evidence that the Healthy Minds curriculum positively augments many other physical health domains. Our results also provide evidence (significant at the 10% significance level) that the Healthy Minds programme positively affects adolescent behaviour. We note that our strategy of principally targeting disadvantaged school populations implies limits to the external validity of our estimates to schools with below-average attainment in the UK.
Such a complex evaluation, based on a school cluster design aimed at eliciting adolescent pupil-level achievements over a lengthy period is going to be susceptible to potential biases. To address the obvious limitations, we conducted extensive robustness checks, which allowed for the main analytical difficulties associated with randomised trials. These wide-ranging supplementary analyses include randomisation issues (dealt with through an intent-to-treat analysis), multiple hypothesis testing (using a Benjamini and Hochberg adjustment); school curriculum compliance (using detailed summaries of compliance with the programme) and curriculum adherence (using Inverse Probability Weighting). In addition, we address baseline pupil imbalance across some of the outcomes analysed using pupil fixed effects and separately a pupil matching analysis. Finally, given that some of our school-cohorts come from waitlist control schools,Footnote 30 we exclude all possible within-school spillover effects by dropping these school-cohorts from our analysis. Our primary results are consistently supported by these robustness approaches that address the major design and rollout issues associated with our evaluation.
Our results did indicate that the programme has no or a small negative impact across a range of indicators of adolescent emotional wellbeing. The cause of these adverse emotional wellbeing findings goes against our assumed mechanism of action that the Healthy Minds curriculum promotes soft skills and is therefore not fully understood, warranting further consideration. We speculate that raising self-awareness at a time of adolescence, a development period known to be associated with great flux, might make pupils more likely to identify self-esteem issues, and if true possibly the programme needs to be better at tackling these issues of adolescent introspection after raising awareness.
In considering heterogeneous treatment effects by boys as compared to girls, we highlight that adolescent boys have significant gains in many more outcomes. Moreover, in several domains, the outcomes for girls are negatively impacted. Differential effects by boys as compared to girls are commonly found in programmes that aim to teach life skills, but it does raise a question on how these programmes should be taught to ensure that everyone is a ‘winner’ in mixed-sex schools. Our results highlight that attention should be paid both to differential starting points in soft skills causing mean reversion, as well as different learning styles. This remains an important avenue for future research on adolescent development.
Our strategy of principally targeting disadvantaged school populations and ultimately being pragmatic in recruitment led to further study constraints. Given that resource constraints are arguably more binding in the sampled high schools, our selection strategy may also have contributed to retention and compliance difficulties. It remains an open question whether our measures of health and soft skills are more heterogeneously distributed within sampled schools than in more advantaged school populations. It is possible that if the Healthy Minds curriculum was introduced more widely on a compulsory basis or indeed to higher attainment schools, stronger impacts could be achieved. The minimal training requirements and the overall cost-effectiveness of the programme suggest that it is a scalable programme. Our results are suggestive of the impact a structured PSHE curriculum may achieve rather than authoritative given recruitment issues may impede the generalisability of the results.
While acknowledging this limitation, it is also true that there is a widely accepted lack of evidence on the impact that targeted schooling can have on adolescents’ health and soft skills. The lack of knowledge over best high schooling practice in this area itself reflects the thin literature on the impact that schooling has on adolescent health and soft skill outcomes generally. Durlak et al. (Reference Durlak, Weissberg and Pachan2010), in a meta-analysis of after-school programmes (APS) aimed at improving personal and social skills, explicitly comments on the small number of studies reviewing impacts on adolescents. There is simply little knowledge on the impact of soft skill interventions aimed at this age group; the ‘missing middle’ as Almond et al. (Reference Almond, Currie and Duque2018) and Currie (Reference Currie2020) have called it. Overall, when adolescents and their health and social skills are studied, attention is typically directed to school performance and employment outcomes, rather than their health, behaviour or general soft skills (e.g. see Kautz et al., Reference Kautz, Heckman, Diris, ter Weel and Borghans2014).
Preparing adolescents for a healthy and happy life is important. Reflecting this, the policy debate in England has culminated with the UK government introducing guidance in 2019 that obliges secondary schools to timetable a PSHE curriculum as a compulsory lesson in 2020/21, although without determining curriculum content. Our work, in evaluating a carefully designed, structured PSHE intervention highlights that a formally taught health and soft skills curriculum embedded within the normal school year can attain gains at the high school level. This evidence, that health and soft skills are teachable within a structured programme in adolescents, is therefore good news for pupils who may have fallen behind in attaining these essential life skills, a particular issue arising from the disruption of schooling during the COVID pandemic (Lewis et al., Reference Lewis, Munro, Smith and Pollock2021; Tang et al., Reference Tang, Xang, Cheung and Xiang2021). Especially given the potential long-lasting impact of these skills on important adult outcomes like health, wealth and happiness.
Supplementary material
The supplementary material for this article can be found at https://doi.org/10.1017/esa.2025.10017.
Acknowledgements
We are very grateful for the detailed comments received from Richard Layard, Richard Blundell, Steve Machin, Carol Propper and Ian Walker, as well as participants at the LSE Department of Health Policy, London Health Economics Group. A special thanks to Bounce Forward for delivering the programme, HcareSolutions for independently collecting the data and Amy Challen for her invaluable research assistance during the initial phase of this project.
We acknowledge funding from the UK Education Endowment Fund (EEF), Templeton Trust and the LSE.



 Open access

