





In the United States, among adults, compared to those residing in urban neighbourhoods, rural residents experience significantly higher rates of cardiovascular mortality. Reference Marinacci, Zheng, Mein and Wadhera1,Reference Harrington, Califf and Balamurugan2 These rural–urban disparities in cardiovascular outcomes are believed to be multifactorial including increased preponderance of cardiovascular risk factors such as diabetes, hypertension and obesity among rural residents, use of tobacco, alcohol and mental health illnesses, social determinants of health issues and poor healthcare delivery to rural residents. Reference Harrington, Califf and Balamurugan2 As the burden of paediatric congenital and acquired cardiovascular disease is increasing, it is important to understand if similar disparities exist among children. This study evaluated national trends in paediatric cardiovascular mortality by age, sex, race/ethnicity and geography over a 20-year period.
A retrospective analysis of the Centers for Disease Control and Prevention Wide-ranging Online Data for Epidemiologic Research mortality database was conducted. This study included individuals 0 to 19 years of age with cardiovascular deaths between 2003 and 2023, identified using International Classification of Diseases, 10th Revision (ICD-10) codes for diseases of the circulatory system (I00–I99) and congenital malformations of the circulatory system (Q20–Q26). Cleveland Clinic Institutional Review Board approval was not obtained for this analysis because of the use of publicly available, deidentified data. Urbanisation was categorised using the 2013 Centers for Disease Control and Prevention Urbanization Code into three groups: large metropolitan (≥1 million residents), medium/small metropolitan (50,000–999,999), and nonmetropolitan (<50,000). Reference Marinacci, Zheng, Mein and Wadhera1 The primary outcome of the study was the crude death rate calculated as the number of deaths / populations *100,000. Differences in the 10-year mortality rates for each predictor were assessed using two-sample Student’s t-tests based on the absolute differences in crude death rate between 2003, 2013, and 2023. Poisson regression models were used to estimate the annual percentage change in crude death rate for each predictor. Interaction terms were included to test for differential trends across predictor categories. All analyses were conducted using SAS© v9.4 with statistical significance set at p < 0.05.
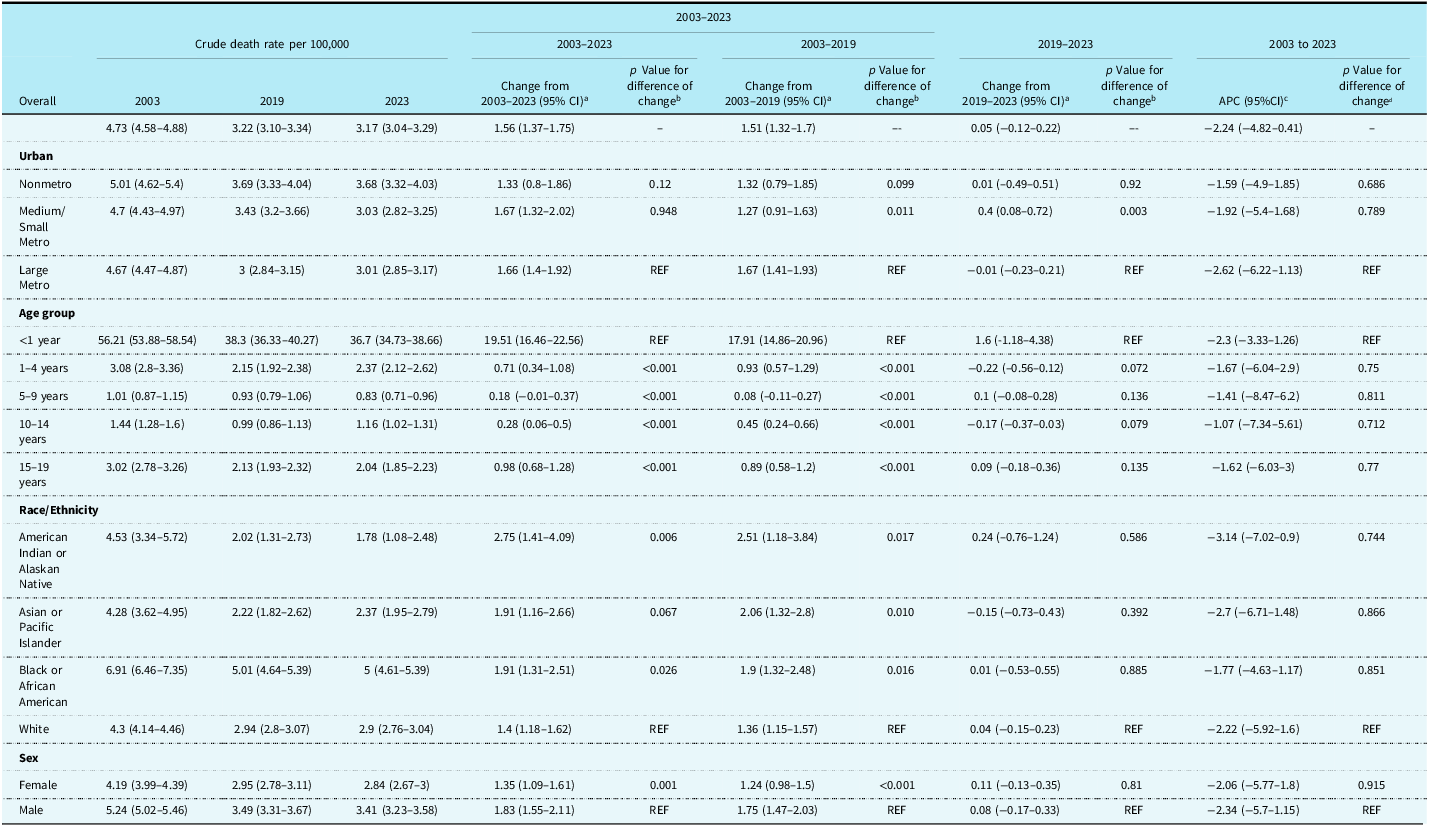
From 2003 to 2023, the overall paediatric cardiovascular crude death rate declined from 4.73 (95% CI, 4.58–4.88) to 3.17 (95% CI, 3.04–3.29) per 100,000, an absolute reduction of 1.56 (95% CI, 1.37–1.75). The annual percentage change was −2.24% (95% CI, −4.82 to 0.41).
By urbanisation, nonmetropolitan counties experienced a reduction from 5.01 to 3.68 per 100,000 (absolute reduction 1.33; annual percentage change −1.59%; P = 0.686 for difference versus large metro), medium/small metropolitan counties from 4.70 to 3.03 (absolute reduction 1.67; annual percentage change −1.92%; P = 0.789), and large metropolitan counties from 4.67 to 3.01 (absolute reduction 1.66; annual percentage change −2.62%; reference group). During 2019–2023, the absolute change in crude death rate in medium/small metropolitan areas was -0.4, which was significantly lower than the 0.01 increase observed in large metropolitan areas (P = 0.003).
By age group, infants (<1 year) had the largest absolute decline, from 56.21 to 36.70 per 100,000 (absolute reduction 19.51; annual percentage change −2.3%). Children aged 1–4 years declined from 3.08 to 2.37 (absolute reduction 0.71; annual percentage change−1.67%); 5–9 years from 1.01 to 0.83 (absolute reduction 0.18; annual percentage change −1.41%); 10–14 years from 1.44 to 1.16 (absolute reduction 0.28; annual percentage change −1.07%); and adolescents aged 15–19 years from 3.02 to 2.04 (reduction 0.98; annual percentage change −1.62%).
There was an improvement in the crude death rate across racial/ethnic groups. Among Black children, mortality declined from 6.91 to 5.00 per 100,000 (absolute reduction 1.91; annual percentage change −1.77%; P = 0.026 vs. White), White children from 4.30 to 2.90 (absolute reduction 1.40; annual percentage change −2.22%; reference), Asian/Pacific Islander from 4.28 to 2.37 (absolute reduction 1.91; annual percentage change −2.70%), and American Indian/Alaska Native from 4.53 to 1.78 (absolute reduction 2.75; annual percentage change −3.14%; P = 0.006).
By sex, mortality declined among male children from 5.24 to 3.41 per 100,000 (absolute reduction 1.83; annual percentage change −2.34%; reference), and female children from 4.19 to 2.84 (absolute reduction 1.35; annual percentage change −2.06%; P = 0.915) (Table 1).
Overall and annual percent changes in cardiovascular mortality rates for patients 0 to 19 years of age

Table 1. Long description
The table presents crude death rates per 100,000 for children aged 0 to 19 years from 2003 to 2023, categorized by overall, urban, age group, race/ethnicity, and sex. It includes data for the years 2003, 2019, and 2023, as well as changes over different periods: 2003-2023, 2003-2019, and 2019-2023. The table also provides p-values for the differences in changes and annual percentage changes (APC) with their confidence intervals. Notable trends include a decline in mortality rates among male children from 5.24 to 3.41 per 100,000 and among female children from 4.19 to 2.84 per 100,000. The table highlights significant reductions in death rates across various categories and time periods.
a The absolute difference in crude death rates (per 100,000) between the start and end of the time period.
b P Value for the absolute difference.
c The annual percent change (APC) over the 21-year period.
d The P value for the APC.
In this comprehensive study evaluating paediatric cardiovascular mortality rates over two decades, we found that there has been an overall improvement in cardiovascular mortality across ages, sex and racial/ethnic groups (Figure 1). Although not addressed by this study, this is likely attributable to the improvements in early detection, prompt referral and care for children with complex congenital and acquired heart disease at specialised cardiovascular centres. Also importantly, unlike adult cardiovascular disease, we found no persistent rural–urban disparities in paediatric cardiovascular mortality. This difference is probably attributable to the centralised referral process for children with congenital and acquired cardiovascular disease to specialised cardiovascular centres regardless of geographic location. Reference Welke, Pasquali and Lin3,Reference Caldarone and Backer4 In addition, the presence of universal paediatric care access and the significantly lower disease prevalence reduces healthcare delivery factors that contribute to the disadvantage seen among adults residing in rural locations.
Trends in paediatric cardiovascular mortality by ( a ) urbanisation, ( b ) age, ( c ) race/ethnicity and ( d ) sex.

Figure 1. Long description
The image contains four line graphs showing trends in pediatric cardiovascular mortality from 2003 to 2023. The first graph (a) compares mortality rates by urbanization levels: large metro, medium/small metro, and nonmetro areas. The second graph (b) shows mortality rates by age groups: 1-4 years, 5-9 years, 10-14 years, and 15-19 years. The third graph (c) illustrates mortality rates by race/ethnicity: American Indian or Alaska Native, Asian or Pacific Islander, Black or African American, and White. The fourth graph (d) compares mortality rates by sex: female and male. Each graph has the x-axis representing the years from 2003 to 2023 and the y-axis representing the crude death rate. The trends indicate variations in mortality rates across different urbanization levels, age groups, races/ethnicities, and sexes over the specified period. All values are approximated.
Our study does have a few limitations. The database reports death counts for categories with more than 9 deaths, potentially underrepresenting rare diagnoses. Also, any misclassification in the cause of death or other demographic, racial/ethnic or geographic variables could affect our results.
In conclusion, unlike adults, where there are ongoing rural–urban disparities in cardiovascular mortality, among children, cardiovascular mortality has declined across rural and urban regions in the United States. Future studies should evaluate referral practices, paediatric cardiovascular care centralisation and other structural factors that may explain this parity and how such models could offer lessons to reduce disparities in adult cardiovascular mortality.
Acknowledgements
S.A has contributed to the design and interpretation of data; drafting of the manuscript along with revisions; and participated in the final approval of the manuscript submitted. A.C conducted the analysis, and both B.M and A.C. participated in the drafting of the manuscript along with revisions; and participated in the final approval of the manuscript submitted. During the preparation of this manuscript, the author(s) used [ChatGPT, GPT-4o architecture] for the purpose of editing the manuscript to enhance readability and clarity. The authors have re-viewed and edited the output and take full responsibility for the content of this publication.
Financial support
The author(s) received no funding for this work.
Competing interests
Dr Amdani is the site principal investigator for a multicentre study led by the University of Michigan and site principal investigator for FUEL-2 (Fontan Udenafil Exercise Longitudinal Assessment Trial, Mezzion) and has received no salary support. No other author(s) have any disclosures to report.


 Open access

