

1. INTRODUCTION
The Greenland ice sheet (GrIS) has experienced elevated rates of melt since the 1990s (van den Broeke and others, Reference van den Broeke2009; Fettweis and others, Reference Fettweis, Tedesco, van den Broeke and Ettema2011, Reference Fettweis2013). In addition to driving surface mass loss, observations and modelling suggest that higher rates of surface melting may lead to dynamic changes of the ice sheet (Hewitt, Reference Hewitt2013; Doyle and others, Reference Doyle2014; Moon and others, Reference Moon2014; Tedstone and others, Reference Tedstone2015; Van De Wal and others, Reference Van De Wal2015). Correlations between the summer melt season and increased summer ice velocities indicate that surface meltwater entering the subglacial system modulates water pressures, influencing ice velocities through changes in basal drag (Zwally and others, Reference Zwally2002; Bartholomew and others, Reference Bartholomew2011; Joughin and others, Reference Joughin2013; Fitzpatrick and others, Reference Fitzpatrick2013; Moon and others, Reference Moon2014). Recent modelling studies of the subglacial hydrological system report that the temporal variability of meltwater input (Schoof, Reference Schoof2010; Hewitt, Reference Hewitt2013) is an important control on basal drag. However, the role of the supraglacial hydrological system in determining spatial and temporal patterns of meltwater delivery to the ice-sheet bed remains poorly understood. Water draining into the englacial system can be trapped in crevasses, leading to modest increases in ice velocities due to cryohydrologic warming of the ice sheet (Van Der Veen and others, Reference Van Der Veen, Plummer and Stearns2011; Phillips and others, Reference Phillips, Rajaram, Colgan, Steffen and Abdalati2013; Lüthi and others, Reference Lüthi2015; Harrington and others, Reference Harrington, Humphrey and Harper2015; Poinar and others, Reference Poinar, Joughin, Lenaerts and Van Den Broeke2016).
A significant proportion of surface meltwater drains via the subglacial system, with observations at the ice margin showing the majority of water exiting through subglacial channels and only limited flow over the ice edge (Zwally and others, Reference Zwally2002). Meltwater enters the subglacial system via crevasses, moulins and surface-to-bed connections created during lake hydrofracture events. Mapping of supraglacial stream networks in the ice-sheet watershed of Leverett glacier, southwest Greenland shows all meltwater rivers draining into the englacial hydrological system prior to reaching the ice margin (Smith and others, Reference Smith2015). However, Poinar and others (Reference Poinar2015) predict that surface stresses limit the formation of pathways from the surface to the ice bed to below ~1600 m elevation; above this, observations show water draining over the ice-sheet surface many kilometers downstream to lower elevations before entering a meltwater pathway.
Surface meltwater on the GrIS forms stream networks and collects in lakes. Lakes may drain slowly by incision of a channel at their edge releasing water downstream, or drain rapidly through hydrofracture to the ice/bed interface (Tedesco and others, Reference Tedesco2013). Hydrofracture events are hypothesized to be triggered when increased basal slip generates tensile stresses beneath lakes (Stevens and others, Reference Stevens2015). Since the observation that lake hydrofracture events temporarily increase local ice velocities (Das and others, Reference Das2008; Doyle and others, Reference Doyle2013; Tedesco and others, Reference Tedesco2013), much work has been focused on understanding the relation between surface melt and lake distribution (Sundal and others, Reference Sundal2009; Selmes and others, Reference Selmes, Murray and James2011; Liang and others, Reference Liang2012; Leeson and others, Reference Leeson2013; Morriss and others, Reference Morriss2013; Fitzpatrick and others, Reference Fitzpatrick2014).
Supraglacial modelling of the GrIS has focused on lake development and hydrofracture. Such models demonstrate that although lakes have limited storage capacity relative to annual surface melt (Leeson and others, Reference Leeson, Shepherd, Palmer, Sundal and Fettweis2012), hydrofracture events and the subsequent surface-to-bed connections created can transfer significant amounts of water to the bed (Banwell and others, Reference Banwell, Arnold, Willis, Tedesco and Ahlstrøm2012a; Arnold and others, Reference Arnold, Banwell and Willis2014; Clason and others, Reference Clason2015). To date, only Clason and others (Reference Clason2015) include surface drainage other than by lake hydrofracture, applying the method developed in Clason and others (Reference Clason, Mair, Burgess and Nienow2012) for the Devon Ice Cap. Drainage into crevasses and moulins outside of lake basins is simulated by applying a hydrofracture criterion, similar to that of lakes, to grid cells in the model where surface stresses exceed a prescribed surface tensile strength. Clason and others (Reference Clason2015) report that while surface-to-bed connections via lake hydrofracture have the dominant role above ~1000 m elevation, moulins and crevasses are the key transport mechanism below ~1000 m.
In this paper, we enhance the surface routing and lake filling (SRLF) component of the model of Banwell and others (Reference Banwell, Arnold, Willis, Tedesco and Ahlstrøm2012a) and Arnold and others (Reference Arnold, Banwell and Willis2014) to allow drainage into crevasses and moulins outside of lake basins. Additionally, we also simulate the slow surface drainage of lakes via channel incision at their edge following Raymond and Nolan (Reference Raymond and Nolan2000), allowing water to escape from closed lake basins and potentially flow into downstream moulins, crevasses, or lakes. We apply the updated model to the Paakitsoq region of western Greenland over three melt seasons with contrasting melt intensities, incorporating moulins identified from high resolution satellite imagery, and crevassed areas determined from surface stresses derived from mean winter velocities. In order to better understand surface drainage, we use the model to quantify the partitioning of meltwater draining into moulins, crevasses and surface-to-bed connections from lake hydrofracture. We also investigate the spatial variability of surface drainage and the impact of higher intensity melt seasons.
2. METHODS
The SRLF model simulates surface flow and lake formation across the GrIS. It has been previously applied to a ~100 km2 area of the Paakitsoq region by Banwell and others (Reference Banwell, Arnold, Willis, Tedesco and Ahlstrøm2012a) to successfully predict the filling of a supraglacial lake. When applied over a wider ~3600 km2 area of the Paakitsoq region, SRLF model predictions using the Greenland Mapping Project (GIMP) DEM (Howat and others, Reference Howat, Negrete and Smith2015) show good agreement with observed lake depths and extents, as well as the generally observed spatiotemporal pattern of lake hydrofracture drainages (Arnold and others, Reference Arnold, Banwell and Willis2014). Previous work with the model however, has neglected drainage into moulins outside of lake basins, as opposed to those caused by hydrofracture, and into crevasses. We develop the model in this paper to allow drainage into these surface features, as well as to allow lakes to drain through supraglacial channel incision.
The SRLF model requires a DEM of the study area, an ice thickness map and the locations of moulins and crevasses. The model is driven by time series of distributed melt runoff and distributed snow depth. We first discuss the formulation of the model itself before describing the study area, and the datasets used as model inputs and driving variables. We then discuss the design of the model runs used to explore the sensitivity of the model to certain parameters, and to assess the impact of different melt season intensities on the model results.
2.1. Model formulation
Water flow is modelled as Darcian flow in a saturated layer at the base of the snowpack when snow depth is >0.7 m, and as open channel flow otherwise. The 0.7 m snow depth threshold for stream formation is based on calibration simulations performed by Banwell and others (Reference Banwell2012b). A single flow direction algorithm is used to determine water routing. For each sink cell in the model domain, the SRLF model calculates an input hydrograph by integrating the travel time of water in the cells forming the upstream catchment. Sink cells may be moulins, crevasses, lake depressions, or exit points on the lateral domain boundaries. All water entering moulins and crevassed cells is captured. We assume that these cells have either sufficient storage capacity or drain into the englacial system, and that overflow does not occur.
Depressions in the DEM collect water, forming lakes. Lake hydrofracture is modelled to occur when the volume of water in a lake is sufficient to fill a fracture penetrating the local ice thickness to the base. The length and width of the potential fracture are prescribed, using a fracture surface area parameter (F a). The F a parameter is constant across the whole model domain. Sensitivity analysis by Arnold and others (Reference Arnold, Banwell and Willis2014) show that a value of F a in the range 4000–8000 m2 results in the best agreement between modelled and observed lake volumes from satellite imagery. If a lake induces hydrofracture, all additional water input into the lake depression is assumed to drain via a surface-to-bed connection located in the lowest cell of the depression, which remains open for the remainder of the melt season. Alternatively, a lake that is filled to capacity will route additional water into the downstream catchment; this can lead to incision of a channel at the lip, and can result in channelized supraglacial drainage.
Analysis of supraglacial lake drainage in Moderate-resolution Imaging Spectroradiometer (MODIS) imagery by Selmes and others (Reference Selmes, Murray and James2013) shows that approximately a third of supraglacial lakes drain slowly over the surface of the ice. This is thought to occur through a channel incised at the edge of the lake into the ice by water draining from the lake (Selmes and others, Reference Selmes, Murray and James2013; Tedesco and others, Reference Tedesco2013). Raymond and Nolan (Reference Raymond and Nolan2000) developed a spillway model (Fig. 1) to investigate lake drainage through such an exit channel, which we apply to lakes on the GrIS in the SRLF model. Our modelling implements Eqns (1) and (2), which describe the evolution of the channel and the lake surface height (Raymond and Nolan, Reference Raymond and Nolan2000).
 $$\displaystyle{{\rm d} \over {{\rm d}t}}(h_{\rm s} ) = \displaystyle{{ - \rho _{\rm w} gk\beta ^{1/2}} \over {\rho _i L}}(\beta + \gamma )(h_{\rm l} - h_{\rm s} )^{5/3} $$
 $$\displaystyle{{\rm d} \over {{\rm d}t}}(h_{\rm l} ) = \displaystyle{{ - k\beta ^{1/2} W_{\rm s}} \over {A_l (h_{\rm l} )}}(h_{\rm l} - h_{\rm s} )^{5/3} + \displaystyle{{Q_i} \over {A_{\rm l} (h_{\rm l} )}}$$
where h s is the height of the channel floor, h i is the height of the lake surface, ρ w is the density of water, ρ i is the density of ice, g is the acceleration due to gravity, k is a channel discharge parameter related to channel roughness and cross-section shape, β is channel slope, L is the latent heat of fusion per unit mass, W s is channel width, Q i is water input into the lake and A l is the surface area of the lake as a function of the height of the lake. The dimensionless heat transfer parameter γ is defined as γ = C wT/gx, where C w is the heat capacity per unit mass of water, T is the temperature of water in a lake above the freezing point and x is the distance over which the water temperature drops to the freezing point in a channel. A list of model parameters is given in Table 1.
Schematic cross section of a lake undergoing channelized drainage, which is modelled by Eqns (1) and (2), adapted from Raymond and Nolan (Reference Raymond and Nolan2000).

Table of parameters and values for SRLF model simulations

The first section lists physical constants, the second section lists model parameters.
The channel floor is melted due to heat dissipated from the water flowing in the channel. The model assumes two sources of heat. The first is the conversion of gravitational potential energy to heat, while the second is the thermal energy of the water exiting the lake. These are transferred to the channel floor according to the average slope of the channel and the rate of cooling of water in the channel. This is represented by the sum (β + γ) in Eqn (1) (Raymond and Nolan, Reference Raymond and Nolan2000).
Lakes form in depressions in the DEM, and are assumed to have an idealized conical hypsometry, the dimensions of which are derived from the topographic depression. Lakes overflow when the height of the water in the lake exceeds the lowest cell of the edge of the depression. Once a lake fills, we allow for two methods of drainage: overflow drainage and channelized drainage. Overflow drainage refers to when water beyond the capacity of the lake is removed and routed downstream from the lake outlet without contributing to channel incision. Channelized drainage refers to when a channel forms at the lake outlet, allowing water above the channel base to drain, with drainage deepening the channel; in this case, water drains from the lake, decreasing the volume of water.
In the SRLF model, all lakes which do not hydrofracture have the potential to drain over the ice-sheet surface. Channelized drainage is assumed to occur only if the channel elevation decreases faster than the lake water height (i.e. d/dt(h s) < d/dt(h l)). Otherwise, only simple overflow drainage is assumed to occur. Channelized and overflow drainage occur simultaneously if water drainage through a channel is not sufficient to prevent the lake surface height from rising above the limit of the topographic depression.
The model requires a fixed initial channel geometry. The initial depth is set as a model parameter, while the width is set to a fixed value of 5 m, which was selected as a representative value of the range of channel widths observed in WorldView imagery. The top of the channel is set at the elevation of the lake edge. Fixed channel dimensions are necessary since channel initiation is not modelled, and since channels in the model only incise downwards, not outwards. We use the same initial geometry for all channels in the model domain. Channels are assumed to open instantaneously once drainage begins, simulating rapid removal of blocking snow. This assumption implies that any channelization from previous years will only have an effect up to the initial channel depth, neglecting the impact of previous years melt intensity on channel formation. Once a channel opens, the channel begins to incise following Eqns (1) and (2). Since channel drainage depends on Q i, the method of drainage for lakes undergoing overflow drainage is re-evaluated each time step. Alternatively, if channelized drainage does not occur, excess water is removed via overflow drainage.
The change in lake height and channel bottom height are modelled using the ode15s solver in Matlab. If the lake is draining via a channel, and there is an input of water greater than the channel can discharge, causing the water volume in the lake to exceed the volume of the DEM depression, excess water is removed via simple overflow. There is no mechanism for channels to close, and all water entering a fully drained lake is routed downstream.
Following Arnold and others (Reference Arnold, Banwell and Willis2014) we initiate each model run with a DEM devoid of water. This assumption is based on statistics from Johansson and others (Reference Johansson, Jansson and Brown2013), who reported that for a study area south of the Paakitsoq region 78–88% of lakes below 2500 m drained during the 2007–09 melt seasons. Similar to Arnold and others (Reference Arnold, Banwell and Willis2014), we impose no-inflow boundary conditions, while allowing water to flow out of the model domain. This is justified on the eastern boundary as it extends beyond 1500 m, where melt is limited. The northern and southern boundaries of the model were selected to be approximately perpendicular to elevation contours leading to limited outflow; modelling results (see Section 3) show that ~11% of surface melt generated in the study area exits through the northern and southern boundaries. Outflow from the western boundary represents water flowing off the ice sheet.
2.2. Study area and DEM
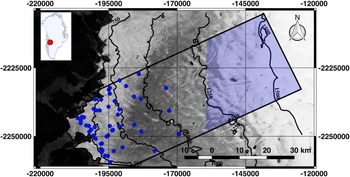
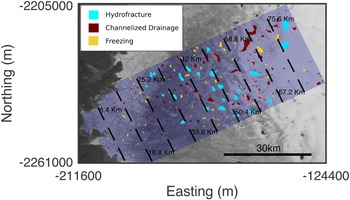
We apply the SRLF model to a land terminating sector of the GrIS in the Paakitsoq region of western Greenland (Fig. 2). The study area is ~31 km in width, ~84 km in length and ~2368 km2 in area. The GIMP DEM at 90 m resolution is used as input to the SRLF model for all three melt seasons. Following Arnold and others (Reference Arnold, Banwell and Willis2014), we smooth the DEM using a 2 × 2 cell median filter to remove small scale noise, and then an 11 × 11 cell Guassian filter to remove the ‘terracing’ effect of the 1 m vertical resolution of the data.
Location map of the study area. Black outline shows the model domain, while blue markings denote moulin locations derived from WorldView imagery. Blue highlight indicates where appropriate WorldView imagery was unavailable. Base-map shows a Landsat-8 image from 4 August 2014; contour lines are from the GIMP DEM (Howat and others, Reference Howat, Negrete and Smith2015). Red dot in inset locates the Paakitsoq region in Greenland.

Previous work (Arnold and others, Reference Arnold, Banwell and Willis2014) found good agreement between the GIMP DEM and observed lake locations and volumes in Landsat imagery. Since lake forming depressions are controlled by basal topography, and are not observed to advect with ice flow (Echelmeyer and others, Reference Echelmeyer, Clarke and Harrison1991; Selmes and others, Reference Selmes, Murray and James2011), we expect the locations of lake depressions in the DEM to be valid over multiple melt seasons.
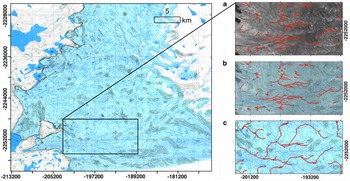
Yang and others (Reference Yang, Smith, Chu, Gleason and Li2015) report that calculated stream networks from DEMs match the broad scale drainage patterns mapped from satellite imagery. Comparison of stream locations (Fig. 3) mapped for 2009 to those in 1985 (Thomsen, Reference Thomsen1988) over a portion of the Paakitsoq region shows that streams develop over a similar area. We therefore also expect stream locations derived from the DEM to be applicable over multiple melt seasons.
Supraglacial hydrological features delineated within the Paakitsoq region. Main panel: Map of Paakitsoq region showing surface features, including stream locations (Thomsen, Reference Thomsen1988). Inset: (a) Supraglacial stream positions delineated in 2009 WorldView imagery (red markings) overlain on the WorldView image. (b) Supraglacial stream positions delineated in 2009 WorldView imagery (red markings) overlain on the map by Thomsen (Reference Thomsen1988) highlighting coincidence of stream locations. (c) Calculated supraglacial stream locations overlain on the map by Thomsen (Reference Thomsen1988).

Lake hydrofracturing can be conceptualized as dependent on the ice thickness and threshold water volume (Krawczynski and others, Reference Krawczynski, Behn, Das and Joughin2009). To determine ice thicknesses, we employ the BedMachine dataset (Morlighem and others, Reference Morlighem, Rignot, Mouginot, Seroussi and Larour2014, Reference Morlighem, Rignot, Mouginot, Seroussi and Larour2015).
2.3. Crevasse and moulin locations
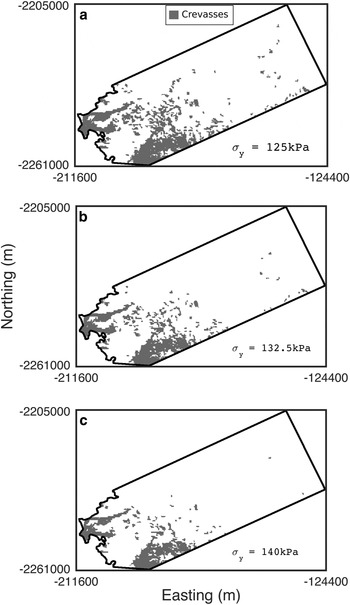
We use the von Mises yield criterion (Vaughan, Reference Vaughan1993; Clason and others, Reference Clason2015) to predict the occurrence of crevassed areas in the study site (Fig. 4). Surface stresses derived from winter velocities (Joughin and others, Reference Joughin, Smith, Howat, Scambos and Moon2010a, Reference Joughin, Smith, Howat, Scambos and Moonb) are used to determine von Mises stresses across the study area. Following Clason and others (Reference Clason2015), we visually compare the distribution of von Mises stress to areas of crevassing observed in satellite imagery to determine a yield strength (σ y). Crevasses are predicted to form in cells where the von Mises stress exceeds the yield strength. A yield strength of 132.5 kPa is determined to have the best visual match between predicted crevasses and the prominent crevasse fields in the lower study area. We perform a sensitivity test using yield strengths of 125 and 140 kPa, which increase and decrease the crevassed area by 32 and 25%, respectively.
Predicted crevassed areas in the study domain for three different ice yield strengths. (a) 125 kPa. (b) 132.5 kPa. (c) 140 kPa.

WorldView images acquired during the 2009 and 2010 melt seasons were visually inspected to determine moulin locations. Although these images provide good coverage of the lower and mid elevations of our study area, suitable WorldView imagery is unavailable for the uppermost region of the study site (Fig. 2). However, since we observe moulin density to decrease away from the ice margin in the available imagery, we do not expect moulins to occur outside of lake basins in the upper region of the study site.
Moulins are identified in the imagery as the abrupt ending of a stream. In total 45 moulins are identified, which are located outside of topographic depressions in the DEM. The SRLF model is initialized with moulins at these locations. Moulins with locations coincident with depressions in the DEM are not used; rather, we allow the SRLF model to predict whether a surface-to-bed connection will form by lake hydrofracture in these locations. The locations of the 45 moulins outside of DEM depressions are compared with the drainage paths calculated for the DEM with an upstream area calculation using a single flow direction algorithm. Similarly to Yang and others (Reference Yang, Smith, Chu, Gleason and Li2015), we find that simulated supraglacial stream channel positions deviate slightly from those observed in imagery. We therefore adjust the position of these 45 observed moulin positions to align with simulated stream channels. Any moulins not falling on a simulated stream location are relocated to the nearest DEM cell with a simulated stream. The mean distance these 45 moulins are moved is 198 m, which is approximately two DEM grid cells. For moulins on potential stream paths that were calculated to be >1 cell wide (90 m), the effective moulin radius was set so that the moulin would capture all water in the stream, rather than allowing some water to effectively bypass the adjacent moulin.
2.4. Driving variables
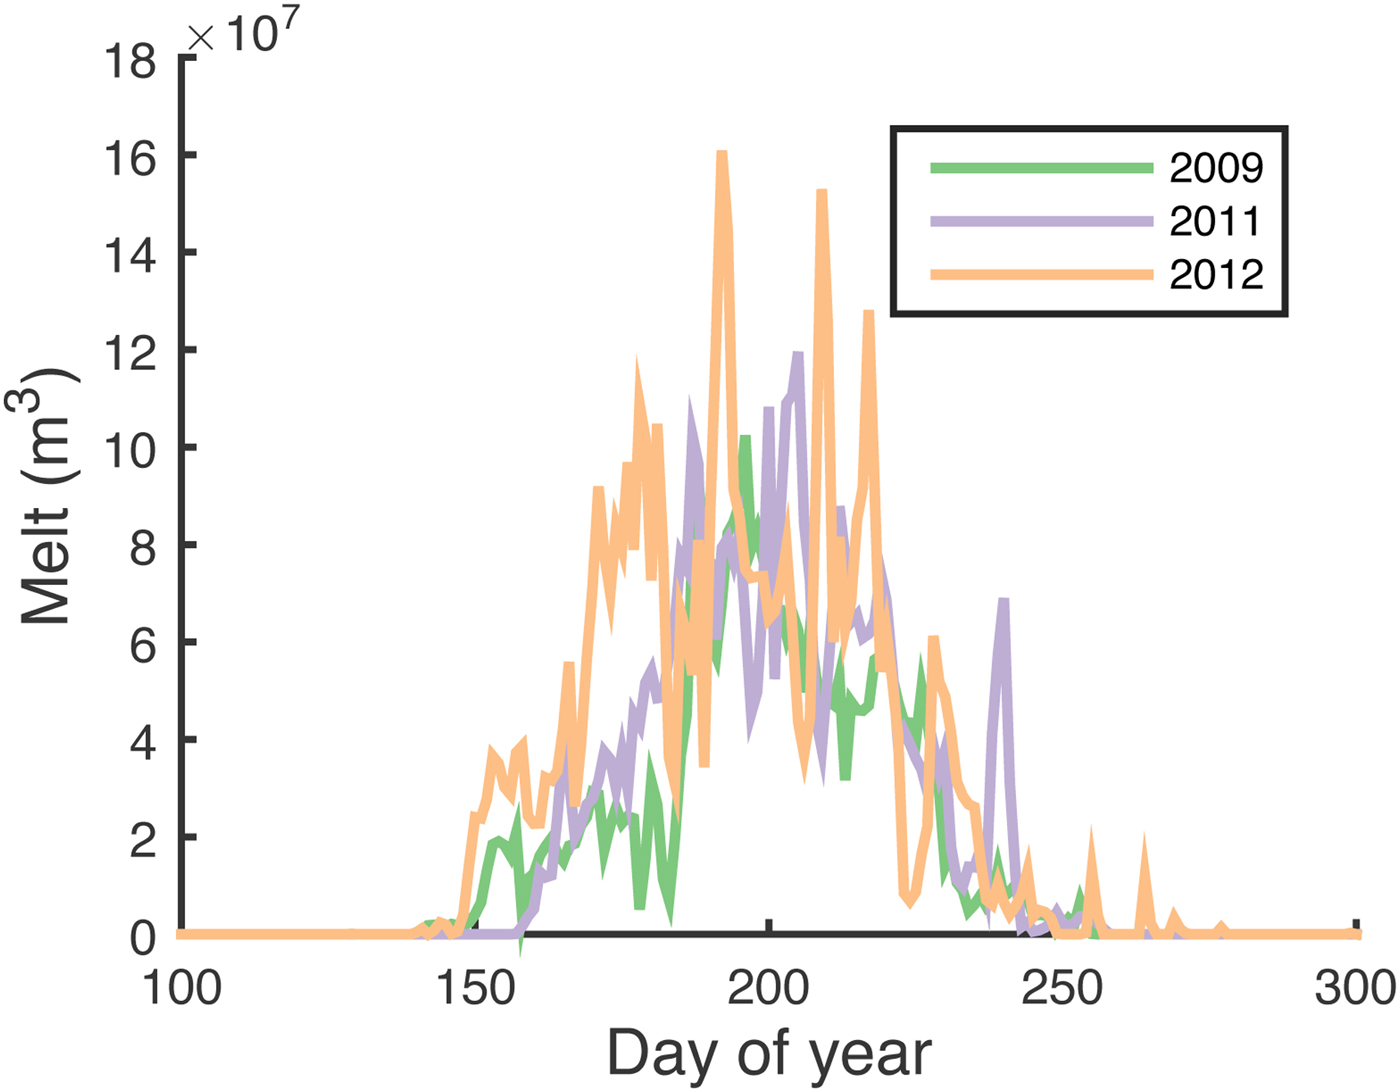
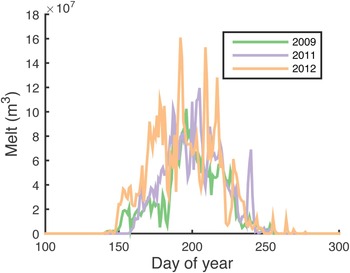
Daily melt runoff and snow depth input data for the SRLF model is provided by RACMO2.3 regional climate model simulations (Noël and others, Reference Noël2015). Melt runoff is defined as the total volume of melt in a cell minus the volume of melt which refreezes. The years 2009, 2011 and 2012 are selected on the basis of their contrasting melt intensities (Fig. 5). Study area wide melt volumes for the 3 years selected are 3.46 × 10⁹ m3, 4.24 × 10⁹ m3 and 5.39 × 10⁹ m3, respectively. These three melt years are used as analogues for average, elevated and extreme melt years. RACMO2.3 model output was provided on a daily temporal resolution, at 11 km spatial resolution. The data are bilinearily interpolated to 90 m resolution. Snow depth is updated daily in the SRLF model. To simulate an idealized diurnal melt cycle, melt runoff is interpolated to hourly time steps using a normal distribution with peak melt between 14:00 and 15:00 (in line with McGrath and others (Reference McGrath, Colgan, Steffen, Lauffenburger and Balog2011)), with a standard deviation of 2 h. Melt outside a 9 h window centred on peak melt is set to zero. The area within the 9 h window is normalized such that the total volume of daily melt is unaltered. We run the SRLF model for the summer melt season, which we define as day 135 of the year (15 May) to day 274 of the year (1 October), based on daily melt volume (Fig. 5).
Time series of daily melt in the study area for the 2009, 2011 and 2012 melt seasons modelled by RACMO2.3 (Noël and others, Reference Noël2015). We use these 3 years as analogues for average, elevated and extreme melt years, respectively.
2.5. Simulation design
We calibrate the SRLF model using lake drainage statistics for southwest Greenland during the 2009 melt season (Table 2) and perform 11 model simulations (Table 3). Lake drainage statistics were provided by Nick Selmes (personal communication, 31 October 2014), derived from data presented in Selmes and others (Reference Selmes, Murray and James2013). R1 is the standard calibrated model run for 2009, and gives the best match to lake drainage statistics. We perform sensitivity analyses on channelization parameters (runs R2–R5), the fracture area parameter (runs R6–R7) and crevasse extent (runs R8–R9) to understand the impact of the updated model components. The standard model is then run with different climate input (runs R10–R11) to investigate the impact of contrasting melt season intensity on supraglacial drainage. Parameter values for runs R1–R11 are shown in Table 3. There is the potential for 225 lakes with an area greater than the minimum MODIS pixel size (0.0625 km2) to form within the study area. In model run R1, all of these lakes are filled sufficiently to cover one MODIS pixel. Our analysis focuses on these lakes, as the lake statistics we employ to calibrate our model result from an analysis of MODIS imagery (Selmes and others, Reference Selmes, Murray and James2013). This is in line with the results of Yang and others (Reference Yang, Smith, Chu, Gleason and Li2015), who report that errors in DEM lead to an overprediction of small lakes when compared with satellite imagery. The area threshold 0.0625 km2 we employ, however, is smaller than the range of values 0.1–0.2 km2 suggested from their preliminary analysis.
Remotely sensed and modelled lake drainage statistics for 2009
Remote sensing statistics are for the whole of southwest Greenland, while model output is limited to the study site (Selmes and others, Reference Selmes, Murray and James2013).
Values of parameters that are varied between each of the model runs. Bold text highlights values that change between rows
Model run R1 is the calibrated model run, R2–R5 are sensitivity tests to channelized drainage parameters, R6–R7 are sensitivity tests of hydrofracturing, R8–R9 are sensitivity tests to crevasse extent, and R10–R11 are sensitivity tests of melt season intensity.
3. RESULTS
3.1. Standard run
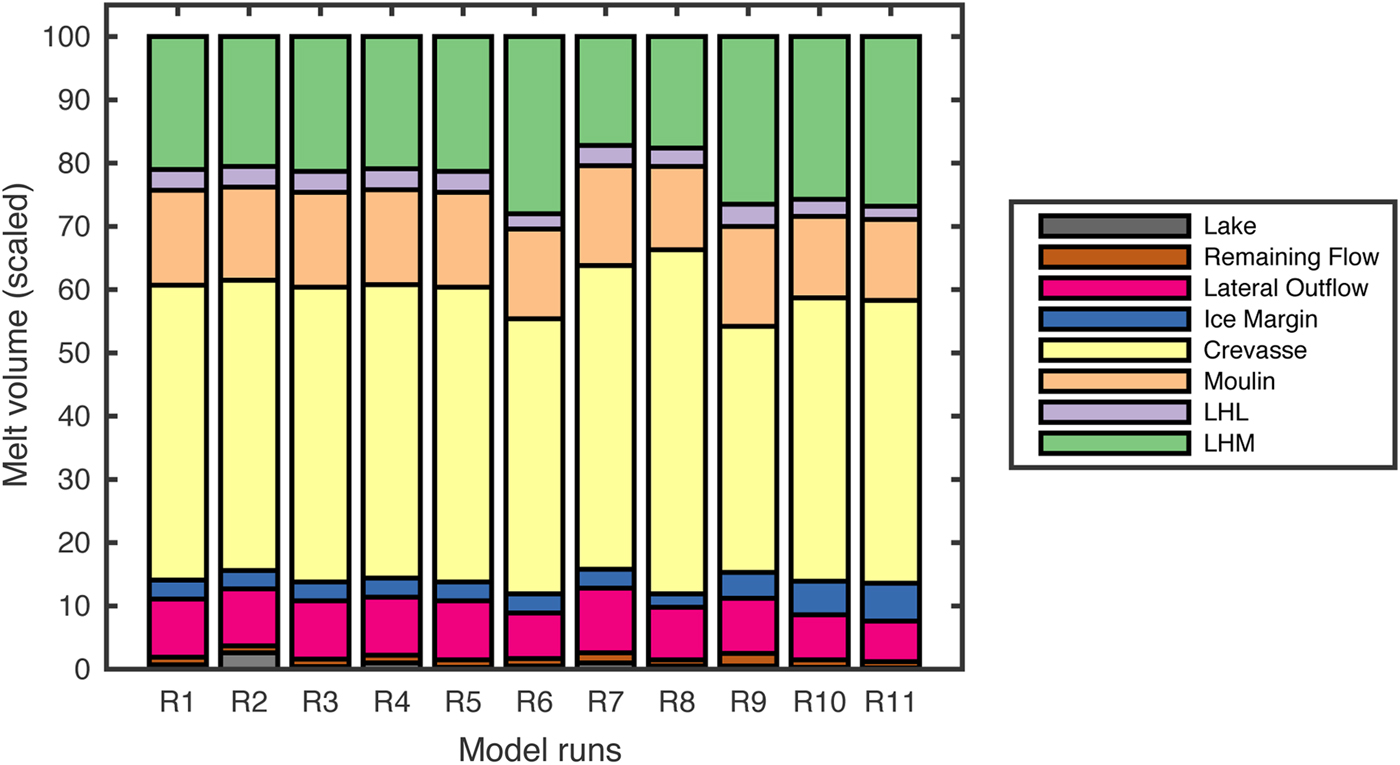
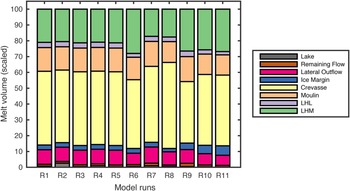
Simulation results show the majority of water in the study area drains into the englacial hydrological system (Fig. 6). Of the total surface melt, 15% drains into moulins outside of lake basins, while surface-to-bed connections from the 24 lakes which hydrofractured capture 24.3%. We divide the volume entering the englacial system through hydrofracturing into two components, the water that is in a lake when hydrofracture occurs, and subsequent drainage into the moulin that results from hydrofracture. We refer to the former as ‘Lake Hydrofracture Lake’ (‘LHL’), and the latter as ‘Lake Hydrofracture Moulin’ (‘LHM’). Only 3.3% of total surface melt drains via LHL, while 21% of total surface melt drains via LHM. Crevasses in run R1 drain 46.6% of surface melt. Only a small proportion of water drains over the ice edge or remains on the surface of the ice sheet, with 3% flowing over the ice margin and 0.6% remaining in lakes at the end of the model run. 9.2% of surface melt leaves the model domain across the northern and southern edges.
Partitioning of surface melt for the standard run (R1), model sensitivity analysis (R2–R9), and for different melt season intensities (R10–R11). Water stored in category ‘Lake’ is defined as the volume that remains in lakes at the end of the melt season. ‘Remaining Flow’ is the amount of water that is still in transit at the end of the simulation. ‘Lateral Outflow’ is defined as the volume of water that exits our model through the northern and southern boundaries. Water flow on the ice-sheet edge is partitioned into the ‘Ice Margin’ category. The volumes of water captured in crevasses and moulins are partitioned into ‘Crevasse’ and ‘Moulin’, respectively. We divide the volume of water drained by surface-to-bed connections resulting from lake hydrofracture into two categories: ‘lake hydrofracture lake’ (LHL) and ‘lake hydrofracture moulin’ (LHM). The initial volume of water in a lake when hydrofracture occurs is partitioned into ‘LHL’, while subsequent drainage into the surface-to-bed connection is partitioned into ’LHM’.
The volume of surface drainage decreases away from the ice-sheet margin, with the exception of the 0–8.4 km band (Fig. 7). Surface drainage is greatest in the 8.4–16.8 km band, where 20.25% of the total surface runoff generated in our study area drains. Crevasses drain water throughout the study area. Within 42 km of the ice-sheet margin, crevasses are responsible for over 54% of the surface drainage in each distance band. Water drained by moulins is concentrated between 8.4 and 25.2 km from the study site margin. Approximately 83% of the water entering into moulins does so within this area. Lake hydrofracture and subsequent surface-to-bed connections drain water upstream of 16.8 km. Except for the interval between 33.6 and 42 km, lake hydrofracture captures over 34% of meltwater in each distance band above 25.2 km.
Bar chart showing partitioning of water into different pathways at different distance bands from the study site margin. The three charts correspond to each of the melt season intensities tested: (a) average melt year (2011), (b) elevated melt year (2011), (c) extreme melt year (2012). Black line in middle plot shows width-averaged elevation profile of the study area.
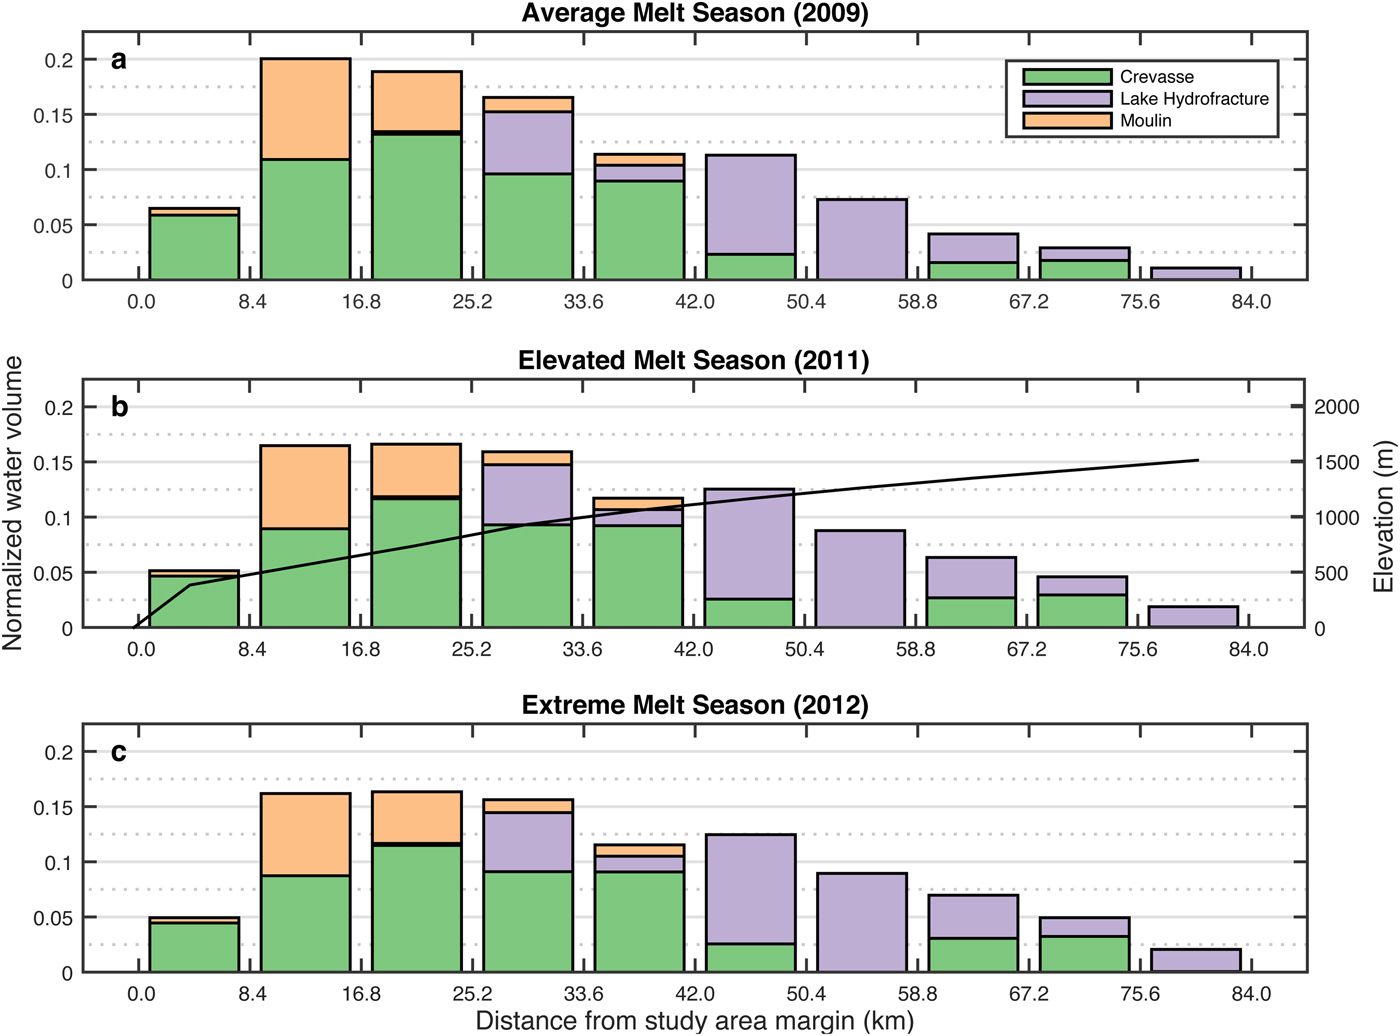
Figure 8 shows the location and extent of lake basins within the study area, and whether the lakes which formed within them drained via channelized drainage, hydrofracture, or remained at the end of the melt season. We assume any lakes remaining at the end of the melt season freeze. The majority of lake hydrofracture events occurred inland of 25 km from the ice margin, with only one out of 24 hydrofracture events occurring closer to the ice-sheet margin. The low surface drainage via lake hydrofracture between 33.6 and 42 km corresponds to an area where only two hydrofracture events occur. The model predicts that channelized drainage and lake freezing can occur throughout the study site.
Lake depressions with areas >0.0625 km2. The colour of the lake depression corresponds to the fate of the lake that formed in the depression during model simulation R1. Lake hydrofracture and channelized drainage processes are modelled, while lakes which remain at the end of the melt season are assumed to freeze. Blue highlight shows the model study area, with distance bands overlain.

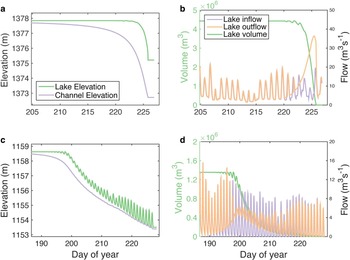
Model calibration results in 85 out of 225 lakes draining over the ice sheet through a channel at their edge. Two representative hydrographs of lakes that completely drained over the ice sheet via channelization are shown in Figure 9. In the early stages of channelized drainage, channel depth increases while lake elevation and volume remain close to, or at, the level of maximum lake capacity. Because the lake is at capacity, any water input must be balanced by the equivalent outflow.
Plots detailing channelized drainage of two different lakes which are representative of lakes which drain unstably (a/b), and of lakes which have initially unstable drainage but which do not continue draining unstably (c/d). Plots a and c show the lake and channel elevations, while plots b and d show the lake volume, lake input and lake output.
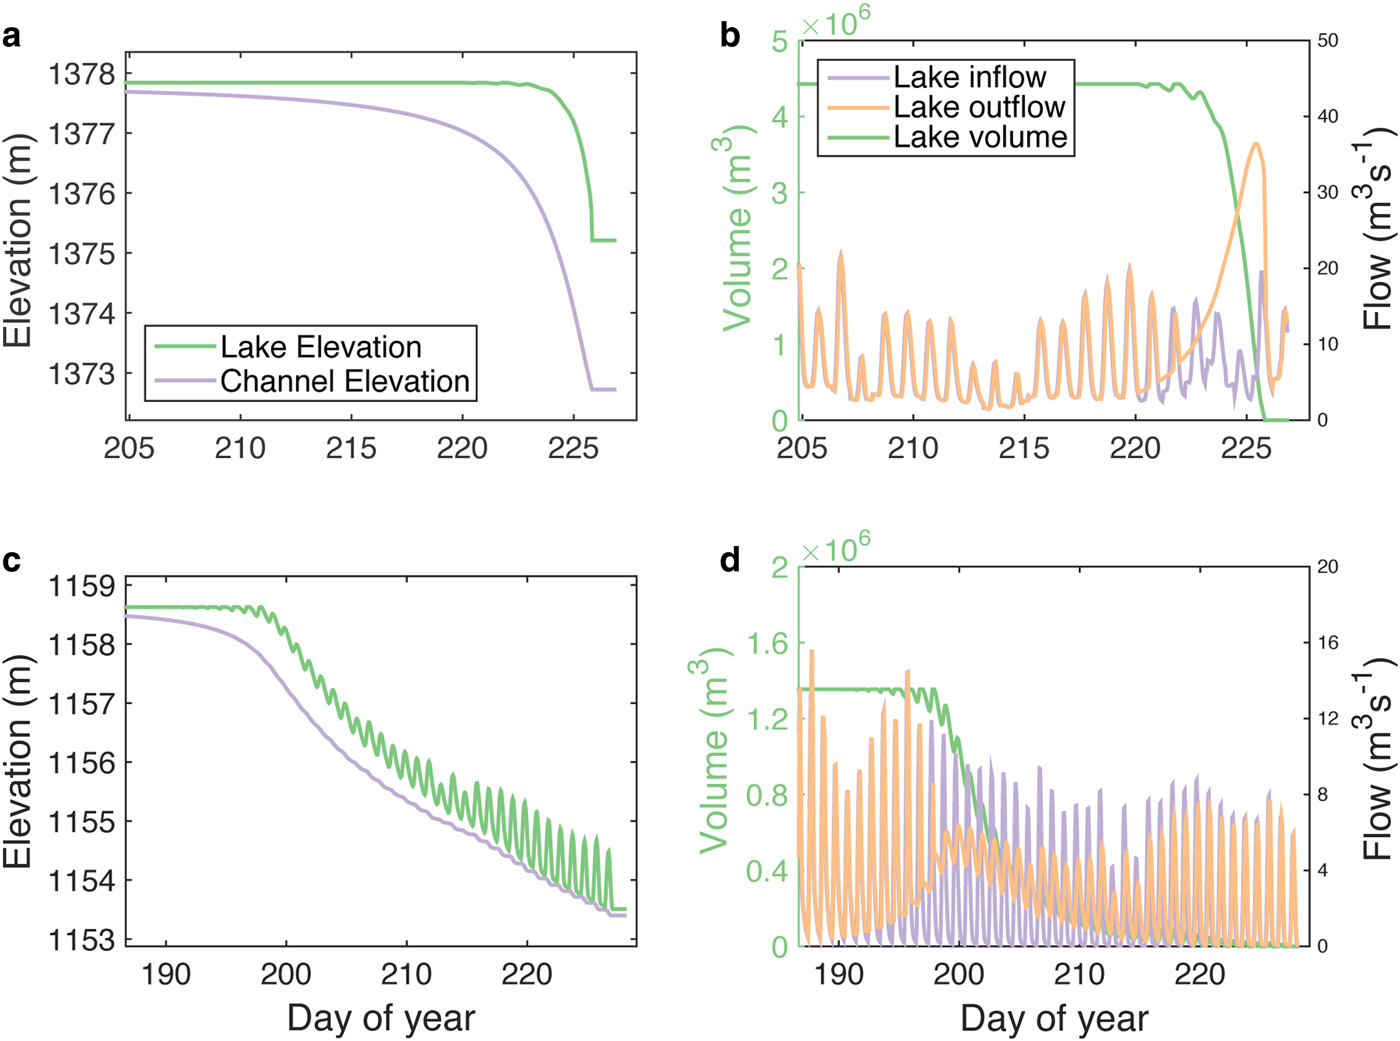
Figure 9a/b shows an unstable channelized lake drainage where the rate of channel incision accelerates throughout the lake drainage. Channel incision continues when the channel elevation drops below the bottom of the lake, and the final channel elevation can be metres below the lake bottom elevation. The observable lake drainage event, from the time the lake is last full to complete drainage, occurs on the timescale of days. During this period, the output hydrograph shows a rapid increase in lake output to a sharp peak, followed by a steep decline. Peak lake discharge is 36.4 m3 s–1. Diurnal variations in water output are masked during the observable lake drainage event.
Figure 9c/d shows a representative lake drainage event where the rate of channel incision decelerates during the observable lake drainage event, increasing the period over which the lake drains. Although the observable lake drainage event takes place over many weeks, the bulk of the lake drains over a period of 1–2 weeks. The output hydrograph is broader than in the unstable lake drainage, and the lake output flux does not exceed the maximum diurnal input flux. Diurnal cycles in lake output are dampened but remain visible. As the lake approaches being completely drained, lake output progressively mirrors water input.
3.2. Sensitivity analysis
3.2.1. Channelization parameters (R2–R5)
We test the sensitivity of our model to two channel drainage parameters, the initial depth of the channel that forms (C i), and the heat transfer parameter (γ). The influence of these parameters on lake drainage is shown in Table 4. The number of lakes with channelized drainage was not sensitive to these parameters; however, the number of lakes which completely drain varies considerably with the channel drainage parameters. Although changes to the lake drainage parameters have a large proportional impact on the storage capacity of the system, the absolute change in the partitioning of surface melt is relatively small (Fig. 6). At the end of run R1 0.6% of the total surface melt is stored in lakes. In our sensitivity analysis of lake drainage parameters, the percentage of surface melt stored in lakes at the end of simulations increases to a maximum of 2.5% in run R2, and decreases to a minimum of 0.3% in R4.
Statistics of lake hydrofracture and lake drainage via channelization for each of the modelled runs
3.2.2. Fracture area (R6–R7)
The fracture area parameter (F a) determines the volume at which a lake hydrofractures. Simulation R1 is run with a parameter value of 4000 m2 (within the range of best fit of Arnold and others (Reference Arnold, Banwell and Willis2014)), and predicts 24 lakes hydrofracturing. The number of lakes which hydrofacture is sensitive to F a, increasing to 35 in R6 and decreasing to 16 in R7. This has a negligible impact on surface storage in lakes (⩽0.4% of total surface runoff), but changes the total proportion of surface melt drained by lake hydrofracture and the subsequent surface-to-bed connection from 24.3% in R1, to 30.4% in R6 and 20.4% in R7.
3.2.3. Crevasse extent (R8–R9)
To quantify the uncertainty associated with the extent of crevassed areas, we perform two model simulations (R8–R9) with crevasse extent determined by different ice yield strengths. Simulation R1 is run with a yield stress of 132.5 kPa, which we perturb by ±7.5 kPa in simulations R8 and R9. A yield strength of 125 kPa (R8) increases the crevassed area extent by 32%, and the proportion of water entering crevasses from 46.6 to 54.4%. Similarly, increasing the yield strength to 140 kPa (R9) decreased the crevasse extent by 25%, and decreases proportion of water entering crevassed areas to 38.9% of total surface runoff.
3.3. Interannual comparison (R10–R11)
Model simulations R10 and R11 correspond to the 2011 (elevated) and 2012 (extreme) melt seasons. In both simulations, the number of lakes which hydrofractured was the same as in simulation R1. However, the proportion and volume of water drained by lake hydrofracture and the subsequent surface-to-bed connection increases from 24.3% (0.84 km3) in R1 to 28.4% (1.20 km3) in R10 and 28.9% (1.55 km3) in R11. Because lake drainages are triggered by a volumetric threshold, the volume of water draining via LHL remained constant at 0.11 km3 in all the three melt seasons. This results in the proportion of total melt draining via LHL decreasing from 3.3% in R1 to 2.7% in R10, and 2.1% in R11. Increases in the proportion of water drained by lake hydrofracture therefore come from increased drainage in LHM. Between R1 and R10, drainage via LHM increased from 21% (0.73 km3) to 25.7% (1.09 km3). Between R10 and R11 there is a smaller increase of 1.1%, from 25.7 to 26.8% (1.44 km3) in drainage via LHM. While the proportion of water drained by lake hydrofracture increases, the proportion drained by crevasses and moulins outside of lake basins decreases. In R1, moulins capture 15% of melt, while in R10 and R11, moulins capture 12.9 and 12.8% of surface runoff, respectively.
Although the proportion of total surface meltwater draining via moulins decreases, the volume of surface melt draining via moulins increases from 0.52 km3 in R1, to 0.55 km3 and 0.69 km3 in R10 and R11. Similarly, crevasses capture 46.6% of surface runoff in R1, but only 44.8% of surface runoff in R10. In R11, this proportion remains approximately the same at 44.7%. However, the volume of surface melt draining via crevasses increases from 1.61 to 1.90 km3 and 2.41 km3 as melt intensity increases.
As melt intensity increases from average to elevated, a higher proportion of meltwater is predicted to drain further from the ice margin (Fig. 7). Compared with simulation R1, each distance band up to 33.6 km from the study margin in simulation R10 drains a smaller proportion of water, while each distance band above 33.6 km drains an increased proportion of water. Changes in each distance band are limited to a few percent of total surface runoff. The maximum decrease was in distance band 8.4–16.8 km, which drained 3.5% less of total surface runoff, while the maximum increase was in distance band 58.8–67.2 km, which drained 2.3% more total surface runoff.
Although the proportion of total melt runoff drained by the distance band 8.4–16.8 km decreased, the volume of water drained in this band remained approximately the same at 0.60 km3. In the distance band 58.8–67.2 km, the volume of water drained increased from 0.12 to 0.23 km3. While there is a marked upslope shift in surface drainage between R1 and R10, between R10 and R11 there is only a small change in the spatial distribution of water drainage.
The cumulative proportion of surface runoff drained above 58.8 km (~1300 m) in our study area is 7.16% in R1, 11.18% in R10 and 12.21% in R11.
Although the number of lakes with channelized drainage does not increase in simulations R10 and R11, the number of lakes which completely drain over the ice sheet through channelization increases from 85 to 98 in R10, and up to 124 in R11 (Table 4).
4. DISCUSSION
A key overall prediction from our modelling results is that only 3–6% of surface melt flows off the edge of the ice sheet, and under 1% remains in storage in lakes on the surface of the ice sheet. Over ~85% percent of water is modelled to drain into the ice sheet, with ~9% percent leaving through the lateral study area margins. Assuming the water leaving through the lateral margins remains in lakes and drains off the ice margin in a similar proportion, then over 95% of water drains into the englacial system.
This is in clear agreement with the results of Smith and others (Reference Smith2015), who report that surface storage during 2012 in their study area was limited compared with the amount of melt generated, and that all observed surface rivers drained into the ice sheet. This is also consistent with other studies of the Paakitsoq region, which suggest that water draining into deep crevasses contributes to cryohydrological warming of the ice sheet (Phillips and others, Reference Phillips, Rajaram, Colgan, Steffen and Abdalati2013; Lüthi and others, Reference Lüthi2015). Of the different meltwater pathways, drainage into crevassed areas is the most significant route for water to enter the ice sheet (47% of overall melt). Drainage via the moulins established by lake hydrofracture accounts for ~24% (but the hydrofracture events themselves only account for ~3%), and other moulins account for ~15%.
Similarly to Yang and others (Reference Yang, Smith, Chu, Gleason and Li2015) we find agreement between observed moulins and predicted supraglacial stream locations. We also similarly find broad scale agreement between calculated stream networks and those observed in recent WorldView imagery. A comparison of stream networks observed in 1985 and 2009 reveals similar network structure, suggesting that the broad-scale pattern of stream networks remains similar over decadal timescales. Previous work (Arnold and others, Reference Arnold, Banwell and Willis2014) has found good agreement between lakes predicted from the GIMP DEM and observed locations/depths. Since surface storage on the ice-sheet surface is low, false positive filling of lakes should have a negligible impact. This suggests that current high resolution DEMs, in conjunction with moulins and crevasse locations derived from remote sensing, provide a suitable dataset for surface hydrology models.
The partitioning of drainage is spatially variable over the study area. Similarly to Clason and others (Reference Clason2015), and consistent with Joughin and others (Reference Joughin2013), we find that drainage via lake hydrofracture is a significant drainage pathway at higher elevations (above ~850 m). Moulins are shown to primarily drain water near the ice-sheet margin. Crevasses drain water throughout the study area, although drainage into crevasses is concentrated at lower elevations where their extent is greatest. The spatial distribution of different meltwater pathways may have an important role in modulating the variability of surface runoff to the bed, as crevasses are predicted to dampen diurnal meltwater fluctuations reaching the ice/bed interface relative to moulins (McGrath and others, Reference McGrath, Colgan, Steffen, Lauffenburger and Balog2011). Thus, within the Paakitsoq region, we would expect changes in runoff variability to be more effectively transmitted to the ice/bed interface at higher elevations, where crevasses drain a smaller proportion of surface runoff. Given that subglacial hydrological models suggest that it is the variability of water inputs, rather than the total amount of input that is the key control on basal drag (Schoof, Reference Schoof2010; Hewitt, Reference Hewitt2013) this could imply that the seasonal variability of ice-sheet velocity could be larger at higher elevations on the ice sheet.
While channelized lake drainage has minimal impact on meltwater partitioning in our model due to the limited capacity of lakes relative to total surface runoff, channelized lake drainage changes the timing and characteristics of water flow downstream of lakes. As observed by Tedesco and others (Reference Tedesco2013), channelized drainage events which flow into a downstream moulin can temporarily increase ice velocities. Our study reproduces the observed timescale of days to several weeks for lakes draining over the ice sheet via channelization (Selmes and others, Reference Selmes, Murray and James2013; Tedesco and others, Reference Tedesco2013). In our model, rapid drainage of lakes on the timescale of days occurs if channel incision is unstable such that the decrease in the elevation of the bed of the channel is faster than the lowering of the lake surface. Our model also shows a different mode of channelized drainage, on the timescale of weeks, in which drainage switches from unstable to stable drainage in which the rate of channel incision matches the lowering of the lake surface. The diversity of behaviour agrees with Kingslake and others (Reference Kingslake, Ng and Sole2015), who find that the stability of channelized drainage is controlled by lake geometry, channel slope and melt input.
The sensitivity analysis can be divided into simulations testing model parameters (R2–R7) and simulations testing model inputs (R8–R11). We find that while the number of lakes which undergo channelized drainage is insensitive to channelization parameter values, the number of lakes which drain completely is strongly controlled by the initial depth of the channel that forms (R2–R3) and the heat transfer parameter (R4–R5). The sensitivity to the initial depth parameter suggests that features below our DEM resolution, particularly relic channelization from previous years and small scale topography around the rim of the lake (which we do not directly allow for, but which the initial channel depth simulates to some degree) could have a significant role in determining whether channelized drainage occurs, and the timescale over which lakes drain. Because of the sensitivity to the heat transfer parameter, possible spatial and temporal variation in lake temperature (due to different meteorological conditions) could also impact the pattern and timing of lake drainages.
Our results (R8–R9) show that while varying yield strength can make a large difference in the overall area predicted to be crevassed (~30%), the impact on the overall partitioning of meltwater is more muted (~8% of total surface runoff). While Colgan and others (Reference Colgan2011) show an increase in the crevassed area of 13% between 1985 and 2009 (using satellite imagery), our results suggest that such a change would have a relatively minor impact on melt partitioning. However, if this rate of expansion continues, long term changes in crevasse distribution may become important for melt partitioning.
Melt availability (R10–R11) affects two aspects of model behaviour. Higher meltwater production causes hydrofracture events to occur earlier in the melt season (as lakes will reach the critical volume for fracture more quickly). This has no impact on the volume of water drained during the event itself, but could lead to an earlier development of an efficient subglacial drainage system, resulting in an earlier summer slowdown (Bartholomew and others, Reference Bartholomew2010; Schoof, Reference Schoof2010; Sundal and others, Reference Sundal2011; Cowton and others, Reference Cowton2013). Higher melt availability also increases the number of modelled lakes that drain completely by channelized drainage. This reduces the total amount of water stored on the ice sheet at the end of the summer (though as stated, this is a very small proportion of the overall melt). Warmer melt seasons may also increase the temperature of water in lakes, increasing the amount of energy available for channels to incise into the ice-sheet surface (simulated at present using the heat transfer parameter, γ).
The spatial distribution of surface drainage shows some sensitivity to melt availability. As melt season intensity rises from average to elevated, the proportion of water drained beyond 58.8 km (~1300 m) from the ice-sheet margin increases by ~5% of total surface runoff. Drainage via surface-to-bed connections created by lake hydrofracture forms an increased proportion of meltwater, while crevasses and moulins outside of lake basins drain a decreased proportion of meltwater. However, the partitioning of water between elevated and extreme melt seasons remains similar, with only a small increase (~1% of total surface runoff) in the proportion of water drained at higher elevations. This shows melt partitioning does not consistently vary interannually, nor linearly with melt season intensity.
There are some aspects of the observed behaviour of the supraglacial drainage system which our model cannot capture. The observed interannual variability of the behaviour of lakes suggests that a subset of the lake population is capable of both hydrofracture and channelized drainage (Selmes and others, Reference Selmes, Murray and James2013), with the mechanism of drainage determined by an unknown preconditioning. This competition is not directly captured in our model largely due to the limitations of the fracture area criterion, which effectively pre-determines lakes that can drain via hydrofracture; such lakes can never incise a channel at their lip, as hydrofracture will prevent them filling to the maximum volume determined by the ice-sheet topography, a pre-condition in our model for channelized drainage. Lakes for which the topographically controlled maximum volume is smaller than the threshold volume for hydrofracture can never exhibit hydrofracture, but can only overflow. However, here the model does allow for some year-on-year variability, as the channelization mechanism does depend on the rate of incision of the channel versus the rate at which the lake surface elevation changes. Thus, in any given year, a lake could show simple overflow drainage, or stable or unstable channelized drainage, depending on the rate of water inputs to the lake versus water outflow. We cannot however simulate the possible existence of a deeply incised channel from a previous year, which could prevent a lake from forming at all in extreme cases, as has effectively been inferred by Smith and others (Reference Smith2015), who observed that in certain cases, streams on the ice sheet had effectively cut through local topographic divides.
Ultimately, it seems very unlikely that a model could ever predict the possible behaviour over several years of any individual lake. At a catchment or regional scale, however, it may be that some form of stochastic variations in the fracture area threshold (potentially linked to a local strain threshold) could allow the statistical properties of a set of lakes to be simulated more effectively than in a deterministic model. Such a model, applied in a form of Monte-Carlo analysis, might allow the range of possible water inputs to a subglacial hydrological model to be simulated more effectively for a range of melt scenarios, in turn allowing more effective simulation of the possible impact of climate change on ice dynamics.
5. CONCLUSIONS
In this paper we have applied a model of supraglacial hydrology to the Paakitsoq region of western Greenland for 3 years: 2009, 2011 and 2012. The model is forced using melt rates and snow depths from a regional climate model (Noël and others, Reference Noël2015), simulates water flow over a DEM of the surface of the ice sheet (Howat and others, Reference Howat, Negrete and Smith2015), and allows surface water to accumulate as lakes in topographically controlled basins. Water can enter the englacial hydrological system via water-volume-driven lake hydrofracture events, through observed moulins, and via crevassed areas, determined from surface stresses derived from mean winter velocities. Lakes can also drain supraglacially via simple topographic overflow, and via the incision of supraglacial streams into the lips damming lakes.
The model has been used to better understand the partitioning of water routes into the en- (and potentially, therefore, the sub-) glacial drainage system. Previous modelling studies have typically focused on hydrofracture beneath supraglacial lakes (Banwell and others, Reference Banwell, Arnold, Willis, Tedesco and Ahlstrøm2012a; Arnold and others, Reference Arnold, Banwell and Willis2014; Clason and others, Reference Clason2015), although Clason and others (Reference Clason2015) also allow for hydrofracture to occur outside lake basins. Observational studies have shown that drainage outside of lake basins can deliver significant volumes of water to the englacial system (Smith and others, Reference Smith2015; Yang and others, Reference Yang, Smith, Chu, Gleason and Li2015), so the incorporation of drainage into crevasses or moulins at locations derived from remote sensing data (rather than solely at locations depending on hydrofracture) allows our model to more realistically reflect these observations.
Our results produce a suite of behaviours that agree well with observations of lake behaviour. Modelled lakes can drain via hydrofracture, they can drain slowly (over days to weeks) via the incision of supraglacial channels, and some lakes simply remain full at the end of the melt season, and are assumed to freeze over winter. Overall, over 95% of available melt in the model likely enters the englacial drainage system. In our standard run (with parameter values chosen to match observed frequencies of lake behaviour), crevassed areas drain 47% of the available melt, 24% drains through the surface-to-bed connections established by lake hydrofracture events and 15% via moulins located outside of lake basins. In the case of hydrofracture events, the bulk of this water actually enters the glacier after the fracture event itself, via streams flowing into the fracture established during the event; a very small proportion (3%) is drained during the events themselves. This reflects the small overall volume of supraglacial lakes compared with the total volume of melt produced in a typical melt season. These proportions are affected to some extent by the parameter values chosen, but the overall balance of partitioning of melt is robust, as is the finding that almost all water enters the ice sheet. Channelized surface drainage of lakes does not alter the overall partitioning of meltwater routing into the ice sheet, but has been observed to impact the timing of lake hydrofracture downstream (Banwell and others, Reference Banwell, Arnold, Willis, Tedesco and Ahlstrøm2012a; Tedesco and others, Reference Tedesco2013).
The model results show limited sensitivity to melt intensity; in the warmer years (2011 and 2012) the proportion of water which drains via hydrofracture increases at the expense of the other two routes, driven largely by the earlier occurrence of hydrofracture events as lakes reach the critical volume for hydrofracture earlier in the melt season.
The partitioning of melt drainage varies spatially over the ice sheet, with moulin drainage more common at lower elevations and hydrofracture more important at higher elevations. Drainage via crevasses occurs at all elevations, but is concentrated at lower elevations where they are more common. Higher melt intensity leads to a change in this spatial partitioning, with an increase in hydrofracture events at higher elevations at the expense of the other two routes.
Our results have important implications in terms of the potential impact of supraglacially-derived water on ice-sheet dynamics. In terms of the overall partitioning of meltwater, we find that crevasses capture a significant proportion of supraglacial meltwater. This implies that the possible mechanisms which could link water in surface crevasses to the subglacial drainage system are important to understand. We also find that the total volume of water transported to the bed via lake hydrofracture events in themselves is small in comparison with the total amount of water entering the system subsequently via the newly created moulins. While lake drainage events, and the very high discharges associated with them, seem likely to remain a key control on the development of subglacial drainage networks (e.g. Das and others, Reference Das2008; Doyle and others, Reference Doyle2014), as melt increases, and lake drainage events potentially occur earlier in the melt season, the subsequent drainage (and the characteristics of such flow) could become increasingly significant in terms of ice-sheet dynamics and potential summer velocity change. This also relates to our finding that the partitioning of meltwater can change with melt season intensity, but does not do so in a straightforward or linear manner. While interannual variations in melt intensity could affect ice dynamics, this would depend on the nature of the supraglacial drainage system and its sensitivity to melt availability, and also on the sensitivity of the subglacial system itself to changes in the partitioning of water inputs.
The model developments we have implemented here allow a more diverse and realistic set of behaviours for supraglacial water than has been possible in previous studies. They have allowed us to estimate the proportions of water entering the ice sheet via different drainage paths, and how this balance varies spatially. This study has also allowed us to begin to estimate how changes in melt intensity could affect the balance in the routes by which meltwater enters the ice sheet, which could have implications for how the dynamics of the ice sheet may change in response to ongoing climatic changes. In future developments, we are working to link the model described here to a coupled subglacial hydrology/ice dynamics model in order to begin to quantify these changes.
ACKNOWLEDGMENTS
We acknowledge M.R. van den Broeke and B. Noël for providing RACMO2.3 data. We thank Nick Selmes for providing data pertaining to lake drainage statistics. C.P. Koziol acknowledges the support of St. John's College (Cambridge). A. Pope was supported by NSF award GEO-1331100 and W. Colgan was supported by NASA award NNX13AP73G. WorldView imagery was provided by the Polar Geospatial Center at the University of Minnesota, which is supported by grant ANT-1043681 from the US National Science Foundation. We also thank Neil Glasser and two anonymous reviewers whose comments greatly improved this paper.


 Open access