





Introduction
Despite biomedical advances, the U.S. continues to experience persistent and highly unequal rates of human immunodeficiency virus (HIV) transmission. In 2022, Black populations accounted for 38 per cent of new HIV diagnoses, while Hispanic/Latino populations comprised 32 per cent of new diagnoses, with new diagnoses concentrated in the southern U.S. (HIV.gov, 2025a). Although HIV prevention is supported through federal initiatives, the U.S. response has historically relied on decentralised policy in which state and local jurisdictions play a strong role in shaping the availability and delivery of HIV-related care. As a result, geographic variation in policy, healthcare infrastructure, and provider availability has contributed to uneven access to effective prevention tools, raising important questions about whether recent efforts have meaningfully reduced disparities in access to HIV prevention across U.S. states.
In response to persistent geographic and racial disparities in HIV transmission, the U.S. federal government launched the Ending the HIV Epidemic (EHE) initiative in 2019, with the stated goal of reducing new HIV infections by 75 per cent in 2025 and by 90 per cent by 2030 (HIV.gov, 2025b). While EHE focuses on nationwide efforts, the initiative also identifies 57 target geographic areas, a combination of counties and states disproportionately in the southeastern U.S., that accounted for more than 50 per cent of new HIV diagnoses prior to the programme’s launch, that receive an infusion of federal resources (HIV.gov, 2025c). Although EHE is federally coordinated and funded, the implementation of HIV prevention strategies continues to depend heavily on state and local actors, including decisions about provider participation, clinical infrastructure, and the broader policy environment in which prevention services operate. In particular, states differ in Medicaid eligibility and reimbursement policies, public health funding priorities, and legal and regulatory frameworks affecting HIV and sexual health care, all of which may shape whether federal investments translate into expanded provider availability or improved geographic access to prevention services.
Pre-exposure prophylaxis (PrEP) is an intervention that is highly effective at decreasing the risk of HIV transmission and has become a central pillar of contemporary HIV prevention strategies in the U.S. PrEP is available in many forms, including long-acting injectable options administered by healthcare providers and daily oral medications, and individuals may cycle on and off PrEP depending on their life circumstances and perceived risk. Regardless of formulation, access to PrEP requires engagement with a prescribing provider, routine HIV testing, and periodic clinic follow-up, typically every two to three months for individuals maintaining an active prescription (CDC, 2025a). The clinic requirements underscore the importance of provider availability and geographic proximity, particularly for populations living in areas with limited healthcare infrastructure or high levels of socio-economic disadvantage.
Critically, marginalised racial and ethnic groups are prescribed PrEP at lower rates (Centers for Disease Control and Prevention et al., 2022). Previous scholarship has grappled with the factors inhibiting the uptake of PrEP, especially among marginalised racial and ethnic groups, citing the lack of awareness of services, stigma, and difficulties accessing PrEP services as critical barriers to accessing PrEP (Flash et al., Reference Flash, Stone, Mitty, Mimiaga, Hall, Krakower and Mayer2014; Guest et al., Reference Guest, Shattuck, Johnson, Akumatey, Clarke, Chen and MacQueen2010; Hubach et al., Reference Hubach, Currin, Sanders, Durham, Kavanaugh, Wheeler and Croff2017; Liu et al., Reference Liu, Cohen, Follansbee, Cohan, Weber, Sachdev and Buchbinder2014; Rice et al., Reference Rice, Stringer, Sohail, Crockett, Atkins and Kudroff2019; Wingood et al., Reference Wingood, Dunkle, Camp, Patel, Painter, Rubtsova and DiClemente2013). Spatial access to PrEP providers is correlated with willingness to seek PrEP (Ojikutu et al., Reference Ojikutu, Bogart, Mayer, Stopka, Sullivan and Ransome2019), underscoring the importance of the spatial distribution of PrEP providers in achieving HIV prevention goals. Examining changes in the geographic distribution of PrEP providers, therefore, offers an important lens through which to assess whether recent policy efforts have reduced structural barriers that may contribute to persistent inequities in prevention.
This paper examines the geographic access to PrEP providers across the United States and how that access has changed in recent years. Using data on PrEP provider locations, this paper assesses areas of constrained access to PrEP – referred to as PrEP deserts – in 2020 and 2023 across all 50 U.S. states. By comparing access across two time points, the results identify where access has expanded or contracted and which populations are disproportionately represented in PrEP deserts. Rather than evaluating individual behaviour or PrEP uptake, this analysis focuses on provider availability as a structural component of prevention infrastructure. Overall, the results show that while geographic access to PrEP providers expanded in many parts of the U.S. between 2020 and 2023, substantial PrEP deserts persist and are unevenly distributed across states and communities. Notably, changes in access do not occur uniformly, with some areas experiencing improvements while others lose access over time, highlighting the continued importance of geography in HIV prevention strategy.
Access to PrEP as preventative care
PrEP is an intervention used to decrease the likelihood of HIV infection. PrEP is intended to be taken by individuals without HIV to prevent transmission via sex or injection drug use. Individuals who have a sexual partner with HIV, engage in sexual intercourse without consistent use of a condom, or inject drugs with shared needles stand to benefit most from the preventative power of PrEP. The U.S. Food and Drug Administration (FDA) currently approves two oral medications for use as PrEP, Truvada and Descovy, one bimonthly injection administered by a healthcare provider, Apretude, and a newly-approved semiannual injection, Yeztugo (HIV.gov, 2026; National Institutes of Health, 2025). Both Truvada and Descovy require an individual to take a pill daily to maintain efficacy. When taken as prescribed, PrEP reduces the risk of getting HIV through sexual intercourse by about 99 per cent and from injection drug use by at least 74 per cent (National Institutes of Health, 2025). Because of its efficacy, PrEP has become a revolutionary preventative tool in the effort to end the HIV epidemic as a significant amount of research has been directed at HIV treatment. PrEP is now a primary vehicle for HIV prevention.
Not all physicians prescribe PrEP due to concerns about adherence, cost, and behavioural and health consequences (Mullins et al., Reference Mullins, Idoine, Zimet and Kahn2019; Pleuhs et al., Reference Pleuhs, Quinn, Walsh, Petroll and John2020). A lack of physician knowledge about PrEP and the stigma perpetuated by medical staff can inhibit access for many individuals (Pleuhs et al., Reference Pleuhs, Quinn, Walsh, Petroll and John2020). Prior to being prescribed PrEP, individuals must receive a negative HIV test, as PrEP is only intended for individuals currently not living with HIV (National Institutes of Health, 2025). Regardless of formulation, PrEP requires ongoing clinic engagement, including routine follow-up visits, health screenings, and HIV testing, with the CDC recommending quarterly follow-up visits (CDC, 2025a). Individuals may cycle on and off PrEP depending on their life circumstances and perceived risk, and restarting PrEP generally requires repeating the HIV screening process before a new prescription can be issued (National Institutes of Health, 2025). Individuals do not take PrEP just once in the event of possible HIV exposure as PrEP is intended to be a continuous, preventative regimen.
Beyond the individual-to-provider interactions, the social and political context surrounding HIV/AIDS care varies across states and may shape both the patient’s willingness to seek care and a provider’s willingness to offer prevention services. In 2025, 32 states possess laws criminalising HIV exposure (Movement Advancement Project, 2025). Some states have sentencing enhancements for individuals facing sex-related convictions, many of which also require sex-offender registration as part of the sentencing (Movement Advancement Project, 2025). An estimated 33 per cent of the LGBTQ + population in the United States lives in a state with an HIV criminalisation law (Movement Advancement Project, 2025). Although these policies lack empirical evidence for reducing HIV transmission and may undermine public health efforts (Lazzarini et al., Reference Lazzarini, Galletly, Mykhalovskiy, Harsono, O’Keefe, Singer and Levine2013), the policy landscape illustrates how legal and cultural environments may indirectly influence the availability and uptake of PrEP services.
All facets taken together, PrEP requires a patient to engage in conversations about sexual behaviour and sexuality with a healthcare provider, potentially opening themselves up to stigma and discrimination, while adhering to continued appointments for the duration the individual remains on PrEP. In recent years, programmes have sought to address barriers to PrEP access. Most insurance programmes and state Medicaid programs cover PrEP prescriptions. The Affordable Care Act (ACA) mandates that PrEP refills and associated screenings must be free under all insurance plans (Keith et al., Reference Keith2021)Footnote 1 . However, coverage for laboratory testing and sexually transmitted infection screenings remains inconsistent across plans. As a result, access to and continuity of PrEP care are shaped by both spatial and nonspatial factors, including provider availability, geographic proximity, and variation in state policy and healthcare infrastructure.
EHE’s strategies
To achieve the goal of ending the HIV epidemic by the year 2030, the EHE initiative outlines a coordinated federal strategy organised around four core pillars: diagnose, treat, prevent, and respond (HIV.gov, 2025b). First, given that 160,000 individuals in the United States are unaware they are living with HIV (HIV.gov, 2025a), EHE focuses on establishing collaborations between multiple government agencies to increase HIV testing capacity. Next, for those diagnosed with HIV, EHE works to treat people living with HIV rapidly and effectively to reach the level of viral suppression (HIV.gov, 2024). Third, the prevention prong of EHE centres on using interventions proven to mitigate the transmission of HIV (HIV.gov, 2024). The prevention strategy focuses on expanding access to PrEP and syringe services programmes. Finally, EHE’s response pillar focuses on identifying and rapidly responding to emerging HIV transmission clusters through enhanced surveillance and targeted public health interventions. This strategy emphasises real-time detection of outbreaks and coordinated responses across federal, state, and local agencies, rather than data collection alone (HIV.gov, 2024). Together, these pillars aim to reduce new HIV infections by expanding testing, improving treatment and viral suppression, scaling proven prevention strategies, and rapidly addressing emerging outbreaks.
Among the four pillars, the prevention component directly relates to access to PrEP, which EHE identifies as a central tool for reducing new HIV infections. Although EHE does not mandate provider participation or directly regulate where PrEP services are offered, its prevention-focused pillar may indirectly shape local prevention infrastructure by lowering barriers for clinics to offer PrEP or expand existing services in prioritised areas. As part of this pillar, EHE supports state and local communities to increase the availability of PrEP, develops and maintains clinic guidelines for prescribing PrEP, and maintains a publicly-facing PrEP locator tool for individuals to identify PrEP providers (CDC, 2025b). Additionally, EHE strives to increase the number of clinicians offering PrEP, provide funding to cover the costs of PrEP-related services, and develop and deliver education campaigns to increase PrEP awareness and combat the stigma surrounding its use and HIV (CDC, 2025b).
While EHE focuses on nationwide efforts, EHE additionally identifies 57 target geographic areas that receive an infusion of resources, expertise, and technology (HIV.gov, 2025c). These priority jurisdictions accounted for more than 50 per cent of new HIV diagnoses in the United States that occurred in 2016 and 2017 (HIV.gov, 2025c). While most priority jurisdictions are counties with high incidence rates of HIV, seven of the jurisdictions are states where 10 per cent or more of new diagnoses in 2016 and 2017 were in rural areas (HIV.gov, 2025c). Many of these areas are characterised by limited healthcare infrastructure and long distances to care, conditions that may constrain access to PrEP even in the presence of federal efforts to improve prevention efforts. Persistent regional concentration of HIV incidence, particularly in the South and parts of the West (HIV.gov, 2025a), underscores the relevance of examining whether prevention infrastructure, like access to PrEP providers, is distributed equitably across geographies.
Geographic variation in health infrastructure
There is a strong relationship between space and health. In fact, zip codes can reliably predict health outcomes, highlighting that life expectancy can vary drastically within a small radius due to the unequal distribution of structural disadvantage (Roeder et al., Reference Roeder2014). Rural communities and economically disadvantaged areas frequently face shortages of primary care providers, limited specialty services, and reduced public health capacity. Travel distances to clinics and hospitals are often greater in these regions, increasing the time and transportation costs associated with routine care. Research on the geography of health emphasises that the built environment is a major factor that may enhance or diminish one’s health in addition to individual-level factors (Diez Roux et al., Reference Diez Roux and Mair2010; Gordon et al., Reference Gordon, Purciel-Hill, Ghai, Kaufman, Graham and Van Wye2011; Kreitzer et al., Reference Kreitzer, Smith, Kane and Saunders2021; Roeder et al., Reference Roeder2014). Because PrEP requires engaging with a prescribing clinician and ongoing clinical monitoring, variation in healthcare infrastructure across states and communities may directly translate into differences in provider availability and access.
Importantly, the decentralised structure of the U.S. healthcare system suggests that access constraints will be unevenly distributed across states. There is wide geographic variation in healthcare provider density, public health infrastructure, and access to preventative services across rural and urban contexts (Douthit et al., Reference Douthit, Kiv, Dwolatzky and Biswas2015; Rosenblatt et al., Reference Rosenblatt, Andrilla, Curtin and Hart2006). States also differ in their capacity to deliver HIV-related services and in the distribution of clinicians trained or willing to prescribe PrEP (McGlynn et al., Reference McGlynn, Asch, Adams, Keesey, Hicks, DeCristofaro and Kerr2003; Siegler et al., Reference Siegler, Bratcher, Weiss, Mouhanna, Ahlschlager and Sullivan2018, Reference Siegler, Bratcher and Weiss2019). Because PrEP provisions depends on accessible clinicians, routine follow-up infrastructure, and administrative support, variation in healthcare capacity across states is likely to produce meaningful differences in geographic access to PrEP providers.
Measuring access to PrEP
Given the interplay between geography, access to healthcare, and health outcomes, it is important to consider the extent to which PrEP is made geographically accessible to populations. Accessibility is multidimensional, as barriers such as travel time, transportation, and cost play a role in shaping the ways in which an individual seeks out care (Flash et al., Reference Flash, Stone, Mitty, Mimiaga, Hall, Krakower and Mayer2014; Guest et al., Reference Guest, Shattuck, Johnson, Akumatey, Clarke, Chen and MacQueen2010; Liu et al., Reference Liu, Cohen, Follansbee, Cohan, Weber, Sachdev and Buchbinder2014; Wingood et al., Reference Wingood, Dunkle, Camp, Patel, Painter, Rubtsova and DiClemente2013). PrEP requires recurring clinic engagement, including routine follow-up visits and HIV screening, making spatial proximity to providers particularly salient for sustained access. Accordingly, this study focuses on potential geographic access to PrEP providers rather than realised uptake.
PrEP deserts are geographic areas without nearby PrEP providers (Siegler et al., Reference Siegler, Bratcher and Weiss2019). Defining deserts as census tracts with no PrEP provider within 30 or 60 minutes of travel, Siegler et al. (Reference Siegler, Bratcher and Weiss2019) estimate the number of men who have sex with men (MSM) living in PrEP deserts and document substantial geographic disparities, particularly in the South and rural communities. Related work similarly identifies uneven distribution of publicly listed PrEP providers across the U.S. (Siegler et al., Reference Siegler, Bratcher, Weiss, Mouhanna, Ahlschlager and Sullivan2018; Sullivan et al., Reference Sullivan and Siegler2018). While previous scholarship establishes the importance of spatial access, reliance on fixed drive-time thresholds may not fully capture variation in provider-to-population ratios or differential demand across communities.
To build on prior work relying on fixed drive-time thresholds, this study employs an Integrated Two-Step Floating Catchment Area (I2SFCA) approach. The I2SFCA method estimates spatial accessibility by calculating provider-to-population ratios within defined travel catchments and aggregating those ratios for each population location, producing a continuous measure of potential geographic access. This implementation of the I2SFCA incorporates three modifications relevant to measuring PrEP access. First, travel-time thresholds vary by urbanicity, allowing longer drive times in rural areas and shorter ones in urban areas to better reflect realistic travel behaviour. Second, the population denominator takes a broader population view rather than exclusively focusing on MSM, recognising that multiple populations face elevated HIV risk. Finally, the integrated framework incorporates a measure of socio-economic disadvantage into the accessibility calculation, capturing structural constraints that may affect potential access to care.
Data
Identifying PrEP providers
To identify the clinic locations providing PrEP services in all 50 states, this study uses geographic data from the CDC National Prevention Information Network’s (NPIN) PrEP Locator database. The PrEP Locator database is a publicly-facing widget meant to provide a centralised, searchable platform for individuals seeking out PrEP-related services. The PrEP Locator was conceptualised through a series of informant interviews with experts who developed PrEP or other HIV service directories (Siegler et al., Reference Siegler, Wirtz, Weber and Sullivan2017). Since launching in 2016, the PrEP Locator has been maintained and updated through various mechanisms: first, NPIN staff communicate annually with facilities listed in the database to ensure accurate and up-to-date information; providers also have the opportunity to opt-in initially to inclusion in the database, however, all opt-in entries still must undergo eligibility review by the NPIN staff (National Prevention Information Network, n.d.). Importantly, the PrEP Locator focuses on facilities with medical professionals willing to prescribe PrEP and does not maintain a database of the specific providers (or number of providers at healthcare locations) willing to prescribe PrEP (National Prevention Information Network, n.d.). Thus, each identified healthcare facility will carry the same overall ‘weight’ in terms of the population it can serve.
To understand how the landscape of PrEP providers changed overtime, the study leverages data from the NPIN PrEP Locator database at two different points in time: July 2020 and January 2023. The July 2020 data reflect the distribution of PrEP providers during the early implementation period of the EHE initiative. The January 2023 observation captures provider distribution several years into EHE implementation. The PrEP Locator database does not consistently record the date a facility is added, making it impossible to conduct a more granular over-time analysis of changes in PrEP providers.
The 2020 PrEP provider data records the name, address, and geolocated longitude and latitude coordinates for each entry. In 2020, providers were sorted into four non-mutually exclusive service categories: PrEP services, post-exposure prophylaxis (PEP) services, assistance with enrolling in PrEP-support programmes, and PrEP services for those without insurance. For the 2020 data, only the clinics with PrEP services, the first category, were included in the spatial analysis, as it is the most comprehensive categoryFootnote 2 . This inclusion criterion resulted in 3,952 clinic locations across all 50 states. For the 2023 data, the PrEP Locator database underwent updates to its entry maintenance, allowing those with access to the data file to download a list of providers meeting specific search criteria. As a result, only PrEP service providers were considered in the search, resulting in 5,427 providers across all 50 states.
Geographic and population data
For population data, this study leverages the American Community Survey (ACS), which provides detailed 5-year estimate tables for all geographies in the U.S. For the 2020 period of observation, this study uses the 2014–2018 ACS 5-year estimates data tables, which reflect the latest ACS data available at the time the 2020 PrEP provider data were released. Similarly, for the 2023 data tables, this study uses the 2017–2021 ACS 5-year estimates data, which reflects the latest ACS data available at the time the 2023 PrEP provider data were released. The data were aggregated at both the block group level and the census tract level for all states. Block groups represent smaller units of geography than census tracts while also being perfectly nested within census tracts. For the block group level, the total population over the age of 18 was used to estimate the population-weighted centroid of each census tract. Rather than using the geographic centre, a population-weighted centroid better reflects the way in which populations are distributed within a geographic unit.
For all census tracts in both time periods, the total population aged 18 and older was calculated to represent the population most likely to be in need of PrEP, as those under 18 report the lowest proportion of PrEP prescriptions (Caponi et al., Reference Caponi, Burgess, Leatherwood and Molano2019). The total population above the age of 18 is considered to be the estimated population in the spatial analyses. Additionally, the racial and ethnic group composition of census tracts was used in post-analysis reporting of demographics living in PrEP deserts in the periods of interest. Finally, the ACS poverty tables were used to define the level of need within each census tract. To operationalise the level of need, this study uses the proportion of population within each census tract reporting household income below the 150 per cent federal poverty line (FPL), which has been used in previous studies considering spatial and nonspatial dimensions of potential healthcare access (see Kreitzer et al., Reference Kreitzer, Smith, Kane and Saunders2021; Smith et al., Reference Smith, Kreitzer, Kane and Saunders2022). Detailed population and demographic characteristics for each state can be found in the Appendix.
Travel-time thresholds and urbanicity adjustment
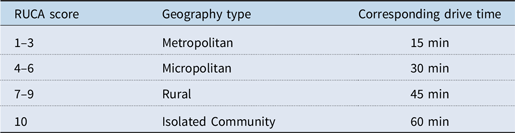
An important methodological limitation of previous research assessing the accessibility of healthcare facilities and services is that travel times deemed ‘reasonable’ across a unit of geography tend to be homogenous. That is, some previous studies assign some threshold, like 30 minutes drive time, as the cut-off for identifying constrained spatial access. A universal travel-time threshold may obscure differences in typical travel behaviour across urban and rural settings. For example, those in rural areas tend to travel longer and farther to access resources than their urban counterparts. To account for differences in reasonableness in travel time, this study follows the protocol employed by previous scholarship assessing access to Title X clinics by varying travel time by Rural–Urban Commuting Area (RUCA) codes from the 2010 census (Kreitzer et al., Reference Kreitzer, Smith, Kane and Saunders2021; Smith et al., Reference Smith, Kreitzer, Kane and Saunders2022). The RUCA codes account for the population density, level of urbanisation, and daily community patterns for each census tract. For each inhabited census tract, a RUCA score ranging from 1 to 10 is assigned, where one represents the most metropolitan areas. Table 1 reflects the translation from RUCA scores to travel times for the spatial analysis.
Corresponding drive times for RUCA scores

Table 1. Long description
A table with four rows and three columns. The columns are labeled RUCA score, Geography type, and Corresponding drive time. The rows detail the following: Row 1: RUCA score 1 to 3, Metropolitan, 15 minutes; Row 2: RUCA score 4 to 6, Micropolitan, 30 minutes; Row 3: RUCA score 7 to 9, Rural, 45 minutes; Row 4: RUCA score 10, Isolated Community, 60 minutes. The table illustrates how drive times vary based on the level of urbanization and population density as indicated by RUCA scores.
Empirical approach
I2SFCA method
Access should be considered as a multidimensional construct. However, previous scholarship assessing the accessibility of healthcare facilities and services tends to conduct calculations for larger units of geography (eg, counties or metropolitan statistical areas) and employ a patient-to-provider ratio approach to identify areas with limited or no access to the healthcare facility or service of interest. While patient-to-provider ratios provide a digestible method for identifying need, such calculations fail to account for multiple spatial dynamics. First, patient-to-provider ratios fail to account for the distribution of populations and providers within the geographic unit. Second, patient-to-provider ratios overemphasise administrative boundaries, operating under the assumption that individuals within the unit of geography do not travel to neighbouring areas to seek out healthcare services.
To address the limitations of previous methods to identify areas of constrained healthcare access, this paper uses the I2SFCA method, which originates in the applied geography literature and has been applied in recent scholarship examining access to public health services (see Kreitzer et al., Reference Kreitzer, Smith, Kane and Saunders2021; Smith et al., Reference Smith, Kreitzer, Kane and Saunders2022). The I2SFCA was originally developed by Luo (Reference Luo2004) but expands on previous methodological work by Radke and Mu (Reference Radke and Mu2000). Kreitzer et al. (Reference Kreitzer, Smith, Kane and Saunders2021) provide a detailed description of how the I2SFCA enhances previous geographic methods. In short, a basic FCA model draws an X-minute polygon (where X denotes a specified driving time) around points representing the demand for services. The 2SFCA builds on this by drawing an X-minute polygon around both the demand and supply points. The second iteration of this step considers that populations may have multiple service centres within their reach. Mathematically, the first step creates a ratio of the supply site to the population within the defined driving time. The second step then adds together the ratios for each supply site able to be accessed by each demand site, giving a spatial score for each demand unit. While the spatial access score reflects geographic accessibility, the socio-economic context is incorporated in the classification stage (not the calculation stage) of desert designations. In this application, a measure of the poverty rate is incorporated when classifying PrEP deserts.
Identifying PrEP deserts
This study uses a variety of spatial and statistical tools through ArcGIS Pro to carry out individual I2SFCA calculations for each state-year. First, the I2SFCA method relies on two separate defined points: one point representing the supply side of access, in this case a PrEP provider, and one point reflecting the demand side of access. To generate demand points, this paper leverages the relationship between block groups and census tracts, as block groups are perfectly nested within census tracts, to create population-weighted centroids. Geographic centroids for each block group within a state were calculated. Then, the ‘average centre’ of each block group centroid is clustered by census tract and weighted by population to create a population-weighted centroid. The population-weighted centroid is used as the point reflecting the demand side of access.
Next, the RUCA scores were spatially joined to each provider site and population-weighted centroid. Connecting the RUCA scores to the supply and demand points allows for the determination of the appropriate driving time threshold for each location. Using the drive-time estimation feature in ArcGIS Pro, travel-time catchment polygons were generated around each supply and demand point. The drive time estimation feature incorporates traffic patterns to accurately show how far one can travel from a given point within the designated time. For rural and isolated communities, the catchment calculation used the drive-time estimation feature, which incorporates unpaved roads as a means of travel.
In the first stage of the calculation, the supply catchment is assessed by calculating the ratio of PrEP providers to their surrounding population over the age of 18 within X minutes. This can be thought of as a Provider-to-Population Ratio. Each facility is treated as a single supply unit due to the absence of provider-level prescribing counts in the NPIN database. Then, in the second stage, the sum of the Provider-to-Population Ratios is calculated for each provider within X minutes to a census tract population-weighted centroid. The sum from the second stage now takes on the form of the Spatial Access Score.
The unit of analysis for identifying PrEP deserts is at the census tract level. Separate I2SFCA calculations are run for all census tracts for each state-year. The I2SFCA is computationally intensive, and most previous employments of this method consider single units (such as a single city or portion of a state). Even Kreitzer et al. (Reference Kreitzer, Smith, Kane and Saunders2021), in their use of the I2SFCA to study access to Title X family planning clinics, consider only a selection of fourteen states over a single-year period. For this analysis, this study runs I2SFCA calculations for each state across two time periods, resulting in 100 in total.
Criteria for PrEP desert designations
For all state-year analysis, this study identifies two different types of PrEP deserts. Census tracts with a Spatial Access Score of zero are classified as exhibiting ‘No Spatial Access’, indicating that no PrEP providers fall within the designated travel-time catchment. The inclusion of socio-economic context does not alter the Spatial Access Score itself. Instead, census tracts in which at least 50 per cent of residents live below 150 per cent of the FPL are additionally classified as ‘High Poverty’. Census tracts meeting both conditions are designated ‘No Spatial Access + High Poverty’.
Results
Mapping PrEP deserts in 2020 and 2023
In the first stage of the analysis, the size and scope of PrEP deserts in 2020 were identified by using the I2SFCA calculation for all 50 states. The composite map of PrEP deserts in the United States for 2020 is shown in Figure 1(a), with Alaska and Hawaii included in Figure 1(b). In Figures 1(a) and (b), two different types of PrEP deserts appear on the maps. The areas highlighted in lighter purple refer to census tracts with zero spatial access. This means that residents of this census tract do not live within a geographically reasonable drive time to a PrEP provider. The second type of desert, reflected in the darker purple, identifies areas with zero spatial access and high need, defined as tracts where at least 50 per cent of the population lives below the 150 per cent FPL. The census tracts in dark purple reflect areas where individuals may experience both geographic barriers to accessing PrEP and socio-economic conditions that may further constrain their access to healthcare. As reflected in the nationwide maps, large portions of the United States were classified as PrEP deserts in 2020. These areas are particularly concentrated in rural regions of the South and Mountain West, and portions of the Midwest.
(a) PrEP deserts in the Contiguous United States, 2020. (b) PrEP deserts in Alaska and Hawaii, 2020.

Figure 1. Long description
The image contains three maps illustrating areas with limited access to PrEP (Pre-Exposure Prophylaxis) in the United States in 2020. The first map shows the contiguous United States, highlighting regions with no spatial access to PrEP and regions with no spatial access combined with high poverty. The second map focuses on Alaska, indicating similar areas with no spatial access and those with no spatial access and high poverty. The third map displays Hawaii, marking regions with no spatial access to PrEP. The maps use different shades of purple to distinguish between areas with no spatial access and those with no spatial access combined with high poverty. Specific locations such as Fairbanks, Badger, and Knik-Fairview in Alaska, and Pearl City, Keilu, and Honolulu in Hawaii are labeled. The maps provide a visual representation of the geographic disparities in access to HIV prevention tools across different states and regions.
In the second stage of the analysis, the I2SFCA calculations were repeated for all 50 states, focusing on PrEP provider locations in 2023, which allows for the determination of how the size and scope of PrEP deserts changed between 2020 and 2023. Figures 2(a) and (b) show the composite map of PrEP deserts in 2023 for the contiguous United States and Alaska and Hawaii, respectively. The landscape of PrEP access seems to have improved between 2020 and 2023, with more geographic regions, particularly through the Midwest and the coastal portion of the West, gaining access to PrEP providers. Region-based maps that show in greater detail the size and scope of PrEP deserts in both time periods are included in the Appendix. Despite these improvements, substantial pockets of PrEP deserts still exist, particularly in rural areas of the country where healthcare infrastructure is relatively sparse.
(a) PrEP deserts in the contiguous United States, 2023. (b) PrEP deserts in Alaska and Hawaii, 2023.

Figure 2. Long description
The image contains three maps. The first map shows the contiguous United States with areas marked in purple indicating regions with no spatial access to PrEP and areas marked in dark purple indicating regions with no spatial access to PrEP and high poverty. The second map shows Alaska with similar color coding for PrEP deserts. The third map shows Hawaii with regions marked in purple indicating no spatial access to PrEP. Key locations such as Fairbanks, Badger, Knik-Fairview, Anchorage, Pearl City, Kailua, Honolulu, East Honolulu, and Hilo are labeled.
At the national level, these changes correspond to measurable shifts in the population living in PrEP deserts. The total population living in PrEP deserts declined substantially from approximately 191.1 million in 2020 to roughly 73.1 million in 2023. More precisely, the number of individuals living in high-needs PrEP deserts declined from approximately 10.5 million in 2020 to just under 2.2 million in 2023, though there is heterogeneity by state. Only in five states did the total population living in PrEP deserts increase between 2020 and 2023: Alaska, Alabama, Kentucky, Maine, and Montana. A composite population table is available in the Appendix.
Overall, the national results suggest that while PrEP deserts decreased in recent years, improvements in access have not been uniform across the country. Many rural communities and areas with high levels of poverty continue to experience constrained access to PrEP providers despite broader increases in provider availability.
State-level changes in PrEP deserts
While the national patterns provide a broad overview of changes in PrEP deserts, the I2SFCA method allows for the identification of how areas of individual states have gained or lost access over time. By calculating spatial access scores for each state over two time periods, this study overlays the two maps to identify specifically where changes in access have occurred. Figures 3 and 4 depict composite maps for Washington and Tennessee, respectively. Each composite provides a snapshot of the state-specific map in 2020 and 2023 and includes additional maps identifying the areas of the state where PrEP deserts were either eliminated or expanded. In the composite figures, the eliminated deserts are shown in the yellow-shaded areas. Following the prior maps, the eliminated desert maps discriminate between two different types of deserts: zero spatial access and zero spatial access with high need. The medium yellow represents areas where zero spatial access deserts in 2020 were eliminated by 2023. Similarly, the dark yellow represents areas where zero spatial access and high-need deserts in 2020 were eliminated by 2023. The final portion of each composite captures only the areas between 2020 and 2023 where PrEP deserts expanded. In other words, in the areas shaded purple, residents had reasonable access to a PrEP provider in 2020, but lost that access by the start of 2023.
Changes in PrEP deserts over time, Washington.

Figure 3. Long description
The image contains four maps illustrating changes in PrEP deserts in Washington State between 2020 and 2023. The first map, titled ‘PrEP Deserts in WA, 2020,’ shows areas with no spatial access to PrEP providers in purple and areas with no spatial access combined with high poverty in dark purple. The second map, titled ‘PrEP Deserts in WA, 2023,’ similarly highlights these areas with the same color scheme. The third map, titled ‘Eliminated PrEP Deserts in WA Between 2020 and 2023,’ indicates regions where PrEP deserts have been eliminated, with yellow representing areas with no spatial access and dark yellow representing areas with no spatial access and high poverty. The fourth map, titled ‘New PrEP Deserts in WA Between 2020 and 2023,’ shows newly identified PrEP deserts in purple. Major cities such as Seattle, Spokane, Tacoma, and Kennewick are marked for reference. The maps collectively illustrate the spatial distribution and changes in access to PrEP services over the specified period.
Changes in PrEP deserts over time, Tennessee.

Figure 4. Long description
The image contains four maps illustrating changes in PrEP deserts in Tennessee between 2020 and 2023. The first map, labeled ‘PrEP Deserts in TN, 2020,’ shows areas with no spatial access to PrEP providers in purple and areas with no spatial access combined with high poverty in dark purple. The second map, labeled ‘PrEP Deserts in TN, 2023,’ shows a similar distribution but with some changes. The third map, labeled ‘Eliminated PrEP Deserts in TN Between 2020 and 2023,’ highlights areas where PrEP deserts have been eliminated, with yellow indicating no spatial access and orange indicating no spatial access combined with high poverty. The fourth map, labeled ‘New PrEP Deserts in TN Between 2020 and 2023,’ shows new areas that have become PrEP deserts, with purple indicating no spatial access and dark purple indicating no spatial access combined with high poverty. Major cities such as Memphis, Nashville, Knoxville, Clarksville, and Chattanooga are marked on all maps.
Figure 3 presents the composite maps for Washington, a state that experienced substantial expansion in geographic access to PrEP providers. Between 2020 and 2023, many areas that previously were considered PrEP deserts gained access, particularly in metropolitan regions and their surrounding suburban communities. As a result, the number of individuals living in PrEP deserts declined from approximately 7.0 million in 2020 to 1.2 million in 2023. These patterns are consistent with the expansion of healthcare infrastructure and the concentration of PrEP providers within large urban health systems.
In contrast, Tennessee, depicted in Figure 4, illustrates a more uneven trajectory in the changing landscape of PrEP deserts. Although some regions in the state gained access to PrEP providers between 2020 and 2023, other parts of the state experienced the emergence of new PrEP deserts, particularly in the western region of Tennessee. Overall, the population living in PrEP deserts changed from 3.3 million in 2020 to just under 2.7 million in 2023, a much smaller shift than in Washington. These mixed results highlight how increases in the number of providers do not necessarily translate into uniform improvements in spatial access. Gains in metropolitan and suburban areas may coincide with persistent or even worsening deserts in rural regions where healthcare infrastructure remains limited.
Taken together, these examples demonstrate that changes in PrEP deserts are uneven within states. While some areas experience meaningful improvements in spatial access, other regions may continue to face persistent barriers to care or even experience declining access over time. These patterns underscore the importance of examining geographic access at a finer scale, as statewide increases in provider availability may obscure localised disparities in access to HIV prevention.
Changes in PrEP deserts in EHE priority states
The EHE initiative designated priority jurisdictions with disproportionately high rates of HIV diagnoses, including seven states with high HIV diagnosis rates in rural areas: Alabama, Arkansas, Kentucky, Mississippi, Missouri, Oklahoma, and South Carolina. These states were identified as facing unique challenges in delivering HIV prevention services in rural communities, where spatial access to healthcare providers tends to be more limited. But how did the landscape of PrEP deserts evolve in these priority states?
Figures 5–7 present composite maps for selected EHE priority states, illustrating how the geographic distribution of PrEP deserts changed between 2020 and 2023. Across several of these states, metropolitan areas and their surrounding suburban rings experienced improvements in spatial access to PrEP providers. As seen in Arkansas, there were substantial reductions in PrEP deserts across the state, including notable improvements in rural areas and lower-income communities. In Mississippi, however, while some areas of the state gained access to PrEP providers between 2020 and 2023, some rural communities, particularly in the state’s central region, are now in newly created PrEP deserts. Interestingly, Kentucky showed improvements in the rural, eastern portion of the state with sizeable improvements in low-income areas; however, at the same time, areas around the urban cores experienced the emergence of new PrEP deserts. Even so, while most priority states extended access in some areas, large swaths of each state still live in PrEP deserts, underscoring the need for continued attention in these rural communities.
Changes in PrEP deserts over time, Arkansas.

Figure 5. Long description
The first map displays PrEP deserts in Arkansas in 2020, highlighting areas with no spatial access and no spatial access combined with high poverty. The second map shows PrEP deserts in Arkansas in 2023, indicating changes over time. The third map illustrates eliminated PrEP deserts between 2020 and 2023, showing areas where access has improved. The fourth map depicts new PrEP deserts that have emerged between 2020 and 2023. Each map uses color coding to differentiate between no spatial access and no spatial access combined with high poverty.
Changes in PrEP deserts over time, Mississippi.

Figure 6. Long description
The image contains four maps of Mississippi showing changes in PrEP deserts from 2020 to 2023. The top left map, titled ‘PrEP Deserts in MS, 2020,’ displays areas with no spatial access and no spatial access combined with high poverty. The top right map, titled ‘PrEP Deserts in MS, 2023,’ shows similar data for the year 2023. The bottom left map, titled ‘Eliminated PrEP Deserts in MS Between 2020 and 2023,’ highlights areas where PrEP deserts have been eliminated, distinguishing between no spatial access and no spatial access combined with high poverty. The bottom right map, titled ‘New PrEP Deserts in MS Between 2020 and 2023,’ indicates new PrEP deserts that have emerged, again distinguishing between no spatial access and no spatial access combined with high poverty. The maps use color coding to represent different types of deserts and changes over time.
Changes in PrEP deserts over time, Kentucky.

Figure 7. Long description
The image contains four maps illustrating changes in PrEP deserts in Kentucky between 2020 and 2023. The first map, titled ‘PrEP Deserts in KY, 2020,’ shows areas with no spatial access to PrEP services and areas with no spatial access combined with high poverty. The second map, titled ‘PrEP Deserts in KY, 2023,’ displays similar data for the year 2023. The third map, titled ‘Eliminated PrEP Deserts in KY Between 2020 and 2023,’ highlights areas where PrEP deserts have been eliminated, distinguishing between those with no spatial access and those with no spatial access combined with high poverty. The fourth map, titled ‘New PrEP Deserts in KY Between 2020 and 2023,’ identifies new PrEP deserts that have emerged, again distinguishing between no spatial access and no spatial access combined with high poverty. Major cities such as Louisville, Lexington, Owensboro, Elizabethtown, Bowling Green, and Somerset are marked on the maps.
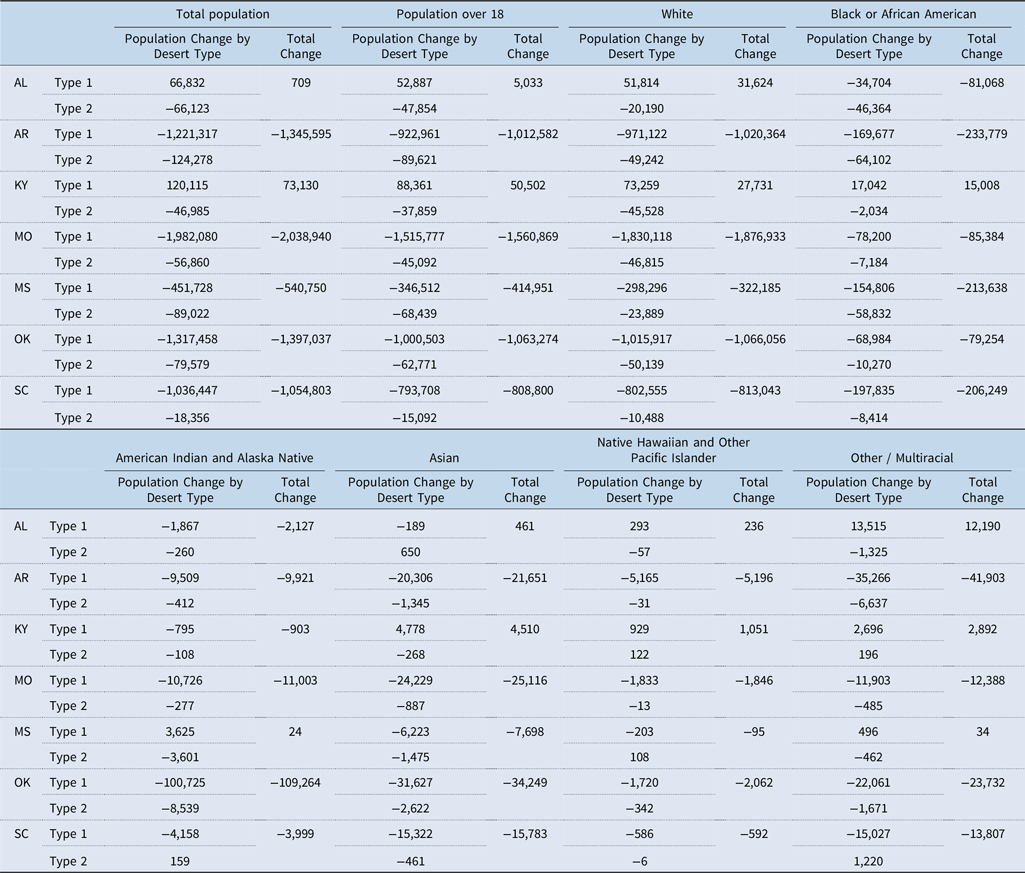
To assess how communities are experiencing the changing landscape of PrEP deserts, Table 2 summarises the change in populations living in PrEP deserts between 2020 and 2023 in EHE priority states. The values depicted in Table 2 show the change between 2020 and 2023 for each relevant population group living in a PrEP desert. As such, a negative value indicates that fewer individuals live in a PrEP desert. Across most of these states, the number of individuals living in PrEP deserts declined substantially between 2020 and 2023. In several cases, these reductions were large in magnitude. The number of residents in PrEP deserts declined by more than 2 million in Missouri and by more than 1 million in Arkansas, Oklahoma, and South Carolina. These findings suggest that the expansion of PrEP providers over this period translated into meaningful improvements in geographic access to HIV prevention services across these priority states.
Change in populations living in PrEP deserts between 2020 and 2023 in EHE priority states

Table 2. Long description
The table presents data on population changes in PrEP deserts across various racial groups and desert types in EHE priority states between 2020 and 2023. It includes columns for total population, population over 18, and specific racial groups such as White, Black or African American, American Indian and Alaska Native, Asian, Native Hawaiian and Other Pacific Islander, and Other/Multiracial. Each row represents a state and desert type, showing the population change by desert type and the total change. Notable trends include significant population decreases in states like Missouri and Arkansas, with reductions exceeding 2 million and 1 million respectively. The table highlights improvements in geographic access to HIV prevention services in these states.
Note: Type 1 refers to areas with zero spatial access. Type 2 refers to areas with zero spatial access and 50 per cent of the population living below the 150 per cent FPL. The values reflected in the table represent the difference between 2023 and 2020. A negative number indicates that the population living in the desert decreased across the two time periods.
These improvements in access reached multiple demographic groups. In many of the priority states, the number of white, Black, Native, Asian, Pacific Islander, and multiracial residents living in PrEP deserts declined, indicating that the expansion of PrEP providers improved spatial access for diverse populations. Despite these overall improvements, the patterns are not uniform across priority states. Alabama and Kentucky stand out as exceptions to the broader trend, with Alabama showing a minor increase in the total population in PrEP deserts and Kentucky a more substantial one. In Alabama, the small increase is driven largely by predominantly white communities losing access to PrEP providers. However, in Kentucky, the expansion of PrEP deserts disproportionately affected communities of colour, with the total population living in a PrEP desert in Kentucky being over 60 per cent nonwhite. Taken together, these findings suggest that while the landscape of PrEP deserts improved substantially in EHE priority states, access gains were not evenly distributed across all communities. Although many residents gained spatial access to PrEP providers, persistent pockets of limited access remain, particularly in areas with sparse healthcare infrastructure and for some marginalised communities. These patterns highlight the continued importance of geographic considerations and equity in the delivery of HIV prevention services across states.
Conclusion
PrEP is an important strategy in mitigating the transmission of HIV. Only when taken as prescribed is PrEP highly effective at reducing the risk of HIV transmission. However, unlike other daily medications, PrEP requires individuals to make frequent visits and receive routine screenings to ensure a continued HIV-negative status. Given the EHE’s stated goals of reducing the spread of HIV by a large share dovetailed with the factors shaping demand for and access to PrEP, it is important to assess the extent to which PrEP providers are distributed equitably.
This analysis sheds light on the changing landscape of PrEP deserts between 2020 and 2023. The results indicate that the geographic distribution of PrEP providers expanded substantially during the study period, resulting in large reductions in the number of individuals living in areas without spatial access to PrEP services. Across the seven states prioritised under the EHE initiative, millions of residents gained spatial access to a PrEP provider between 2020 and 2023, with particularly large reductions in PrEP deserts in states such as Missouri, Arkansas, Oklahoma, and South Carolina.
Despite these overall improvements, geographic access to PrEP providers remains uneven across states and communities. While many metropolitan areas and regional healthcare hubs experienced notable gains in provider availability, several rural regions continue to exhibit persistent PrEP deserts. Kentucky stands out as an exception to broader regional trends, with increases in the population living in areas without spatial access to PrEP providers, particularly in urban and suburban areas, during the study period. These findings highlight that increases in the number of providers do not necessarily translate into evenly distributed improvements in geographic access to HIV prevention services.
Changes in PrEP access were also experienced differently across demographic groups. In some states, the emergence or persistence of PrEP deserts affected different populations in distinct ways. For example, in Alabama, the modest increase in the population living in PrEP deserts was driven largely by predominantly white communities losing spatial access to PrEP providers. In contrast, the expansion of PrEP deserts in Kentucky disproportionately affected communities of colour, where more than 60 per cent of residents living in expanded PrEP deserts identified as nonwhite. These patterns illustrate how shifts in the geographic distribution of providers can produce different equity implications across states, even when overall access trends appear similar at the aggregate level. As policymakers and public health professionals continue to expand HIV prevention efforts, addressing geographic disparities in the distribution of PrEP providers may play an important role in ensuring that prevention services are accessible to populations most at risk of HIV.
This study contributes to the growing literature assessing the geographic access to HIV prevention services in several ways. First, by employing a geography-based measure of access, the analysis captures how spatial and socioeconomic factors jointly shape the availability of PrEP providers across communities. Using the I2SFCA approach allows the analysis to account for variation in travel times across urban and rural areas while incorporating measures of socioeconomic need when identifying areas with constrained access. Additionally, previous scholarship has focused on access to PrEP for a single region and/or a single target population, most commonly MSM (Siegler et al., Reference Siegler, Bratcher, Weiss, Mouhanna, Ahlschlager and Sullivan2018; Siegler et al., Reference Siegler, Bratcher and Weiss2019; Skolnik et al., Reference Skolnik, Bokhour, Gifford, Wilson and Van Epps2020). By examining spatial access to PrEP providers across the entire United States and across multiple demographic groups, this study provides a more comprehensive assessment of how the geographic distribution of PrEP providers shapes access to prevention services. Additionally, by examining two points in time, the analysis illustrates how access to PrEP providers has evolved as the availability of PrEP services has expanded or contracted, and what that means for particular communities. Finally, this study demonstrates how spatial measures of healthcare access can be applied at a national scale to examine changes in access over time. Previous applications of geography-based access measures often focus on single states or smaller regions (Kreitzer et al., Reference Kreitzer, Smith, Kane and Saunders2021; Smith et al., Reference Smith, Kreitzer, Kane and Saunders2022). Applying this approach across all fifty states provides a broader perspective on how prevention infrastructure develops and where geographic gaps in access persist. Taken together, these findings underscore the importance of considering geographic accessibility when evaluating the reach of healthcare services and the equitable distribution of prevention resources
It is important to highlight the limitations of this work. First, the PrEP locator database identifies healthcare facilities willing to prescribe PrEP but does not capture the number of providers within each facility or the capacity of clinics to service patients. As a result, each facility is treated as a single provider location, which may obscure variation in prescribing capacity across facilities. Second, the spatial access measure captures geographic proximity to providers but cannot account for other barriers to PrEP uptake, including stigma, awareness, insurance coverage, or provider willingness to prescribe PrEP. Another limitation relates to the population used to estimate demand for PrEP services. Many previous studies of PrEP access use an estimation of the population of MSM, a population that faces a disproportionate burden of HIV risk. While this study’s approach reflects the fact that HIV risk extends beyond MSM populations, it does not directly reflect the spatial access disparities experienced by MSM communities. Future research incorporating more refined geographic estimates of MSM populations could provide additional insights into how the spatial distribution of PrEP providers aligns with the geography of HIV risk.
Future research could extend this analysis in key ways. First, incorporating more detailed estimates of MSM population distributions would allow researchers to examine how spatial access to PrEP providers aligns with the geography of populations facing higher HIV risk. Second, future studies could explore how changes in provider availability over time relate to broader policy initiatives, including the EHE initiative and other federal and state efforts to expand HIV prevention infrastructure. Finally, combining spatial access measures with data on PrEP uptake and prescribing patterns would provide additional insight into how geographic accessibility translates into actual use of prevention services. Such analyses would further improve our understanding of how the spatial distribution of healthcare resources shapes access to HIV prevention across communities
Supplementary material
The supplementary material for this article can be found at https://doi.org/10.1017/S1744133126100528.
Financial support
This research received no specific grant from any funding agency in the public, commercial, or not-for-profit sectors.
Competing interests
The author declares none.




 Open access

