


Introduction
Influenza is a major public health problem [Reference Li and Cao1] that brings an economic burden to patients and their families [Reference Quang2, Reference Gianino3], and causes a great number of deaths [Reference Wu4–Reference Dawood7].
Interferon-induced transmembrane proteins (IFITM) are a family of proteins that function as virus restriction factors [Reference Huang8–Reference Li10], while IFITM3 is a cellular ongoing endosome- and lysosome-localised protein that protects cells from numerous viral infections [Reference Desai11, Reference Feeley12]. In recent years, animal [Reference Bailey13], in vitro [Reference Williams14] and human studies have evaluated the relationship between rs12252, a single-nucleotide polymorphism (SNP) in IFITM3, and the risk of influenza.
To date, two meta-analyses [Reference Xuan15, Reference Yang16] have summarised the results of previous articles published from 2012 to 2014, but there were defects in both of these studies. First, there were differences in the data extracted from the same articles between the two meta-analyses. Moreover, one of them [Reference Xuan15] did not consider the homozygous comparison (CC vs. TT), since previous meta-analyses [Reference Xuan15, Reference Yang16] have showed an association between the minor C and severe influenza, it is imperative to analyse all data under this kind of model. The quantity of the studies included in a meta-analysis plays a vital role; however, only four studies were included before, five additional studies of high quality were available at this time. The latest studies were published in 2016 and 2017, indicating increased interest in this topic. Moreover, although the previous meta-analyses reached a conclusion about the correlation between rs12252 and influenza, the newly published articles present more inconsistent results. Hence, a new meta-analysis is urged to provide more confidence for the prevention and treatment of influenza in the future.
Materials and methods
Search strategy
A comprehensive systematic search was performed based on the electronic databases, PubMed, the Cochrane library, OVID, EBSCO and the Web of Science to obtain related studies published from the initial date to 9 November 2017. The following search terms were used to retrieve relevant literature: ‘flu OR influenza OR grippe’ AND ‘IFITM OR interferon-induced transmembrane OR rs12252’. Only human studies were recruited.
Inclusion and exclusion data
Eligible studies should comply with the following inclusion criteria: (1) regarding the association between rs12252 and influenza; (2) a cohort or case–control study; (3) influenza was diagnosed by polymerase chain reaction (PCR), patients should have been exposed to influenza virus in the past, developed clinical symptoms and with laboratory-confirmed influenza infection; (4) provide available genotype data to calculate the odds ratios (ORs) and 95% confidence intervals (CIs); (5) no deviation from HWE (Hardy–Weinberg equilibrium) of genotype distribution in the control group; (6) with full text; (7) published in English. Exclusion criteria were as follows: (1) animal studies; (2) abstracts, reviews or case reports; (3) containing insufficient genotype data.
Data extraction and quality assessment
Eligible studies were identified independently by two researchers according to the inclusion and exclusion criteria. Any disagreement was discussed and if an agreement could not be reached, the differences were resolved by a third researcher. The following information was collected from each selected study: (1) first author's name; (2) year of publication; (3) country of the population in each study; (4) ethnicity of cases and controls; (5) type of influenza; (6) genotyping method; (7) age of cases and controls; (8) source of controls; (9) samples of controls and cases; (10) MAF (Minor Allele Frequency); (11) HWE; (12) Newcastle–Ottawa Scale (NOS) score.
HWE was used to evaluate the quality of genotype data from the control group in each included study by the χ 2 test, and P > 0.05 was considered insignificant, indicating balanced distribution in the population. The quality of the studies was appraised by the NOS, which consists of three parts: selection, comparability and exposure. The score ranges from 0 to 9. Scores for high-quality articles were required to be 5 points at least in the NOS quality assessment, and studies with scores higher than 6 were adopted in our meta-analysis. Studies with scores higher than 6 were adopted in this meta-analysis.
Statistical analysis
The statistical analysis of data was performed using Revman 5.0 (The Cochrane Collaboration, http://ims.cochrane.org/revman) and Stata 12.0 software (Stata Corp, College Station, Texas, USA). Pooled ORs and CIs were used to evaluate the association between rs12252 and influenza based on four genetic models, namely the allelic (C vs. T), homozygous (CC vs. TT), dominant (CC + CT vs. TT) and recessive (CC vs. CT + TT) models. In addition, subgroup analyses were conducted according to different ethnic groups (Caucasian, Asian, African, Portuguese population) and severity of influenza (severe, mild), respectively.
Heterogeneity was calculated by the P-value for heterogeneity (P h) based on the Q test and the Thompson and Higgins classification index (I 2). A random effect was implemented if P h < 0.05 or I 2 > 50%, otherwise, a fixed model was selected to pool the results. Sensitivity analysis was conducted by excluding a single study each time to validate the influence of the data attributes on the pooled OR, and low-quality studies that impact the stability of the results were deleted after this test. Possible publication bias was detected using Begg's and Egger's tests, a P value of <0.05 revealed potential publication bias.
Results
Characteristics of included studies
A flow diagram of the study selection process and the eligible results were shown in Figure 1. After excluding duplicate articles, a total of nine relevant studies, which include 10 sets of data, were extracted from the databases mentioned above based on our inclusion and exclusion criteria. A total of 1365 cases and 5425 controls were included in the meta-analysis.
The meta-analysis selection process.

Different ethnic groups were defined as Caucasian, Asian, African and Portuguese. Four studies [Reference Everitt17–Reference Randolph20] were conducted for Caucasian ethnicity, four studies [Reference Lee21–Reference Zhang24] for East Asian ethnicity, one [Reference Randolph20] for African ethnicity and one study [Reference David25] was conducted for Portuguese mixed races. Of the nine studies, five [Reference López-Rodríguez19, Reference Randolph20–Reference Pan22, Reference David25] were new articles compared with earlier meta-analyses, and four of them were published in 2017 [Reference Lee21, Reference Pan22, Reference Zhang24, Reference David25].
All eligible studies used a case–control design and patients’ samples were genotyped by PCR methods. Some controls were from the general healthy population, while some were from the healthy population in the 1000 Genomes Project. All controls meet HWE. Subgroup analysis among the Caucasian population with 649 cases and 3875 controls while in the Asian population, 619 cases and 689 controls were included. Since the World Health Organization (WHO) reported the change of the A (H1N1) because of the pandemic and replacement caused by A (H1N1) pdm09 after 2009 [26], we renamed the type of influenza of some study according to it. The detailed characteristics and allele distribution of the selected studies were presented in Tables 1 and 2.
Characteristics of included studies
Allele distribution of included studies
Association between rs12252 and influenza
Overall analysis
The article of Randolph et al. contained two sets of data, which were retrieved from a white, non-Hispanic population and an African American population. To distinguish the two sets of data, the former was named Randolph 1 when the data were analysed using Revman 5.0 software, while the latter was called Randolph 2 in the meta-analysis.
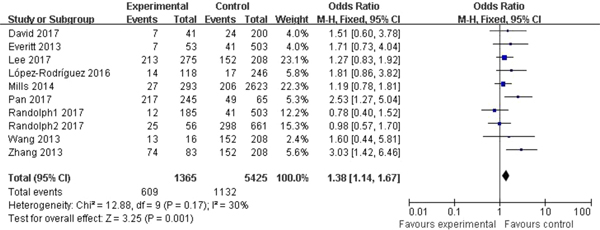
Significant association between rs12252 and influenza was found in all four genetic models (C vs. T: OR = 1.54, 95% CI (1.34–1.77), P < 0.00001; CC vs. CT + TT: OR = 2.80, 95% CI (2.03–3.85), P < 0.00001; CC vs. TT: OR = 2.39, 95% CI (1.85–3.09), P < 0.00001; CC + CT vs. TT: OR = 1.38, 95% CI (1.14–1.67), P = 0.001). The fixed model was applied to all allelic models because no obvious heterogeneity was found (Fig. 2).
Forest plot of the overall analysis (CC + CT vs. TT).

Subgroup analysis
The 10 sets of data were stratified into different subgroups by ethnicity and degrees of patients’ symptoms.
Subgroup analysis among the Caucasian population showed significant association in the allelic model (C vs. T: OR = 1.35, 95% CI (1.03–1.79), P = 0.03), recessive model (CC vs. CT + TT: OR = 10.56, 95% CI (3.37–33.04), P < 0.00001) and homozygote model (CC vs. TT: OR = 10.63, 95% CI (3.39–33.33), P < 0.00001). In the Asian population, obvious association was detected in all genetic models (C vs. T: OR = 1.73, 95% CI (1.45–2.07), P < 0.00001; CC + CT vs. TT: OR = 1.74, 95% CI (1.28–2.37), P = 0.0004; CC vs. CT + TT: OR = 2.31, 95% CI (1.75–3.05), P < 0.00001; CC vs. TT: OR = 2.74, 95% CI (1.90–3.94), P < 0.00001). No significant association was found in African or Portuguese populations because only one study was included for each of these two ethnic groups. The results were shown in Table 3 and Figure 3.
Forest plot of the subgroup classified by ethnicity (CC vs. CT + TT).
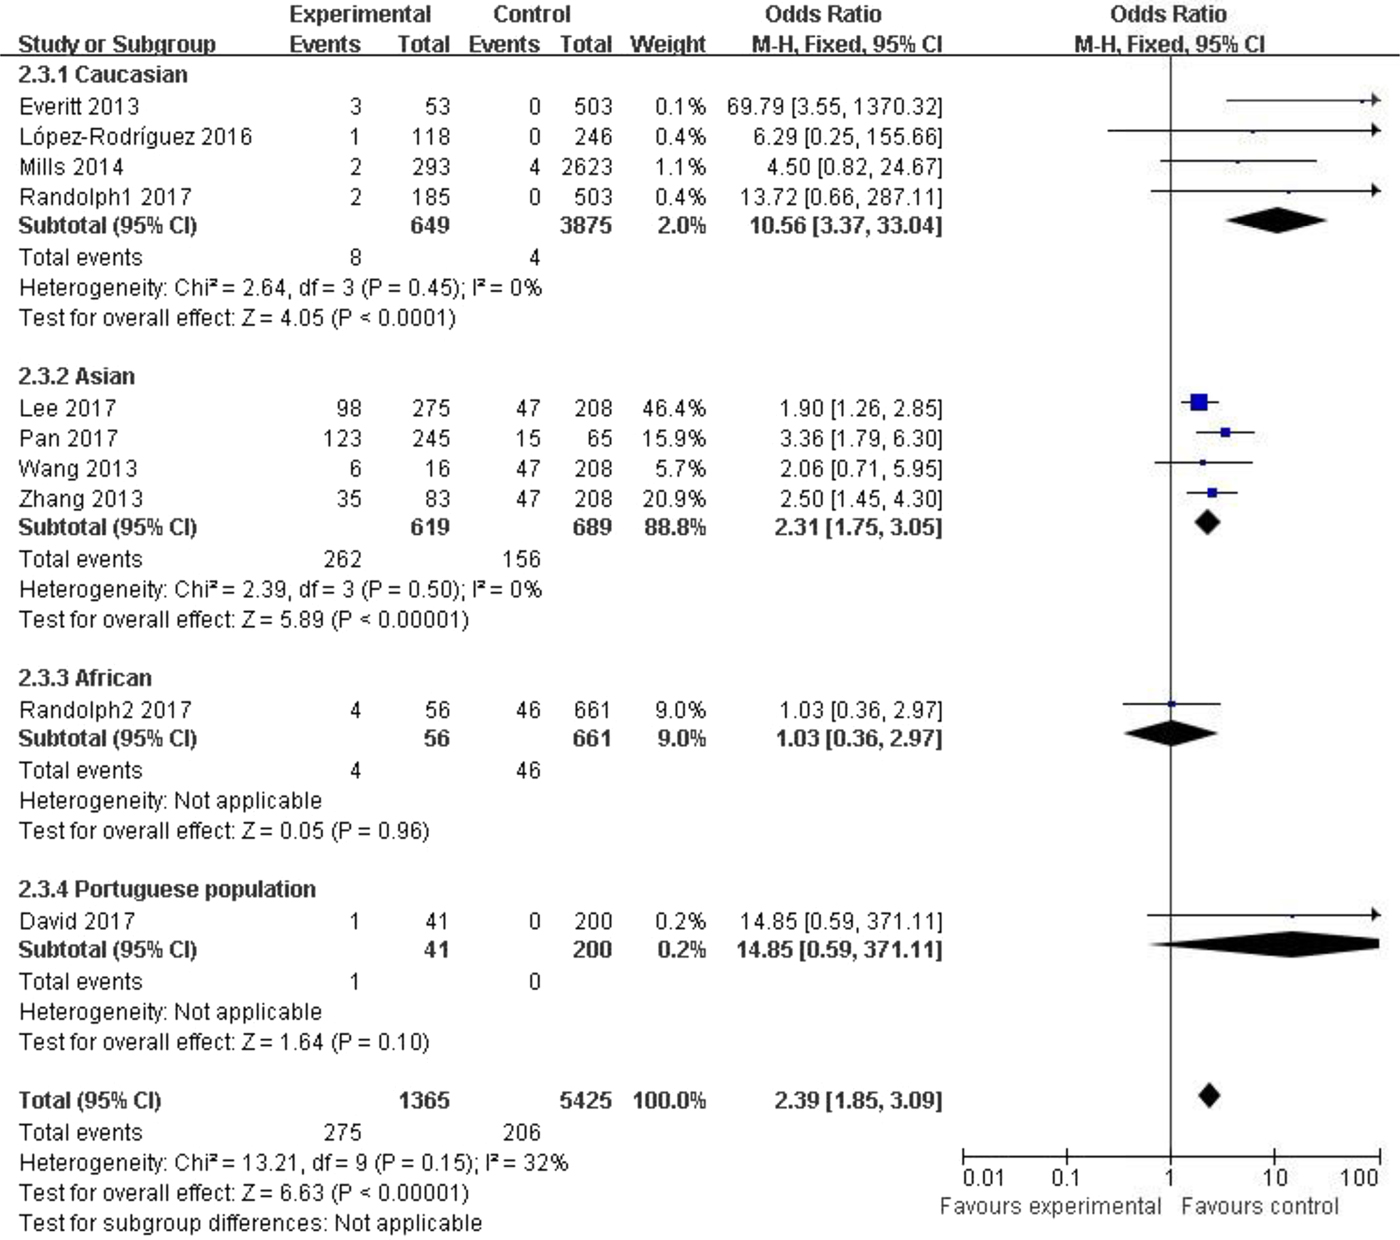
Meta-analysis for rs12252 and influenza

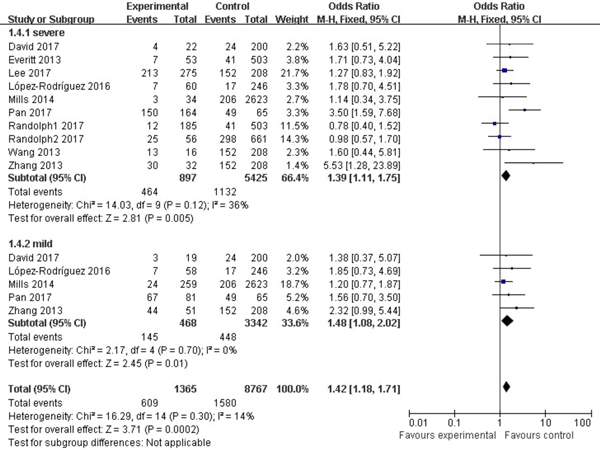
In the subgroup classified by severity of influenza, statistically significant association was detected in all four models when patients with severe symptoms were compared with the general population (C vs. T: OR = 1.76, 95% CI (1.23–2.50), P = 0.002; CC + CT vs. TT: OR = 1.39, 95% CI (1.11–1.75), P = 0.005; CC vs. CT + TT: OR = 3.65, 95% CI (1.86–7.13), P = 0.0002; CC vs. TT: OR = 4.38, 95% CI (1.93–9.94), P = 0.0004). There were also significant differences in the allelic model (C vs. T: OR = 1.37, 95% CI (1.08–1.73), P = 0.009), dominant model (CC + CT vs. TT: OR = 1.48, 95% CI (1.08–2.02), P = 0.01) and homozygote model (CC vs. TT: OR = 2.84, 95% CI (1.36–5.92), P = 0.005) when patients with mild influenza were compared with the healthy population, but no evidence of significant association was observed in the recessive model (CC vs. CT + TT: OR = 2.16, 95% CI (0.92–5.05), P = 0.08). The main results of our meta-analysis were shown in Table 3 and Figure 4.
Forest plot of the subgroup classified by severity of influenza (CC + CT vs. TT).

We also made a comparison between severe and mild influenza patients, and for this analysis, we used the mild group as the control group. A total of five studies [Reference Mills18, Reference López-Rodríguez19, Reference Pan22, Reference David25] were included in this analysis, which included 312 patients with severe influenza and 468 patients with mild influenza. Significant difference was shown in CC vs. TT (OR = 3.11, 95% CI (1.58–6.13), P = 0.001) and CC vs. CT + TT models (OR = 3.90, 95% CI (2.44–6.21), P < 0.00001). The main results of our meta-analysis were shown in Table 3.
Sensitivity analysis
Sensitivity analysis was conducted by omitting the data of a single study. For each omission, the results remained stable.
Publication bias
Begg's funnel plot and Egger's linear regression were conducted using Stata 12.0 to assess possible publication bias from the included studies. No obvious publication bias was observed in any model (Table 4 and Fig. 5).
Begg's funnel plot for the C vs. T model.
Results of Begg's funnel plot and Egger's linear regression
Discussion
In 2009, Huang et al. [Reference Huang8] reported the immune response to influenza A H1N1 virus mediated by IFITM proteins and it is now widely accepted that IFITM3 functions as restriction of viral infections. An early research [Reference Everitt17] reported the influence of host genetic determinants for some diseases, such as influenza. SNPs are the most common type of human genetic variation, and multiple SNPs exist in the IFITM3 gene, including rs12252. Following the 2009 flu pandemic, many studies focused on influenza and rs12252.
Everitt et al. [Reference Everitt17] first reported reduction of morbidity and mortality associated with influenza due to IFITM3. This association has been verified by this meta-analysis with half the data coming from 2016 and 2017 articles. However, some different conclusions were found in our study. Most of the eligible articles in our study found a connection between rs12252 and influenza, yet the connection was not replicated in the studies reported by Mills et al. [Reference Mills18] and David et al. [Reference David25], while Randolph et al. [Reference Randolph20] found rs12252 was not associated with susceptibility to paediatric influenza infection. Despite the fact that a study with negative results was selected [Reference Mills18] in the earlier meta-analysis [Reference Xuan15, Reference Yang16], more articles with negative results were included in our meta-analysis.
The two previous meta-analyses [Reference Xuan15, Reference Yang16] only included four articles published between 2012 and 2014. In addition, Xuan et al. [Reference Xuan15] found that one study [Reference Wang23] showed a departure from HWE in the control group, while we showed that this study actually accorded with HWE.
Our meta-analysis showed that discrepancies in host genetic factors may influence susceptibility to influenza. This is similar to the results of two previous meta-analyses, which suggested that the minor rs12252-C allele may protect people from influenza infection. In the allelic model, the comprehensive result showed people who carry the C gene were 1.54-fold more likely to succumb to influenza infection (C vs. T: P < 0.00001). In the dominant model, the risk of illness of people with the CC or CT genotype was 1.38-fold higher than those with a TT genotype (CC + CT vs. TT: P = 0.001). The risk of influenza was 2.38-fold greater in the recessive model (CC vs. CT + TT: P < 0.00001) and the risk of influenza even increased 2.80-fold when comparing people with CC and TT genotypes in the homozygote model (CC vs. TT: P < 0.00001). People infected with influenza during the period of viral circulation each year account for a large part of the entire population [Reference Molinari27]. Most people just have moderate respiratory symptoms and can recover within a week; however, a small number of people can develop severe respiratory distress or other illnesses and even rare complications [Reference Kenney28]. This variation in response may result from variation in host genes [Reference Ciancanelli29]. In the severe vs. mild group, we found people who carry the CC genotype are three times more likely to catch severe influenza than mild influenza compared with people carrying non-CC genotypes.
New discoveries are reflected in the subgroup analysis. When the data were stratified by ethnicity, we found a significant association between the risk of the disease and rs12252 both in Asian and Caucasian populations. Four studies [Reference Lee21–Reference Zhang24] were included in the Asian group, double the number compared with the previous meta-analyses; and the results turned out to be significant in all four models, which showed rs12252-C increases the risk of influenza in the Asian population. In the Caucasian subgroup, we found significant differences except in the dominant model (CC + CT vs. TT, P = 0.22). However, previous meta-analyses [Reference Xuan15, Reference Yang16] found no significant connection between the SNP and influenza in the allelic (C vs. T) and homozygote models (CC vs. TT). Hence, our results may be more convincing in explaining the role of Gene C. We also identified a new association by the degree of the infection. Neither of the meta-analyses of Yang et al. [Reference Yang16] and Xuan et al. [Reference Xuan15] found any association between SNP rs12252 and patients with mild infection. However, we found that people with rs12252-C are at higher risk of influenza compared with healthy controls. These discrepancies may be due to: (1) sample sizes were increased in our study; (2) control group data from the 1000 Genomes Project (http://www.internationalgenome.org) were updated in 2013; therefore, more controls were included in the improved 1000 Genomes Project. With more eligible articles and participants, there is more confidence in the conclusions from subgroup analysis. (3) Representation of ethnicity was improved in our study. Previously, only a UK population was used to represent the Caucasian race, yet we added a Spanish population to the analysis. Similarly, we added people from other regions in China to improve reliability.
Our study included new studies that include African and Portuguese populations. Although the number of relevant articles is not sufficient to draw conclusions for these two populations, it shows the importance of this topic.
The heterogeneity of the four genetic models in our meta-analysis is low; however, slight heterogeneities exist (allelic model: I 2 = 46%; dominant model: I 2 = 30%; recessive model: I 2 = 32%; homozygote model: I 2 = 43%). The following reasons may explain these findings: (1) genotyping methods were not exactly the same among the nine included articles, despite all of them using PCR for genotyping; (2) the source of the control group varied; although we tried to get the most comparable data with the case group, some studies used control group data from other databases; (3) varying types of influenza were involved in the meta-analysis; (4) differences in social demographic characteristics existed in our primary studies.
Random models were only used when data were stratified by degree of illness; heterogeneity was found in the severe subgroup, but not in the mild subgroup. We consider that slight differences in the definition of the severe subgroup is one of the reasons for this. The definition of severe patients was similarly or clearly described as hospitalised patients in most of our eligible studies. However, in our newly selected articles, patients with severe influenza in the study of López-Rodríguez et al. [Reference López-Rodríguez19] were patients hospitalised with PVP, while in Pan et al. [Reference Pan22], severe patients were described as those with severe acute respiratory infection with influenza virus infection. Furthermore, the larger sample size may contribute to the result.
Although we tried our best to optimise our process, there are some limitations in our study. (1) Only nine English studies were included in our meta-analysis. For instance, although we found some eligible studies based on the title and abstract, we had to exclude a study because it was published in Russian; (2) most of the included studies were on Asian and Caucasian populations, while only one study included Portuguese [Reference David25] and one studied African [Reference Randolph20] populations. More studies in different ethnic groups are needed; (3) the definitions of severe influenza in the eligible studies are not exactly the same, which may increase the heterogeneity of our meta-analysis; (4) different kinds of influenza are analysed together which may contribute to the heterogeneity; (5) some studies were multi-arm studies, in subgroup meta-analysis was classified according to degree of patients symptoms; however, the data of control group were repeatedly used, which would enlarge the sample size by mistake and increase the risk of type I error.
In conclusion, our meta-analysis indicates significant association between rs12252 and not only severe but also mild influenza. Meanwhile, Asians and Caucasians carrying the C allele are more susceptible to influenza infection. The challenge we met was about the extraction of data of 1000 Genomes Project; fortunately, finally we extracted the data with the help of Huada Corporation. By including recent high-quality data, we provide a reasonable biological reference for further prevention and control strategies; however, some challenges of our results still exist, which were mainly reflected in the limitations discussed in our paper; if more original articles were included, and more subgroup analyses were carried out according to sexes, ages or virus strains, the result would be better; due to the limitations in our meta-analysis, further studies are still needed.
Financial support
This study was supported by the National Mega-projects for Infectious Diseases (2014ZX10004001 to YS) and grants from the National Science Fund for Distinguished Young Scholars (grant number 81525017).
Conflict of interest
None.


 Open access