


Introduction
Party systems in advanced democracies have been transformed over the past generation. There has been a sharp decline in mainstream party support and a rise in support for challenger parties (Hobolt and Tilley, Reference Hobolt and Tilley2016; De Vries and Hobolt, Reference De Vries and Hobolt2020). Explanations for mainstream right electoral decline tend to focus on the emergence of a ‘new politics’ centered on the sociocultural dimension, whereby new competitors on their right flank have been able to increasingly mobilize support (Beramendi et al., Reference Beramendi, Hausermann, Kitschelt and Kriesi2015; Kriesi and Schulte-Cloos, Reference Kriesi and Schulte-Cloos2020). By contrast, explanations for the electoral decline of the once ascendent social democratic party family have tended to emphasize socioeconomic structural changes, such as the decline of their working-class base stemming from de-industrialization and globalization (Kitschelt, Reference Kitschelt1994; Beramendi et al., Reference Beramendi, Hausermann, Kitschelt and Kriesi2015; Gingrich and Häusermann, Reference Gingrich and Häusermann2015; Benedetto et al., Reference Benedetto, Hix and Mastrorocco2020), and policy changes, such as the rightward movement of their economic policies (Karreth et al., Reference Karreth, Polk and Allen2012; Arndt, Reference Arndt2013; Schwander and Manow, Reference Schwander and Manow2017; Horn, Reference Horn2020; Loxbo et al., Reference Loxbo, Hinnfors, Hagevi, Blombäck and Demker2021; Polacko, Reference Polacko2022; Snegovaya, Reference Snegovaya2022).
Previous research indicates that the emergence of the populist radical right has had a negative impact on the vote share of the mainstream right (Abou-Chadi et al., Reference Abou-Chadi, Cohen and Wagner2022), who formerly had a virtual monopoly on the right of the political spectrum. However, social democrats have never had a monopoly on the left of the political spectrum. In most countries, social democrats have historically faced a challenge from the radical left, which is an old party family with a well-established electoral presence in most democracies (Przeworski and Sprague, Reference Przeworski and Sprague1986). And similarly, in many countries the green party family emerged in the 1980s in the center-left policy space (Grant and Tilley, Reference Grant and Tilley2019). Hence, three of the largest party families typically exist on the left, whereas only two exist on the right, with the liberals in the middle (albeit typically right-leaning on the economic dimension).
However, despite suffering reduced vote share, the mainstream right has largely been able to maintain power in most countries over the past decade. Bergman and Flatt (Reference Bergman and Flatt2021) suggest one reason why it is that the mainstream right benefits from broad-based appeals, which is not the case for the mainstream left. Since mainstream right decline has not been nearly as precipitous as that of their mainstream left rival, this paper examines how the policy offerings of political parties have impacted social democratic decline and the rise of challenger parties.
The analysis contributes to a burgeoning literature examining the transformation of Western politics, as well as the electoral behavior literature on party programmatic shifts, party competition, and vote choice, in three ways. First, previous work on social democratic decline has been too narrowly focused on Northern and Central Europe. The decline of social democracy, and its socio-structural and party supply origins, are not limited to these regions, nor has it been pinpointed prominently as a European Union issue. Therefore, the inclusion of the Anglosphere and Mediterranean region in this study, considerably broadens our spatial and comparative scope. Second, this study also challenges prevailing theories of party competition, which posit that centrist positions tend to be most electorally beneficial for parties because a majority of voters are located around the center (Meltzer and Richard, Reference Meltzer and Richard1981). Third and most importantly, this study empirically contributes to highly salient debates surrounding who exactly is abandoning the social democrats and which parties are benefitting. It does so by introducing, for the first time, comprehensive cross-national empirical evidence that speaks to these debates.
Largely following Downs’s (Reference Downs1957) seminal spatial theory of party competition, I undertake two main lines of analysis to address these important spatial, theoretical, and descriptive gaps in the literature. First, I test hypotheses at the individual level utilizing retrospective voting data from the Comparative Study of Electoral Systems (CSES). I show that a variety of voters are abandoning the social democrats – most notably the young, rural living, and lower educated, which has substantially accelerated since the financial crisis. Although social democrat parties lose voters to all party families, they tend to lose voters to parties closest to them ideologically, as left-leaning voters are significantly migrating to the greens, and especially to the radical left. Second, I find at the aggregate level on a sample of 21 advanced democracies (see online Appendix A1), over 327 elections, from 1965 to 2019, that increasingly, the radical left benefits most when social democrats adopt right-wing positions. The benefits arise via social democratic rightward economic positions but are augmented when simultaneously combined with rightward sociocultural positions. Although in part driven by the Mediterranean region, these findings provide notable ramifications for party strategy and contribute to explanations for the rise of challenger parties, at the expense of mainstream parties.
The paper proceeds as follow. I first provide a review of the literature, followed by the key hypotheses. In the fourth section I outline the research design. I then analyze the patterns of social democratic vote switching at the individual level, followed by a test of the hypotheses at both the individual and aggregate levels. In the final section, I conclude with a discussion of the key implications and potential avenues for future research.
Social democratic positions and brand dilution
Spatial theory and issue ownership
A fundamental mechanism at work in the logic of party behavior, is that through their programmatic policy offers, parties can attract voters that best fit their interests and ideology. Downs (Reference Downs1957) first introduced the seminal spatial argument, whereby in two-party systems, parties can maximize their vote shares by converging on the middle (medium voter theorem) since this is where a majority of voters are located. However, this can have negative consequences in multiparty systems. Downs (ibid: 141) posited that in multiparty systems, parties should aim for ‘ideological product differentiation by maintaining purity of doctrine’. Hence, by distinguishing themselves from their competitors and building their own brand, parties can achieve greater electoral success (Kitschelt, Reference Kitschelt1994). This is because branding provides voters with a useful heuristic that can enable them to better determine issue positions and differentiate between parties. For example, the environment and immigration are key brands for the greens and populist radical right, respectively. When parties moderate their positions and no longer offer much differentiation, voters are less able to distinguish party offers. This can lead to the loss of their brand appeal, which in turn causes voters to turn to other parties that offer clearer and more proximate positions (Downs, Reference Downs1957). Recent evidence shows that mainstream party convergence also weakens partisan attachments, most especially for social democrats (Grant and Tilley, Reference Grant and Tilley2022).
Economic moderation
Historically, social democratic parties promoted equality and embraced and expanded the welfare state, offering greater redistributive policies designed to temper capitalism’s more dangerous socioeconomic outcomes. They were able to establish issue ownership in this realm and it became a large part of their brand identity (Schumacher et al., Reference Schumacher, Vis and van Kersbergen2013). However, in the late 1980s and 1990s, the party family moderated their policies by embracing neoliberalism (Mudge, Reference Mudge2018). This ‘Third Way’ was designed to project an image as strong stewards of the economy and to become ‘catch-all’ parties that could offset the decline of their traditional working-class base.
Initially, Third Way strategy was successful, as social democratic parties swept into power by expanding their voter base through the acquisition of more centrist voters. However, since then, the parties have typically been shut out of power and have experienced substantially diminishing vote shares (most especially in France, Greece, Italy, and The Netherlands). Karreth et al. (Reference Karreth, Polk and Allen2012) have shown that catch-all policy moderation turned into ‘catch-and-release’, as core social democratic voters were at first willing to accept policy moderation to strategically attain power, but later become alienated with the rebrand and gradually drifted away. At the same time, social democrats were unable to hold on to the newly acquired centrist voters who were more fickle and less attached to the parties.
Lupu (Reference Lupu2014) has shown that the once-dominant parties in Latin America have lost their appeal through implementing policies that are inconsistent with their brand. This brand dilution can even lead to replacement or ‘Pasokification’, which is what appears to have occurred in Greece in the aftermath of the financial crisis. The once-dominant social democratic PASOK party imploded after implementing unpopular and off-brand austerity policies. This in turn precipitated its replacement by a new challenger party on the left – Syriza. Kraft (Reference Kraft2017) demonstrates that embracing austerity is a lose-lose situation for social democrats, because despite continued social democratic efforts to appear austere, the mainstream right has been able to maintain issue ownership over budget cuts in the minds of swing voters. Nor has the embrace of austerity prevented left-leaning voters from leaving the social democrats. Horn (Reference Horn2020) expands on this research to find that social democratic losses from embracing austerity largely become permanent, which leaves a tragedy of social democratic responsibility behind, in contrast to the mainstream right who are able to maintain issue ownership. Lastly, Schwander and Manow (Reference Schwander and Manow2017) find that the 2003–2005 Hartz welfare reform laws initiated by the German Social Democratic party, substantially contributed to the party’s decline, with many voters either abstaining, or moving over to a new radical left party (Die Linke).
Accommodation theory
Social democratic rebranding has also created an opportunity for the far right to attract the working-class base of the social democrats. They have done so by strategically focusing on immigration, moral traditionalism, and effectively blurring their economic positions to tap into the nativist and sociocultural conservativism of the working class (Rovny, Reference Rovny2013). This has prompted a debate as to whether social democrats would benefit from moving rightward on the second dimension by offering more restrictive immigration. Spoon and Klüver (Reference Spoon and Klüver2020) provide recent cross-national evidence that such an accommodation strategy does significantly benefit the mainstream left. Although the sample size is limited to just six countries over 15 elections, van Spanje (Reference van Spanje2018) provides evidence from 15 countries since 1944 that accommodation can work if mainstream parties adopt a cordon sanitaire, consisting of ruling out cooperation with the far right.
However, accommodating challenger parties by moving toward their position (Meguid, Reference Meguid2005) can come with a trade-off, as recent evidence from Germany shows that it can attract back radical right voters but alienates social democratic voters, resulting in a net vote loss for the party family (Chou et al., Reference Chou, Dancygier, Egami and Jamal2021). Similarly, Hjorth and Larsen (Reference Hjorth and Larsen2022) find in a Danish survey experiment that accommodation does attract anti-immigration voters and repels pro-immigration voters, but that the latter tend to defect to other parties on the left, thereby increasing the overall vote share on the left and the likelihood of a social democratic-led coalition government forming. Thus, accommodation could be context dependent on a party system with multiple parties on the left that can form a coalition government together, which is not always the case.
Scholars have also challenged the merits of accommodation strategy through the introduction of various economic scoping conditions. Abou-Chadi and Wagner (Reference Abou-Chadi and Wagner2019) find that social democrats can gain vote share if they offer leftist sociocultural positions combined with greater investment-oriented positions on the investment–consumption growth strategy spectrum, or if unions are limited in their capacity to mobilize against such shifts. Loxbo et al. (Reference Loxbo, Hinnfors, Hagevi, Blombäck and Demker2021) find that social democratic parties only really lose votes from rightward turns on the second dimension, when combined with low levels of welfare generosity. Similarly, Polacko (Reference Polacko2022) finds that social democrats only lose votes when they adopt rightward economic positions under higher inequality, or via rightward positioning simultaneously on both dimensions.
Furthermore, Rathgeb and Wolkenstein (Reference Rathgeb and Wolkenstein2022) provide evidence that successful social democratic shifts to the right on immigration, are predicative on the maintenance of broad agreement within the party between the leadership and grassroots. Comparing the Austrian and Danish responses to the 2015 refugee crisis, they find that the institutional party structure influences the success of internal dissent on accommodation. This dissent makes the party look divided and incapable, which accounts for the policy failure and resignation of social democratic leader Werner Faymann in Austria. Relatedly, Tavits (Reference Tavits2007) shows that policy shifts on value issues, such as immigration, tend to lack credibility in the eyes of voters, as the long-time French National Front leader Jean-Marie Le Pen famously formulated, ‘voters prefer the original to the copy’.
Following this literature, I test four hypotheses related to social democratic policy positioning and voting. I examine whether social democratic positioning influences whether their voters abandon the party. I then test which parties benefit from social democratic positioning, under different contexts.
Hypotheses
Across the West over the past generation, social democrats have joined their mainstream rivals in embracing a neoliberal market society focused on deregulation, financialization, and privatization. This convergence has benefitted the mainstream right since it has occurred on their turf, and who benefit more from broad-based appeals to the electorate (Bergman and Flatt, Reference Bergman and Flatt2021). When one model reigns supreme, mainstream parties also become limited in their ability to respond effectively to growing crises such as climate change and rising income inequality. Hence, voters abandon the mainstream left and either abstain from voting or turn to challenger parties that more clearly delineate positions on these issues.
Correspondingly, social democrats have also moved rightward over time on the second dimension and have been under pressure by some quarters to embrace accommodation theory. They have moved rightward on the cultural dimension nearly as much as on the economic dimension (see online Appendix A2). Therefore, the first hypothesis tests whether social democratic voters abandon the party family when it adopts rightward positions in these differing contexts:
HYPOTHESIS 1: Social democratic voters are more likely to abandon the party when the party family adopts rightward positions on the economic dimension (H1a), sociocultural dimension (H1b), or simultaneously on both dimensions (H1c).
The remaining hypotheses test the benefactors of social democratic positioning in each context from (H1). Following Downs’s spatial theory of party competition, I hypothesize that the radical left party family benefits the most from social democratic rightward positioning on the economic dimension. This is owing to the radical left long having been closely affiliated with economic issues in public debate (March, Reference March2011). The modus operandi of the radical left has been a distinctly critical view of neoliberalism and market-oriented policies that is rooted in the communist/socialist tradition. Hence, the party family promotes economic equality, labor issues, and welfare above all else. The party family then conceivably stands to benefit the most electorally by acting as issue entrepreneurs underlining the relevance of these issues, which have been neglected by the social democrats:
HYPOTHESIS 2: When social democratic parties adopt rightward positions on the economic dimension, the radical left gains the most vote share.
However, I expect a different benefactor to arise from social democratic positioning on the sociocultural dimension. Hence, once again following spatial logic, I hypothesize that the green party family benefits the most electorally when social democrats adopt rightward positions on the sociocultural dimension, as the green family predominantly aims to mobilize support from the second dimension (Grant and Tilley, Reference Grant and Tilley2019). In contrast, the radical left is much more focussed on economic policies. Indeed, when estimating policy positions of each party family since 1965, the greens are by far the most socioculturally leftist party family (See Appendix A2). Therefore, the green family should be able to benefit from a spatial policy gap left behind by a mainstream left adopting rightward positions on the second dimension.
HYPOTHESIS 3: When social democratic parties adopt rightward positions on the sociocultural dimension, the greens gain the most vote share.
Lastly, drawing on Rathgeb and Wolkenstein’s (Reference Rathgeb and Wolkenstein2022) internal unity theory, adopting rightward positions on both dimensions will generate much greater internal dissent than a move on a single dimension, making social democratic parties look divided and incapable, which magnify the chances of internal splits and defection. Additionally, by adopting accommodation over values issues and by moving away from their economic roots with pro-market positions, social democrats can create a pronounced challenge of ideological consistency and credibility for themselves. Thus, according to internal unity theory, as well as the implementation of economic moderation combined with accommodation, social democrats will suffer detrimental impacts. These negative consequences are likely to outweigh the benefits of gaining new centrist or right leaning voters.
Consequently, according to spatial logic, party families traditionally to the left of the social democrats on both dimensions, stand to benefit under these conditions. Although the radical left focus on the economic dimension, their average positioning is to the left of the social democrats on both dimensions. Similarly, although the greens focus primarily on the second dimension, their average positioning is also to the left of the social democrats on both dimensions. In both cases, the gap between the social democrats and their rivals is much wider on each rival’s primary dimension, but nevertheless the radical left and the greens are on average to the left of social democrats on both dimensions when calculated since 1965 (see Appendix A2). Thus, it will be tested whether the radical left and or the greens, are the largest electoral benefactors from the adoption of twin-dimensional social democratic rightward positioning:
HYPOTHESIS 4a: When social democratic parties adopt rightward positions simultaneously on both dimensions, the radical left gain the most vote share.
HYPOTHESIS 4b: When social democratic parties adopt rightward positions simultaneously on both dimensions, the greens gain the most vote share.
Data and methods
To test these hypotheses, I draw on data from a variety of different sources at the individual, aggregate, and party levels. The hypotheses specifically apply to established democracies where party policy offerings are perceived to matter to voters. Hence, case selection is based on a country’s level of economic and democratic development, as well as having a long-standing history of a dominant social democratic party on the center-left of a party system.Footnote 1
Individual level
At the individual level, I rely on the CSES (2019, 2020)Footnote 2 because it provides the most reliable comparative election survey data and covers the key period of social democratic decline. The CSES provides survey responses to party voting in the most recent national election and in the previous election, which importantly allows for the analysis of vote switching, to determine where previous social democratic voters moved to. Since CSES Module 1 does not include retrospective voting, I rely exclusively on surveys from Modules 2–5, leaving a sample of 62 elections from 20 countries.
The main variable of interest is binary, measuring whether social democratic voters in the previous election deserted the party in the latest election. For the second set of estimations, the dependent variables measure whether a previous social democratic voter stayed with the party or whether they moved to another party or abstained. The variables are binary whereby social democrats = 0; and other families/abstention = 1. It should be noted that the reliability of accurate voter recall has been questioned, as it can lead to overestimations of stability,Footnote 3 ‘social desirability bias’, and significant numbers of respondents may recall their vote incorrectly, including a greater propensity for some demographics over others.Footnote 4 These issues are compounded when relying on recall from two elections prior, as this paper does. However, some key evidence finds little problem with voter recall. For example, a large-scale analysis of panel data in the Netherlands, found accuracy of roughly 90% in recall from elections three years prior (van Elsas et al., Reference van Elsas, Lubbe, van der Meer and van der Brug2014). Overall, measurement error in recall data has been shown cross-nationally to have a ‘rather limited impact on the validity of research findings’ (Dassonneville and Hooghe, Reference Dassonneville and Hooghe2017: 316).
Political ideology comprises the key independent variable and is measured on a 0–10 left–right scale. I include the standard sociodemographic controls that have been shown to be relevant predictors of party voting, such as age, education, gender, income, union status, and place of residence. Age is a continuous variable. Female, union status, and rural residence are binary dummy variables. Education is measured as a categorical variable ranging from 0 to 4, and income is measured in quintiles (both low to high).
Aggregate level
The dependent variable is the percentage of votes cast by the registered electorate for a party family. The six major party families are coded: radical left, mainstream left, green, liberal, conservative, radical right, as well as an ‘other’ category, which largely encompasses single-issue and regionalist parties such as the Scottish National Party (see Appendices A4–A5 for party list). Vote shares derive from ParlGov (Döring and Manow, Reference Doring and Manow2020) and families are coded according to ParlGov and cross-validated against the Comparative Manifesto Project (MARPOR) (Volkens et al., Reference Volkens, Burst, Krause, Lehmann, Matthieß, Merz, Regel, Weßels and Zehnter2020).Footnote 5
The key party position variables measure social democratic positions on the economic and sociocultural domains. Ideological scores are tabulated from the most popular data for the study of political manifestos – MARPOR, which offers reliable estimates correlating highly with expert and mass surveys (Benoit and Laver, Reference Benoit and Laver2006). It should be noted that its research validity has been questioned by some (see Laver, Reference Laver2014 for a review). However, the criticisms largely focus on inter-coder reliability, or the additive general Left-Right ‘RILE’ position measure, which this paper does not use. Instead, following Lowe et al. (Reference Lowe, Benoit, Mikhaylov and Laver2011), the left–right score of the parties is calculated by summing up the logged percentages of all the sentences in the left category and subtracting their total from the sum of the logged percentages of the sentences in the right category.Footnote 6 This method takes better account of the proportional changes on the left–right scale than the traditional Laver/Budge methodology. An SD economic position and SD culture position variable is then constructed based on this score involving the relevant categories (left–right from −100 to 100) of the historically largest by vote share party on the center-left, for each election. The economic (state-market) dimension involves 15 categories encompassing key aspects of the economy and the second dimension involves 17 sociocultural (progressive-conservative) categories, including: the environment, equality, internationalism, law and order, minorities, multiculturalism, nationalism, and traditional morality. Appendix A6 outlines the composition of each, which are the recommended indicators provided by MARPOR.Footnote 7
A variety of party system controls are included. To account for serial autocorrelation, I include a lagged dependent variable, which is the vote share in the previous election. The inclusion of a lagged dependent variable and fixed effects can potentially introduce bias into the estimates (Nickell, Reference Nickell1981). Therefore, the aggregate-level estimations are re-run excluding: 1) decade fixed effects; and 2) the lagged dependent variable. The main results hold for each specification (see Appendix A7). The position of the entire party system is controlled for, via unweighted mean economic position and mean culture position variables.Footnote 8 To account for the agency of challenger parties, the position of the largest party in each family is also included (family economic position and family culture position) when estimating a respective family’s vote share. I control for incumbency effects, which is a dummy incumbent variable coded as 1 when the mainstream left controls government. Turnout is added, as it has been found to be positively related to left party voting (Bartolini, Reference Bartolini2000). A measure of electoral disproportionality is also introduced via the Gallagher index, which is the difference between the percentage of votes and seats each party receives in an election and is positively related to left voting (Jusko, Reference Jusko2017).Footnote 9 Party system variables derive from MARPOR and the Comparative Political Data Set (CPDS) (Armingeon et al., Reference Armingeon, Engler and Leemann2019).
A wide range of socioeconomic controls are included. Union density, due to the substantial influence of unions in generating support for social democratic parties is added (Przeworski and Sprague, Reference Przeworski and Sprague1986; Rennwald and Pontusson, Reference Rennwald and Pontusson2021).Footnote 10 I control for the level of globalization, as it has been linked to the decline of social democracy’s working-class base (Gingrich and Häusermann, Reference Gingrich and Häusermann2015).Footnote 11 Income inequality and immigration have been linked with far-right voting (Han, Reference Han2016; Kriesi and Schulte-Cloos, Reference Kriesi and Schulte-Cloos2020). Therefore, the adjusted after-tax Gini Index,Footnote 12 and the foreigner share percentage are respectively added.Footnote 13 Key measures of the economy, such as GDP growth, unemployment, and government spending are also included from the CPDS.Footnote 14 To account for retrospective economic voting – as voters are typically backward looking with a memory of roughly one year when evaluating changes and impacts of the economy – economic variables are given a one-year lag (Lewis-Beck and Stegmaier, Reference Lewis-Beck and Stegmaier2013).
Descriptive trends
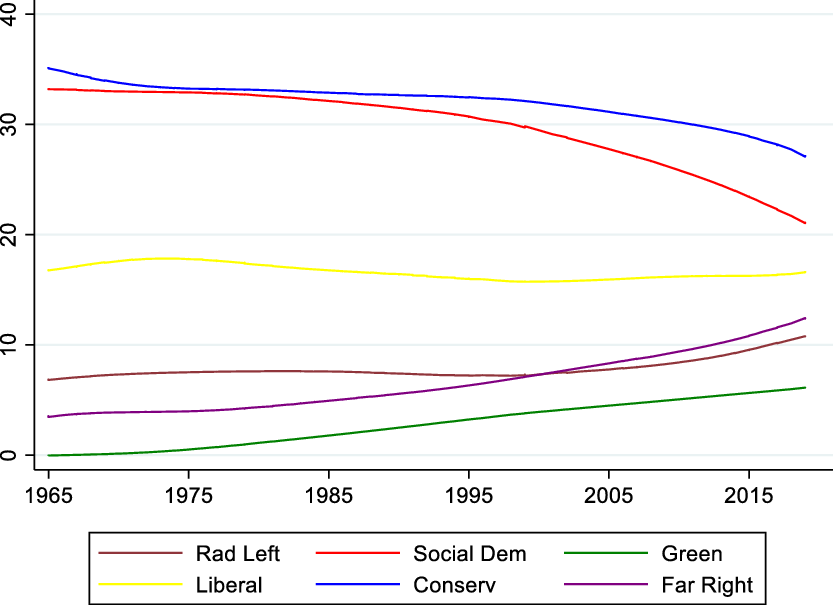
Firstly, party voting trends are compared. Figure 1 plots the locally weighted scatterplot smoothened average vote share of each party family since 1965, in the sample of 21 countries. Both mainstream party families have suffered declining vote shares from their average of roughly 33%, which has accelerated since the turn of the century. The social democrats have declined to a much greater extent, as the mainstream right’s share has declined roughly 5 percentage points, compared to roughly 11 percentage points for the mainstream left. The centrist liberal family has maintained a consistent level of 17–18%, while the three challenger party families (radical, greens, and far right) have substantially increased their vote shares over time, with the far right seeing the biggest increase.
Locally weighted scatterplot smoothened (LOWESS) mean party family vote shares, 1965–2019.
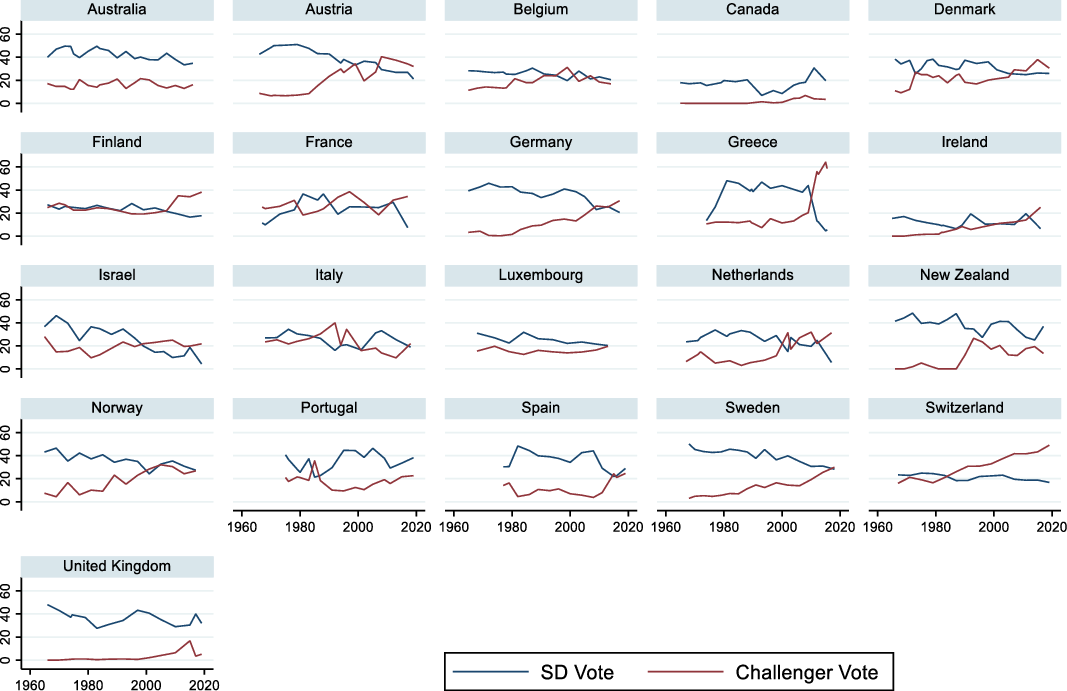
Notably, the combined vote share of the left-leaning social democratic, green, and radical left families has largely remained stable at around 40–45%, while social democratic parties have greatly lost vote share (Gingrich, Reference Gingrich2017). Hence, electoral decline is specific to social democratic parties, rather than being a crisis of ‘the Left’ overall. Figure 2 disaggregates this time trend by plotting the average social democratic vote compared to the combined challenger party vote. Combined, the three main challenger families have recently surpassed the social democrats in a majority of countries, having more than doubled their combined vote share over time.
Social democratic vs challenger families vote share by country, 1965–2019.
Furthermore, social democrats have moved rightward roughly 1 point on the left–right (0 to 100) scale over the entire period on each dimension, which is roughly one-third of a standard deviation for each (see Appendix A2). The party family has also been more right-wing on the economic than the sociocultural dimension, averaging roughly 4 points more when comparing trend lines. Lastly, comparing social democratic positioning on the economic dimension over time with the radical left (H2), shows that the radical left has moved leftward to fill some of the space vacated by social democrats. Whereas, comparing social democratic positioning on the sociocultural dimension with the greens (H3), shows them having moved rightward largely in unison over time.
Who’s abandoning the social democrats?
Utilizing the retrospective voting question that is available from 2001 onward in the CSES, I begin by analyzing who previous social democratic voters cast their ballot for in the most recent election. Firstly, social democrats retained 63.8% of their voters. This is 3.6% lower than the mainstream right and lower than the far right, but higher than the other families. Social democrats have higher rates of abstention (25.6%) than the greens and radical left but lower than the other families. They tend to lose voters to the parties closest to them ideologically, especially so when accounting for the relative sizes of the families.
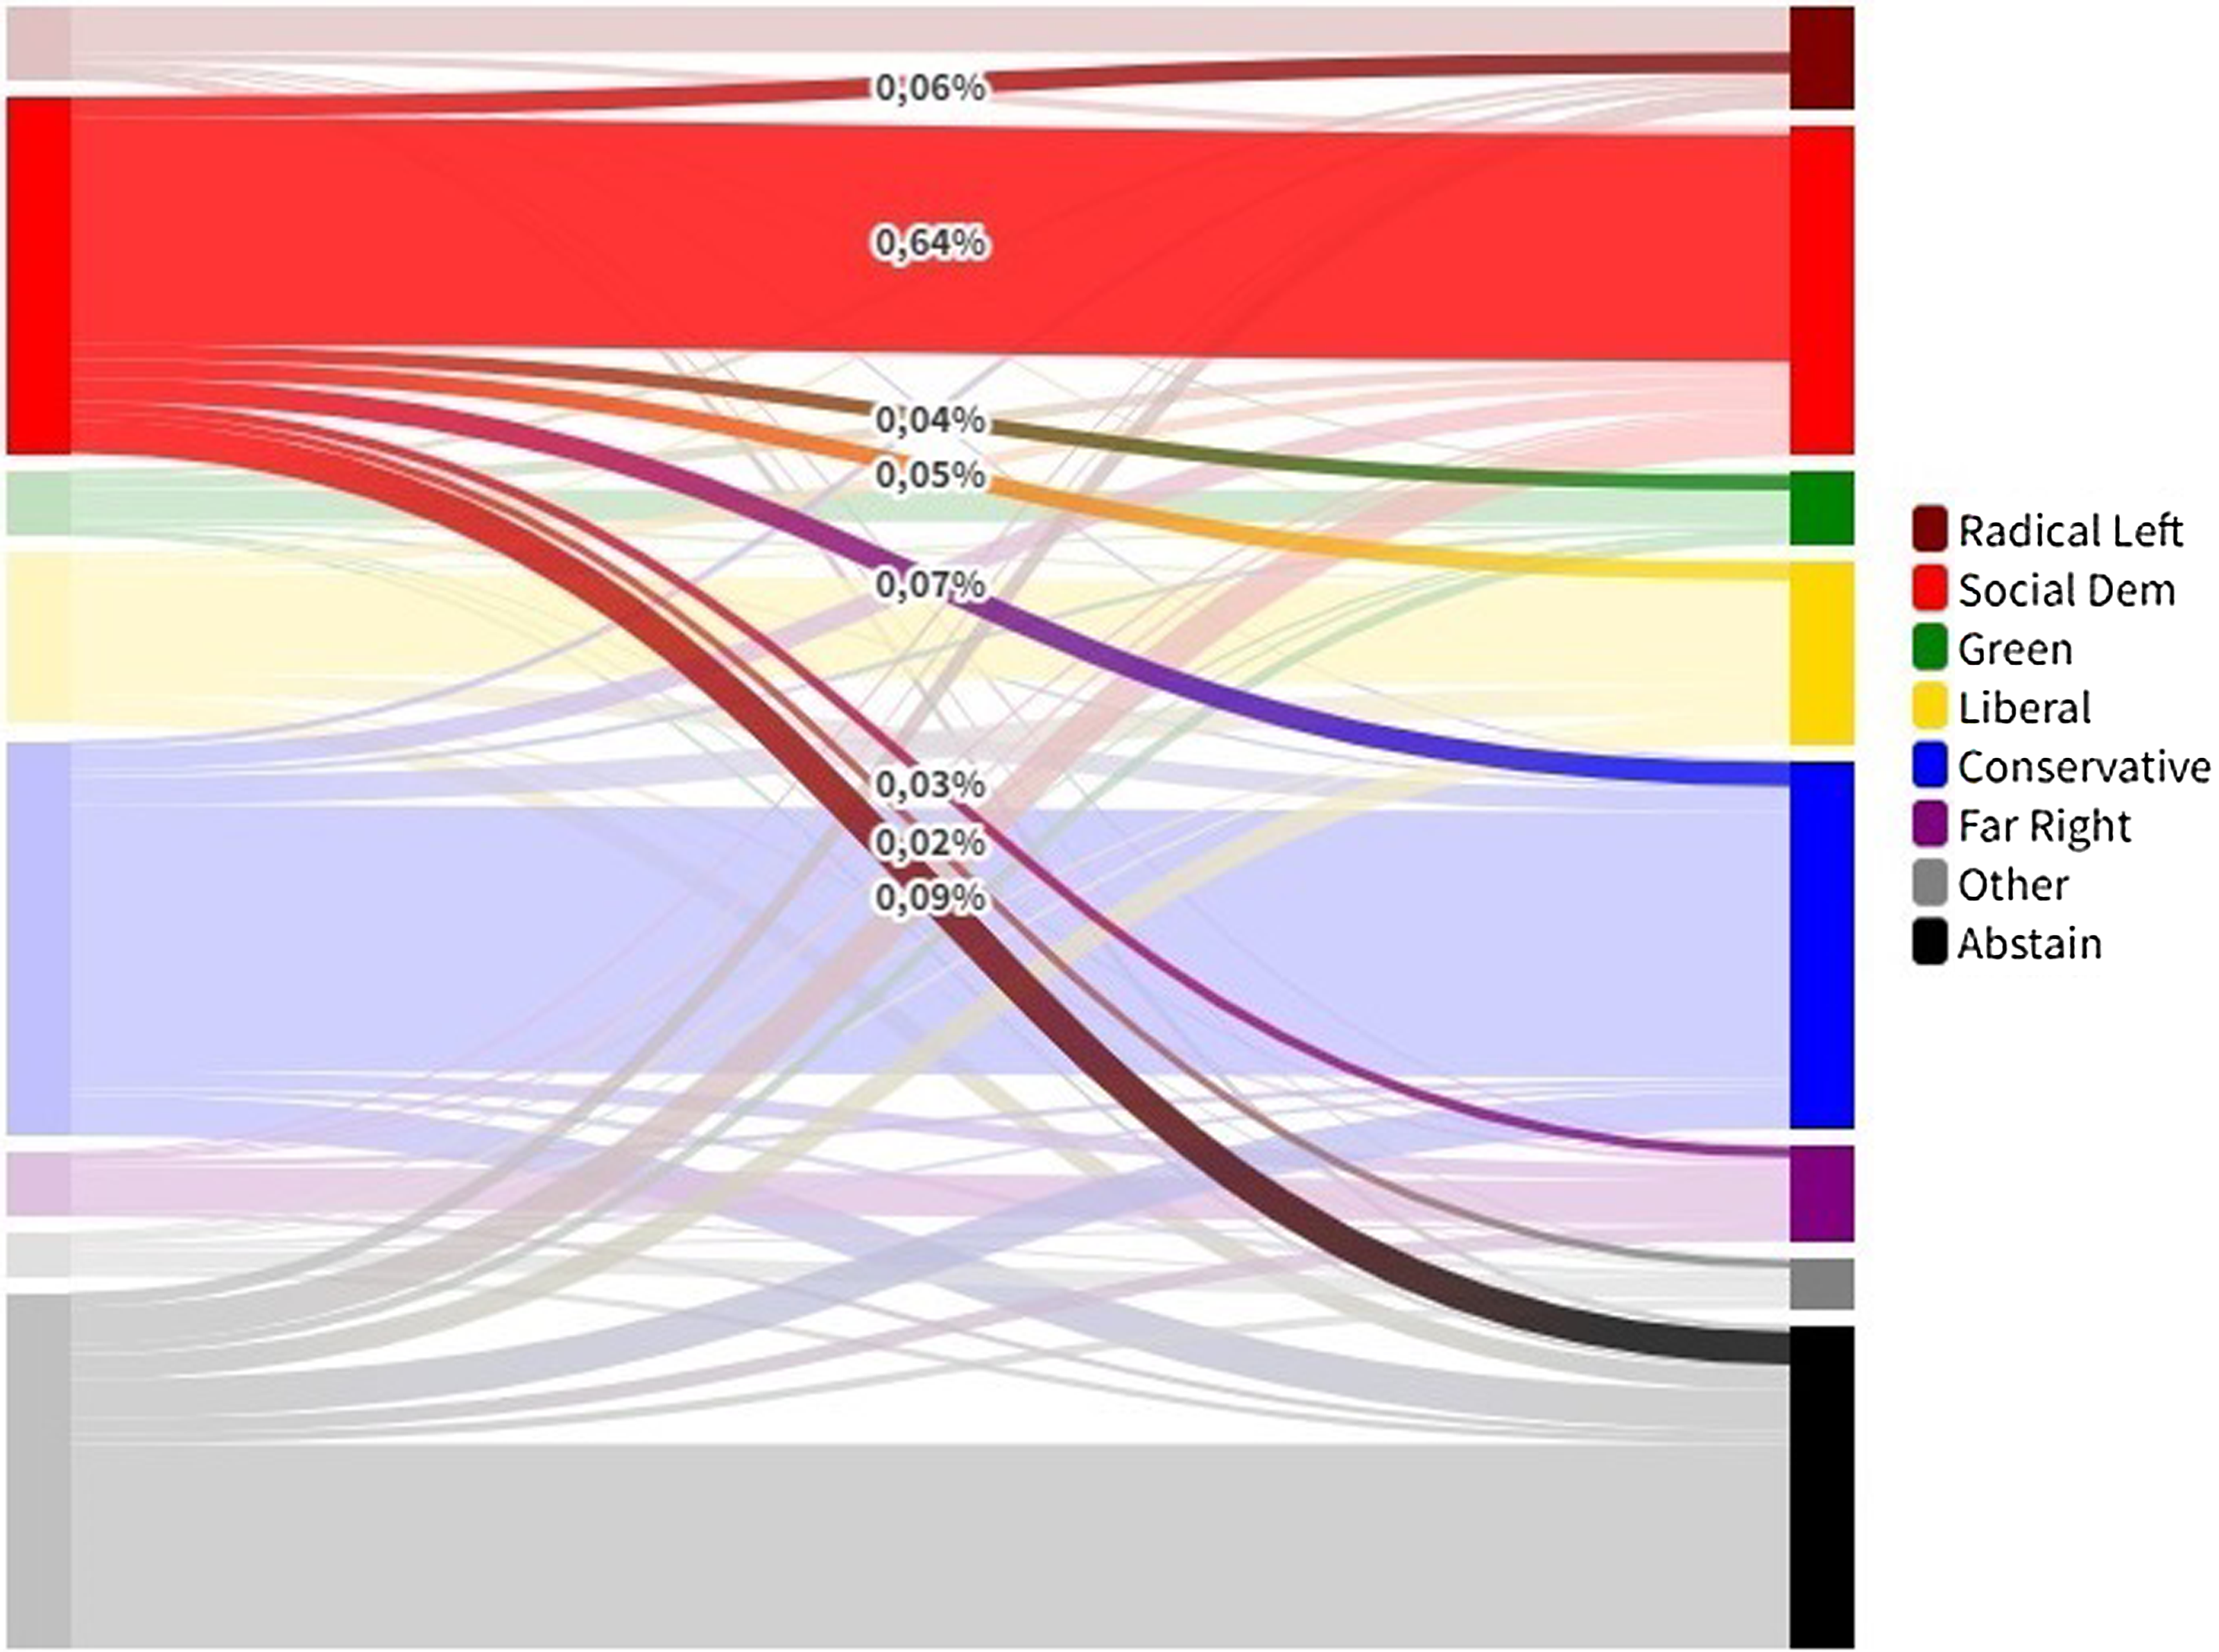
Figure 3 shows that although social democrats lost the greatest share of their previous supporters to the mainstream right (barely beating out the radical left), it is much lower proportionally to the overall vote share the mainstream right received in the sample (18.3% vs 29.3%), whereas radical left, liberal, and green party families attracted 41.6% of previous social democratic voters, despite having less than one-third of the overall vote share (32.7%). The far right does not gain many voters from the social democrats (roughly half compared to the radical left) and losses roughly match proportionally their overall totals. However, there is some evidence that many far-right voters first transition through the mainstream right from social democrats (Evans and Mellon, Reference Evans and Mellon2016). I explore this possibility further using Dutch panel data, but no evidence is found in this case (see Appendix 8).
Party vote switching with voter flow % away from social democrats spotlighted, 2001–2019.
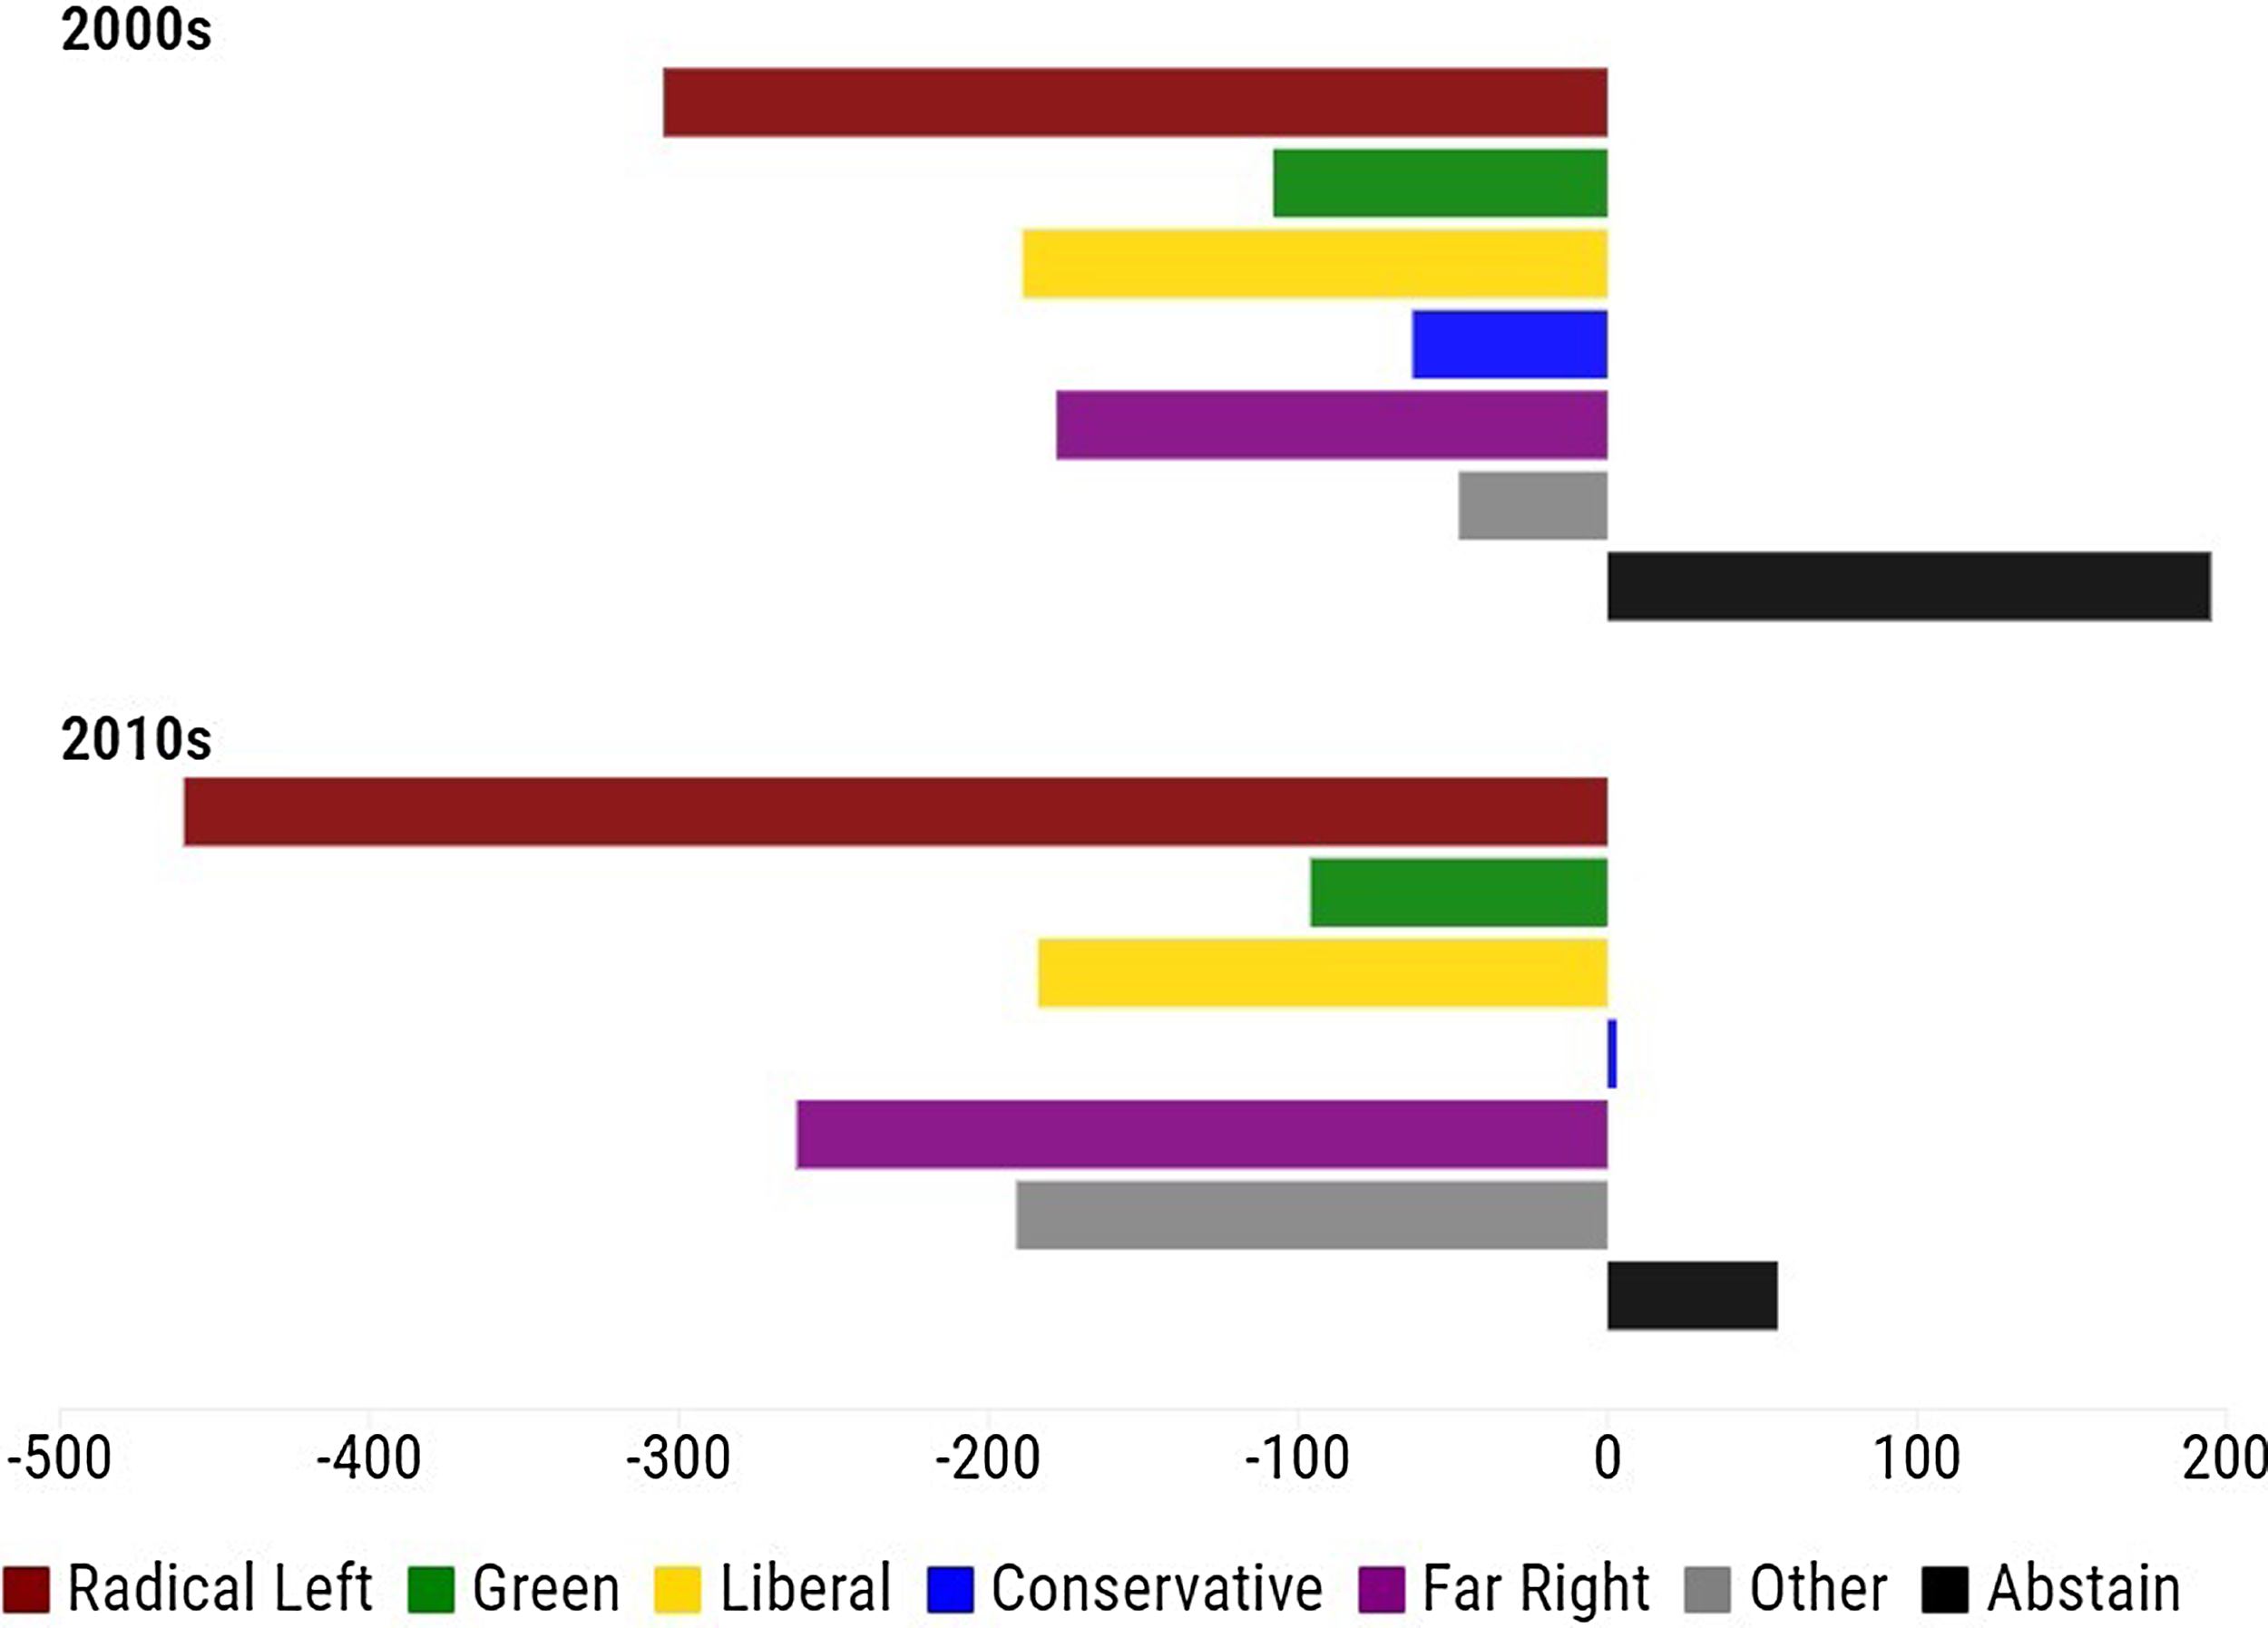
Turning to the time trends, by splitting our period evenly into two decades, we can determine a few notable findings. Social democrats have retained dramatically less voters in recent years, including 9.1 percentage points less in the 2010s, compared to the 2000s. The far right has increasingly lured social democratic voters away in the decade since the financial crisis, climbing nearly a third from 6.6% to 9.4%. When we examine the net overall flow to and from social democrats with the other party families, we can see in Figure 4 that they have lost more total voters than they have gained from every party family. They have lost the most to the radical left and they did so in both decades, but by a wider margin in the 2010s. Social democrats have lost the least number of voters to the mainstream right and in the 2010s they picked up a handful overall from them. In the 2000s, they lost voters roughly equally to the liberals, and far right, but in the 2010s they increasingly lost out to the far right, and less so to the greens. Although it should be noted that the far right is the newest party family in most countries, so the potential for net gains is reduced, while at the same time increased for net losses from this family. Social democrats were also more likely to gain abstainers, than to lose voters to abstention (hence the net positive ratings in the right-hand column), although at a substantially reduced rate in the 2010s. However, all the families, except the conservatives, gained more abstainers than they lost to abstention. Disaggregating net gains/losses by region, reveals that radical left gains are largely restricted to Central Europe and the Mediterranean regions, while the far right has gained in all regions (see Appendix 9). These descriptive insights show that the social democrats are facing increasing competition from challenger parties, most especially on their left flank. In the following, I empirically test the role that party programmatic shifts play in social democratic party competition.
Social Democratic raw vote switching net loss (left) and net gain (right) totals to other party families and abstainment, 2001–2019.
Next, I investigate what kinds of social democratic voters are abandoning the party family, followed by the impact of social democratic policy positions on voters leaving. This set of analyses estimates party switching at the individual level, by first limiting the sample to respondents who specified voting for the social democrats in the previous election. We can then see who left the party and under what policy conditions. The CSES data contains individuals nested within countries over time, therefore, multilevel mixed-effects models are estimated, which include both fixed and random effects. This is owing to the small number of elections per country or year in the CSES required to identify election-level variance. Since it is unsuitable to include random effects for both levels, observations are clustered at the year-level to isolate the potential effects of time-specific factors on voting, with country fixed effects, since the hypotheses primarily rely on changes over time (Park, Reference Park2019). Due to the minimum degrees of freedom needed for the higher level in multilevel models, only the controls that were significant for any one party at the aggregate level are included (Bryan and Jenkins, Reference Bryan and Jenkins2016).
Table 1 presents the results from multilevel mixed effects logistic regressions clustered by country, with year fixed effects. Whereby voting social democrat = 0; and voting for another party or abstention = 1. Model 1 is a baseline with each of the individual-level controls. Model 2 introduces the aggregate-level variables and Model 3 includes an interaction between the two key social democratic policy variables.
Individual-Level logistic mixed-effects regression results predicting social democratic voters leaving the party
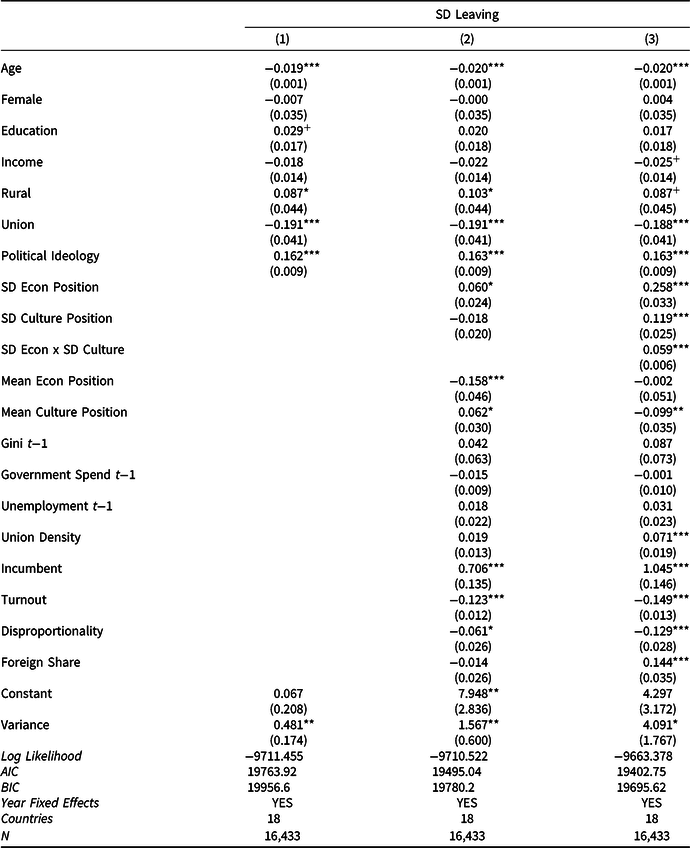
+P < 0.10, *P < 0.05, **P < 0.01, ***P < 0.001.
We still lack evidence as to what kinds of voters are abandoning the social democrats and Model 1 reveals that the young, non-union members, and right-leaning social democratic voters are significantly more likely to abandon the party at (P < 0.001). Rural, lower income, younger, and highly educated social democrats also have a greater propensity to leave. The aggregate-level variables are introduced in Model 2 to test whether social democrats are more likely to abandon the party, if the party adopts rightward positions on either the economic (H1a), or sociocultural dimension (H1b). When turnout is lower, social democrats are in power, or when the party system is economically left-wing, then social democratic voters are significantly likely to leave at (P < 0.001). Social democratic voters are more likely to stay if the party adopts rightward cultural positions, although the effect size is small. Most importantly, when social democrats adopt rightward positions on the economic dimension, their voters are significantly more likely to leave at (P < 0.05). Thus, we find no support for (H1b), but some support for (H1a).
Model 3 tests for Hypothesis 1c – that social democrats are more likely to abandon the party if it adopts rightward positions on both dimensions simultaneously – via an interaction between SD economic position and SD culture position. The interaction is positive and statistically significant at (P < 0.001) (see Appendix A10 for average marginal effects). Thus, although the magnitude is not strong, I find support for (H1c).
Notably, the effects differ temporally. The sign flips for education post-2009, as lower educated social democrats are increasingly leaving the party (see Appendix A9). The interaction is also negative but nonsignificant in the first decade and SD economic position has limited effect in Model 2. This suggests that social democratic economic moderation has been most detrimental in the aftermath of the financial crisis, especially among the less educated.
Where are social democrats migrating?
Individual-level estimations
Next, we probe the individual-level determinants of former social democratic voters and examine where they moved to. Therefore, I undertake binomial logistic regressions with two-way fixed effects for country and year. I do so for each party family, as well as for abstention, versus the social democrats. Whereby social democrats = 0; and other families/abstention = 1. The results are presented in Table 2 below. A robustness check is performed using multinomial logit, with very similar results (see Appendix A11).
Individual-Level logistic regression results predicting social democratic voters recent party family voting
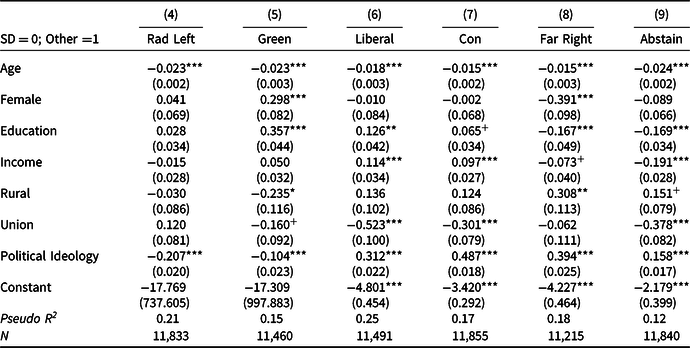
+P < 0.10, *P < 0.05, **P < 0.01, ***P < 0.001.
Notably, social democrats are significantly (P < 0.001) losing their younger voters to every party family, as well as to abstention. Although, all party families significantly lose voters to abstention in the sample and all families struggle with retaining their younger voters, except the greens. However, the coefficient is highest for the social democrats (see Appendix A12). Thus, the failure to retain younger voters likely has negative ramifications for the party family going forward, as generational replacement takes hold. As expected, social democrats are maintaining strong support with union members and only have a small likelihood of losing them to one party – the radical left.
Social democrats have a significantly high propensity of losing their female voters to the greens, and a roughly equal propensity of losing their male voters to the far right. The greens also have a high propensity of attaining highly educated and urban social democratic voters. Social democrats are also significantly losing their rural, less educated, and lower income voters to the far right and abstention, while they tend to do less well with their urban, higher income, and educated voters, versus the liberals and conservatives. The rural results complement the earlier finding that rural social democratic voters are significantly abandoning the family, and it appears that they are overwhelmingly moving to the far right. France’s recent gilets jaunes movement provides an illustrative example.
Turning to political ideology, conservatives and the far right are the party families gaining the most right-leaning social democratic voters. Leftist social democrats have a high propensity for abandoning the family to both the radical left and greens, as political ideology is negative and statistically significant at (P < 0.001), although the effect is nearly twice as strong for the radical left, while social democrats are losing their right-leaning voters to other parties and abstention. Given that social democratic voters average 3.95 (sample average 5.15) on the 0–10 ideology scale, and over 58% identify as left-wing (0–4), the earlier evidence for (H1) – that the party family is substantially losing voters due to rightward policy positions – likely provides an important explanation as to why the radical left is significantly benefitting electorally.Footnote 15 The radical left model also has the second highest explanatory power (R 2 = 0.21) and beyond age, political ideology is the only statistically significant variable, whereas nearly all variables are significant for each of the other party family models. This lends further support to the key role that ideology and policy moderation is likely to be playing in the migration of social democratic voters. Although it appears that social democrats are losing different kinds of voters to different parties, in line with recent research, I find that the radical left tends to benefit the most when the family adopts rightward economic positions (Schwander and Manow, Reference Schwander and Manow2017; Bischof and Kurer, Reference Bischof, Kurer, Kitschelt and Häusermann2023; Polk and Karreth, Reference Polk, Karreth, Kitschelt and Häusermann2023). In the next section, I delve further into the benefactors of social democratic decline, by undertaking aggregate-level analysis.
Aggregate-level estimations
In a second deeper test of hypotheses (H2)–(H4), I rely on time-series cross-sectional aggregate-level data for 21 advanced democracies, from 1965 to 2019. I use this sample since the temporal range of our hypotheses rely on both the period of social democratic decline, which Figure 1 showed started in the 1990s, as well as the period of the party family’s ideational transformation toward the market, which began in the 1980s (Mudge, Reference Mudge2018).
I estimate using ordinary least squares (OLS) and country-level fixed effects with robust standard errors to ensure that unobserved differences between countries do not bias the findings (Green et al., Reference Green, Kim and Yoon2001) and because the hypotheses focus primarily on intra-country overtime variation in the dependent variables, rather than cross-sectional variation. By deriving estimates from variation within the same countries, a wide range of unobservables that vary across countries but do not change much (such as institutions), is also controlled for. Additionally, to ensure consistency of results temporally, decade fixed effects are estimated. Table 3 presents the aggregate vote share results for each party family with full controls.Footnote 16 The radical left model has by far the highest explanatory power (R 2 = 0.65). Few of the controls are significant, except for the radical left and social democratic models.
Aggregate-level OLS regression results predicting party family vote shares
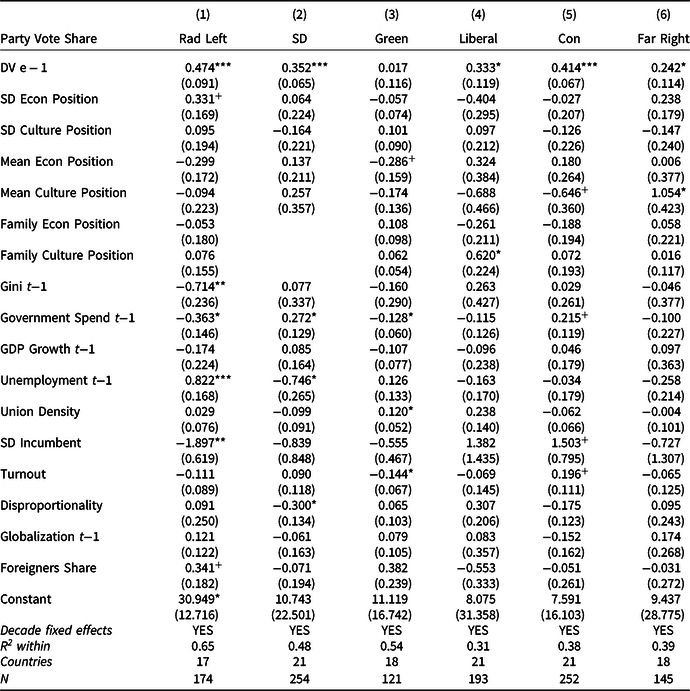
+P < 0.10, *P < 0.05, **P < 0.01, ***P < 0.001.
The second hypothesis tests whether the radical left benefit from the adoption of rightward social democratic economic positions. Here we find some support for (H2), as the radical left significantly gain vote share when social democrats adopt economically rightward positions at (P < 0.1) (see Appendix A13 for marginal effects). However, they only reach statistical significance in the post-2000 era (see Appendix 14). The liberals substantially lose vote share as their issue space gets crowded, and social democrats, greens, and conservatives see little effect. While the far right gain vote share, it is to a lower extent than the radical left and nonsignificant. Overall, the policy offering results are largely in line with spatial logic and when the social democratic policy variables are interacted, we see more substantial effects.
The third hypothesis tests whether it is the greens who benefit most from the adoption of rightward social democratic cultural positions. Here we find little support for (H3). The greens do gain votes on their more salient second dimension from this strategy, but the effect size is minor and even smaller than the radical left and liberals. Social democrats, conservatives, and the far right, lose votes from social democratic rightward positioning on the second dimension by roughly equal amounts.
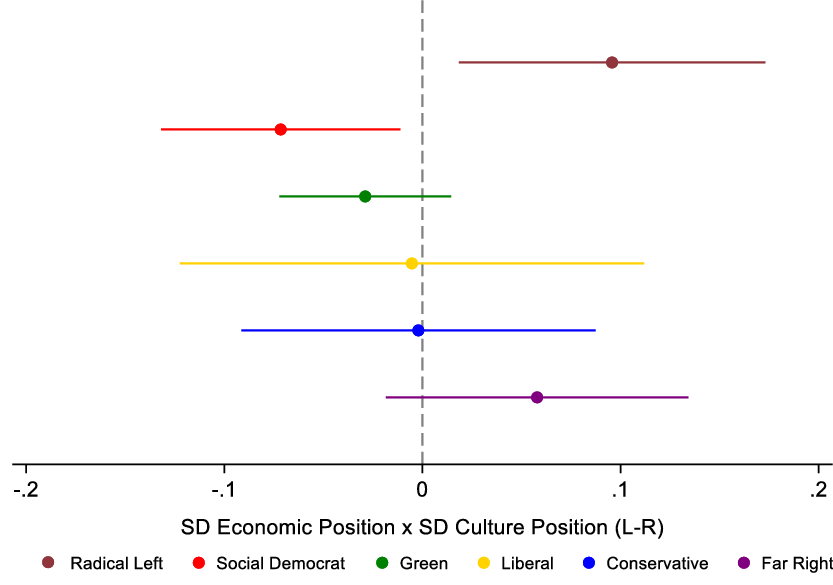
To test the fourth hypothesis – that a) radical left parties; or b) green parties benefit from the adoption of rightward social democratic positions on both dimensions – an interaction is estimated between SD economic position x SD culture position for each party family based on Table 3. Figure 5 presents the average marginal effect of the interaction for each family (see Table A15 for full results). The social democrats significantly lose vote share when they adopt rightward positions on both dimensions. The greens also lose vote share, while the liberals and conservatives see effects next to zero. The benefactors are the far left and right, but the interaction is stronger, and only statistically significant for the far left. Although the effect is stronger for the far right post-2000, it remains significant for the radical left throughout. Fittingly, it appears that a roughly equal transfer of votes from the social democrats to the radical left occurs from simultaneous social democratic rightward positioning on the two dimensions, as the coefficients for each are roughly equal in size (see Figure A15 for marginal effects). Thus, we find support for (H4a) but not (H4b).
Average marginal effects of SD culture position by SD economic position on party family vote shares with 95% C.I. Based on interactions from Appendix Table A15.
The findings are not driven by any one country, as they remain highly stable to a jackknife analysis, whereby one country is excluded at a time (see Appendix A16). However, there is some regional variation, as when either the Anglosphere or Mediterranean regions are excluded, SD economic position fails to reach statistical significance for the radical left, but the interactions remain significant (see Appendix A9).
Conclusion
Social democratic parties have experienced substantial electoral decline in recent years, which has often been attributed to the rightward movement of their policies (Karreth et al., Reference Karreth, Polk and Allen2012; Arndt, Reference Arndt2013; Schwander and Manow, Reference Schwander and Manow2017; Horn, Reference Horn2020; Loxbo et al., Reference Loxbo, Hinnfors, Hagevi, Blombäck and Demker2021; Polacko, Reference Polacko2022; Snegovaya, Reference Snegovaya2022). This paper advances this work by investigating how the party supply side of electoral politics has impacted social democratic decline, to ascertain who benefits from this development. Based on aggregate-level election results and CSES data for 21 countries between 1965 and 2019 and through application of the spatial theory of party competition (Downs, Reference Downs1957) and accommodation theory (Meguid, Reference Meguid2005), I find that the radical left significantly benefits from the adoption of rightward social democratic economic positions, which is magnified when combined with rightward sociocultural positions. This predominantly occurs because left-leaning voters migrate over to the radical left.
The first set of results suggest that a variety of voters are abandoning the social democrats, most especially the young. This finding likely has long-term detrimental consequences for the sustainability of the party family. Younger voters are consistently in favor of more leftist policies on both dimensions, and they are still being socialized in their partisan identifications. Hence, social democrats are at risk of permanently losing a large portion of the newly emerging politicized generation. I also find that when the party family adopts rightward positions on the economic dimension, they suffer a significantly higher propensity of losing voters in recent years. However, when they adopt rightward positions simultaneously on both dimensions, the effect is magnified.
The second set of results suggest that social democrats are facing increasing competition from challenger parties. They are particularly losing low socioeconomic status and rural voters, who are significantly deserting the party for the far right and abstention. They are also losing their right-leaning voters to the conservatives and far right, while left-leaning voters are substantially deserting the party to the greens, and most especially to the radical left. Since the majority of social democratic voters are left leaning, the sheer scale generates a significant influx into the radical left, which likely accounts for much of the recent success of Podemos (Spain), Sinn Féin (Ireland), and Syriza (Greece). Thus, in line with spatial logic, the combined results from the retrospective voting analysis reveal that social democrats significantly lose leftist voters to the radical left when they adopt rightward positions on the economic dimension, which is magnified when combined with equivalent positioning on the sociocultural dimension.
The aggregate-level results suggest that challenger parties stand to see some gain from worsening economic conditions, but this is outweighed by the impact from party positioning. Social democratic rightward economic positions are associated with increased electoral support for the radical left, which is again magnified when combined with sociocultural rightward positions. This dynamic does not appear to be at work when social democrats attempt accommodation on the sociocultural dimension, as they do not significantly lose voters, or vote share, and there does not appear to be any specific benefactors.
Overall, the findings provide notable ramifications for party strategy and party competition and contribute to explanations for the rise of challenger parties, at the expense of mainstream parties (Hobolt and Tilley, Reference Hobolt and Tilley2016; De Vries and Hobolt, Reference De Vries and Hobolt2020). Equality was a founding principle of social democracy, whereby support for the welfare state was for the longest time fundamental to the social democratic brand (Bartolini, Reference Bartolini2000; Mudge, Reference Mudge2018). However, it appears that moderation has led to brand dilution for the party family and is likely reducing their credibility in the eyes of many voters. Third Way rebranding created an opportunity for challenger parties on both the left and far right to attract social democratic voters, although it appears the radical left has since benefitted the most, especially in southern Europe. The gains received from this strategy increasingly do not appear to be compensating for the losses inflicted from the policy positioning long-term, which is likely contributing to the party family’s decline. These results challenge the prominent median voter theory (Meltzer and Richard, Reference Meltzer and Richard1981) that centrist positions tend to be most electorally beneficial for parties because the majority of voters are located around the center. They also challenge the standard narrative that the far right has predominantly gained at the expense of the social democrats.
The findings beg asking the question, so what are social democrats to do? Different strategies come with trade-offs, as attempts to appeal to new voters can potentially alienate old ones. A return to traditional leftist policies of the postwar golden age of social democracy via a strengthening of the welfare state and reversal of neoliberalism, seems the optimal strategy. Pursuing this strategy, while assigning reduced saliency to the sociocultural dimension, which the right often exploits, allows social democrats to capitalize on their traditional brand that they have neglected – the promotion of equality, labor issues, and the welfare state. Supermajorities across the West are in favor of greater redistribution and higher taxes on the rich and corporations, which can be used to rebuild atrophying welfare states and public services (OECD, 2019). The saliency of these issues is also likely to only increase while the cost-of-living crisis and income inequality increase. This strategy would very likely appeal to the many voters that have abandoned the party to the radical left and would target key demographic groups that have been deserting the party – such as females, the young, and socioeconomic status individuals. A potential trade-off of this approach is that it would repel anti-redistribution and socially conservative voters, although they comprise dwindling portions of the electorate, a small share of the party family’s constituency, and have been shown to be unlikely to vote for social democrats anyway, given the consistently strong appeals from the right on these issues.
Last, this study does carry important limitations. Of note is the absence of a direct measure of issue salience. Unfortunately, saliency measures are not available cross-nationally long-term, and their absence is a potential confounder in the party supply–voter demand relationship. The study also uncovers some important regional differences, whereby results are in part driven by the Mediterranean, which could be unpacked further in future research. Moreover, the CSES only provides retrospective voting for one prior election. Therefore, future research may better examine the long-term consequences from party moderation over multiple elections. The recent expansion of panel surveys in many western countries, likely provides a fruitful path forward here for party scholars.
Supplementary material
To view supplementary material for this article, please visit https://doi.org/10.1017/S1755773923000115.
Acknowledgments
I would like to thank Oliver Heath and Kaat Smets for very valuable advice and comments as well as two anonymous reviewers who helped substantially improve the paper. Earlier versions of this paper have also benefited from the advice and comments of Florian Foos, Chris Hanretty, Jonathan Hopkin, Nick Martin, Chris Prosser, Armin Schafer, and Mathias Tromborg. Versions of the paper were presented at the 2021 Elections, Public Opinion and Parties (EPOP) Annual Conference at Queen Mary University in London, the 2021 ECPR Political Parties Summer School in Aarhus, Denmark, and the 2021 Political Science Association (PSA) Annual Conference at Queen’s University Belfast, in Northern Ireland.


 Open access