




Introduction
Plantain (Musa accuminata x Musa balbisiana) is an essential staple food in West and Central African households (Adheka et al., Reference Adheka, Dhed’a, Karamura, Blomme, Swennen and De Langhe2018). Fruits of many plantain varieties produced, harvested and marketed under highly variable conditions and are used in many traditional dishes (Dury et al., Reference Dury, Bricas, Tchango Tchango, Bikoï, Picq, Fouré and Frison1998). The variety is a major factor in plantain consumption patterns, particularly because it impacts the cropping, harvesting, transport, marketing and fruit processing conditions (Dury et al., Reference Dury, Bricas, Tchango Tchango, Temple and Bikoï2002).
A highly diverse range of plantain varieties are cropped in West and Central Africa (Adheka Giria, Reference Adheka Giria2014). At least three different plantain varieties generally grow on the same field (Hauser and Amougou, Reference Hauser, Amougou, Dubois, Hauser, Staver and Coyne2010; Devos and Wilson, Reference Devos and Wilson1979; Yao, Reference Yao1988; Achard and Sama Lang, Reference Achard, Sama Lang, Picq, Fouré and Frison1998; Selatsa et al., Reference Selatsa, Tenkouano, Njukwe, Iroume and Bramel2009). At the national territorial scale, several dozen varieties have been identified in assessment surveys (Odah et al., Reference Odah, Aziadekey, Tozo, Akpavi, Koukouma, Guelly, Kokou, Assignon, Akogo, Aidam, Akpagana, Kenny, Ait-Oubahou, Zinsou and Gbeassor2013; Oppong et al., Reference Oppong, Banful, Anno and Moses2004; Banful, Reference Banful, Picq, Fouré and Frison1998; Adheka et al., Reference Adheka, Dhed’a, Sivirihauma, Karamura, Langhe, Swennen and Blomme2013; Hauser and Amougou, Reference Hauser, Amougou, Dubois, Hauser, Staver and Coyne2010), which suggests that more than 150 plantain varieties are grown in West and Central Africa (Adheka Giria, Reference Adheka Giria2014). This varietal diversity has been morphologically characterised according to botanical features and agronomic traits (IPGRI-INIBAP/CIRAD, 1996). The catalogue of Musa germplasm, West and Central African plantains (Ibobondji Kapu et al., Reference Ibobondji Kapu, Newilah Ngoh, Tomekpe, Ruas, Chase and Roux2018) compiles morphological descriptions of 130 plantain varieties preserved in vivo in the African Center for Banana and Plantain Research (CARBAP) collection. The plantain group includes many morphological variations (inflorescence structure, pseudostem height and circumference, leaf shape, pseudostem colour, bunch structure, pulp colour and fruit apex shape, etc.), probably resulting from successive plant mutations (Tezenas du Montcel, Reference Tezenas du Montcel1983; De Langhe, Reference De Langhe1961). The main variation concerns inflorescence degeneration (Swennen et al., Reference Swennen, Vuylsteke and Ortiz1995), which affects the bunch structure (hand number, fruit number and size). This is the basis of the conventional morphotaxonomic classification of plantains (De Langhe et al., Reference De Langhe, Pillay, Tenkouano and Swennen2005), which distinguishes four subgroups (or so-called ‘types’) of varieties (Tezenas du Montcel et al., Reference Tezenas du Montcel, De Langhe and Swennen1983; De Langhe, Reference De Langhe1961): French, French Horn, False Horn and True Horn, respectively, in order of the most marked inflorescence degeneration, alongside a gradual decrease in the number of fruits per bunch. Pseudostem size, as defined by the number of leaves emitted before flowering, is another morphological variation used in the classification of all banana plants: it distinguishes giant varieties (> 40 leaves emitted), medium varieties (32 to < 38 leaves emitted) and small varieties (< 30 leaves emitted) (Tezenas du Montcel, Reference Tezenas du Montcel1983).
This morphotaxonomic classification helps rank varieties within the existing morphological diversity. It provides some information on yield potential (weight of bunches, cycle length, etc.), but only within the framework of a collection of plantains (specific design with low density, specific cultural practices, no repetition, etc.). Furthermore, it does not provide enough information on the response of a given variety to the various stresses linked to cropping conditions and/or pests. We define agronomic potential as the ability of a plant to produce fruit and respond to biotic and abiotic constraints and the usage potential as the market suitability of the fruits and their ability to be transformed by different processes. A farmer needs to know the agronomic and usage potential of existing varieties so as to be able to choose the most suitable varieties for his/her production system. Could the morphotaxonomic subgroup of a plantain variety be a good indicator to its agronomic and usage potential? Tezenas du Montcel et al. (Reference Tezenas du Montcel, De Langhe and Swennen1983) claimed that giant and medium French and False Horn varieties were favoured for their plant morphology and productivity features, as further supported by many field observations (Banful, Reference Banful, Picq, Fouré and Frison1998; Hauser and Amougou, Reference Hauser, Amougou, Dubois, Hauser, Staver and Coyne2010; Schill et al., Reference Schill, Afreh Nuamah, Gold and Green2000). Yet the factors underlying these varietal choices, which are hypothesised as being linked with the relationship between the morphology of the different plantain varieties and their agronomic and usage potential, have to be explored. Some authors have compared traditional plantain varieties of different morphotaxonomic subgroups (usually French vs. False Horn) to assess differences in yield potential (Lama et al., Reference Lama, Sidibe and Barry1993; Melin et al., Reference Melin, Plaud and Hugues1976), responses to cropping conditions (Sibide et al., Reference Sibide, Ontsougou, Traore, Keita and Sanogo2006) or susceptibility to diseases and/or pests (Kosma et al., Reference Kosma, Zachee, Begoude, Hoopen, Kuate and Akoa2012; Fouré et al., Reference Fouré, Mouliom Péfoura and Mourichon1990), whereas they have not explicitly compared the morphotaxonomic subgroups. Other authors have also focused on plantain varietal diversity with the aim of classifying varieties and gaining insight into the underlying mutations, yet without specifically linking them to the agronomic and usage potential (Agoreyo et al., Reference Agoreyo, Golden and Brown2008; De Langhe et al., Reference De Langhe, Pillay, Tenkouano and Swennen2005; Noyer et al., Reference Noyer, Causse, Tomekpe, Bouet and Baurens2005; Ude et al., Reference Ude, Pillay, Ogundiwin and Tenkouano2003).
The aim of this study was to propose a new way to describe a panel of plantain varieties, based on their agronomic and usage potential. We assume that the agronomic and usage potential could be described on the basis on few traits, that is, so-called ‘agronomic traits’ (Litrico and Violle, Reference Litrico and Violle2015) regarding the plantain morphology at flowering, leaf area at flowering and harvesting, and bunch features, measured in non-limiting growth conditions. We also assume that i) the agronomic potential could be reflected by the potential production and the response to biotic and abiotic stress, and ii) the usage potential could be reflected by plantain market value indicators extrapolated from the literature. Such a description would enable to compare varieties and choose the most appropriated ones. We sought answers to the following questions: (1) How do agronomic traits vary within and between plantain varieties? (2) Can groups of plantain varieties be identified on the basis of their agronomic traits? If so, are these groups identical to the morphotaxonomic subgroups? and (3) How could the agronomic and usage potential of a range of plantain varieties be compared to support farmers in making varietal choices? We described a panel of nine plantain varieties cultivated in Cameroon and belonging to different subgroups from plantain morphotaxonomic classification, including plantain-like hybrids. We measured and analysed agronomic traits descriptive of plantain morphology at flowering, leaf area at flowering and harvest, and bunches of a panel of nine plantain varieties belonging to different subgroups from the plantain morphotaxonomic classification, including plantain-like hybrids. Finally, we propose indicators of the agronomic and usage potential – calculated on the basis of these agronomic traits – to compare the studied varieties.
Materials & Methods
Plant material and experimental design
An experiment was carried out to describe nine plantain varieties (Table 1). Five traditional triploid plantain varieties commonly grown in Cameroon (Daniels et al., Reference Daniels, Jenny, Karamura and Tomekpe2001) were selected: one giant and one medium variety of the French subgroup (Essong and French Clair, respectively), one medium variety of the French Horn subgroup (Batard), and two medium varieties of the False Horn subgroup (Big Ebanga and Mbouroukou n°3). Four tetraploid plantain-like hybrid varieties were added to the panel: (i) CRBP39, D248 and D535 hybrids from the CARBAP-CIRAD collaborative varietal improvement programme, and (ii) the FHIA21 hybrid from the Fundación Hondureña de Investigación Agrícola (FHIA) improvement programme (Shaibu et al., Reference Shaibu, Maji and Ogburia2012; Hauser, Reference Hauser, Dubois, Hauser, Staver and Coyne2010; Baiyeri et al., Reference Baiyeri, Mbah and Tenkouano2000) which was chosen because of its high prevalence in plantain-based cropping systems in Africa (Angbo-Kouakou et al., Reference Angbo-Kouakou, Temple, Mathé and Assemien2016). These varieties provided a representative panel of the morphological diversity that prevails within plantain varieties, with the exception of the True Horn subgroup, which was not studied because of the low prevalence of cultivated varieties of this subgroup in plantain-based cropping systems, explained particularly by their very low number of fruits per bunch (Tezenas du Montcel, Reference Tezenas du Montcel1983).
Description of the studied varieties and name abbreviations

The experiment (see complete description in Dépigny et al. (Reference Dépigny, Tchotang, Talla, Fofack, Essomé, Ebongué, Kengni and Lescot2018)) was carried out at the CARBAP agricultural research station in Njombé (Littoral province, Cameroon) (4°34’N, 9°38’E, 79 m a.s.l.) from June 2009 to December 2010. A brown andosol derived from a volcanic plateau prevailed under humid-topical climatic conditions with an 8-month rainy season. A 3000 m2 experimental field that had been followed for 1 year prior to the study was used. Nine plants of each variety were planted in five elementary plots of 48 m² (i.e. 45 plants/variety) randomly located in the experimental field at a planting density of 1667 plants/ha. The plantain seedlings used in the experiment were produced by the macropropagation technique which is a pathogen-free in vivo multiplication method (Kwa, Reference Kwa2003). All plants were grown in non-limiting cropping conditions to enable them to express their production potential. These non-limiting cropping conditions were achieved by supplying mineral nutrients (twice a month to reach 270 g nitrogen (450 kg/ha), 140 g phosphorus (233 kg/ha), 900 g potassium (1500 kg/ha), 400 g calcium (666 kg/ha), 300 g magnesium (500 kg/ha) and 100 g sulphur (167 kg/ha) per plant and per crop cycle) and irrigation (every 2 days during the dry season), while also controlling weeds (both manual weeding and herbicide (glyphosate) applications), pests and diseases (nematicide (ethoprophos) treatments, both pheromone traps and insecticide (imidacloprid) treatments to monitor and control black weevils) to avoid any biotic and abiotic stress. Early sucker selection (upon emission) and desuckering by gouge every 15 days helped maintain the population density and avoid mother–plant competition from new useless suckers.
Trait measurement
A set of 14 agronomic traits (Table 2) were assessed on all individual plants (45 plants/variety x 9 varieties = 405 plants) at flowering and harvest during the first production cycle. The pseudostem height (Ht) was measured between the ground and the bottom of the V formed by the last two emitted leaves. The pseudostem circumference (G50) was measured at an aboveground height of 50 cm. The number of emitted leaves (NEL) was measured at flowering. The number of living leaves was measured at flowering and harvest (NLLf and NLLh, respectively). The width and length of each emitted leaf were measured to calculate its leaf area according to Murray’s formula (Murray, Reference Murray1960) (length x width x 0.8). The total leaf area emitted at flowering (EFA) by the plantain plant, as well as the functional leaf area at time t, that is, the cumulative area of photosynthetically active leaves at that time t, flowering and harvest (GAf and GAh, respectively), were then calculated by summing the unit leaf areas. Bunches were harvested at the first ripened finger, including about half of the peduncle, as practiced by farmers. Each bunch was weighed (BW), and its structure was characterised by the number of fruit-bearing hands (BH) and the total number of fruits, or so-called fingers (BF). The mean finger weight (FW) was calculated by the BW/BF ratio. The planting, full flowering (last fertile open hand) and harvesting dates were recorded to calculate planting–harvesting intervals (PHP) and flowering–harvesting intervals (FHP).
List of the agronomic traits measured

Calculation of agronomic and usage potential indicators
Six agronomic and usage potential indicators were calculated on the basis of the measured agronomic traits for each sampled plantain plant per variety (Table 3).
List of indicators of calculated production abilities

The production potential was represented by the plant ability to produce heavy bunches, that is, with high weights and many hands and fruits, with a short period between harvests. The plant ability to produce heavy bunches was assessed by the bunch size indicator (iBS), which corresponded to the measured bunch weight (BW). The period between harvests was assessed by the harvest frequency indicator (iHr), which corresponded to the number of harvested bunches in a year. Here, this indicator was calculated for the first harvested bunch.
The plant response to biotic and abiotic stress was represented by its ability to resist falling and to fill fruits completely even under limiting climatic and cropping conditions. The plant ability to resist fall reflects its response to biotic stress. Indeed, damage by banana black weevils (particularly Cosmopolites sordidus) and root endoparasitic nematodes (particularly Radopholus similis; Pratylenchus spp.) led to high fall rates, thereby hampering the ability of the plant to bring bunches to maturity. We assumed that plant robustness (Dorel et al., Reference Dorel, Damour, Leclerc, Lakhia, Ricci, Vingadassalon and Salmon2016), calculated as the ratio between the plant girth and height, was a good indicator of its ability to resist falling (robustness indicator, iRob). The plant ability to fill fruits completely even under foliar fungi pressure (particularly Pseudocercospora fijiensis) and limiting climatic and cropping conditions reflects the plant response to biotic and abiotic stress. We assumed that the plant ability to maintain a substantial leaf area until harvest contributed to its tolerance to these stresses (Mobambo et al., Reference Mobambo, Gauhl, Vuylesteke, Ortiz, Pasberg-Gauhl and Swennen1993). Hence, the fruit filling ability indicator (iFill) was calculated as a function of the number of living leaves at flowering (NLLf) and harvest (NLLh) and the flowering to harvest period (FHP). Two observations where the number of living leaves at flowering and harvest were identical (and thus the iFill indicator calculation became impossible) were deleted from the dataset.
Finally, the usage potential was represented by the plant ability to produce heavy bunches (iBS indicator), hands with numerous fruits (hand size indicator, iHS) and fruits with high weight and sizes (fruit size indicator, iFS) because of the importance of these criteria in West and Central African markets. Indeed, a high bunch weight, a high number of hands and fruits with high weights and sizes enhance the value of the bunches for field-side marketing (Baiyeri et al., Reference Baiyeri, Mbah and Tenkouano2000), and then for retail sale per hand or finger for direct consumption (Osseni et al., Reference Osseni, Séry, N’Guessan, Yao, Picq, Fouré and Frison1998; N’Da Adopo et al., Reference N’Da Adopo, Amafon Aguie, Kehe, Kamara, Fofana, Picq, Fouré and Frison1998; Dury et al., Reference Dury, Bricas, Tchango Tchango, Bikoï, Picq, Fouré and Frison1998). These three indicators partly reflect the capacity of a plantain plant to generate marketable bunches.
Data analysis
For each trait, differences between varieties in mean trait values were tested with a one-way analysis of variance (ANOVA) followed by Tukey’s post hoc tests. Agronomic trait variability was assessed with coefficients of variation (CV) within varieties (intra-varietal variability) and among varieties (inter-varietal variability) according to Garcia et al. (Reference Garcia, Damour, Kazakou, Fried, Bopp and Metay2020). CVs were calculated for each trait and variety as follows:
 $${CV = \sigma/ \mu, where\,\mu\,is\,the\,mean\,trait \,value\, for\, the\, variety\, and\, \sigma\, is\, the\, standard \,deviation\, around\, \mu.}$$
The intra-varietal variability of traits (mCVintra) was calculated for each trait as the mean CV calculated for all varieties. The inter-varietal variability (CVinter) was calculated as the mean of the mean variety trait values. We also calculated the mean variety intra-varietal variability (mCVintra,var) as the mean CV calculated for all traits of a variety, in order to assess whether varieties differed in their trait intra-varietal variability.
Relationships between traits were assessed with a principal component analysis (PCA) using the factomineR package (Lê et al., Reference Lê, Josse, Husson and Mazet2008). Studied varieties and morphotaxonomic subgroups were included as supplementary qualitative variables to study their projections on the PCA axis. Differences in principal component axe 1 (PC1) and principal component axe 2 (PC2) scores between morphotaxonomic groups were tested via one-way ANOVA followed by Tukey’s honestly significant difference (HSD) tests. Hierarchical clustering on principal components (HCPC) was then performed to highlight clusters of observations. Differences between clusters in PC1 and PC2 scores were assessed by ANOVA followed by Tukey’s HSD tests. Clusters were described according to trait values and proportions of individuals belonging to each morphotaxonomic subgroup. For traits, ANOVAs were performed to compare clusters. For each morphotaxonomic subgroup (supplementary qualitative variable), a v-test was performed to assess the relationship between this variable and the clusters and to compare with the whole dataset to determine significant differences (Husson et al., Reference Husson, Lê and Pagès2017).
Differences in agronomic and usage potential indicator values between varieties and between morphotaxonomic subgroups were tested by one-way ANOVA followed by Tukey’s HSD tests.
Results
Inter-varietal and intra-varietal variability in agronomic traits
The plantain varieties studied were differentiated according to the measured agronomic trait values (Table 4, Supplementary Material Fig. S1). Varietal effects were highly significant (p < 0.0001) for each measured agronomic trait. The traditional Essong, Batard, French Clair, Mbouroukou n°3 and Big Ebanga varieties differed from the hybrid CRBP39, D248, D535 and FHIA21 varieties, that is, the NLLf, NLLh, GAh and FHP agronomic trait values of the traditional varieties were higher, while the Ht, NEL and EFA agronomic trait values of the traditional varieties were lower. The Essong variety differed significantly from all other varieties with regard to nine agronomic traits, with much higher (Ht, G50, NEL, EFA, BH, BF and PHP) or much lower (NLLf, NLLh and GAh) values. The Big Ebanga variety had significantly lower G50, NLLf and BW agronomic trait values than the other varieties, which was also the case regarding the Mbouroukou n°3 variety for the BF, FHP and PHP agronomic traits, and the D353 variety for the Ht, NEL, GAf and FW agronomic traits. Within the traditional varieties, a decreasing gradient of Ht, G50, NEL, EFA, BW, BH, BF and PHP agronomic trait values and an increasing gradient of FW agronomic trait values was noted between French and French Horn subgroup varieties and False Horn subgroup varieties.
Mean agronomic trait values of the varieties ± coeficients of variation (CV). For each trait, different letters indicate a significant difference between variety means (Tukey’s HSD test). For each trait, the intra-varietal variability of traits (mCVintra) was calculated as the mean CV calculated for all varieties. For each variety, the mean variety intra-varietal variability (mCVintra,var) was calculated as the mean CV calculated for all variety traits. See Tables 1 and 2 for variety and trait abbreviations

Intra-varietal variability in the measured agronomic traits also differed markedly among the varieties and studied traits (Table 4, Supplementary Material Fig. S1). The highest mean intra-varietal variability in agronomic traits per variety (mCVintra,var) was 26% (Essong). This latter variety was found to have the highest intra-varietal variability in the GAh, NLLh, GAf, EFA, PHP, NEL, BH and G50 agronomic traits (ranked in decreasing order of variability). The mean intra-varietal variability in agronomic traits of the other varieties ranged from 10% (French Clair) to 15% (Batard). The Mbouroukou n°3 variety had the lowest intra-varietal variability in the agronomic NLLh, BW, FW, EFA, BH and NEL traits (ranked in decreasing order of variability, i.e. from 37% to 12%). The mean intra-varietal variability in each agronomic trait (mCV intra) ranged from 4% (NEL) to 34% (GAh). NLLh, GAf, BW and FW agronomic trait variability values were above 15%, while NEL, PHP, Ht, G50, BH, FHP and NLLf agronomic trait variability was below 10%. For all measured agronomic traits, this intra-varietal variability was lower than the inter-varietal variability (CV inter), especially for the NEL, EFA and G50 agronomic traits.
Relationships between morphotaxonomic subgroups and agronomic traits
The morphotaxonomic classification revealed a substantial part of the agronomic trait variation across varieties but was not sufficient. The PCA focused on agronomic traits explained 56.2% of the total variance on the first two axes (Figure 1A). The first axis explained 36.6% of this variance and was positively correlated with NEL, PHP, EFA, BH, Ht and G50 (with contributions of 15.0%, 14.4%, 13.5%, 11.4%, 10.5% and 8.7%, respectively) and negatively correlated with NLLh (with a 9.4% contribution). The second axis explained 19.6% of the total variance and was positively correlated with NLLf, FHP, BF, BW and GAf (with contributions of 15.7%, 15.3%, 14.3%, 9.1% and 4.0%, respectively) and negatively correlated with FW (with a 13.3% contribution). While observations of varieties belonging to the French Horn, False Horn and Hybrids subgroups were dispersed within groups mainly along axis 2, the French subgroup was very broadly dispersed along axis 1, with moderate dispersion along axis 2 (Figure 1B). On axis 1, the French Horn and French subgroups were significantly different from the False Horn and Hybrids subgroups. On axis 2, the French Horn and French subgroups did not significantly differ but were significantly different from False Horn and Hybrids subgroups, which were also significantly different with respect to each other.
Principal component analysis (PCA) performed on agronomic traits measured at flowering and harvest: (A) correlation circle between traits on the first two axes; (B) observations on the first two axes with the morphotaxonomic subgroups represented; (C) observations on the first two axes with the HCPC clusters represented. See Table 2 for trait abbreviations. ‘Fah’: False Horn; ‘Fre’: French; ‘Frh’: French Horn; and ‘Hyb’: Hybrids.

The HCPC highlighted three groups of significantly different plantain plants (P < 0.0001) (Table 5, Figure 1C). Group 1 included 98.7% hybrid plantain plants, Group 2 was a mixture of plantain plants of the False Horn (51.4%), French (29.7%) and Hybrids (16.6%) subgroups, while Group 3 was a mixture of plantain plants of the French Horn (53.25%) and French (46.8%) subgroups. Group 1 corresponded to plantain plants whose NLLf, NLLh and GAh agronomic trait values were significantly higher than the others, Group 2 corresponded to plantain plants whose FW agronomic trait values were significantly higher than the others, and Group 3 included plantain plants whose Ht, G50, NEL, EFA, GAf, BW, BH, BF, FHP and PHP agronomic trait values were higher than the others.
Differences between clusters defined by the HCPC: agronomic traits (mean ± SD) and results of the v-test performed in HCPC for the variable morphotaxonomic subgroup. For each trait, different letters indicate a significant difference between subgroup means (Tukey’s HSD test). Bold values indicate the best value of the agronomic trait

Agronomic and usage potential indicators
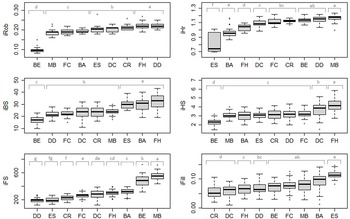
Significant differences (P < 0.0001) were noted in the agronomic and usage potential indicator values between the morphotaxonomic subgroups (Table 6) and varieties studied (Figure 2). The most favourable (i.e. highest) indicator values were obtained by False Horn varieties for the harvest frequency (iHR) and fruit size (iFS) indicators, by the French Horn varieties for the bunch size (iBS) indicator and by the hybrid varieties for the robustness (iRob), hand size (iHS) and fruit filling ability (iFill) indicators. The analysis of between variety differences in indicators values highlighted the abilities of some varieties. The Big Ebanga and Mbouroukou n°3 varieties obtained favourable values for the fruit size (iFS) and harvest frequency (iHR) indicators, but unfavourable values for the bunch size (iBS), hand size (iHS) and robustness (iRob) indicators. The Essong variety obtained the most unfavourable values for the fruit filling ability (iFill), fruit size (iFS) and harvest frequency (iHR) indicators, while it was among the varieties with the most favourable bunch size (iBS) indicator values. Finally, several hybrid varieties obtained very favourable values for the fruit filling ability (iFill) (CRBP39 and D535) and hand size (iHS) indicators (FHIA21 and D535).
Mean values of indicators of agronomic and usage potentials (± SD) for each morphotaxonomic subgroup. For each indicator, different letters indicate a significant difference between subgroup means (Tukey’s HSD test). Bold values indicate the best value of the indicator

Boxplots of indicator values for agronomic and usage potentials of the studied varieties. iRob: robustness; iFill: fruit filling ability; iHr: harvest frequency; iBS: bunch size; iHS: hand size; and iFS: fruit size. For each indicator, different letters indicate a significant difference between varieties, with higher indicator values representing greater variety abilities. See Table 1 for variety name abbreviations.

Discussion
A high inter-varietal variability
The monitored agronomic trait were highly variable among varieties and morphotaxonomic subgroups. While measurement of these traits during successive crop cycles and at different locations would ensure a more comprehensive description of the varieties, we assume that a description of the first cycle in one location with non-limiting conditions, as done in this study, already gives reliable information on comparison between varieties (see similar approaches for species comparisons in Kazakou et al., Reference Kazakou, Violle, Roumet, Navas, Vile, Kattge and Garnier2014 and Garcia et al., Reference Garcia, Damour, Kazakou, Fried, Bopp and Metay2020). The observed inter-varietal variations in agronomic traits were in line with variations reported in other plantain variety panels (Selatsa et al., Reference Selatsa, Tenkouano, Njukwe, Iroume and Bramel2009; Odah et al., Reference Odah, Aziadekey, Tozo, Akpavi, Koukouma, Guelly, Kokou, Assignon, Akogo, Aidam, Akpagana, Kenny, Ait-Oubahou, Zinsou and Gbeassor2013; Adheka et al., Reference Adheka, Dhed’a, Sivirihauma, Karamura, Langhe, Swennen and Blomme2013; Ortiz and Vuylesteke, Reference Ortiz and Vuylesteke1998; Swennen et al., Reference Swennen, Vuylsteke and Ortiz1995). They again illustrate many mutations that prevail within plantain varieties, resulting in different extents of reproductive system degeneration and impacts on all plantain plant organs.
Essong was the most outstanding variety: the size and number of its organs (pseudostem, leaves, hands and fruits in the bunch) and its cycle length were much higher than noted in the other varieties. The plant morphology, bunch structure and cycle lengths of this plantain variety were typical of the French giant variety subgroup (De Langhe et al., Reference De Langhe, Pillay, Tenkouano and Swennen2005; Ortiz et al., Reference Ortiz, Madsen and Vuylsteke1998). Ortiz et al. (Reference Ortiz, Madsen and Vuylsteke1998) suggested that mutations expressed in French giant varieties may have been gradually selected by growers so as to obtain a reduced plantain plant morphology in order to enhance wind resistance and a shorter cycle to boost yields. The French Clair medium variety could be a result of this selection process: the proportions of traits of plants of this variety were found to be in similar to those of the Essong variety, especially regarding the bunch structure, but the organs were smaller and the cycle lengths shorter. The Batard variety could be a further result of this selection process with regard to both the plantain morphology and bunch structure, which resembled those of French medium varieties, but it also had a higher mean fruit weight that was closer to that of False Horn varieties. This variety belongs to the French Horn subgroup which, according to various molecular analysis results, presents with inflorescence degeneration like that of False Horn varieties but with less of an impact on the plant morphology (Crouch et al., Reference Crouch, Crouch, Madsen, Vuylesteke and Ortiz2000; De Langhe et al., Reference De Langhe, Pillay, Tenkouano and Swennen2005).
The marked differences noted between traditional plantain varieties and hybrid varieties concerned the persistence of the leaf area (number of living leaves and functional leaf areas at flowering and harvest), which was much higher for hybrid varieties. These findings, which are in line with other reported performance evaluation data for plantain-like hybrid varieties (Irish et al., Reference Irish, Goenaga, Rios, Chavarria-Carvajal and Ploetz2013; Dzomeku et al., Reference Dzomeku, Bam, Adu-Kwarteng, Darkey and Ankomah2007; Lemchi et al., Reference Lemchi, Ezedinma, Tshiunza, Tenkouano and Faturoti2005; Cohan et al., Reference Cohan, Abadie, Tomekpe and Tchango Tchango2003), suggest that plantain hybrids have better tolerance to banana black leaf streak (Pseudocercospora fijiensis), which was a major varietal improvement criterion for plantain in major international programmes (Craenen and Ortiz, Reference Craenen and Ortiz1998; Cohan et al., Reference Cohan, Abadie, Tomekpe and Tchango Tchango2003). Note also that the hybrid varieties had a more stocky and robust morphology compared to traditional varieties. These results are consistent with the plantain ideotype sought in most plantain breeding programmes, that is, a small- to medium-sized, short-cycle plantain plants with a leaf area that is tolerant or resistant to banana black spot, while producing heavy bunches with many hands and fruits (Jenny et al., Reference Jenny, Auboiron, Beveraggi and Jones1994; Vuylsteke and Swennen, Reference Vuylsteke and Swennen1993; Tezenas du Montcel, Reference Tezenas du Montcel1993; Ortiz and Langie, Reference Ortiz and Langie1997). Hybrid plantain varieties were also found to have the highest fruit filling periods (flowering-harvest interval), which has been previously observed and explained by their higher ploidy levels (Vuylsteke et al., Reference Vuylsteke, Swennen and Ortiz1993; Shaibu et al., Reference Shaibu, Nwonuala, Tenkouano and Ogburia2003).
A high intra-varietal variability
The monitored agronomic trait values were also sometimes highly variable within plantain plants of the same variety. Few published studies have investigated this issue; most studies have been focused on assessing inter-varietal variations in the plantain group (see 4.1.). Yet variations in agronomic traits within the same variety of the Musa genus have already been documented, assessed and used – especially within the Cavendish group (Musa accuminata, AAA) – to distinguish different clones within the same cropped variety (Rodrigues et al., Reference Rodrigues, Librelon, Nietsche, Costa and Pereira2012), or to compare the production performance of different existing clones in a specific pedoclimatic context (Robinson et al., Reference Robinson, Nel and Eckstein1993; Pinar et al., Reference Pinar, Bircan, Unlu, Turkay, Uzun, Ercisli and Hanci2020). The absence of similar studies on plantain could be explained by the fact that conventional planting material propagation techniques are still generally implemented in the main plantain production areas (Kone et al., Reference Kone, Kone, Traore and Kouadio2011; Kouakou et al., Reference Kouakou, Kone, Aby, Traore, Dogbo and Kone2019; Lescot and Ganry, Reference Lescot, Ganry, Dubois, Hauser, Staver and Coyne2008). This range of techniques and probably of technical expertise levels, propagation sites and mother plant physiological and sanitary states could have been conducive to highly varied selection and the emergence of multiple mutations (Vuylesteke and Swennen, Reference Vuylesteke and Swennen1990; Ortiz et al., Reference Ortiz, Madsen and Vuylsteke1998), thereby increasing the possibility of intra-varietal variability, process that would not be limited by the lack of mass selection.
The Essong variety showed the highest mean intra-varietal variability in agronomic traits, as well as the highest intra-varietal variability in several agronomic traits. This trend might be explained first by its long cycle duration in comparison with shorter-cycle plantain plants, and this could increase the chance of undergoing stress during the growth period, which could impact the functioning of each banana plant to different extents and be conducive to dispersion of the agronomic trait values at the end of the cycle. This hypothesis is supported by the high mean intra-varietal variability in the agronomic traits of the Batard variety, which also had a longer cycle than the other studied varieties. A second explanation could be the existence of different relatively stable mutations within the Essong variety grown in Cameroon. The PCA graph projection findings for the varieties (see Supplementary Material Fig. S2) supports this hypothesis by highlighting two groups of plantain plants discriminated in the Essong variety on axis 1. One group of plantain plants of this variety thus showed significantly higher cycle length, emitted leaf number and pseudostem circumference at flowering values. This difference should be further investigated using tailored molecular marker methods (Lamare and Rao, Reference Lamare and Rao2015; Marimuthu Somasundaram et al., Reference Marimuthu Somasundaram, Subbaraya, Durairajan, Rajendran, Gopalakrishnan, Shahul Hameed, Palani and Suthanthiram2019).
Finally, three of intra-varietal variability levels emerged at the monitored agronomic trait scale. The least variable agronomic traits described the plantain morphology (pseudostem height and circumference and leaf area emitted at flowering) and cycle length. These traits are also reportedly not highly variable under environmental effects (IPGRI-INIBAP/CIRAD, 1996) as they are likely closely related to the banana plant development pattern, which could explain their lower variability in our study. The most variable agronomic traits involved changes in leaf area up to harvest, which could be explained by the many factors that can affect the leaves during a cycle (black leaf streak, wind, bird damage, etc.); these agronomic traits are more related to plantain plant growth. Finally, agronomic traits describing bunch components (number of hands and fingers in the bunch, bunch weight) showed intermediate variability – these traits could be the result of the plantain plant development and growth pattern. This trend, which has been further highlighted by the analysis of correlations between agronomic traits (Arantes et al., Reference Arantes, Donato and Silva2010; Orluchukwu and Ogburia, Reference Orluchukwu and Ogburia2014), could be of interest with regard to the choice of agronomic traits to be monitored and measured in varietal assessments and in designing tools for predicting the functioning of varieties (Dépigny et al., Reference Dépigny, Lescot, Achard, Diouf, Cote, Fonbah, Sadom and Tixier2016).
Agronomic potential and morphotaxonomic subgroups
Our study of the measured agronomic traits revealed three significantly different groups of plantain plants very close to the plantain morphotaxonomic subgroups. The measured agronomic traits thus revealed a large part of the morphotaxonomic subgroup classification, as also observed in other studies (Osuji et al., Reference Osuji, Okoli, Vuylsteke and Ortiz1997; Swennen et al., Reference Swennen, Vuylsteke and Ortiz1995). French-type plantains were hard to position between groups 2 and 3, which could be explained by the marked morphology gradient in the studied plantains, but also by the existence of more or less expressed reversions from the False Horn type to the French type (Crouch et al., Reference Crouch, Crouch, Madsen, Vuylesteke and Ortiz2000; Ramcharan and Gonzalez, Reference Ramcharan and Gonzalez1984; De Langhe et al., Reference De Langhe, Pillay, Tenkouano and Swennen2005; Youmbi et al., Reference Youmbi, Fonkam, Ngaha, Nkeng and Kwa2005). This correspondence between agronomic traits descriptive of the agronomic potential and morphotaxonomic subgroups led us to put forward a hypothesis on the existence of a banana functioning model (development rules, biomass allocation rules, source–sink relations, etc.) specific to each morphotaxonomic subgroup. This would be an interesting avenue to explore in view of the development of tools for predicting varietal potentials under different cropping conditions (pedoclimatic, intensification level, etc.) (Dépigny et al., Reference Dépigny, Lescot, Achard, Diouf, Cote, Fonbah, Sadom and Tixier2016).
Agronomic and usage potential indicators
It is essential to formalise knowledge acquired on plantain varietal diversity to support farmers in making varietal choices. The agronomic and usage potential indicators proposed in this study were developed with the aim of encapsulating the production potential and the market suitability of the studied varieties. They were developed to compare varieties and to support decision-making on varietal choices. Further evaluation of a subset of selected species, in different environment conditions or during successive cycles, could be conducted depending on the objectives. The production potential was described by the harvest frequency (iHR) and bunch size (IBS) indicators, both of which were complementary regarding their description of the production potential, while revealing a trade-off also reported for dessert banana (Dorel et al., Reference Dorel, Damour, Leclerc, Lakhia, Ricci, Vingadassalon and Salmon2016), that is, varieties that had the longest cycles, such as FHIA21, Essong and Batard, also produced the largest bunches probably because of a longer carbohydrate accumulation time. Conversely, varieties with the shortest cycles, such as Mbouroukou n°3, Big Ebanga and certain hybrid varieties, produced smaller bunches. The potential response to biotic and abiotic stress, as described by the robustness (iRob) and fruit filling ability (iFill) indicators, supplemented the description of the agronomic potential. The two proposed indicators highlighted the superiority of the different hybrid varieties tested over traditional plantain varieties. This could be explained by the fact that plantain breeders strive to achieve greater plantain robustness and better tolerance to black Sigatoka disease. Finally, the usage potential was described by the bunch size (iBS), hand size (iHS) and fruit size (iFS) indicators, which were complementary and opposing, that is, a bunch consisting of many hands and fruits (e.g. FHIA21, Essong and Batard) will have smaller and lighter fruits than a bunch with fewer hands and fruits (e.g. Mbouroukou n°3 and Big Ebanga).
Figure 3 summarises the abilities of the nine studied varieties and highlights that all of the sought-after abilities were not pooled in any single variety. This means that farmers have to make trade-offs between the abilities of the different available plantain varieties to address their production constraints and meet their marketing objectives (Norgrove and Hauser, Reference Norgrove and Hauser2014). In Cameroon, French giant varieties, such as Essong, are grown because of their ability to produce heavy bunches (Hauser and Amougou, Reference Hauser, Amougou, Dubois, Hauser, Staver and Coyne2010), then offering high market profitability (Ndemba, Reference Ndemba2003), a substantial household food supply (Nyoneng, Reference Nyoneng2003) and fruits that are appreciated for staple meal-making (Ngoh Newilah et al., Reference Ngoh Newilah, Tchango Tchango, Fokou and Etoa2005). False Horn varieties, such as Big Ebanga and Mbouroukou n°3, are cropped because of their short cycles and fruit, which is highly esteemed for local dishes (Ngoh Newilah et al., Reference Ngoh Newilah, Tchango Tchango, Fokou and Etoa2005) and whose size is particularly suitable for certain uses, such as the preparation of chips (Fonfang Fouepe et al., Reference Fonfang Fouepe, Folefack, Pane Pagui, Bikoi and Noupadja2016). Including varieties with different abilities in the production system, either in the form of plots dedicated to different varieties, or in the form of a varietal mixture plot, is another way for farmers to manage their trade-offs, that is, enhance responses to agronomic constraints (Quénéhervé et al., Reference Quénéhervé, Barrière, Salmon, Houdin, Achard, Gertrude, Marie-Luce, Chabrier, Duyck and Tixier2011) and the marketing potential (Dépigny et al., Reference Dépigny, Lescot, Achard, Diouf, Cote, Fonbah, Sadom and Tixier2016). This could partly explain the high proportion of plantain crop plots in Cameroon where French and False Horn varieties are jointly cropped (Hauser and Amougou, Reference Hauser, Amougou, Dubois, Hauser, Staver and Coyne2010; Achard, Reference Achard1998).
Scoreboard of agronomic and usage potential indicators of the studied varieties. Scores correspond to indicator values rescaled on a scale of 0 (lowest value of the indicator) to 10 (highest value of the indicator).

Conclusion
This study revealed marked differences in measured agronomic trait values among the studied plantain varieties, while also highlighting high intra-varietal variations in some varieties, such as Essong. Links between the monitored agronomic traits and the morphotaxonomic classification were found, suggesting the existence of functioning laws specific to each plantain morphotaxonomic subgroup. Finally, the findings of this study enabled us to propose an initial formalisation of agronomic and usage potential indicators per variety. This characterisation of plantain varietal diversity should be a real asset for plantain growers. Other indicators would now need to be developed that integrate traits from several disciplines. This also calls into question the methods and tools used to assess and characterise the very broad-ranging varietal diversity spanning many countries, as well as to identify and formalise the needs of plantain farmers, consumers and processors.
Supplementary material
For supplementary material accompanying this paper visit https://doi.org/10.1017/S0014479722000503
Acknowledgements
The authors wish to thank the CARBAP team for their rigorous observations, including Médard Talla Djomessi, Frédéric Tchotang, David Essome Ngando, Gabriel Fansi, Jean-Pierre Ebongue and many other CARBAP staff who contributed to the trials. This study was conducted in the framework of the CARBAP-CIRAD collaborative agricultural research programme and funded by CIRAD and CARBAP core budgets.
Declaration of Competing Interest
The authors declare that they have no known competing financial interests or personal relationships that could have appeared to influence the research reported in this paper.
Author Contributions
Study design: SD; Methodology: SD and GD; Data curation: SD; Data presentation: SD and GD; Writing: SD and GD; Project administration: SD.
Data Availability
Data production, measurement and curation were described in a data paper (Dépigny et al., Reference Dépigny, Tchotang, Talla, Fofack, Essomé, Ebongué, Kengni and Lescot2018), and data are available on the CIRAD Dataverse website: https://doi.org/10.18167/DVN1/CBUVWU




 Open access

