


Introduction
A disaster arises as a consequence of an event that disrupts the functioning of a society, causing losses and needs that overwhelm local capacity and necessitate outside humanitarian assistance.Reference Perry1–6 Over the last decade, an average of 200 million people have been affected annually by disasters caused by natural hazards.7–Reference Wallemacq, Below and McLean9 Natural hazards that occur suddenly, such as earthquakes, can cause damage and a high number of casualties in a short time.Reference Keim2,Reference Wallemacq, Below and McLean9,Reference Ward and Shively10 Of the 200 million people affected, eight million were affected by earthquakes alone, yet earthquakes caused one-half of all natural disaster deaths.7–Reference Wallemacq, Below and McLean9
Disasters arise as a combination of vulnerability and exposure to a hazardous event and as a consequence of the magnitude of the hazardous event.Reference Sundnes and Birnbaum3,Reference Beccari11 A society’s vulnerability or susceptibility to a hazardous event is determined by factors such as the socioeconomic situation, where a resource-poor society in general tends to be more susceptible to the negative consequences of a hazard compared to a resource-rich society.Reference Keim2,6,Reference Wallemacq, Below and McLean9,Reference Beccari11
Needs in a disaster are broadly defined by the number of people affected by the disaster, as well as the severity, which is ultimately manifested in excess mortality.Reference Perry1,Reference Checchi and Roberts12–Reference Eriksson, Gerdin, Garfield, Tylleskar and von Schreeb14 The main governmental funders of humanitarian assistance have agreed that international funding should be based on disaster needs.4,5 For funding agencies that intend to fund disaster response “according to needs,” cognizance of the nature of the needs must be combined with an estimation of the relative importance or scale as well as urgency of the needs.4,Reference Darcy and Hoffman15,16 This approach should be comparable between disasters to allow for prioritization.4,Reference Darcy and Hoffman15,17,Reference Eriksson, Ohlsén, Garfield and von Schreeb18 However, following earthquakes, information on needs and the scale of needs are scattered and incomplete, delaying a swift needs-based funding decision.Reference Stoddard, Poole, Glyn and Willitts-King19,20
Nevertheless, decisions are needed. To guide swift decisions, prediction of the scale of needs is desirable. In the same manner as composite measures of different variables (indexes), which often are used to classify countries or societies in social science,Reference Mazziotta and Pareto21 an index that captures hazard and vulnerability could potentially support the objective and rapid prioritization of needs-based funding.Reference Olin and von Schreeb22 While there has been a proliferation of indexes in this area in recent years,Reference Beccari11 there is currently no commonly accepted disaster index model for the prediction of disaster needs.Reference Eriksson, Gerdin, Garfield, Tylleskar and von Schreeb14,Reference Eriksson, Ohlsén, Garfield and von Schreeb18,23–26 Many indexes require detailed information on the post-hazard situation, which makes them difficult to use for rapid needs-based funding decisions.Reference Bayram, Kysia and Kirsch27–Reference Birkmann29 In addition, indexes have rarely been validated against the scale of disaster needs after earthquakes and other sudden-onset events.Reference Beccari11,Reference Bakkensen, Fox‐Lent, Read and Linkov30 Hence, there is a need for a composite index based on indicators that are available in the immediate aftermath of an earthquake and that have been shown to predict the scale of needs to enable swift needs-based funding decisions.
The aim of this study was therefore to identify and assess predictors of the scale of disaster needs after earthquakes.
This study’s hypothesis stipulates an association among the indicators of vulnerability, exposure to, and magnitude of earthquakes and outcomes regarding the number of dead and affected people that, if taken into account, can enable the early prediction of needs and, in turn, swift and scale-adapted funding decisions.
Based on the Utstein logic for evaluating and researching disasters,Reference Sundnes and Birnbaum3 the frame is also used in adapted forms by disaster indexes.Reference Sundnes and Birnbaum3,Reference Eriksson, Ohlsén, Garfield and von Schreeb18,24,25 Logic: information on the hazard event, the vulnerability of the society, and the number of people exposed should enable a prediction of disaster severity and the number of people affected, thereby predicting the size and urgency of needs.
Methods
Study Design
This analysis of secondary indicators and disasters requires data using linear regression models. The ability of a series of indicators to predict the scale of needs was assessed (Table 1Reference Rivera and Rolke31–Reference Maslow33). In this study, “needs” refer to the relative scale of needs, which are the product of the severity of the disaster and the size of the affected population. Indicators were chosen from four commonly used disaster indexes. The indexes were selected because they assess risks, vulnerabilities, severity, or needs in relation to disasters on a global scale; have a published methods section; and are published or sponsored by a United Nation’s (UN) branch as well as governmental humanitarian assistance funding agencies.
Definitions of Key Terminology

The selected indexes were: (1) the Global Humanitarian Needs Assessment (GNA) produced by the European Civil Protection and Humanitarian Aid Operations (ECHO; Brussels, Belgium) from 2004 through 2015;23 (2) the Index for Risk Management (INFORM), which replaced the GNA and is the result of a collaboration between the Inter-Agency Standing Committee (Geneva, Switzerland) Task Team for Preparedness and Resilience and ECHO, with close to 20 UN and governmental partners;24 (3) the UN’s Global Disaster Alert and Coordination System (GDAC) earthquake alerts;26 and (4) a model developed by Karolinska Institute’s (KI; Stockholm, Sweden) Severity and Needs Scoring Model (7-eed), which was initially intended for the severity scoring of complex emergencies.Reference Eriksson, Ohlsén, Garfield and von Schreeb18
Setting
All earthquake events recorded in both the Centre for Research on the Epidemiology of Disasters’ at the Université Catholique de Louvain (CRED; Brussels, Belgium) Emergency Events Database (EM-DAT) and GDAC from 2007 through 2016 were selected for the analysis. The criteria for the CRED/EM-DAT inclusion in the database are one or more of the following: 10 or more people dead, 100 or more people affected, the declaration of a state of emergency, or a call for international assistance.34
Variables
Study Outcome
The root mean squared error (RMSE) with a 95% confidence interval (CI) of indicators, individually and in different combinations, was used as the study outcome. The RMSE was chosen as it is commonly used to assess the predictability of models.
Model Outcomes
The outcome variables used were the number of people who died in the earthquake (“number of deaths”) and the number of people affected by the earthquake (“number affected”). The two outcome variables were assumed to give information on needs (Figure 1). The data for the outcomes were extracted from the EM-DAT; the EM-DAT refers to the number of people who died in an earthquake as “deaths,” which is explained as the “Number of people who lost their life because the event happened.”34 This outcome was selected to represent the severity of the situation instead of excess mortality, which is not available in the database. The number of people who lost their lives has been used as a disaster outcome in a previous validation study.Reference Bakkensen, Fox‐Lent, Read and Linkov30 The number affected refers to people injured in the earthquake, people left homeless after the earthquake, and people requiring immediate assistance during the period of emergency, as defined in the EM-DAT.34
Theoretical Framework.

Indexes
The four assessed indexes all included indicators for vulnerability, the magnitude of the hazardous event, and the number of people affected. Proxy indicators for coping capacity were used by one index. The number of indicators varied among the indexes.
Three of the four indexes included other composite indexes as indicators, which are hereafter called sub-indexes. Several of the indicators appeared both as single indicators and as indicators in the sub-indexes within the indexes. The GDAC uses both the GNA and INFORM vulnerability score as indicators. The assessed indexes use similar indicators to capture vulnerability; these are in most cases linked to the socioeconomic situation and the level of development, education, and health. For a detailed list of all index indicators, see Annex 1 (available online only).
Indicators
The choice of indicators to assess in this study is based on the theoretical framework, which is found in Figure 1. All indicators that were used in any of the indexes to indicate vulnerability, magnitude of the hazardous event, or exposure to the hazard were included in the study.
Data Sources
Data on the earthquakes and outcomes were obtained from both the CRED/EM-DAT and GDAC’s archive. For detail, CRED at the Université Catholique de Louvain is a well-established research center whose database on natural disasters contains data from 1900 to the present. The database was established in 1988, and EM-DAT contains data on over 22,000 disasters.34 The GDAC was established in 2004 and includes more than one million earthquakes recorded from 1994 onwards.26
First, data on country, date, number of deaths, and total number affected were extracted from CRED/EM-DAT. Next, GDAC’s alert data were matched with the list of earthquake events from CRED/EM-DAT. When event data in CRED/EM-DAT could not be matched with an alert in GDACs, they were removed. Finally, the earthquake magnitude, depth, and number of people living within 100 kilometers of the epicenter were extracted for the final list of earthquakes listed in both EM-DAT and GDAC. The number of people living within 100 kilometers of the epicenter was used as an estimate for the number of people exposed. To estimate the proportion of people who died (“proportion deaths”) and the proportion of people who were affected (“proportion affected”), the number of people who died in the earthquake (“number deaths”) and the number who were affected (“number affected”) were divided by the number of people exposed.
The GDAC alert score for expected impact (Table 2) for each earthquake was extracted, and color codes were translated into numbers, with gray alerts becoming the lowest alert with a numerical value of zero and red alerts becoming the highest alert with a value of three.
Logic of the Four Assessed Indexes

Abbreviations: 7-eed, Severity and Needs Scoring Model; GDAC, Global Disaster Alert and Coordination System; GNA, Global Humanitarian Needs Assessment; INFORM, Index for Risk Management; KI, Karolinska Institute.
The GNA scores per country were extracted for 2007 through 2013. For 2014 through 2016, data from 2013 were used. Scores varied from zero to three without decimal intervals.
The vulnerability scores from the INFORM index were extracted for 2013 through 2017. For preceding years, the scores from 2013 were used. The possible variation was from zero to 10 with decimal intervals.
Data for the vulnerability indicators used in the KI’s 7-eed model were extracted from the World Bank (Washington, DC USA) online database for the respective years of the different events in the affected countries. When data for a specific year were missing, the closest data in time were used. The vulnerability was then scored according to the pre-established scoring system,Reference Eriksson, Ohlsén, Garfield and von Schreeb18 with the possible range from two to six at intervals of 0.5 points, where six suggests the highest vulnerability.
Country data for vulnerability indicators were primarily sought from the World Bank online database. For a detailed list of sources, see Annex 2 (available online only).
Study Size
From 2007 through 2016, 255 earthquake events were identified in CRED/EM-DAT. Of these events, 28 could not be matched with GDAC alert data and were subsequently removed. In total, 227 events were included in the study.
Analyses and Statistical Methods
An initial mapping of the selected indexes was conducted that assessed: (1) the type of outcome (severity, risk, vulnerability, or needs); (2) the indicators used; (3) the index logic; and (4) the scoring system.
The variables were examined based on their ability to predict the outcomes, which were expressed as the number of people who died (number of deaths), the total number of people affected (number affected), and the proportion of deaths and people affected among the total number of people exposed to the hazard events.
Data collation was performed in a Microsoft Excel spreadsheet, version 16.11.11 (Microsoft Corporation; Redmond, Washington USA), and all analyses were conducted in R version 3.5.3 (2019-03-11) “Great Truth” (R Foundation for Statistical Computing; Vienna, Austria).
In an initial analysis, the score of each index was plotted against each of the outcome variables. Before the plotting, the index scores were first standardized, and outliers below the 10th and above the 90th percentiles were excluded, as these included extreme values.
The data were prepared to assess the predictive ability of individual indicators. First, indicators with more than 10% missing data were excluded from further analyses. Missing data in indicators with 10% or fewer missing data were imputed using median imputation (ie, missing data in an indicator were replaced using the median of observed data in the same indicator). Winsorizing was used to replace extreme outliers with the values observed at the 2.5th and 97.5th percentiles. Once extreme outlier values had been replaced, the data were split into a training and a validation set using a temporal split based on the date of an event. Two-thirds of the observations were assigned to the training set, and the remaining one-third were assigned to the validation set.
The predictive performance of the indicators was then estimated, first for each indicator individually and then in different combinations. The RMSE was used as the measure of predictive performance. To estimate the RMSE of an individual indicator, a linear regression model in the training set was built, with the outcome of interest as the dependent variable and the indicator as the only independent variable. This estimation was performed using a 10-fold cross validation, and the final RMSE is the median RMSE across the 10-fold in the training set.
The RMSE of different combinations of indicators was subsequently assessed. The first combination was the five indicators with the lowest RMSE. The second combination was the same as the first combination, but was forced to include the magnitude of the earthquakes if this indicator was not among the five with the lowest RMSE. The third combination included the vulnerability indicators included in the 7-eed model as well as magnitude, depth, and number exposed.
To estimate the RMSE of each combination, a linear regression model was built with the outcome of interest as the dependent variable and the indicators included in the combination as the independent variables. The model was built in the training set and then used to predict the outcomes of the observations in the validation set. The RMSE was estimated in the validation set. To estimate 95% confidence intervals (CI) around the RMSE point estimates, a bootstrap procedure was used, with 1,000 resamples drawn with replacement.
Results
The number of observations in the raw data was 227 earthquake events in 53 countries. The number of dead persons was recorded for 153 events and the number of affected persons for 222 events. In total, data for 26 variables were extracted (Table 3).
Indicators and Sub-Indexes Assessed as Predictors for Severity and Scale of Needs

Abbreviations: 7-eed, Severity and Needs Scoring Model; ECHO, European Civil Protection and Humanitarian Aid Operations; INFORM, Index for Risk Management.
No obvious associations between the standardized index scores and number of deaths, number of affected, proportion of deaths, and proportion affected among exposed were visually observed in the initial analysis, where the index scores were plotted against the outcome (data not shown).
After excluding observations with missing values for event location, event date, or outcome, a total of 150 observations remained. Winsorizing was used to replace extreme outcome values with the values observed at the 2.5th and 97.5th percentiles. For number of deaths, four observations were replaced, and extreme outcome values were defined as those below one or above 4,580. For the number of affected persons, eight observations were replaced, and extreme outcome values were defined as those below 23 or above 2,822,990. Out of the remaining 150 observations, a total of 100 observations were used to develop the models, and a total of 50 observations were used to validate the models. Table 4 shows the cross-validated RMSE associated with each predictor for each outcome. Indicators showing a significant value are presented in bold.
Cross Validated RMSE Across Predictors for Each Outcome (95% CI)

Abbreviations: 7-eed, Severity and Needs Scoring Model; GNI, Gross National Income; HDI, Human Development Index; ODA, overseas development aid; RMSE, root mean square error; TB, Tuberculosis.
For the outcome variable “number of deaths,” the five predictors with the lowest RMSE were malaria mortality, uprooted, the Gini index, depth, and Human Development Index (HDI). The RMSE (95% CI) of the multivariable model for number of deaths was 632 (209-1,051).
For the outcome “number affected,” the five predictors with the lowest RMSE were the Gini index, the proportion affected by natural disasters, the proportion uprooted, HDI, and the (number) uprooted. The RMSE (95% CI) of the multivariable model for the number affected was 638,517 (258,870-902,848)
Table 5 shows the full model’s parameter estimates with a 95% CI for number of deaths and number affected.
Multivariable Model with the Five Indicators Showing the Lowest RMSE
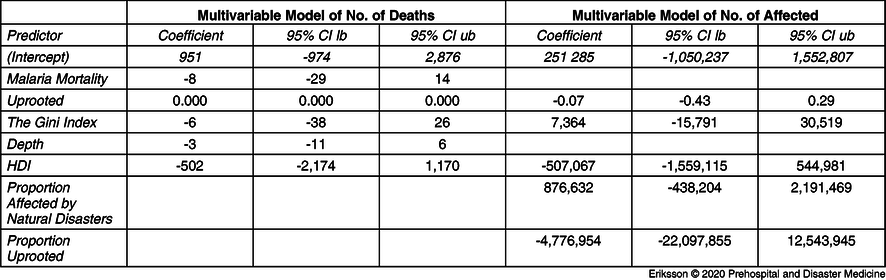
Abbreviations: HDI, Human Development Index; RMSE, root mean square error.
The RMSE (95% CI) of the pre-specified multivariable model that, in addition to the five predictors with lowest RMSE, also included magnitude assessed against the outcome for number of deaths was 624 (286-996).
The RMSE (95% CI) of the pre-specified multivariable model that, in addition to the five predictors with lowest RMSE, also included magnitude assessed against the outcome for the number affected was 602,070 (236,477-853,497). Table 6 shows the full model’s parameter estimates with a 95% CI. Indicators showing a significant value are presented in bold.
Pre-Specified Multivariable Model with the Five Indicators Showing the Lowest RMSE and Magnitude

Abbreviations: HDI, Human Development Index; RMSE, root mean square error.
The RMSE (95% CI) of the pre-specified 7-eed for the number of deaths was 712 (392-1,091).
The RMSE (95% CI) of the pre-specified 7-eed model for the number affected was 595,932 (252,828-840,877). Table 7 shows the full model’s parameter estimates with a 95% CI. Indicators showing a significant value are presented in bold.
Pre-Specified 7-eed Model and Magnitude

Abbreviations: 7-eed, Severity and Needs Scoring Model; GNI, Gross National Income.
In Figure 2 and Figure 3, the models with the lowest RMSE are compared with the actual outcome. For number of deaths, the pre-specified multivariable model that, in addition to the five predictors with the lowest RMSE, also included magnitude (Figure 2) and number affected was the 7-eed model (Figure 3).
Plot Number of Deaths, Low RSME Plus Magnitude.

Plot Affected, 7-eed.

Note that for Figure 2 and Figure 3, each black dot represents an event. The solid black line represents perfect agreement between observed and predicted outcomes. The dotted lines show the error between predicted and observed outcomes.
Discussion
The study was not able to identify any predictor that could capture the scale of needs after earthquakes. The hypothesis that estimates of vulnerability, the magnitude of a hazard, and the size of the population exposed can enable an early prediction of needs after earthquakes was rejected as no correlation was established between the outcome variables and the selected predictors. Neither the assessed indexes nor indicators correlated with the number of people who died in the earthquakes nor the number of people affected by the earthquakes.
The attempt to create a multivariable model that included the indicators with the lowest RMSE did not substantially improve the performance. The lowest RMSE attained in any of the combinations was 624 for number of deaths, with a confidence interval of 286-996. When the 7-eed indicators were combined with magnitude and exposure, the lowest RMSE reached was 712 for number of deaths, but the confidence interval was wide: 392-1,091. For number affected, the RMSE remained above or close to 600,000 in all attempts, with a confidence interval with a range of over 600,000, which makes the models incapable of predicting with precision or able to even broadly indicate an outcome.
While the authors of the study have found a correlation between the 7-eed model and excess mortality in protracted complex emergencies,Reference Eriksson, Gerdin, Garfield, Tylleskar and von Schreeb14 this correlation did not apply to the studied earthquakes. The results of a similar study, a validation of indexes for vulnerability or resilience by Bakkensen, et al, also showed a limited or no correlation between number of deaths after sudden-onset natural disasters,Reference Bakkensen, Fox‐Lent, Read and Linkov30 which points to the uncertainty related to vulnerability indexes and the prediction of scale of needs in these types of disasters.
It is essential to raise critical questions following a study with negative results: Was the hypothesis wrong? Does the study use the right outcome to estimate the scale of needs? Was the study design or the data quality inadequate? Are the results correct? In disaster situations, outcome data may remain uncertain, and there may be inaccuracies in the data related to the number of people who die,Reference Guha-Sapir and Checchi35 or are affected by a hazard. For instance, Rivera and Rolke suggest that the excess mortality after Hurricane Maria in Puerto Rica (2017) was significantly under-estimated.Reference Rivera and Rolke31 The term “affected” has several definitions. It can be defined in broad terms, including short- and long-term, directly and indirectly, and physically and psychologically affected.6 The numbers of people reported to be affected can therefore have large variations in the same disaster, depending on the definition.
The vulnerability indicators used in the indexes and models are based on country data. Variations in vulnerability within a country or between different groups within a country are not taken into account. These factors may cause a bias in the predicting variables. What are the (other) factors that should be taken into account to enable an early prediction of the scale of needs and needs-based funding for a response? There may be better predictors in the field of geophysical science and engineering that have not been included in this study. To better understand how needs can be predicted after earthquakes, more intradisciplinary research seems indispensable.
The choice of outcome variables may be misleading. Excess mortality, which is suggested as an ultimate measure of severity, will, in protracted disasters such as a conflict or drought, provide information about the on-going situation and the potential deterioration in terms of lack of services and livelihood. The assumption that the number of people who die in an earthquake is a proxy for severity does not take into account the possible excess mortality in the aftermath of an earthquake related to indirect causes, such as disrupted health services and food and water shortages. One can assume that a high socioeconomic vulnerability in a society will entail a limited capacity to respond to any needs, and as a consequence, a raise in excess mortality. Information on excess mortality was, however, not available.
The hypothesis assumes that severity and the number of people who are affected together will provide information on the scale of needs. The study stops short of assessing this link.
While a composite index that includes outcome variables, such as 7-eed, can be used to estimate the severity and scale of needs in complex emergencies,Reference Eriksson, Gerdin, Garfield, Tylleskar and von Schreeb14 the findings of this study are significant as they illustrate that available indexes cannot be used to predict the scale of needs. The results should inspire further studies to guide needs-based funding decisions given the challenging context. One may assume that such decisions should be made with support from a variety of rapidly available data, as well as an understanding of the context in which a disaster occurs, in combination with information from responders and other sources present during the disaster. Uncertainty cannot be avoided and must be balanced with timing. Nevertheless, improved indexes are needed to ensure that the people who are most in-need receive humanitarian assistance after earthquakes. Swift decisions on humanitarian funding, in the absence of a prediction index, must balance uncertainty against urgency.
Limitations
The relatively low number of earthquake events limits the validity of the outcome. The definition of outcome variables may differ. The study builds on the definition used by CRED/EM-DAT for total number affected: injured, people who are left homeless, and those in-need of immediate assistance. However, as different definitions may be used by the actors who report on those affected, there could be some bias in the numbers. The disaster data in EM-DAT were not triangulated with that of other sources. The number of people who died in an earthquake stops short of informing on the overall excess mortality in the aftermath of an earthquake. This aspect has not been included in the study as data on overall excess mortality were not available. Initially, data on the number of people injured in the earthquakes were collected as an additional outcome variable, but the information was only available for one out of five of the events, and further outcome analysis was therefore discarded.
Conclusion
None of the indicators, nor any combination of the indicators, used in the four assessed indexes were able to predict the scale of needs in the assessed earthquakes with any precision.
Conflicts of interest
none
Supplementary Material
To view supplementary material for this article, please visit https://doi.org/10.1017/S1049023X20000217


 Open access