


1. Introduction
Much has been written in recent years concerning the source-to-sink (S2S) system in predicted coarse-grained sand bodies and the boundaries of identified deposits (Sømme et al. Reference Sømme, Martinsen and Thurmond2009 a, b; Gomez-Veroiza & Steel, Reference Gomez-Veroiza and Steel2010; Helland-Hansen et al. Reference Helland-Hansen, Sømme, Martinsen, Lunt and Thurmond2016; Septama & Bentley, Reference Septama and Bentley2017; Snedden et al. Reference Snedden, Tinker and Virdell2018). Regarding systems from multiprovenance areas, their interactions and reworking process during sediment transport, where routing occurs, may decrease the sensitivity of the sediment grain size in response to the source area (Stone & Walling, Reference Stone and Walling1997) and lead to a more complicated dispersal pattern in the drainage area (Leeder et al. Reference Leeder, Mack and Salyards1996; Connell et al. Reference Connell, Kim, Paola and Smith2012).
As defined by Anderson (Reference Anderson1957), a multiprovenance system is a large watershed that brings sediments from various source areas to a single drainage area. To evaluate its complex deposition process, Anderson (Reference Anderson1957) put forth two questions about the multiprovenance system: (1) how do the parts and characteristics of watersheds contribute to sediment yield and (2) how well can we predict the yield from the whole watershed? Many subsequent studies have focused on advanced methodologies to reveal their infilling process and S2S system. Nazari Samani et al. (Reference Nazari Samani, Wasson and Malekian2011) and Koiter et al. (Reference Koiter, Owens, Petticrew and Lobb2013) traced the sediment transport system by employing fallout radionuclides as fingerprints. Leeder et al. (Reference Leeder, Mack and Salyards1996) summarized the facies architecture of axial–transverse fluvial systems in grabens and determined their controlling factors after investigating the case study of the Rio Grande, New Mexico, USA. In addition, Kim et al. (Reference Kim, Connell, Steel, Smith and Paola2011) built a sediment mass balance model to interact with axial and transverse alluvial systems in a subsiding basin, which was an ideal method to study the S2S system of multiprovenance systems. Currently, with the above methodology regarding the provenance area, providing mineral assemblage and U–Pb data, the S2S problem in the multiprovenance system in some areas has been solved, especially for rift basins (Connell et al. Reference Connell, Kim, Paola and Smith2012; Wu et al. Reference Wu, Mei, Liu, Luo, Min, Lu, Li and Guo2017; Liang et al. Reference Liang, Xie, He, Chen, Yu, Zhang, Mi, Lu, Tian, Zhang, Li and Zhou2020; Sun et al. Reference Sun, Zhu, Xu, Yang and Du2020; Fu et al. Reference Fu, Yu, Li, Peng and Shi2021 b). As Sømme et al. (Reference Sømme, Helland Hansen, Martinsen and Thurmond2009 b) and Nyberg et al. (Reference Nyberg, Helland-Hansen, Gawthorpe, Sandbakken, Eide, Sømme and Leiknes2018) study, they sorting the S2S system into three types, steep, short and deep systems, wide and deep ones and wide and shallow ones. The above two types area characterized by high relief, while the last one is presented as a limited accommodation space area. Due to low-accommodation space, sediments are hardly preserved, and S2S system reconstruction is more difficult (Allen & Fielding, Reference Allen and Fielding2007; Spengler & Read, Reference Spengler and Read2010; Halla et al. Reference Halla, Dominguez and Corrêa-Gomes2020; Olariu et al. Reference Olariu, Zhou, Steel, Zhang, Yuan, Zhang, Chen, Cheng and Kim2021). Furthermore, basins with low-accommodation space are characterized by rapid and frequent lake level changes (Allen & Fielding, Reference Allen and Fielding2007; Olariu et al. Reference Olariu, Zhou, Steel, Zhang, Yuan, Zhang, Chen, Cheng and Kim2021), which may complicate the reconstruction of the S2S system.
This study investigates the Permian interval of the Ordos Basin (Figure 1) as a case study to show the multiple sediment source infilling and interaction processes in a low-accommodation basin. The southeastern Ordos (SE Ordos) Basin underwent a spatial and temporal transgression/regression process during the late Paleozoic (Fu et al. Reference Fu, Li, Li and Xu2021 a), and multiple sediment types or rock types or a broad spectrum of grain sizes or mineralogy were input into the drainage basin (Zhou et al. Reference Zhou, Jiao and Zhao2017; Shi et al. Reference Shi, Huang, Chen, Jiu and Li2020; Chen et al. Reference Chen, Wang, Li, Evans, Chen and Wei2021). Furthermore, Zhu et al. (Reference Zhu, Chen, Liu and He2008) noted that the eastern part of the SE Ordos Basin was confined by the surrounding uplift in a semiclosed setting, while the topography of the west SE Ordos Basin was flat. They noted that terrain differences may be a key factor in the various depositional processes in basins with low-accommodation space, such as the Ordos Basin. A comparison of sediment-merging processes in various settings provided us with the opportunity to evaluate the influence of the drainage setting on multiple sediment source interaction processes within a basin with low-accommodation space. In this study, we first identified the provenance area of the multiple sediment source area by analyzing detrital zircon U–Pb data and heavy mineral assemblages (HMAs), identified the transport pathway via seismic interpretation and calculated the sediment supply to the dispersal area. Then, we reconstructed the environment and relative sea level curve according to the trace element ratios and δ18O and δ13C values. Based on insight from the various lithofacies associations and mineral composition for different types of multiple sediment source areas, we infer their controlling factors, which were developed quantitatively, in the source-to-sink system.
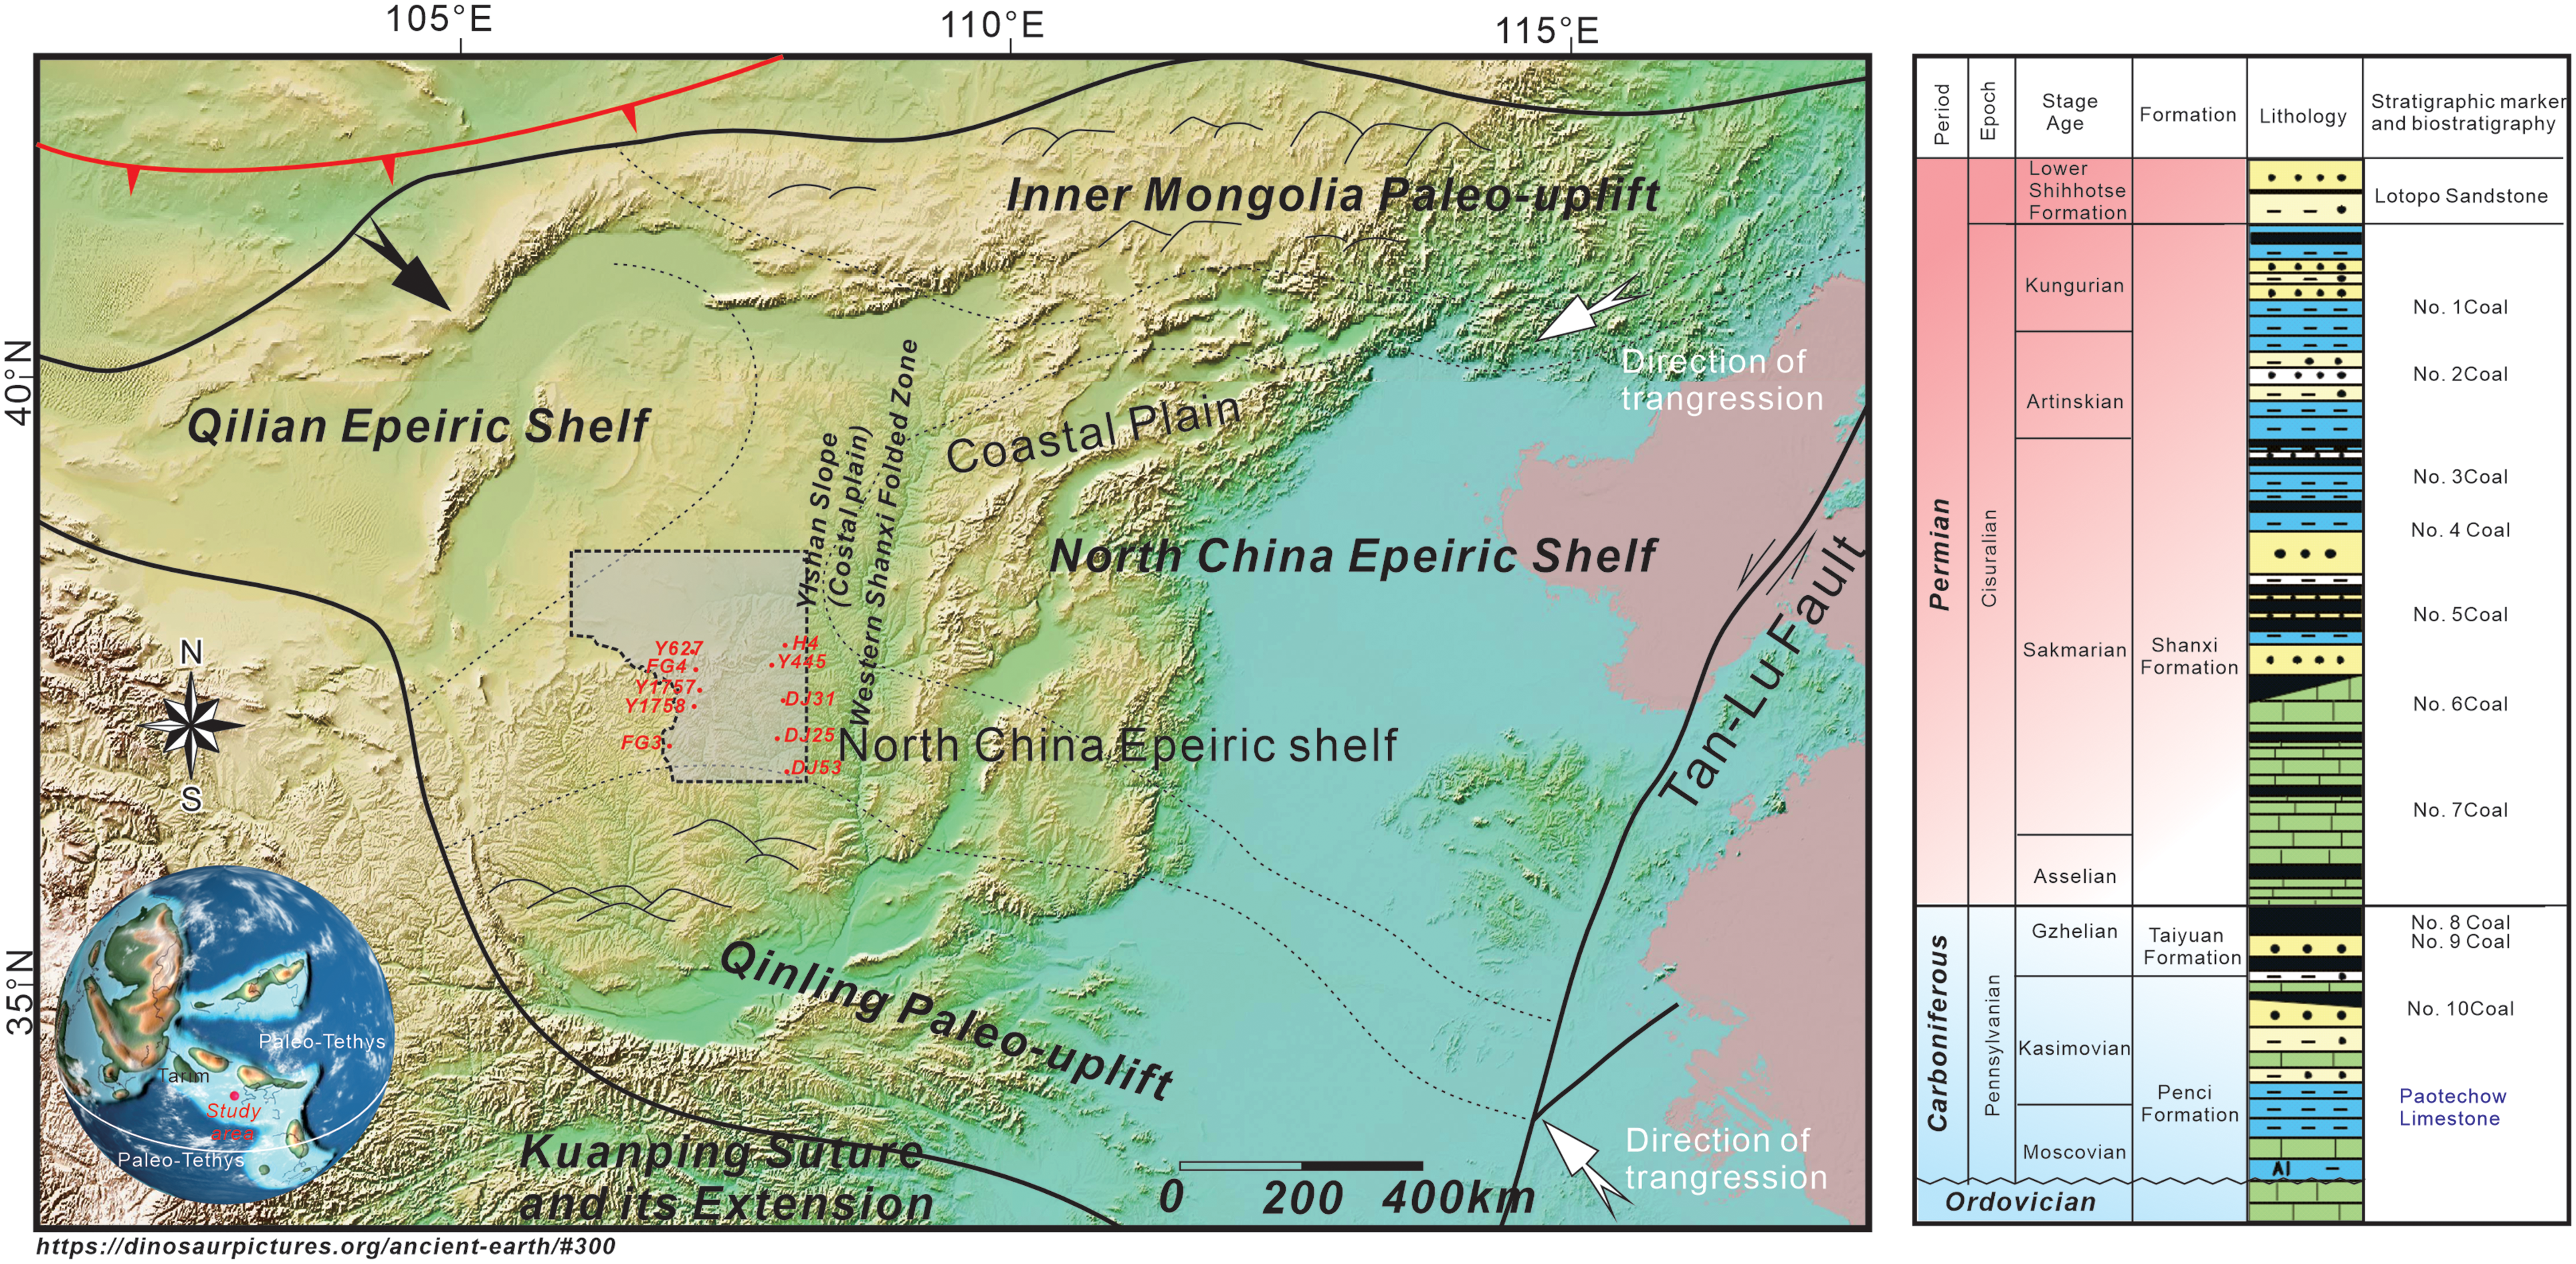
Geomorphological map of the North China Block and the location of the Ordos Basin in global view (http://dinosaurpictures.org/ancient-earth/). The paleogeographic distribution and the direction of the transgression are referred to in the studies of Yang et al. (Reference Yang, Li and Ma2005) and Fu et al. (Reference Fu, Yu, Li, Peng and Shi2021 b). On the left, the generalized stratigraphic column is shown. Seismic data calibration and stratigraphic markers reference the study of Zhu et al. (Reference Zhu, Chen, Liu and He2008). From bottom to top: Benxi Formation, Taiyuan Formation, Shanxi Formation and lower Shihezi Formation. The background transition from blue to red indicates a transition from a glacial to an interglacial period.

2. Geological setting
As the most critical energy production area and the second largest petroliferous basin in China, the Ordos Basin is located in the central part of the Sino-Korea block and is bordered by the Yinshan, Lvliang, Qinling and Helan orogenic belts (Zhang et al. Reference Zhang, Diwu, Kröner, Sun, Luo, Li, Gou, Lin, Wei and Zhao2015; Fu et al. Reference Fu, Yu, Li, Peng and Shi2021 b) (Figure 1). The evolution of the Ordos Basin can be divided into five main stages: it initiated as a Cambrian–Early Ordovician continental margin basin and evolved into an intracratonic basin within a Middle Ordovician–Middle Triassic generally convergent setting; during the Late Triassic–Early Cretaceous, the basin was affected by thermal subsidence before being inverted and eroded during a Late Cretaceous to Neogene orogenic event (only some Cenozoic loess is preserved in the southern part of the basin).
The sedimentary sequence that is preserved in the SE Ordos Basin ranges from 7 km to 10 km in thickness (Yang et al. Reference Yang, Li and Ma2005). During the Ordovician to Mississippian, a sedimentary hiatus occurred due to tectonic activity-induced uplift of the eastern margin of the Ordos Basin (Jiang et al. Reference Jiang, Xu and Wang2012; Fu et al. Reference Fu, Yu, Li, Peng and Shi2021 b). Then, during the late Paleozoic, the Pennsylvanian Benxi Formation, early Permian Taiyuan and Shanxi Formations, middle Permian Shihezi Formation and late Permian Shiqianfeng Formation developed in the Ordos Basin (Yang et al. Reference Yang, Li and Ma2005; Chen et al. Reference Chen, Wang, Li, Evans, Chen and Wei2021; Fu et al. Reference Fu, Yu, Li, Peng and Shi2021 b) (Figure 1). In this study, we focus on the Permian stratigraphic framework, and the interval can be divided into three stages, namely, the Asselian, Sakmarian and Artinskian stages (Sun et al. Reference Sun, Zeng, Liu, Cui and Wang2014).
The Benxi and Taiyuan Formations record a sharp regression process associated with the uplift of the central part of the Ordos Basin, as well as their facies association change from a marine setting to a coastal swamp environment (Jiang et al. Reference Jiang, Xu and Wang2012; Yang et al. Reference Yang, Jin, van Loon, Han and Fan2017). During the deposition of the upper Shanxi Formation, as the convergence of the South China and North China plates occurred, the formation of the Qinling Orogenic Belt led to the mass deposition of sediments in the SE Ordos Basin, and this accumulation merged with the continuous supply of sediments from the Yinshan orogenic belt and the southern margin of the North China Craton (NCC) (Figure 2) (Yang et al. Reference Yang, Li and Ma2005; Zhang et al. Reference Zhang, Zhao, Song, Yang, Hu and Wu2007; Zhao et al. Reference Zhao, Jahn, Xu, Liao and Wang2016; Shi et al. Reference Shi, Huang, Chen, Jiu and Li2020; Chen et al. Reference Chen, Wang, Li, Evans, Chen and Wei2021). Moreover, the fast sediment supply and low rate of increase in accommodation space within the merged multiple sediment region provide an ideal case study to explore the merging and interaction processes in a basin with low-accommodation space (Zhang et al. Reference Zhang, Sun and Yin1997; Zhu et al. Reference Zhu, Chen, Liu and He2008; Fu et al. Reference Fu, Yu, Li, Peng and Shi2021 b).
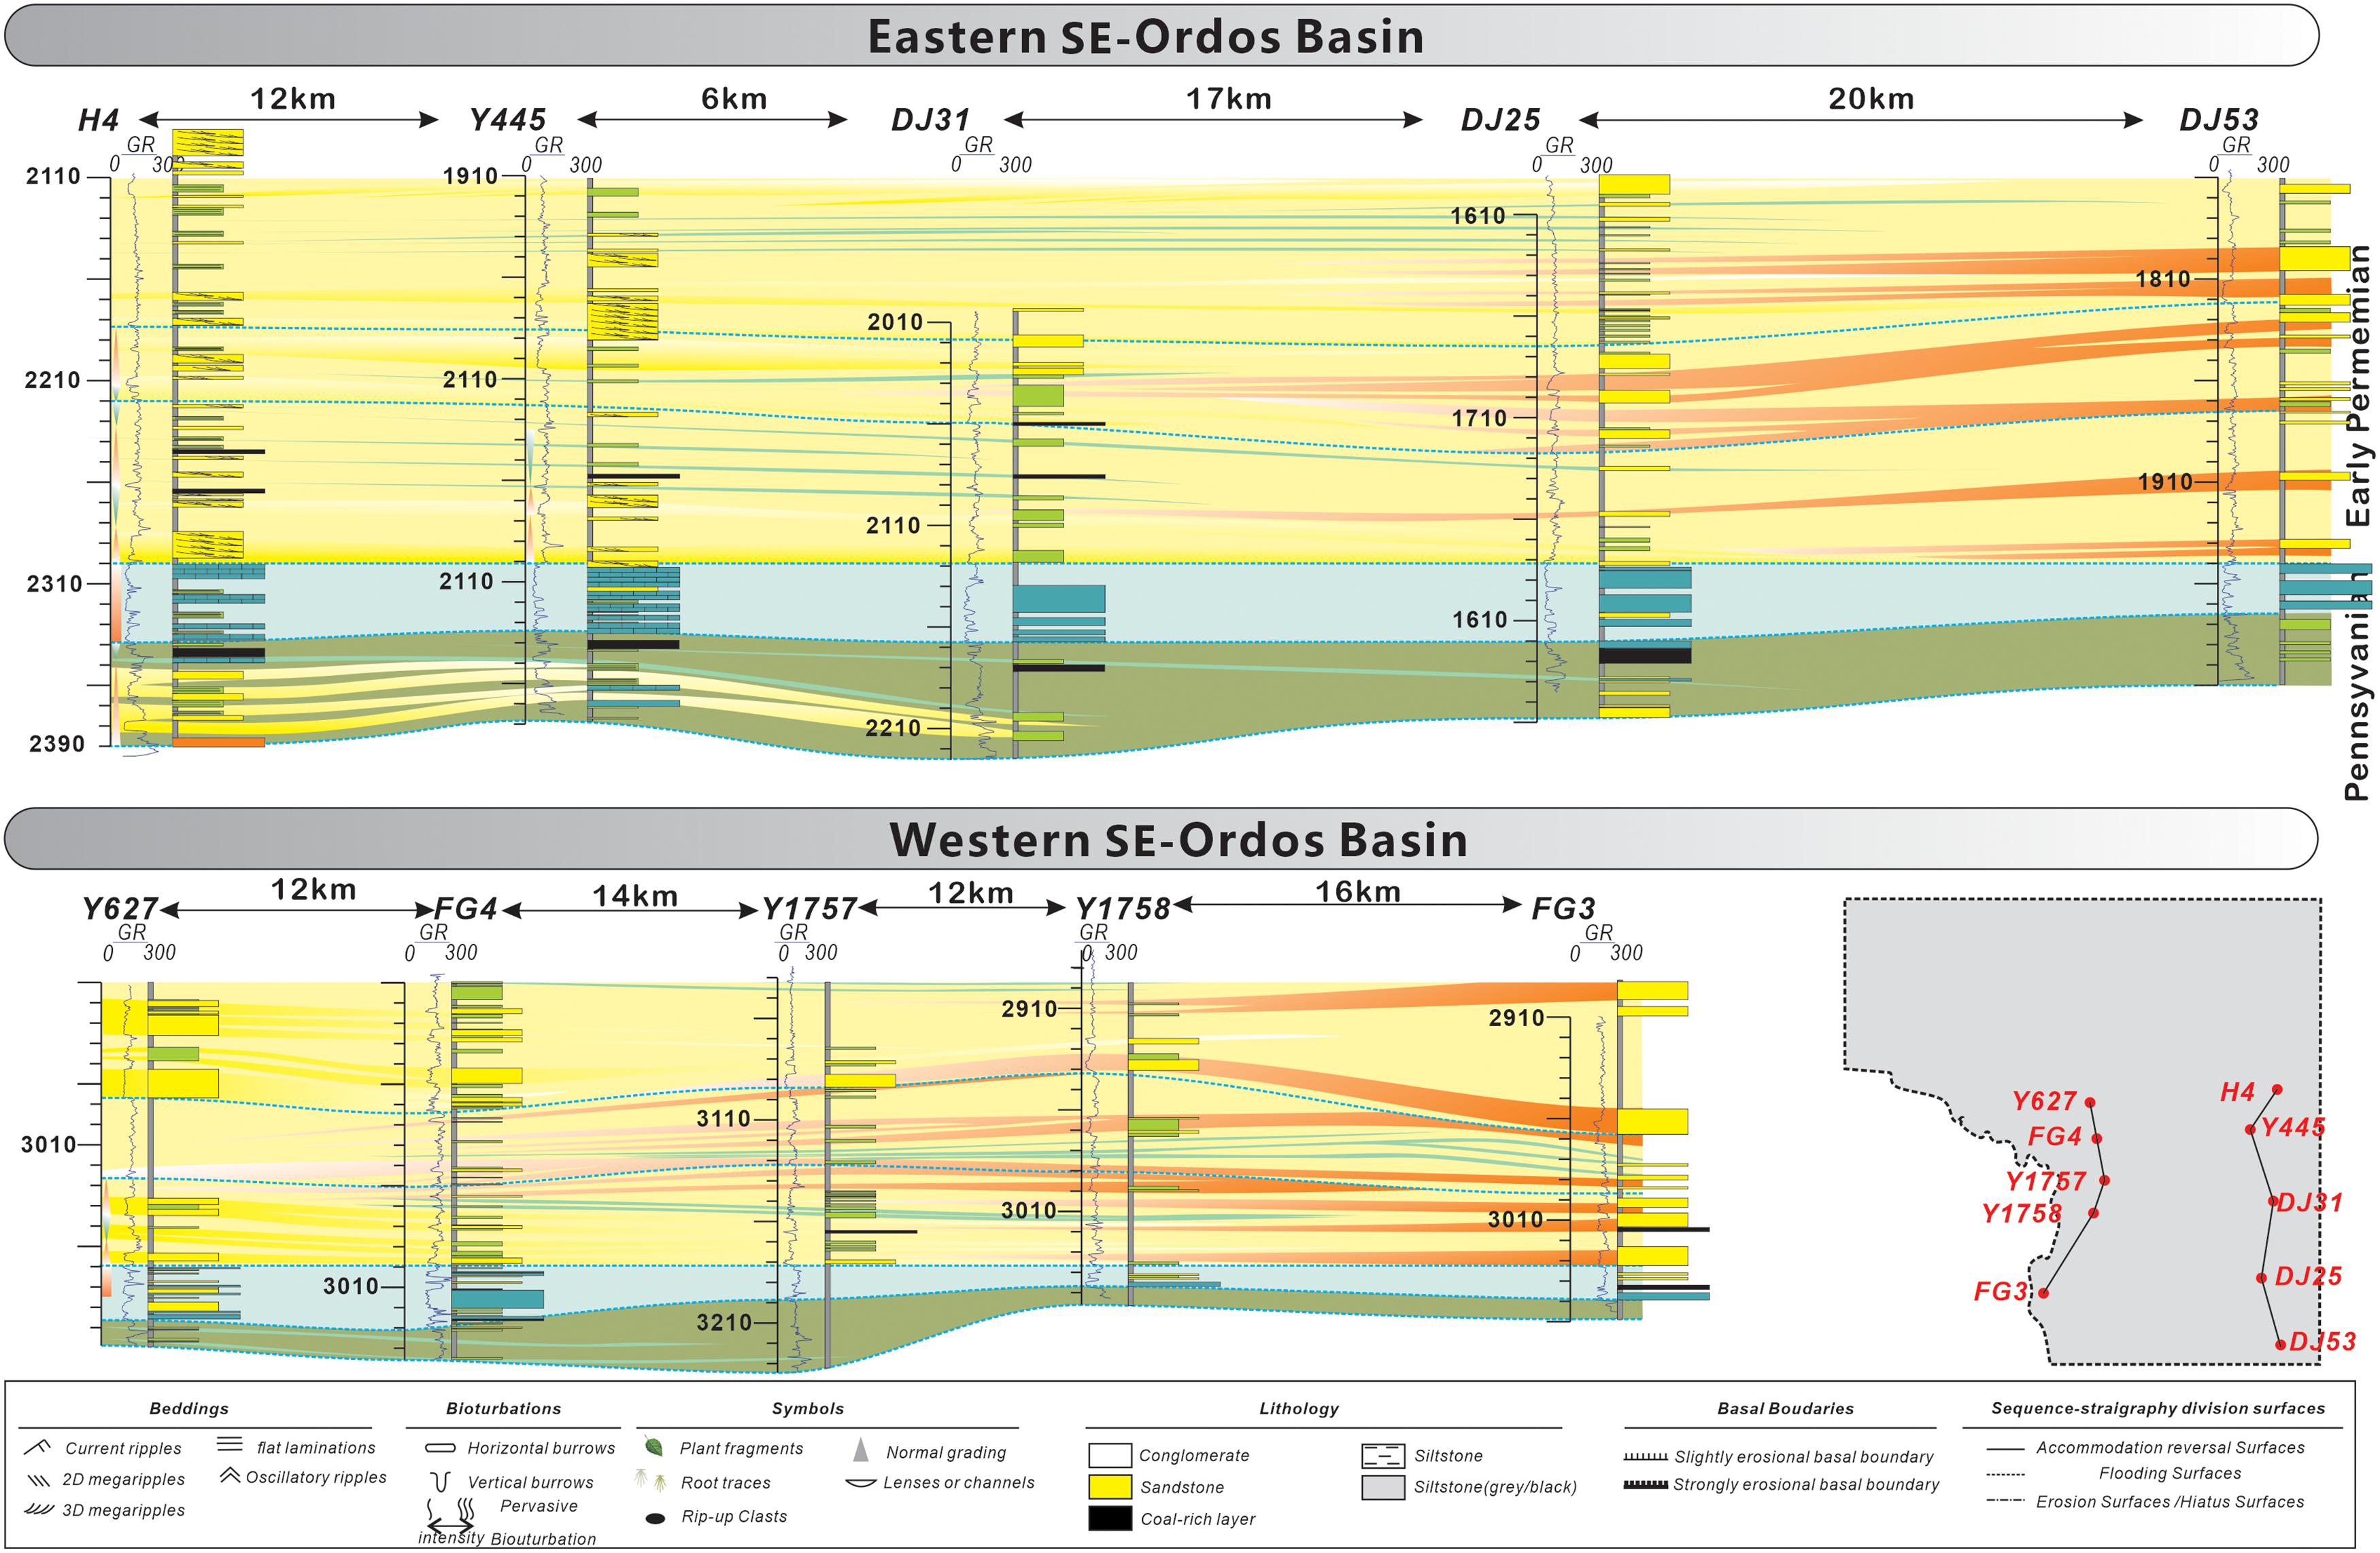
Two wells with N–S directional cross-sections crossing the eastern and western SE Ordos Basin. The upper section shows sediments merged in the eastern part, and the lower section shows sediments merged in the western part. The sand pinching out towards the south is shown in yellow, and the sand body pinching out towards the north is shown in orange. The green sand body shows the thin interdistributary channel deposited.

3. Data and method
The study is covered by 1200 km of 2D seismic data and 1000 km2 of 3D high-resolution seismic data (shown in Figure 1). The dominant frequencies of the seismic data are up to 30 Hz, which corresponds to a body’s spatial resolution of up to 30 m. For this study, ten wells drilled in the SE Ordos Basin were selected, and the positions of the seismic cross-sections of the wells are shown in Figure 1. The well log curves included gamma ray, sonic (AC) and spontaneous potential logs. The well logs were acquired from and processed by Schlumberger®. We acquired core samples from wells Y1758, Y728, Y694, G2, DJ53 and G6 200 m in the vertical direction. The heavy mineral composition, trace element and rare element composition analyses were conducted by the North China Petroleum Bureau, Sinopec Corporation, PetroChina Corporation and Yanchang Petroleum Corporation.
Laser ablation–inductively coupled plasma–mass spectrometry (LA–ICP–MS) U–Pb analysis of detrital zircons from six core samples (samples from cores DJ53, DJ51 and Liulin in the eastern SE Ordos Basin and cores A44, A43 and KF-01 in the central SE Ordos Basin) was completed by the Chinese Academy of Geological Sciences (Appendix Tables). Laser ablation was conducted using an NWR193UC 193 nm deep-ultraviolet laser ablation sampling system (Elemental Scientific Lasers, USA). An Agilent 7900 inductively coupled plasma mass spectrometer (Agilent, USA) was used. One hundred twenty detrital zircons from each sample were analyzed, with a spot size of 30 µm. Every five analyses were followed by one analysis of standard zircon 91500, and GJ-Common lead correction was conducted using ComPbCorr#3_15G. The U–Pb age calculations and concordia diagram were completed using IsoplotR software provided by University College London, UK (http://pieter-vermeesch.es.ucl.ac.uk/shiny/IsoplotR/). Only zircon ages concordant within 90%-110% are considered in the discussion section.
δ18O and δ13C data were analyzed from bulk-sediment mudstone, limestone or coal samples in cores DJ53 and XF8 by mass spectrometry (some carbonate-poor layers did not provide reliable data, and the results are not reported). The C and O isotope analysis results are normalized to the Pee Dee Belemnite (PDB) standards, with a precision of ±0.1‰ for δ13C and ±0.2‰ for δ18O.
3.1 Multiprovenance area identification
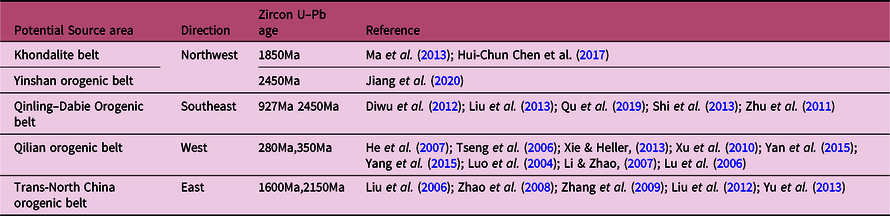
To determine the provenance, this study integrates the original zircon U–Pb data and HMA in the SE Ordos Basin. For the U–Pb age, the detrital zircon U–Pb age distribution for the SE Ordos Basin sink area was established and compared with potential source areas (Figure 1), including the Khondalite belt and Yinshan orogenic belt, Qinling–Dabie Orogenic belt, Qilian orogenic belt and Trans-North China orogenic belt, based on the analysis of the geological map shown in Zhao et al. (Reference Zhao, Sun, Wilde and Sanzhong2005) (Table 1).
Potential source areas around the SE Ordos Basin

Moreover, the HMA and its index were combined to help evaluate the potential source area. The HMA index was calculated by using the zircon–tourmaline–rutile (ZTR) index, garnet–zircon (GZi) index and apatite–tourmaline (ATi) index (Morton & Hallsworth, Reference Morton and Hallsworth1994; Morton & Berge, Reference Morton and Berge1995).
3.2 Paleoenvironmental reconstruction and local relative sea level reconstruction
This study determines the paleosalinity according to elemental ratios, including Sr/Ba and V/(V+Ni). The Sr and Ba concentrations indicate various offshore salinity conditions (Langmuir & Melchior, Reference Langmuir and Melchior1985). We use the Sr/Ba ratio to reconstruct the paleosalinity, where a value of Sr/Ba ranging from 0 to 0.5 indicates a freshwater setting, a value between 0.5 and 1 indicates a brackish setting, and a value greater than 1 indicates a saltwater environment (Langmuir & Melchior, Reference Langmuir and Melchior1985). Then, as Hatch & Leventhal (Reference Hatch and Leventhal1992) point out, the V/(V+Ni) ratio can serve as an index of the oxidation conditions, where the ratio of vanadium and nickel (V/(V + Ni)) lies between 0.84 and 0.89, indicating obvious stratification of the water column and an anaerobic environment, while a value < 0.6 shows weak stratification and oxygen-rich conditions. Furthermore, referring to the sequence stratigraphy theory, they point out that a fining-upward bed indicates a rising sea level; otherwise, a coarsening-upward bed means a decreasing sea level. Thus, we build the regional sea-level fluctuation by referring to the vertical change in the grain size.
3.3 Paleomorphology and source-to-sink parameter statistics
The catchment relief is available from the paleo-topography reconstruction. This can be divided into three steps. First, after well logs are calibrated, we interpret the 2D and 3D seismic data and acquire the two travel times (TWTs) of the contact surface. Then, the TWTs are transferred to depths according to the following equation: Depth=0.85×TWT+115 (Li et al. Reference Li, Zhang, Xie, Shi, Wang, Li, Liu and Jing2020). Finally, as the shale deposits have a much higher compaction coefficient than sandstone, the strata thickness is decompacted according to the studies conducted by Zhang et al. (Reference Zhang, Sun, Wang and Yu1998), whose compaction coefficients are 0.0003-1 m for mudstone and 0.0001-1 m for sandstone.
To characterize the source-to-sink system evolution, we calculate the fluvial–deltaic sediment supply in this study. We derive the maximum sand depositional rate (vmsd =A/T) according to the time constraints (T) obtained from the geochronology data from reference wells and the cross-sectional areas of the channel bends (A) from 2D seismic profiles.
3.4 Reconstruction of the sediment infilling process in the merged zone
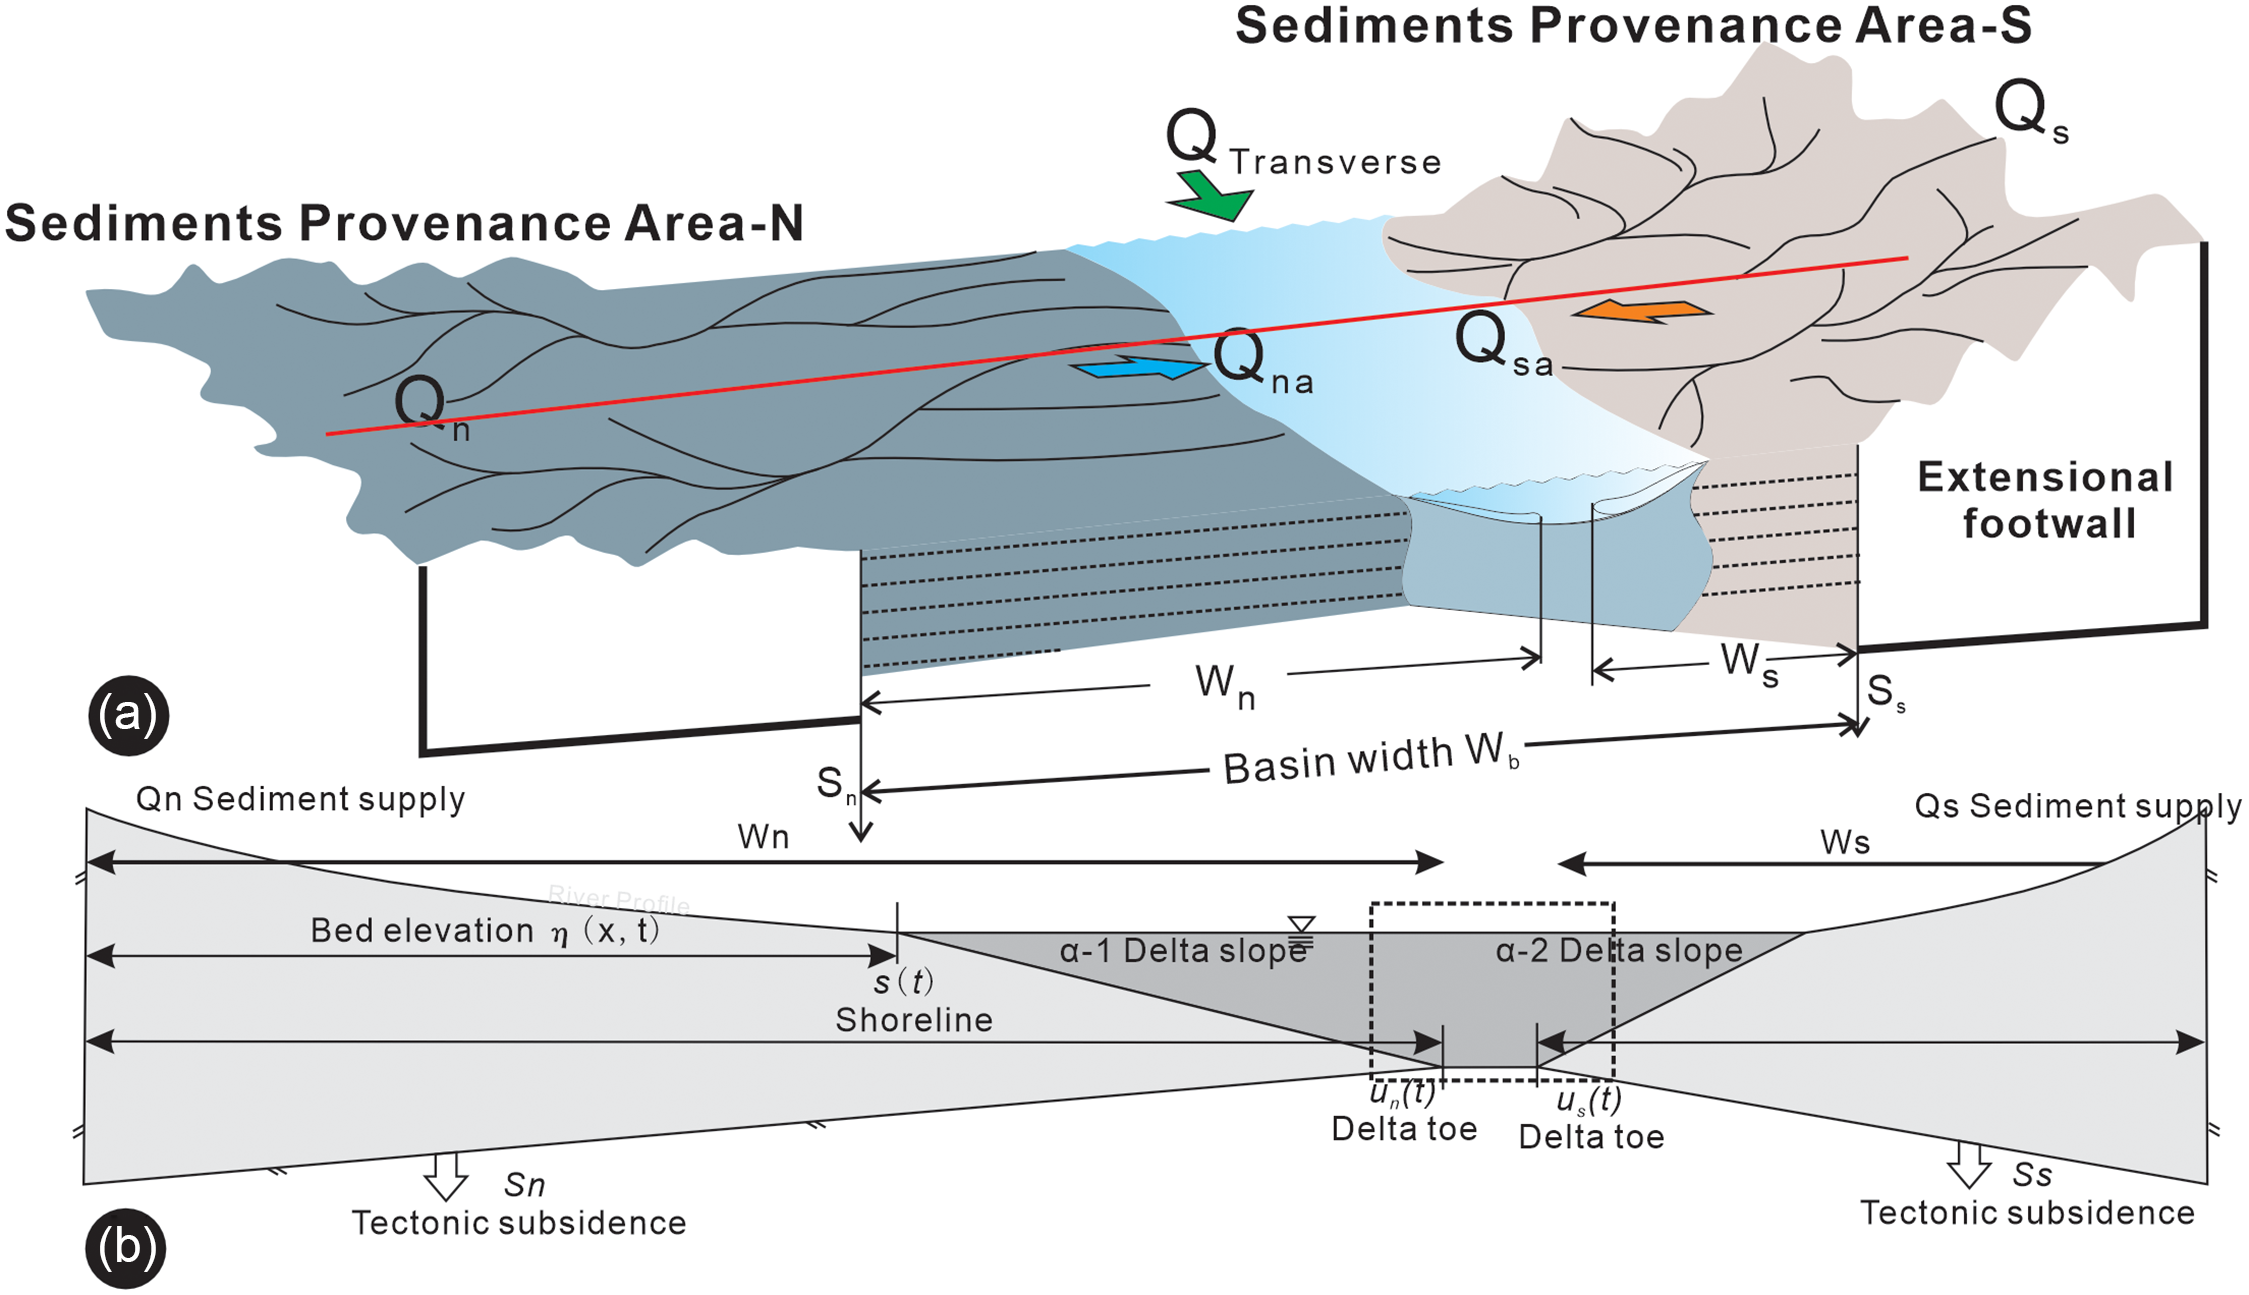
This study refers to the Kim et al. (Reference Kim, Connell, Steel, Smith and Paola2011) method for studying axial and transverse channel systems (Figure 3(a)). They introduced a model that quantitatively evaluated the routing system. The sediment budget from the source area and that in the sink area were compared to understand the dynamics of sediment routing systems. If the ratio between the sediment budget in the source area and that in the sink area is equal to 1, it indicates an intense merging process or slope failure; otherwise, it indicates a gentle merging process during the formation of multiple provenances. Accordingly, the evaluation model was divided into two steps.
Block diagrams illustrating the multiple sediment source merging and interaction processes. (a) The interaction process of the axial prograding delta system, which was modified by Kim et al. (Reference Kim, Connell, Steel, Smith and Paola2011). (b) A profile showing the responding source-to-sink system parameters of the routing system from multiprovenance areas. (c) A simplified version of the regional uplift or subsidence area morphology.

First, we identified the prograding bodies from the seismic data (they present as convex reflections in the profile) and measured their responding volume. The sum of the body’s volume indicates the sediment budgets in the sink area (Q).
Then, as the sediments from the source area (Qa), we obtained that value by referring to the mass balance model proposed by Paola & Martin (Reference Paola and Martin2012) and Michael et al. (Reference Michael, Whittaker and Allen2013) (Figure 3(b)). The sediment budget is given as follows:
 $$Qa = \mathop \int \nolimits_0^w Br\left( x \right)dx/\chi \left( x \right)$$
r(x) represents the thickness of the sediment layers, and this parameter can be calculated as r(x)=σ (x, t) + dη/dt (where σ (x, t) is the elevation caused by subsidence, and dη (x, t)/dt is the sediment–water interface). w is the migration distance from the hanging wall to the dispersal area, which is equal to the pathway length in the S2S system. B is the width of the merged area. χ(x) is the mass balance coordinate, which was introduced by Michael et al. (Reference Michael, Whittaker and Allen2013) and Hampson et al. (Reference Hampson, Duller, Petter, Robinson and Allen2014) and can serve as an index of the grain size distribution.
Furthermore, in equation (1), Q n can be calculated by seismic profile interpretation, and r(x) is static based on paleomorphological relief. Then, we can obtain χ (x) by the inverse function of equation (1) as follows:
 $$\chi \left( x \right) = \mathop \int \nolimits_0^w Br\left( x \right)dx/{Q_a}$$
In this study, we evaluated the ratio of coarse-grained deposits according to the χ (x) distribution, in which coarse-grained fan sediments dominated (χ(x) < 0.25), sandy prograded delta sediments dominated (0.25 < χ(x) < 0.75) and tidal or wavy sediments dominated (0.75 < χ(x) < 1.0) (Sheets et al. Reference Sheets, Hickson and Paola2002; Michael et al. Reference Michael, Whittaker, Carter and Allen2014).
4. Results
4.1 Lithofacies association and corresponding facies association
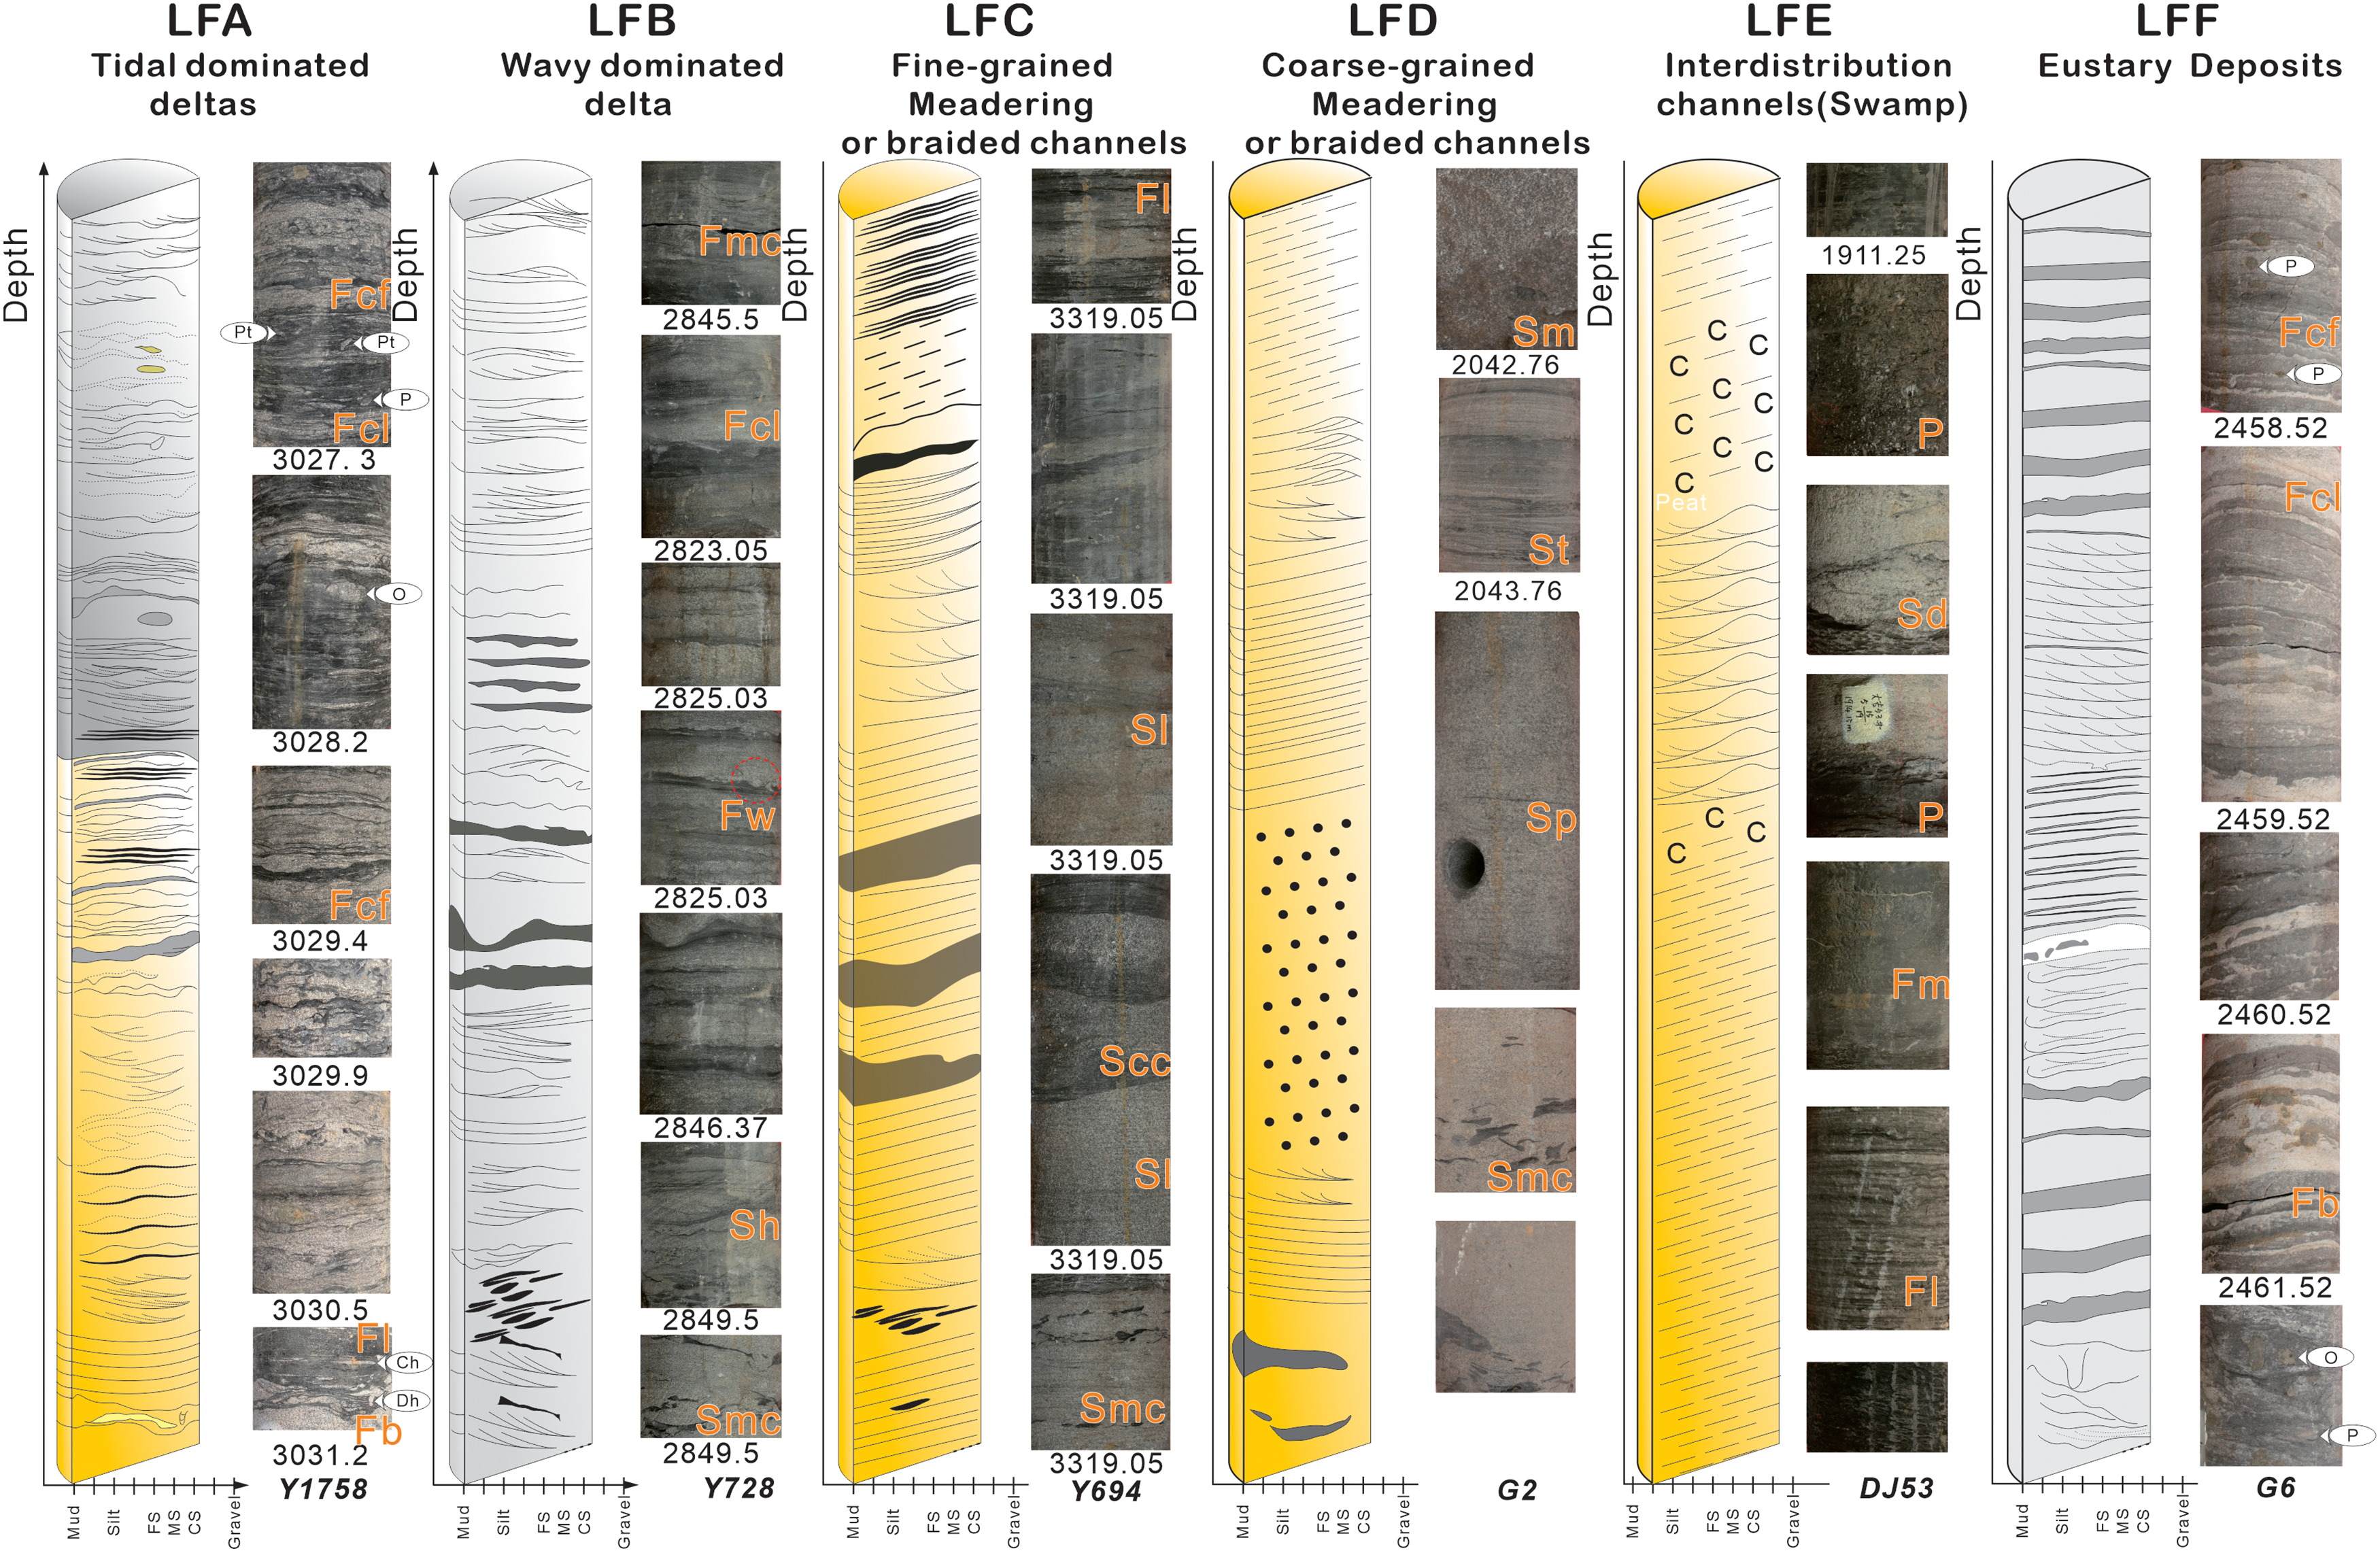
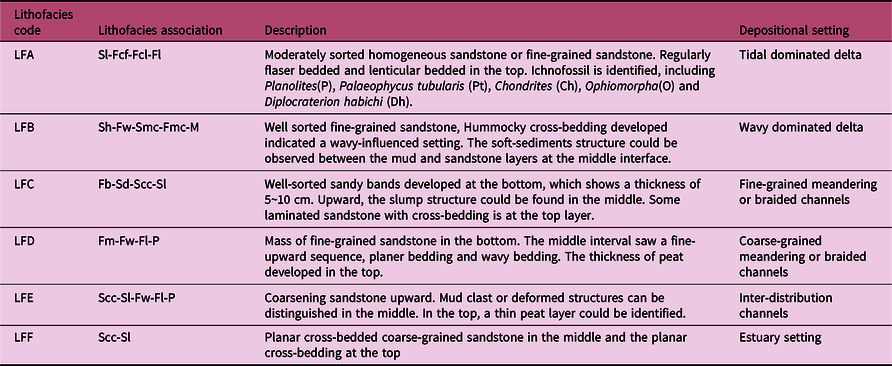
Of the core samples collected from the SE Ordos Basin (Figure 4), the grain size ranges from mud to coarse sand. Fourteen types of lithofacies are identified, as follows: lenticular bedded fine-grained sandstone (Fcl), flaser bedded fine-grained sandstone (Fcf), laminated fine-grained sandstone (Fl), fine-grained massive sandstone (Fm), sandy banded sandstone (Fb), fine-grained sandstone with mud clasts (Fmc), wavy bedded fine-grained sandstone (Fw), hummocky cross-bedded sandstone (Sh), sandstone with mud clasts (Smc), laminated sandstone (Sl), compound cross-bedded sandstone (Scc), sandstone with slump structures (Sd), peat (P) and massive mudstone (M). These lithofacies can be classified into six associations (for details, see Table 2).
Core samples Y1758, Y728, Y694, G2, DJ53 and G6. The samples in the column, from left to right, correspond to LFA, LFB, LFC, LFD, LFE and LFF, and their detailed descriptions can be found in Table 2. Silt = siltstone, F.S. = fine-grained sandstone, M.S. = medium-grained sandstone, C.S. = coarse-grained sandstone, P = Planolites, Pt = Paleophycus tubularis, Ch = Chondrites, O = Ophiomorpha, Dh = Diplocraterion habichi.

Lithofacies description and their responding deposition setting

4.2 Heavy mineral assemblage (HMA)
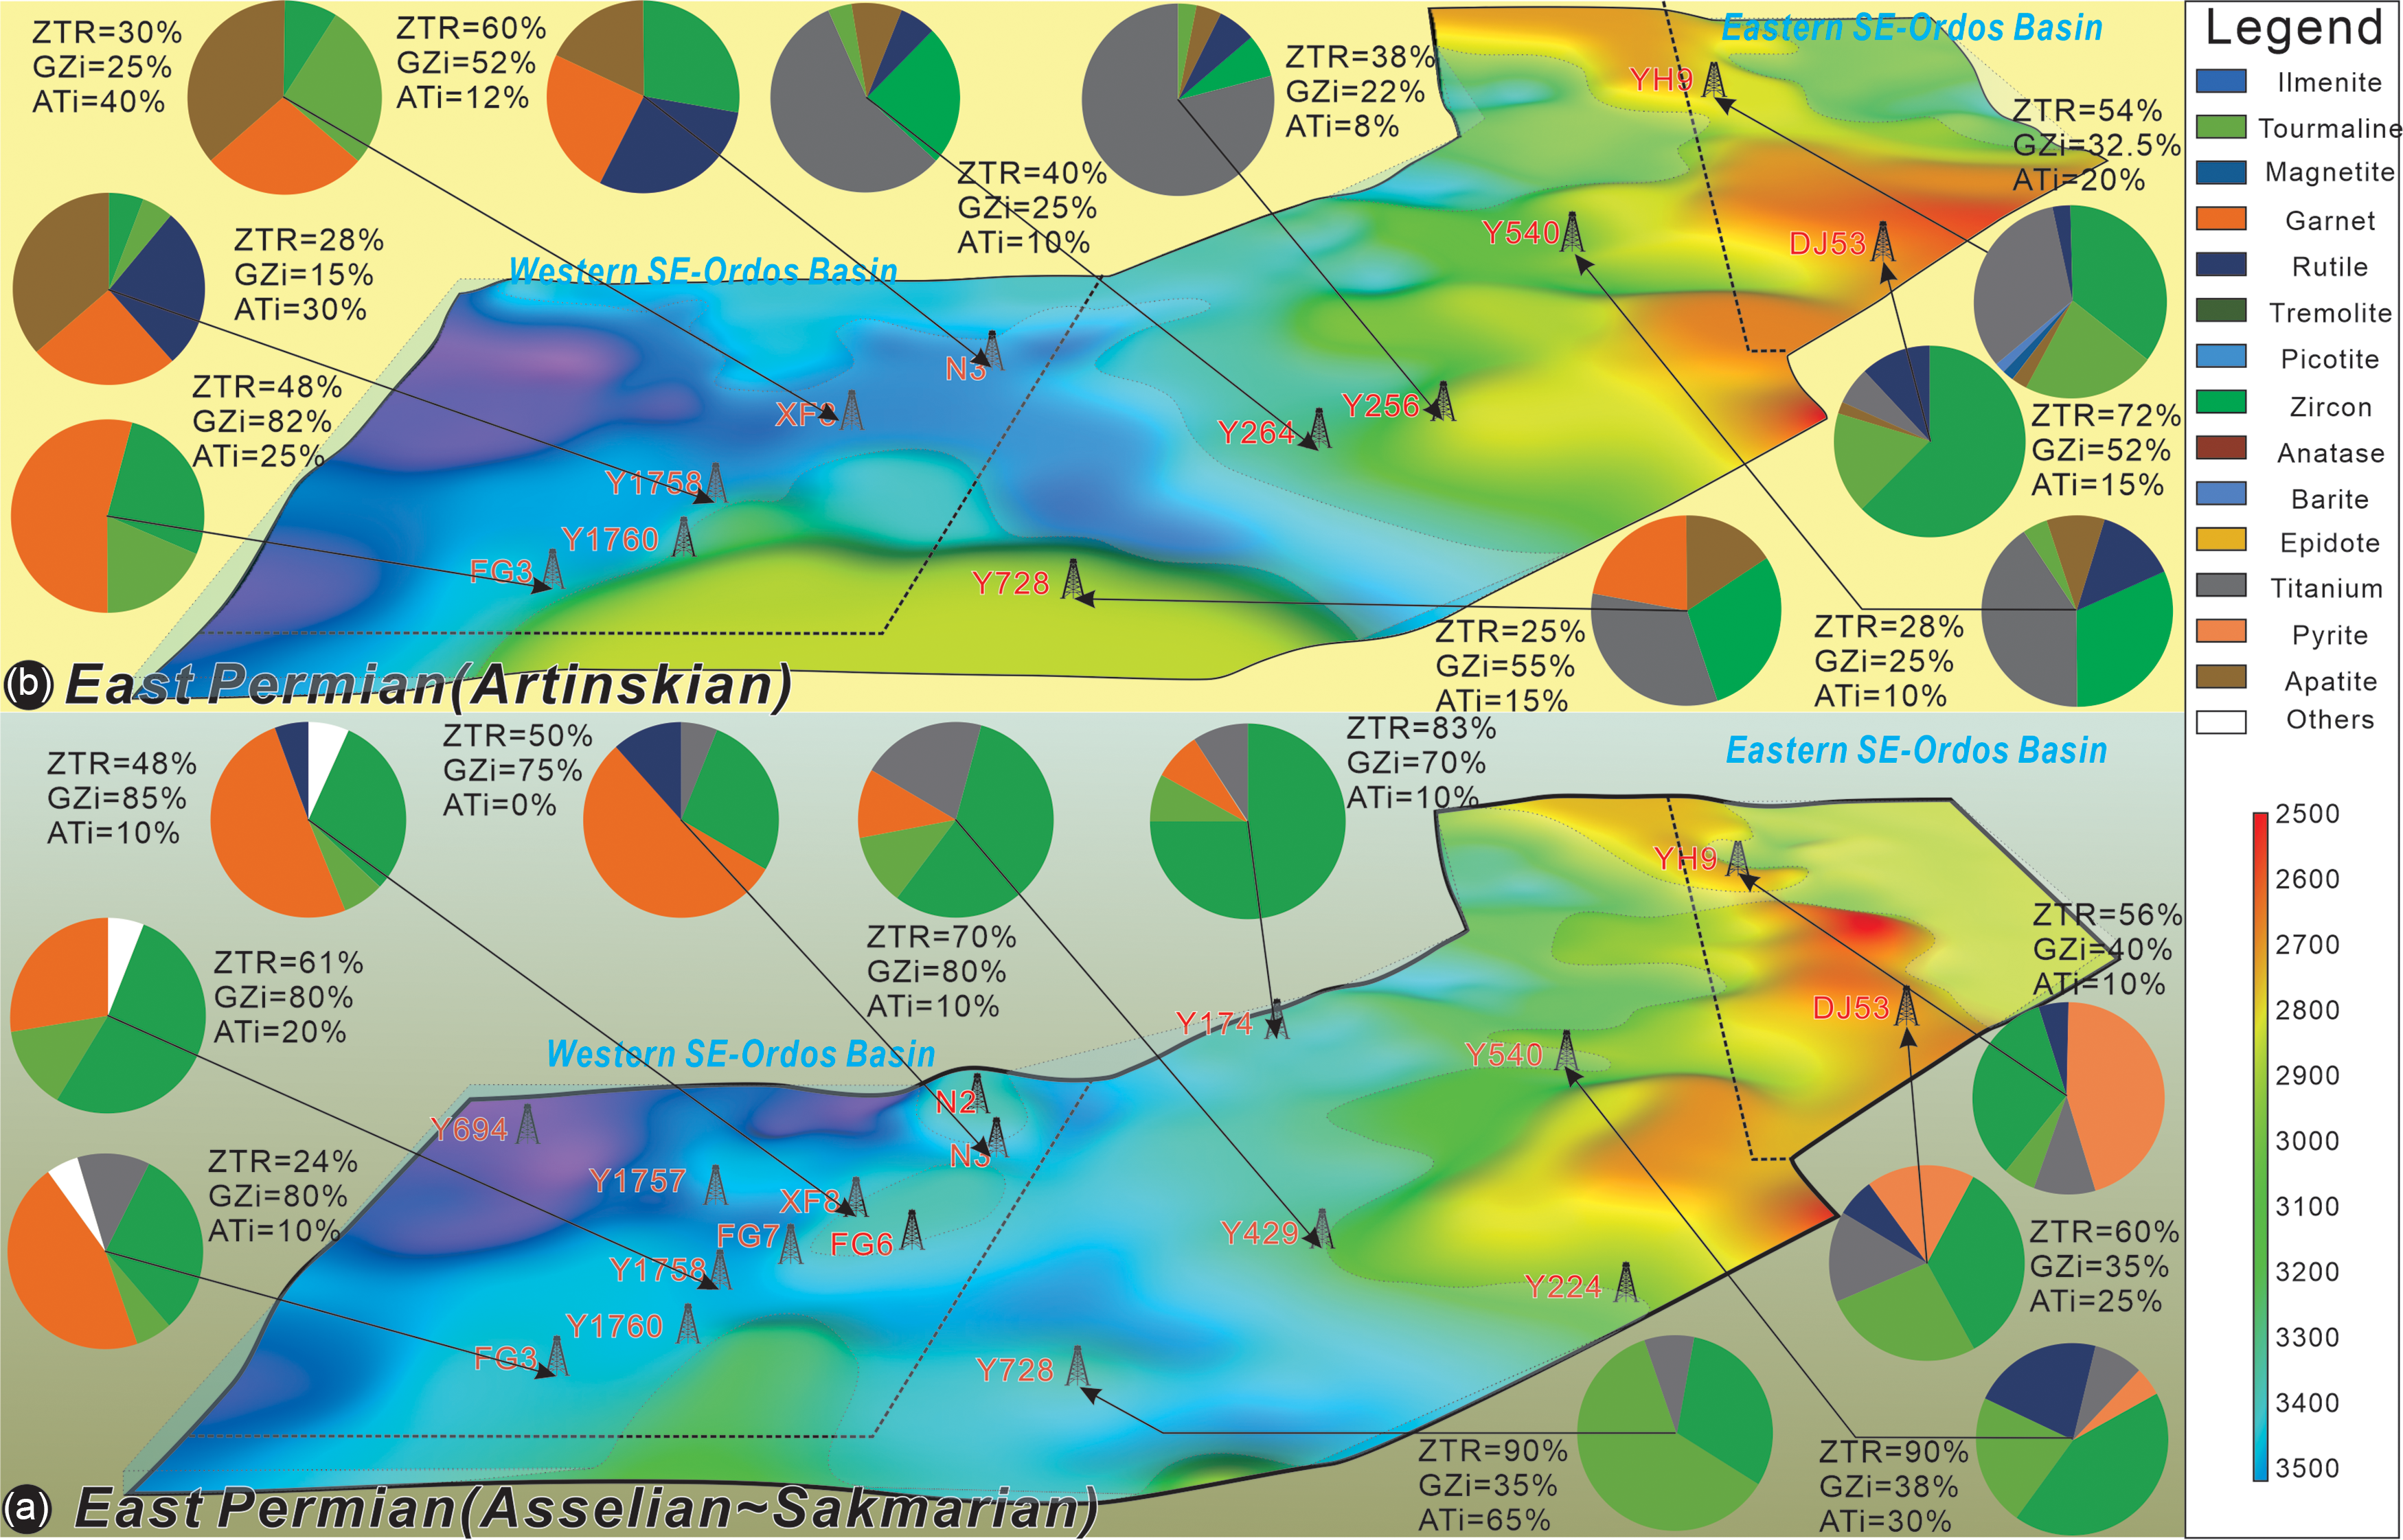
At the interval of the Asselian and Sakmarian stages, the samples’ heavy minerals show high contents of zircon, tourmaline, garnet, rutile, titanium and apatite. The HMA shows various spatial and temporal distributions during this period (Figure 5). During the Pennsylvanian, from the samples from wells YH9, DJ53 and Y540, the eastern part of the SE Ordos Basin has high zircon and tourmaline contents. For the central part of the SE Ordos Basin, the HMA is characterized by a high zircon content, and the ZTR and GZi indexes are both greater than 70% in wells Y429 and Y174. In the western part of the SE Ordos Basin, garnet and zircon are dominant in the HMA, with low ZTR and ATi indexes and GZi values.
Paleomorphology of the SE Ordos Basin, which is reconstructed via seismic data and deconstructed via calibrated wells. The blocks with black squares are the two study areas. The eastern block represents a semi closed setting, as the regional uplift surrounds it, and the western region shows a flat topography. The heavy mineral assemblage is plotted around the wells.

During the Artinskian stage, the HMA changed dramatically. Referring to the data from previous studies (Qu et al. Reference Qu, Ma, Cao, Mei and Miao2011; Chen et al. Reference Chen, Li, Liu, Li, Pang, Guo and Yuan2009; Fu et al. Reference Fu, Yu, Li, Peng and Shi2021 b), the HMA of wells YH9 and DJ53 in the east SE Ordos Basin shows a high ZTR index (greater than 50%), and these wells have high contents of zircon and titanium. The HMA of the wells in the central part of the SE Ordos Basin (Y264 and Y256) are mainly composed of titanium, and these wells show low ZTR, GZi and ATi indexes. The wells in the western Ordos Basin can be classified into two groups: the northern part (XF7 and N3) is characterized by high zircon, apatite and carnet contents, while the southern part (Y1758, Y728 and FG3) has high garnet, tourmaline and zircon contents.
4.2 Detrital zircon data
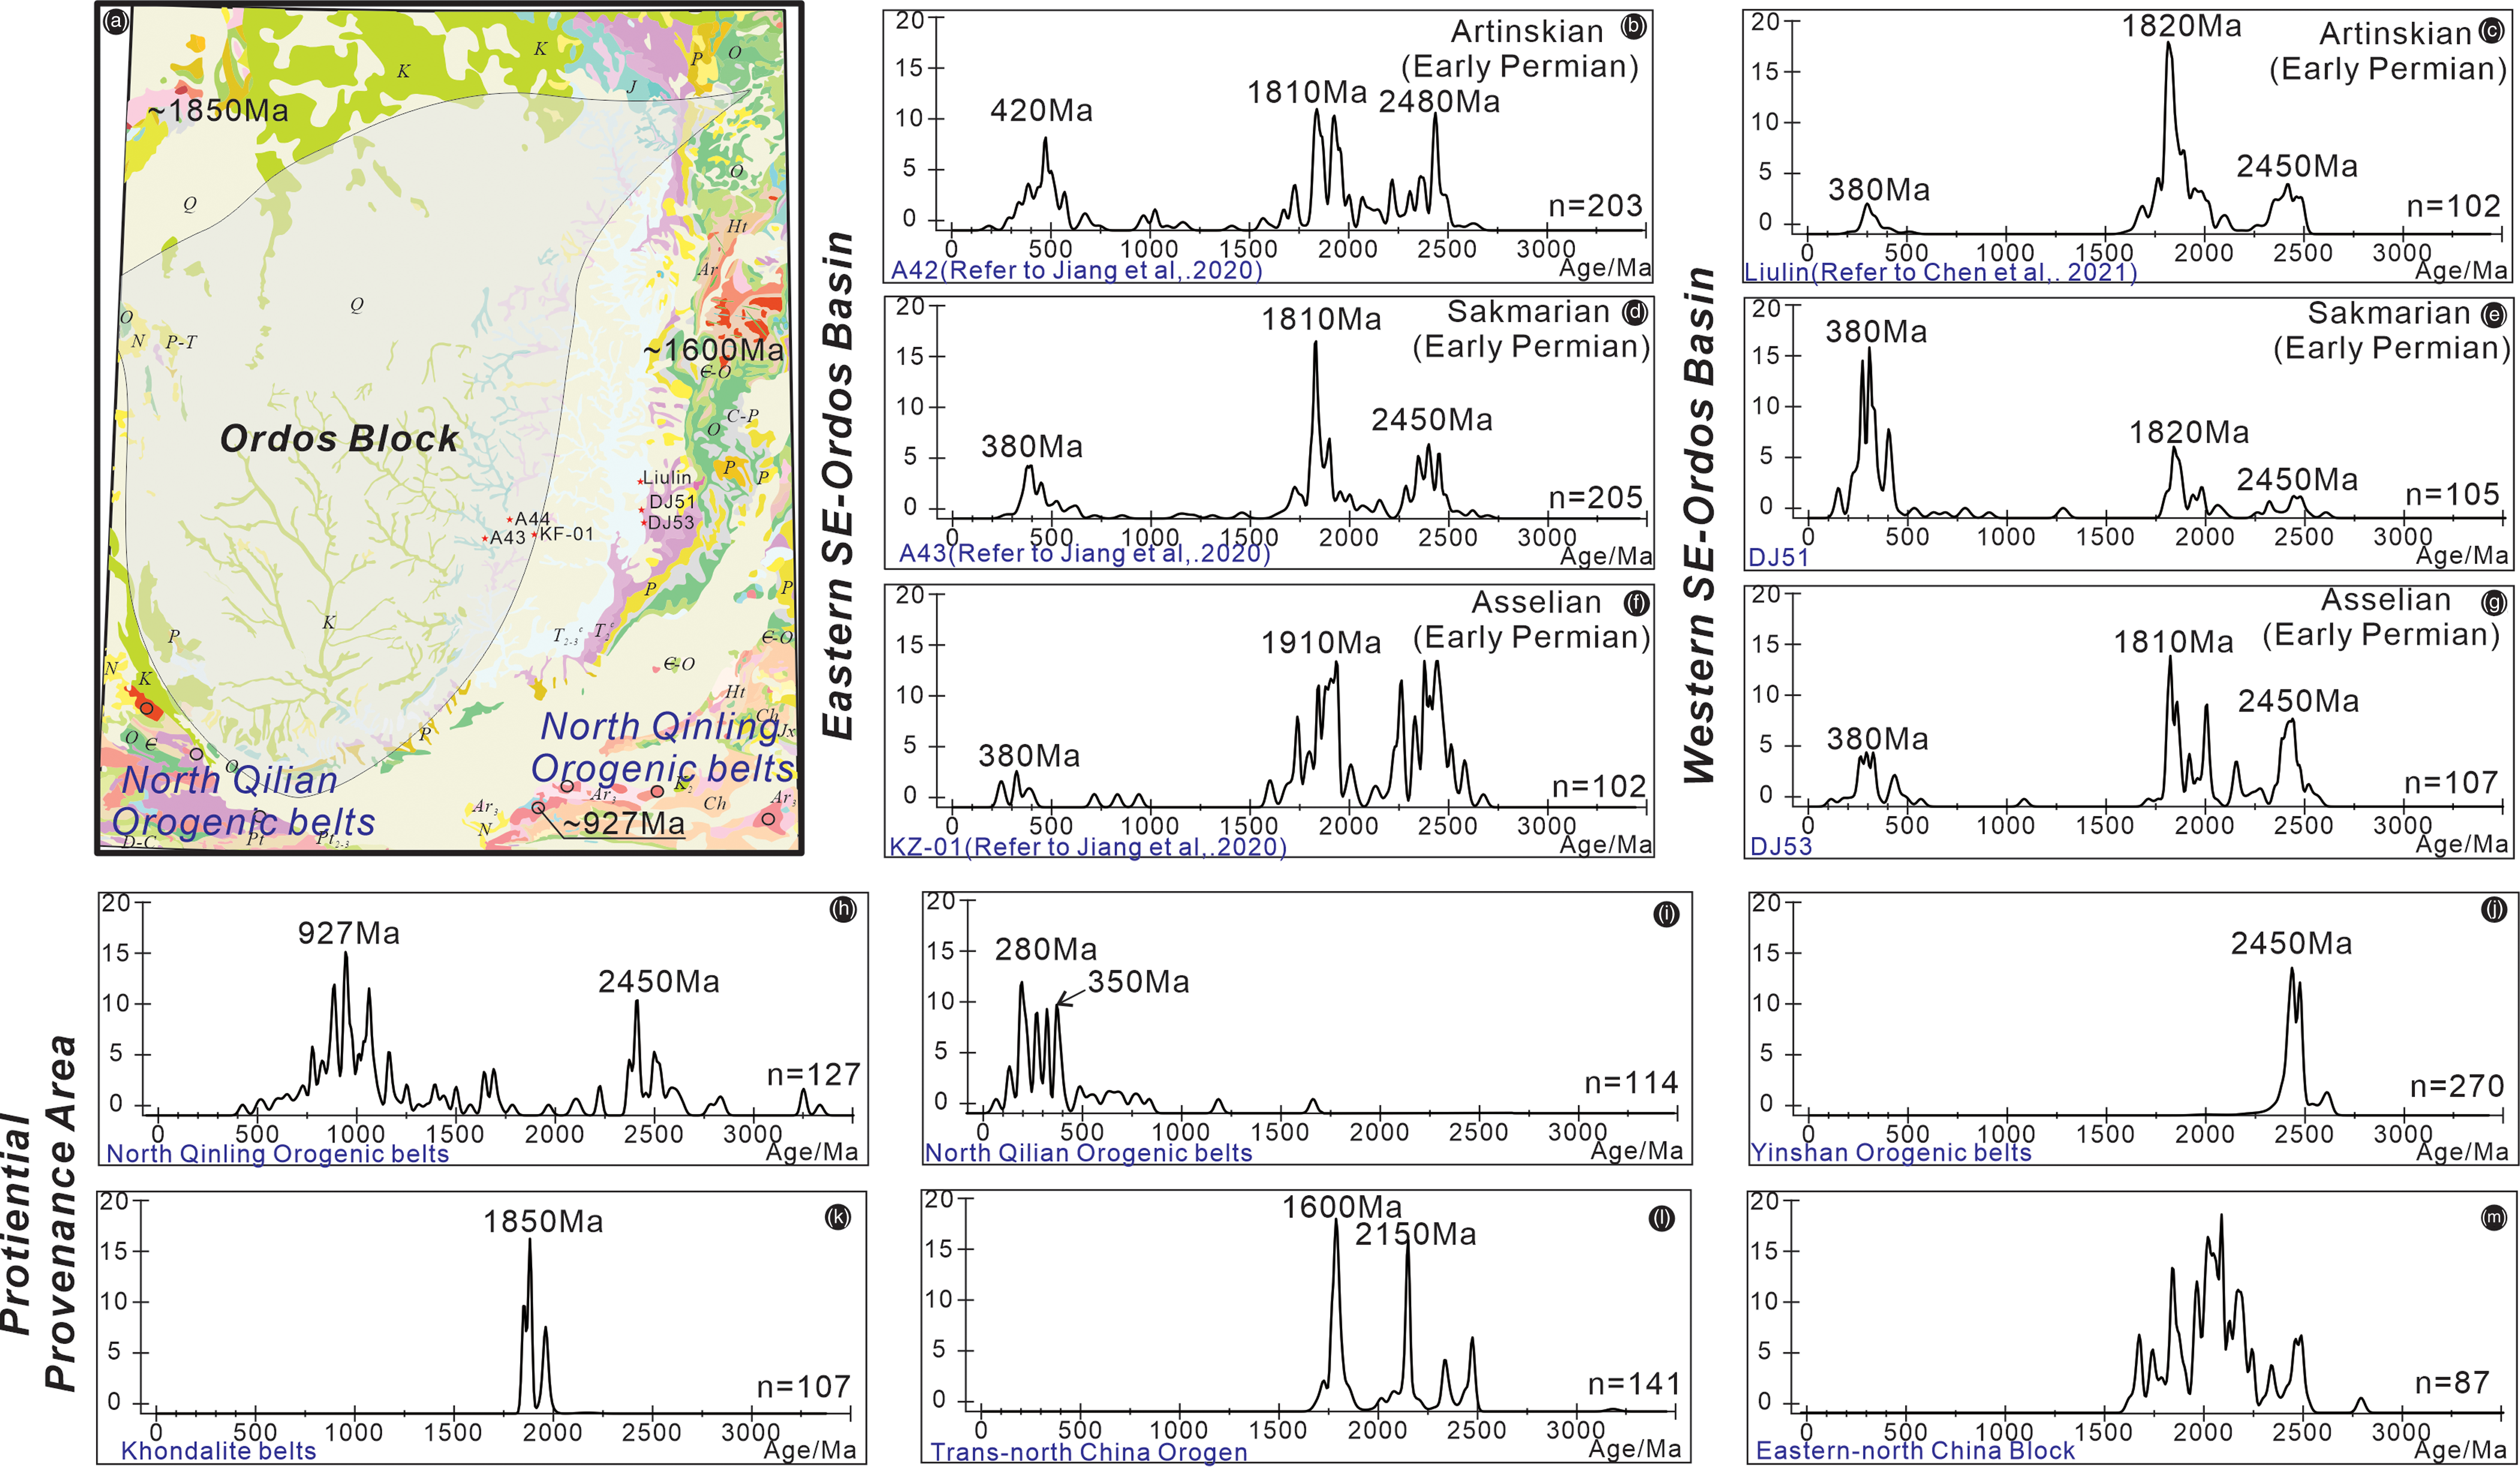
The age curves of six samples from the SE Ordos Basin are shown in Figure 6. Zircon samples from the bottom interval of the Shanxi Formation are collected from KZ-01 (the western part of the SE Ordos Basin) to DJ53 (the eastern part of the SE Ordos Basin). Their concordances are 95.1% and 98.4%, respectively. Their age curves are similar and are characterized by three age peaks: 380 Ma, 1810∼1910 Ma and 2450 Ma.
U–Pb ages of the SE Ordos Basin. (a) The geologic map and the sample location. (b), (d) and (f) The U–Pb data based on the study of Jiang et al. (Reference Jiang, Luo, Liu, Hu, Ma, Hou, Fan and Hu2020). (c), (e) and (g) Data collected from the eastern part of the SE Ordos Basin. (h) to (m) U–Pb data collected from the basement of the potential source area.

From the upper to the top of the Shanxi Formation interval, we collected samples from core A43 in the western Ordos Basin and core DJ51 in the eastern Ordos Basin. Compared to the grains from the bottom layer, the age curve of the western part of the SE Ordos Basin shows a slight increase in the proportion of the ∼380 Ma group. In contrast, the percentage of grains with ages of ∼380 Ma increases sharply from 15% to 40%.
For the lower Shihezi Formation, the age curve of sample A42 is multimodal, and more grains at ∼1000 Ma were input into the catchment in the western part of the SE Ordos Basin. In comparison, the sample provided by Chen et al. (Reference Chen, Wang, Li, Evans, Chen and Wei2021) in the eastern part of the SE Ordos Basin showed an age peak similar to that of the bottom Shanxi Formation.
4.4 Local sea level fluctuation and corresponding depositional setting
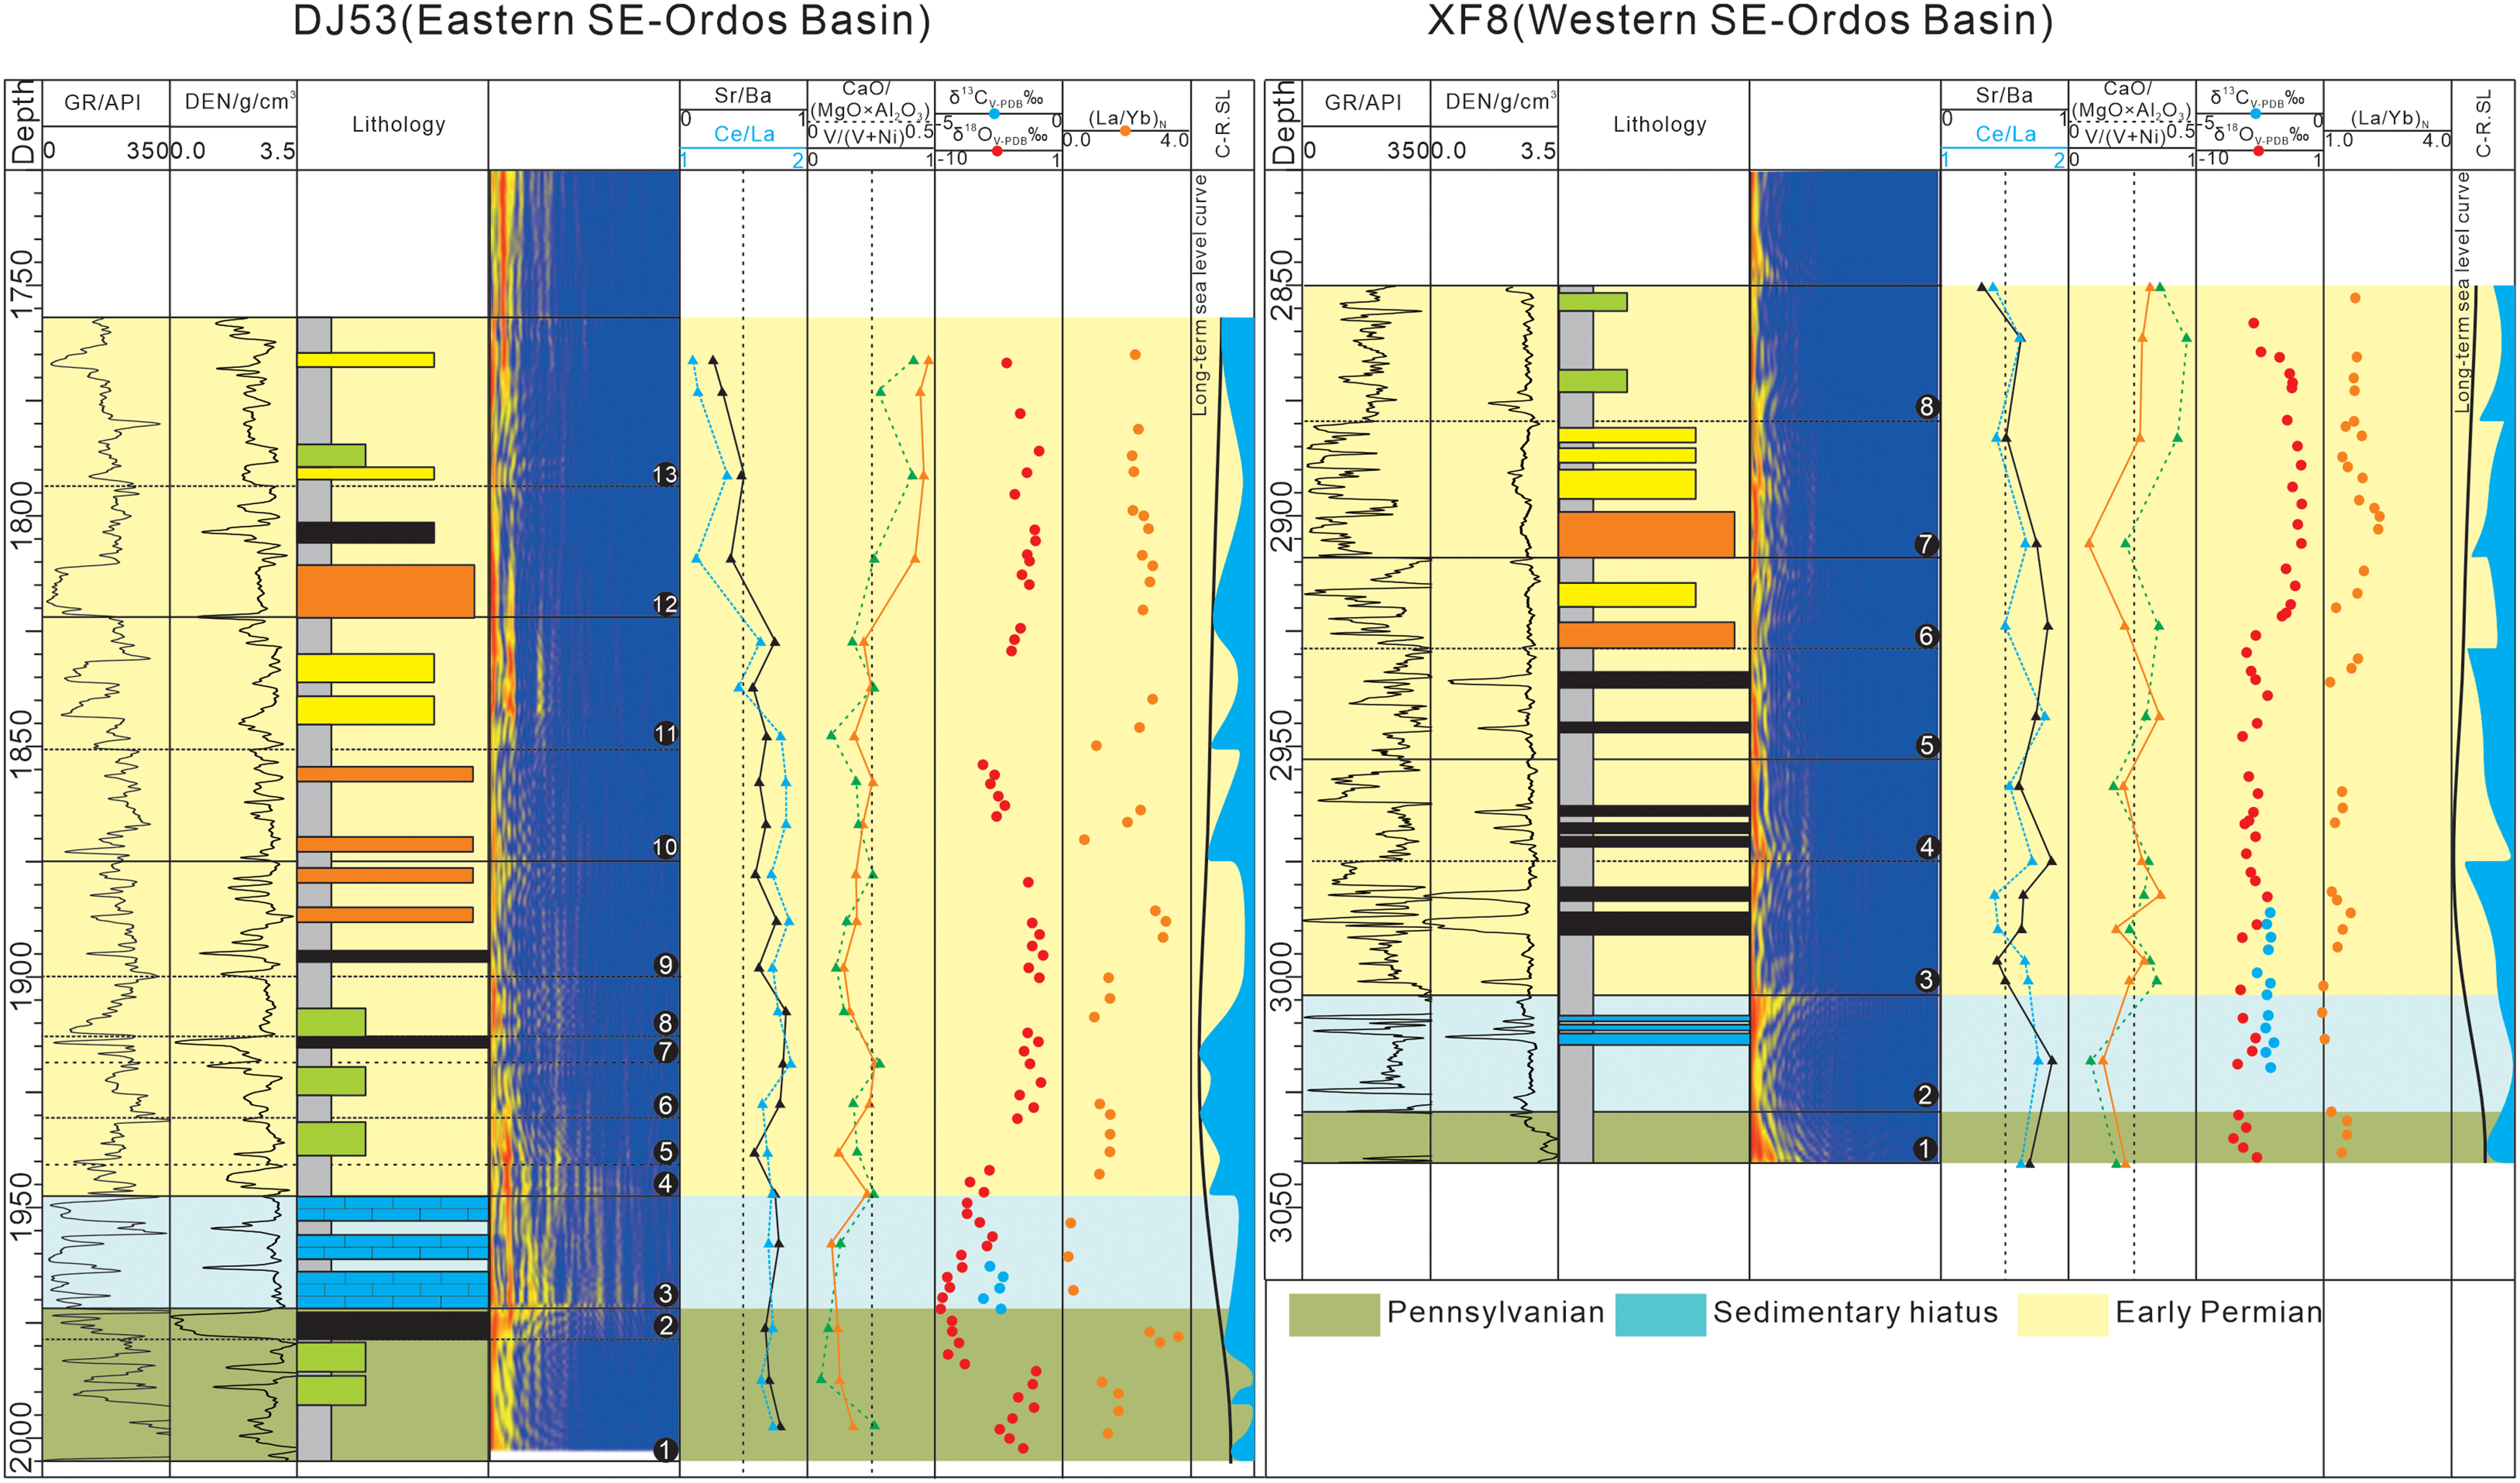
We selected two wells in the eastern and western regions of the SE Ordos Basin to reconstruct their local relative sea level fluctuations in the western and eastern parts (Figure 7). In the eastern region, well DJ53 presents a decreasing Sr/Ba ratio, from 0.7 during the Pennsylvanian to 0.2 during the early Permian, and the Ce/La ratio declines from 1.6 (open marine setting) to 1.2 (continental setting). The V/(V+Ni) values increase from 0.2 to 0.7, and the CaO/(MgO×Al2O3) values increase from 0.1 (anaerobic setting) to 0.5 (oxygen-rich setting). In the western region, the Sr/Ba and Ce/La values of well XF8 show a slight decline after fluctuation. Moreover, the CaO/(MgO×Al2O3) and V/(V+Ni) values increase, with several slight decreases.
Columns showing well DJ53 in the eastern part of the SE Ordos Basin and well XF8 in the western part of the SE Ordos Basin (the well locations are shown in Figure 1). From left to right are the GR, Den (density), lithology and GR spectrum analysis results; element ratios (including Sr/Ba, Ce/La, CaO/(MgO×Al2O3) and V/(V+Ni)); carbon and oxygen isotopes; (La/Yb)N values and speculated sea level. The spectrum analysis results divide the Pennsylvanian to early Permian layers into 13 members in well DJ53 and 8 members in well XF8.

The δ18O and δ13C data obtained on whole-rock samples from wells DJ53 and XF8 show the fluctuation in the sea level trend caused by climate or sediment rate changes. During the Pennsylvanian, δ13CV-PDB values ranged from −8‰ to −25‰, and δ18OV-PDB values ranged from −5‰ to −15‰. During the Asselian–Sakmarian, δ13CV-PDB‰ (−4.35‰∼−1.36‰) and δ18OV-PDB‰ (−9.42∼−11.35) values showed a positive excursion, which suggests that the sea level was rising during this interval.
5. Discussion
5.1 Source-to-sink system identification
5.1.1 Provenance identification
We integrated the zircon U–Pb and HMA data in the SE Ordos Basin to identify the provenance area after comparing the above results and the data from the potential source areas (Table 1).
(1) Eastern part of the SE Ordos Basin
Mo et al. (Reference Mo, Fan, Wei, Liu, Zhang, Liu, Su, Liu, Wu and Xing2020) and Fu et al. (Reference Fu, Yu, Li, Peng and Shi2021 b) noted that during the Asselian and Sakmarian stages in the early Permian, the sediments in the sink area were mainly provided from multiple source areas, which include the Yinshan orogenic belt in the north and the North Qinlian orogenic belt in the south. The HMA results (Figure 5) show average high ZTR and GZi indexes in the eastern block, which indicates that the sediments migrated from a distal source area. The pie chart of the wells shows high garnet and zircon values in the north, while in the southern area, zircon and tourmaline accumulated. Furthermore, during the Asselian and Sakmarian stages, all the age spectra in Figure 6(e) and (g) have three peaks: ∼380 Ma, ∼1910 Ma and ∼2480 Ma. We infer that these values represent the potential areas, including the north Qinling orogenic belt in the south (280∼350 Ma) (Figure 6(h)) and the Khondalite belt in the north (1850 Ma) (Figure 6(k)). Furthermore, zircons with ages of ∼2450 Ma were analyzed by Zhao et al. (Reference Zhao, Jahn, Xu, Liao and Wang2016) and Jiang et al. (Reference Jiang, Luo, Liu, Hu, Ma, Hou, Fan and Hu2020) (via zircon U–Pb ages and Hf isotopes), and they suggest that these sediments may have originated from the recycled basement. Moreover, compared with age spectra from the Asselian and Sakmarian stages, more grains with an age of 380 Ma were input into the drainage area, which indicates that more sediments might have been provided by the North Qinling orogenic belt.
Up to the Artinskian stage, wells YH9 and DJ53 both show an HMA composition of titanium–zircon–tourmaline, while well YH9 shows a lower GZi index than that of DJ53 (Figure 5). We infer that the sediments from the south may be merged with those from the north.
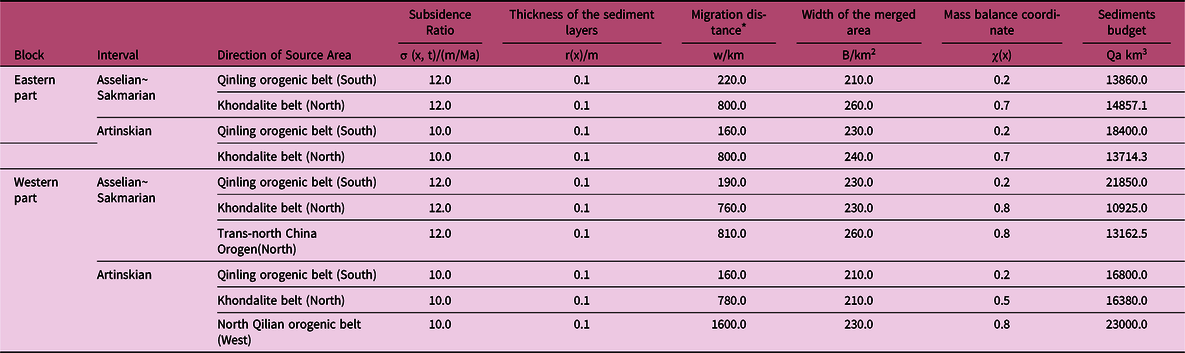
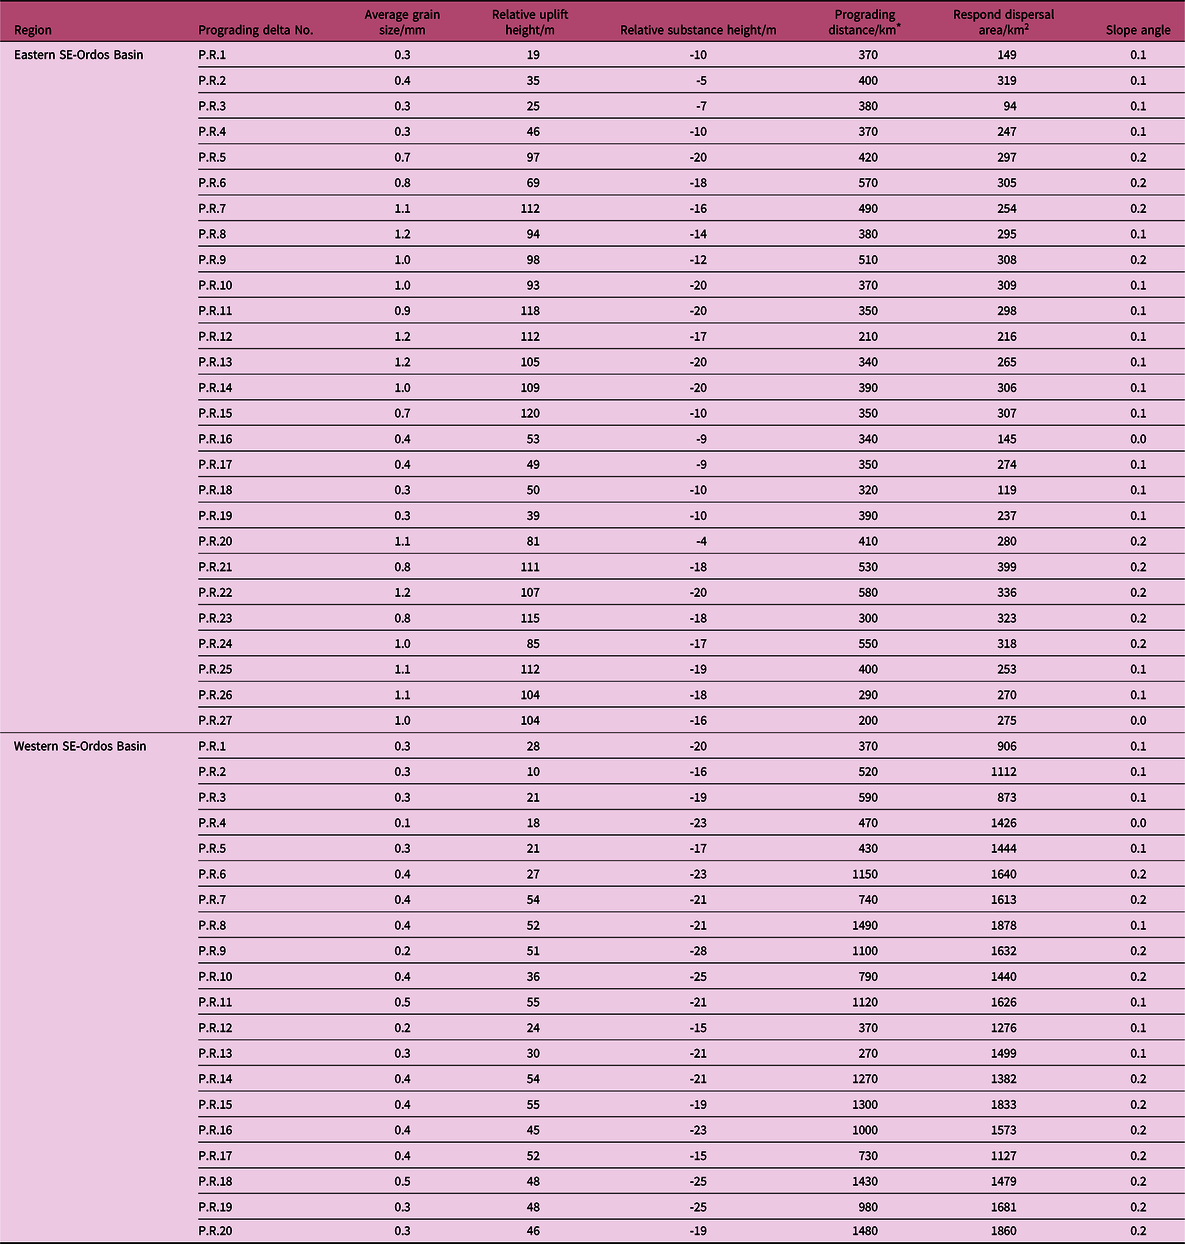
Based on the above provenance area (Table 1), we measured the response distance (w) from the geological map in Figure 6(a). The subsidence rates (σ (x, t)) during this period were 6∼20 m/Ma (Liu et al. Reference Liu, Liu and Huang2016). Referring to Liu et al. (Reference Liu, Liu and Huang2016), we set the rates of 12 m/Ma for the Asselian and Sakmarian stages and 10 m/Ma for the Artinskian stages. Then, the thickness of the sediment layers (r(x)) and the width of the merged area (B) could be measured from the paleomorphology map (Figure 6). By inputting all the above parameters, we estimated that the sediment budget from the source area (Qa) was 28000 km3 during the Asselian and Sakmarian stages and 32000 km3 during the Artinskian stage (Table 3).
Sediments budge calculation with equation (1)

* Migration distance measurement is referred to the paleogeography map from website https://dinosaurpictures.org/ancient-earth/
(2) Western part of the SE Ordos Basin
Shown in the HMA distribution in Figure 5, the average high ZTR and GZi indexes indicate that during the Asselian and Sakmarian stages, the SE Ordos Basin was dominated by sediments that migrated from a distal area. Furthermore, samples from well FG3 in the south have high garnet and zircon contents, while samples from well N3 in the north are enriched in garnet and rutile. Combining the zircon U–Pb data from KZ-01 and A43, the multimodal spectra show peak ages of ∼380 Ma, ∼1600 Ma, ∼1910 Ma and 2450 Ma, which indicate that the sediments from the Asselian and Sakmarian stages may have migrated from multiple source areas, including the North Qinling orogenic belt (∼927 Ma and ∼2450 Ma) (Figure 6(h)), Khondalite belt (∼1850 Ma) (Figure 6(k)) and Trans-North China Orogen (∼1600 Ma and ∼2150 Ma) (Figure 6(l)).
Regarding the Artinskian stage, the HMA composition shows a spatial difference, and the above results indicate that the sediments were transported from multiple source areas. Different from the early stages, low ZTR and GZi indexes in some wells, such as wells Y1758 and Y264, indicate that some proximal sediments were input into the drainage area. Furthermore, the zircon age curve shows that some zircons have peak ages of ∼420 Ma, ∼927 Ma, 1810 Ma and ∼2480 Ma, which indicates that, in addition to the early provenance area, the North Qilian orogenic belt (Figure 6(i)) may have provided some sediments.
We also estimate the sediment budget from the source area in the western part of the SE Ordos Basin. According to the parameters in Table 3, we calculate the sediment budget from the source area (Qa) to be 45000 km3 during the Asselian and Sakmarian stages and 50000 km3 during the Artinskian stages.
5.1.2 Reconstruction of the routing system
(1) Eastern part of the SE Ordos Basin
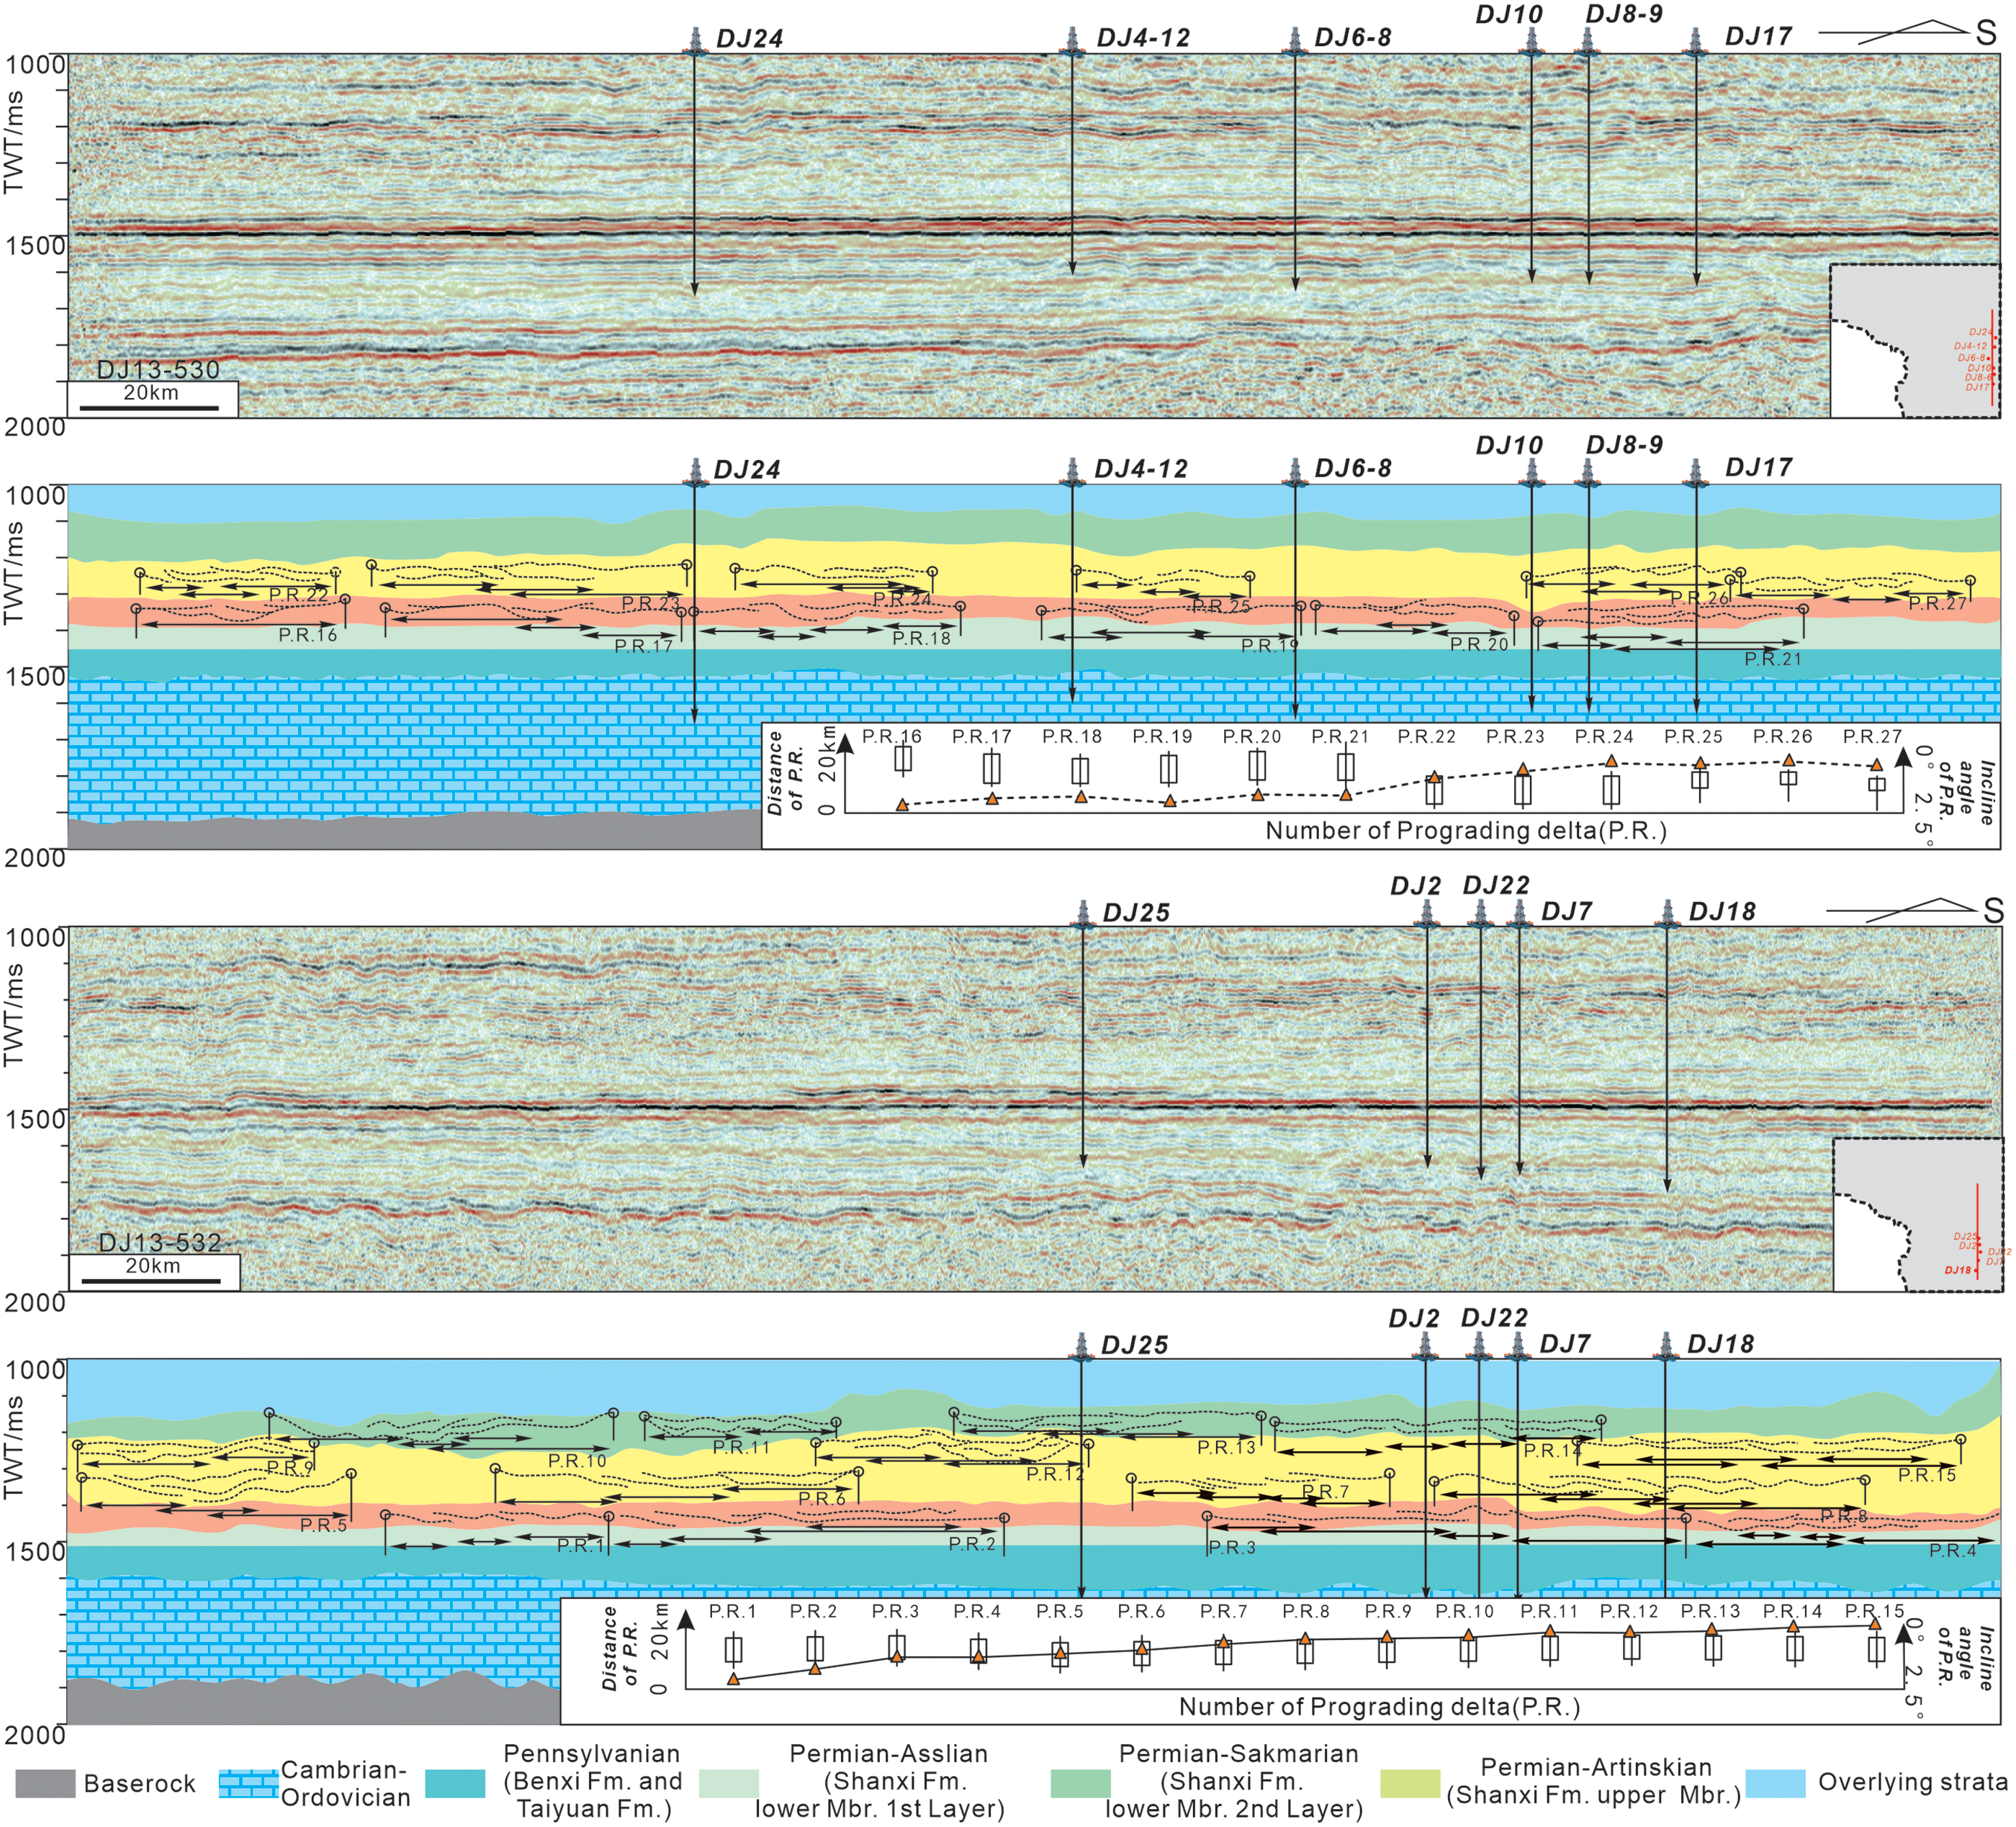
According to the seismic profile interpretation in Figure 8, we identified 27 prograding deltas in the early–middle Permian interval. Ten prograding deltas in the Asselian stage are shown in Figure 8 (P.R. 1∼4 and P.R. 16∼21). They are characterized by a small progradation distance (∼40 km) and low elevation height (∼20 m). Additionally, the inclination angle of each seismic event is relatively low (less than 1°). Regarding the upper layers, the prograding deltas in the Sakmarian and Artinskian stages show a moderate progradation distance (∼60 km) and elevation height (∼50 m). Compared with the bottom layers, these prograding deltas show an increasing infilling rate. According to the inner seismic reflection, we determined that P.R. 9 to P.R. 11, PR 16 to P.R. 18 and PR 22 to P.R. 24 migrated from the northern margin, and P.R. 7 to P.R. 15 and P.R. 25 to P.R. 27 were prograding deltas from the southern margin.
Two seismic profiles in the eastern part of the SE Ordos Basin. In this study, our target layers are from the Cb (bottom of the Benxi Formation) to Ps (top of the lower Shihezi Formation). We identified the prograding deltas (P1 to P27) according to their morphologies and measured their parameters, including the progradation distance and aggradation distance.

To measure the volume of these prograding deltas, we obtained a sediment mass in the sink area (Q) of 6500 km2. Compared with the sediment budget from the source area (Qa), as mentioned above, the ratio of Qtotal to Qtotala is nearly 1. This indicates that in the sink area of the SE Ordos Basin, the sediments from multiple sources are merged in intensity.
(2) Western part of the SE Ordos Basin
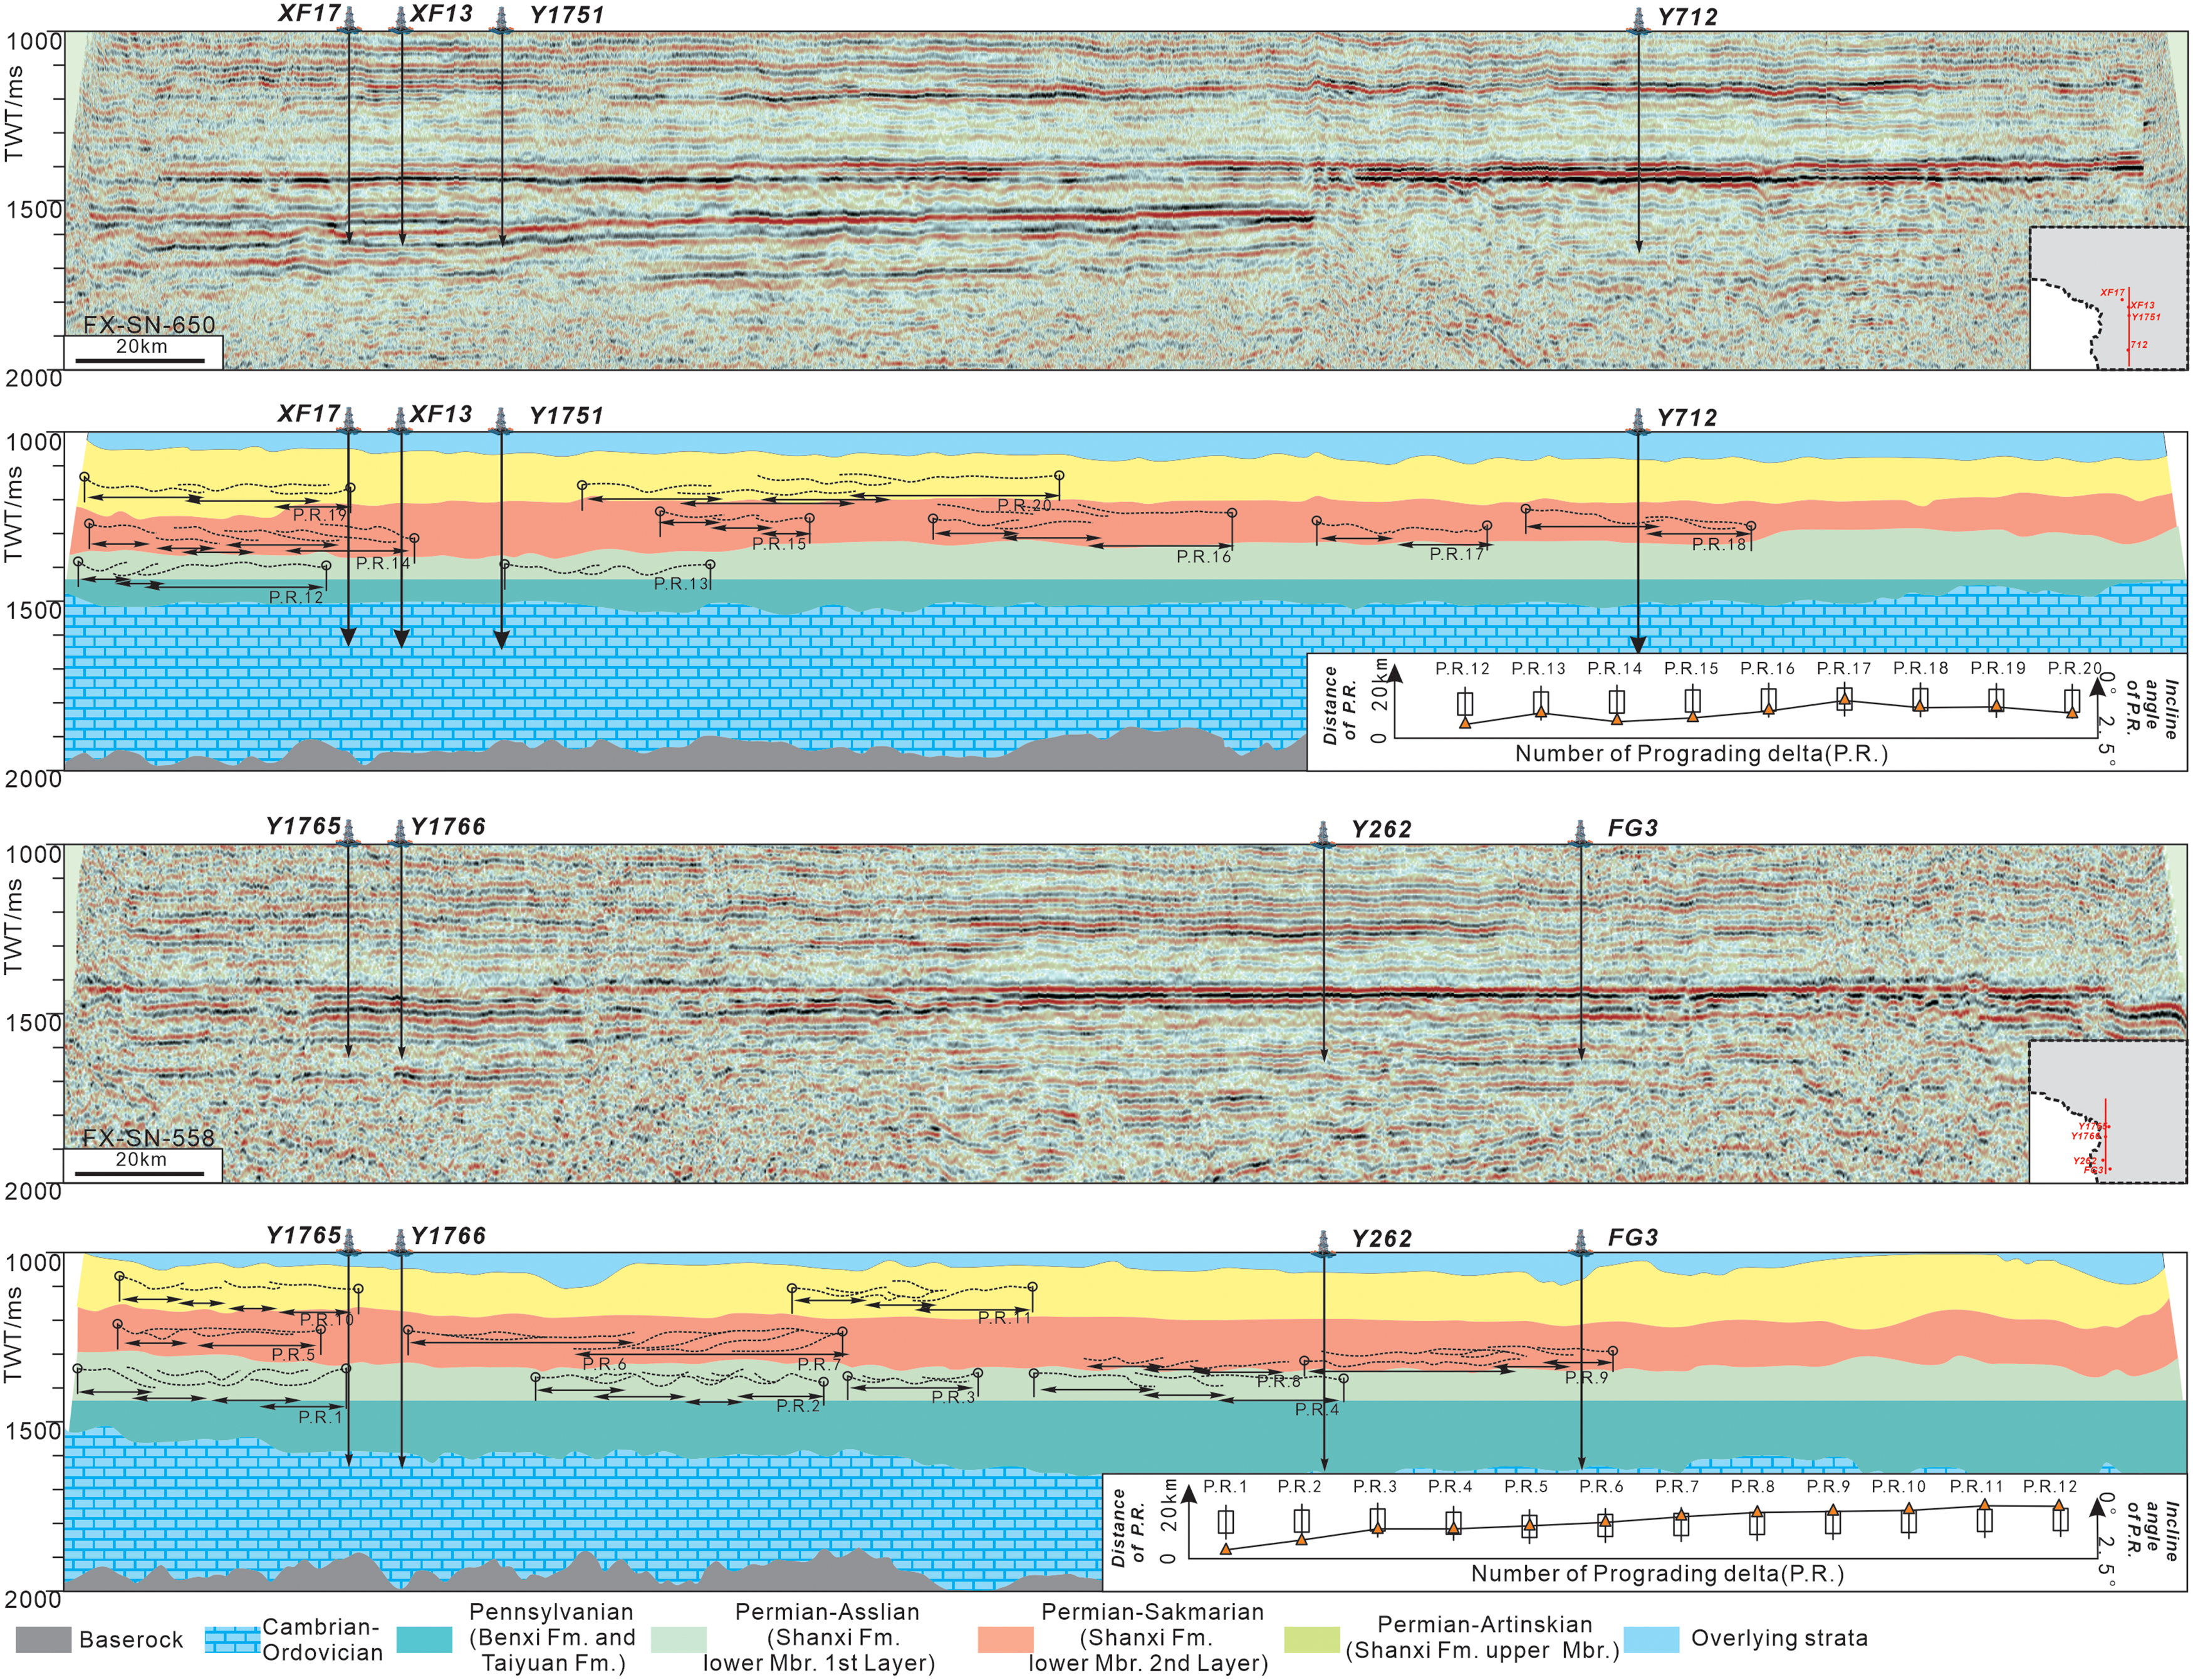
According to the seismic profile interpretation (Figure 9), the western block contained only a small number (P.R. 1∼P.R. 20) of prograding deltas. These prograding deltas are characterized by a long progradation distance (>80 km) and elevation height (∼80 m).
Two seismic profiles in the western Ordos Basin. This study identifies the prograding deltas (P1 to P20) according to their morphologies and measures their parameters, including the progradation distance and aggradation distance.

We also calculated the sediment mass in the sink area (Q). The total volume of the sediment supply (the sum of P.R.1 to P.R.20) is nearly 2500 km2. The ratio of Q/Qa, which is far less than 1, indicates a gentle merging process in the open setting.
5.1.3 Deposition process in the sink area
Based on thin sections, we evaluated the merging and multi-S2S system interaction processes reflected by the evolution of the sandstone composition (Figure 10 and Figure 11).
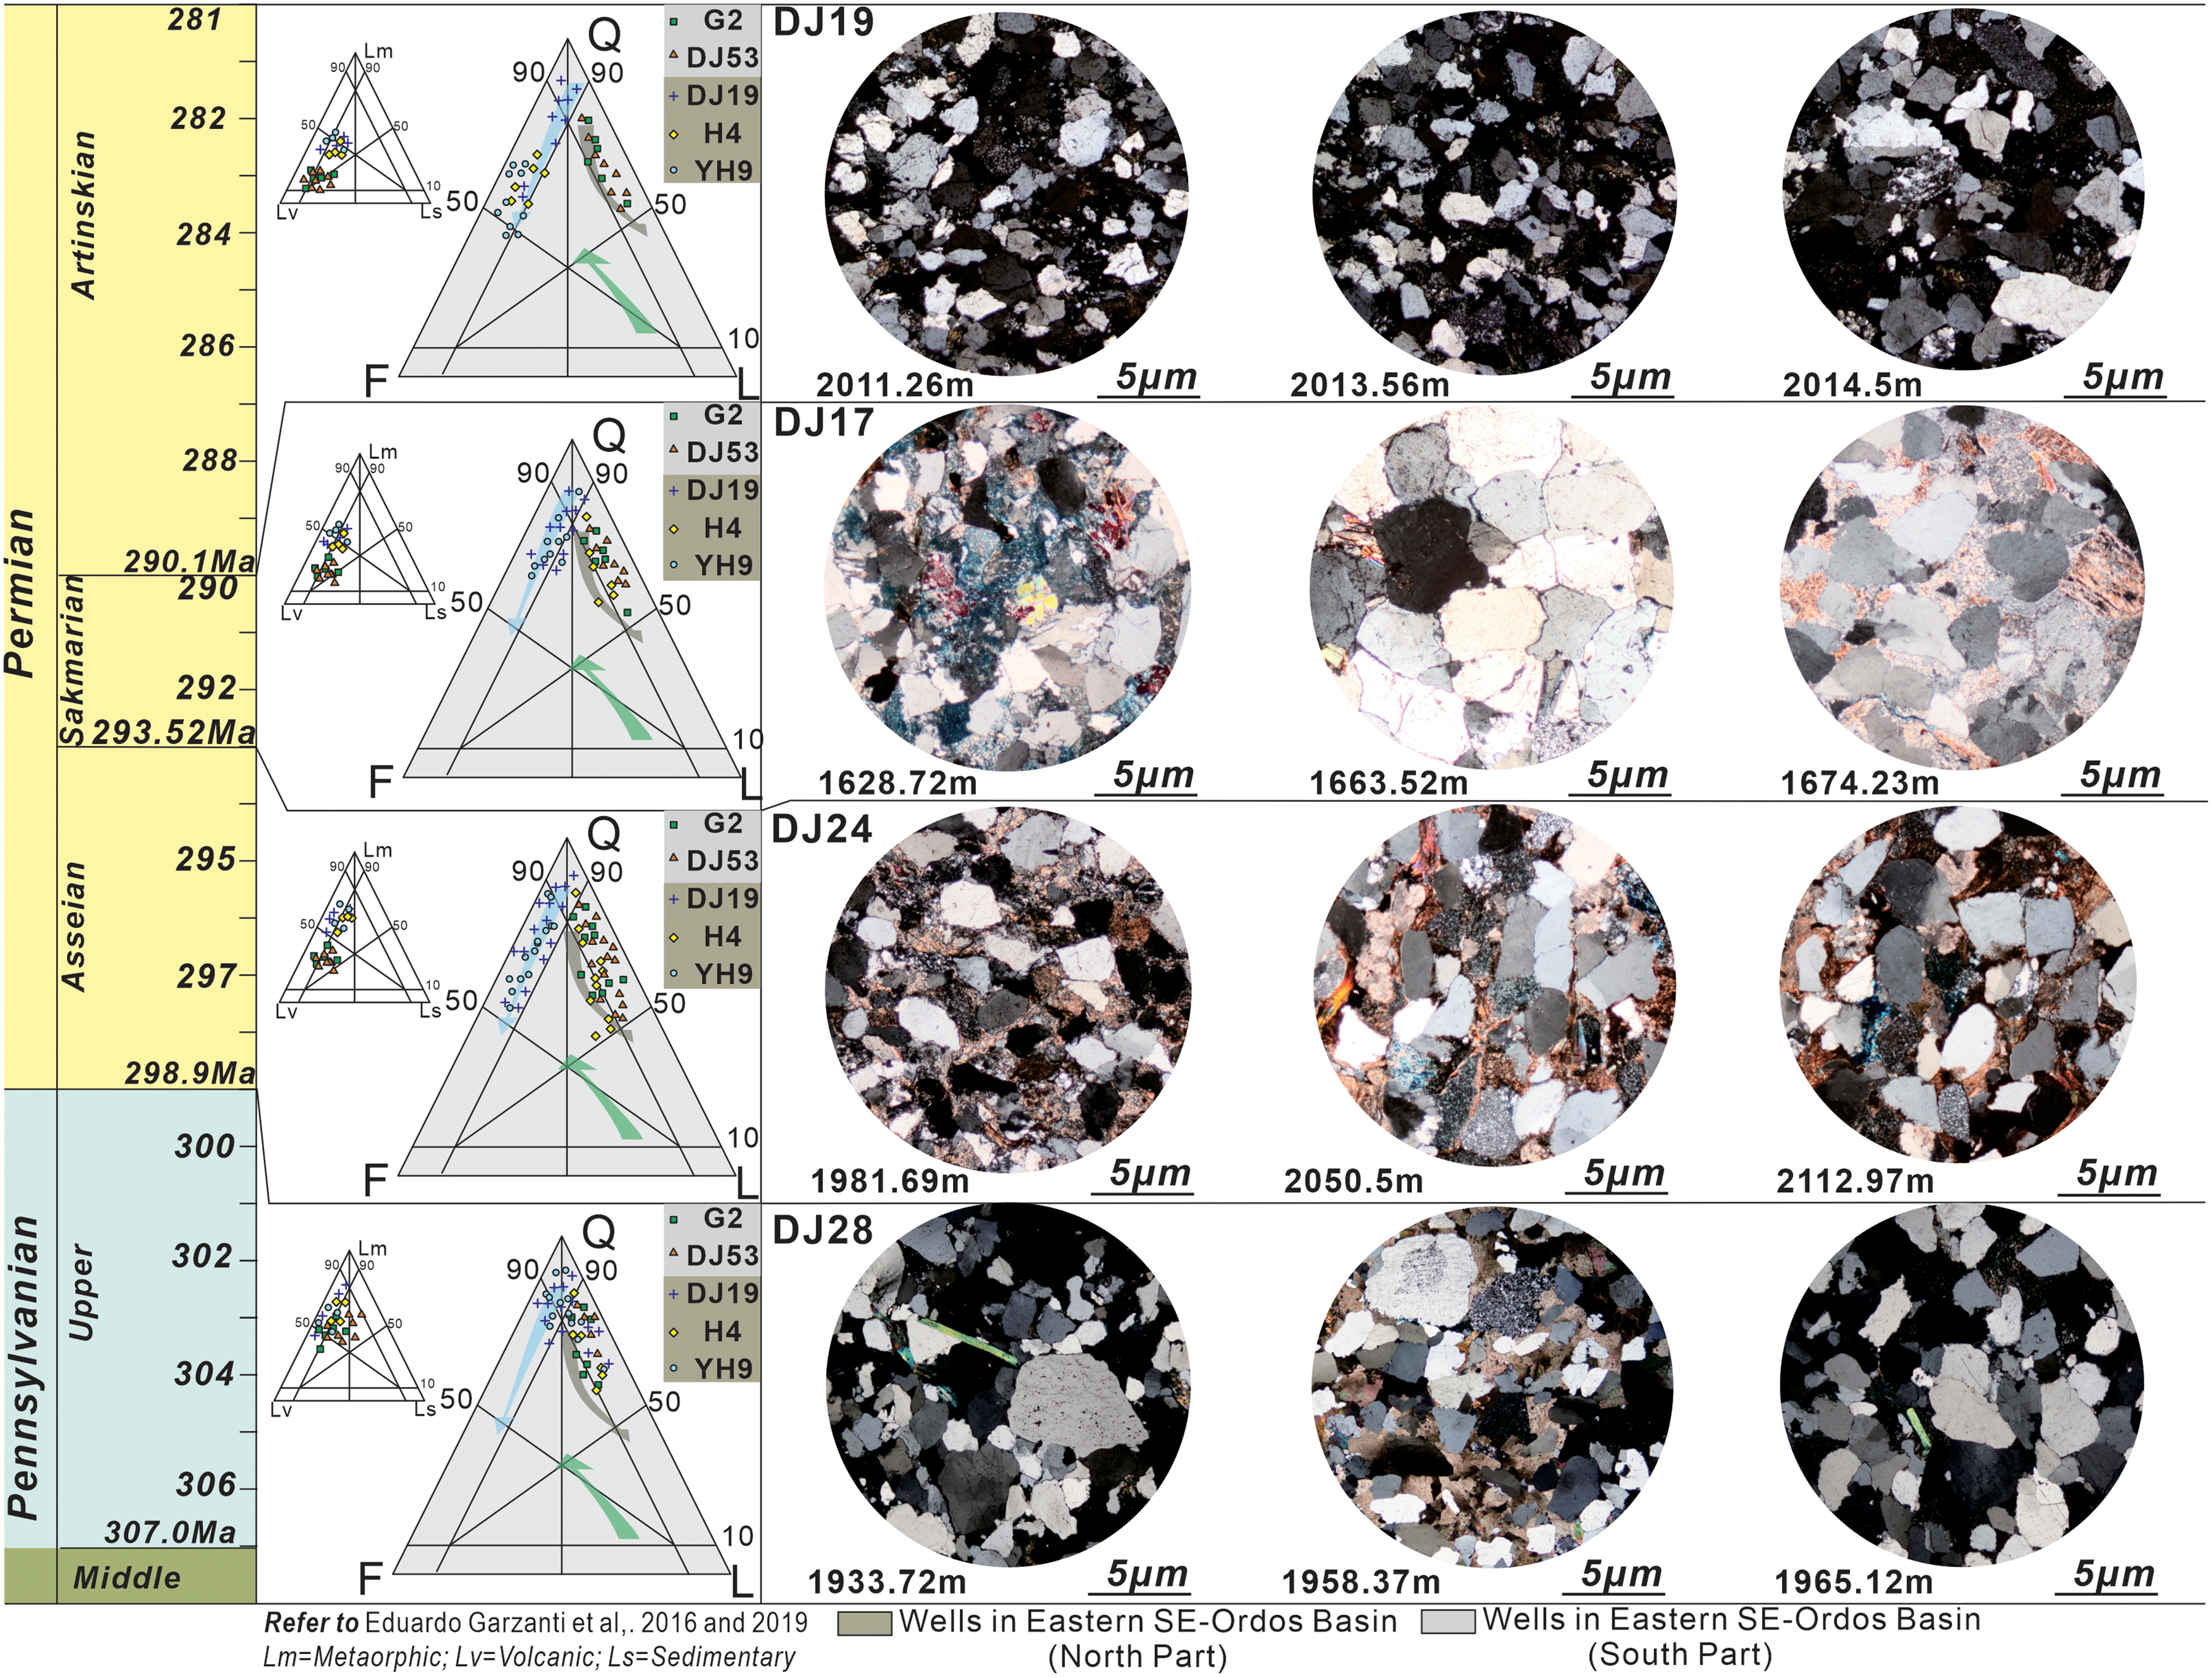
Thin sections of samples from the eastern part of the SE Ordos Basin and the sandstone classification based on the ternary diagram.

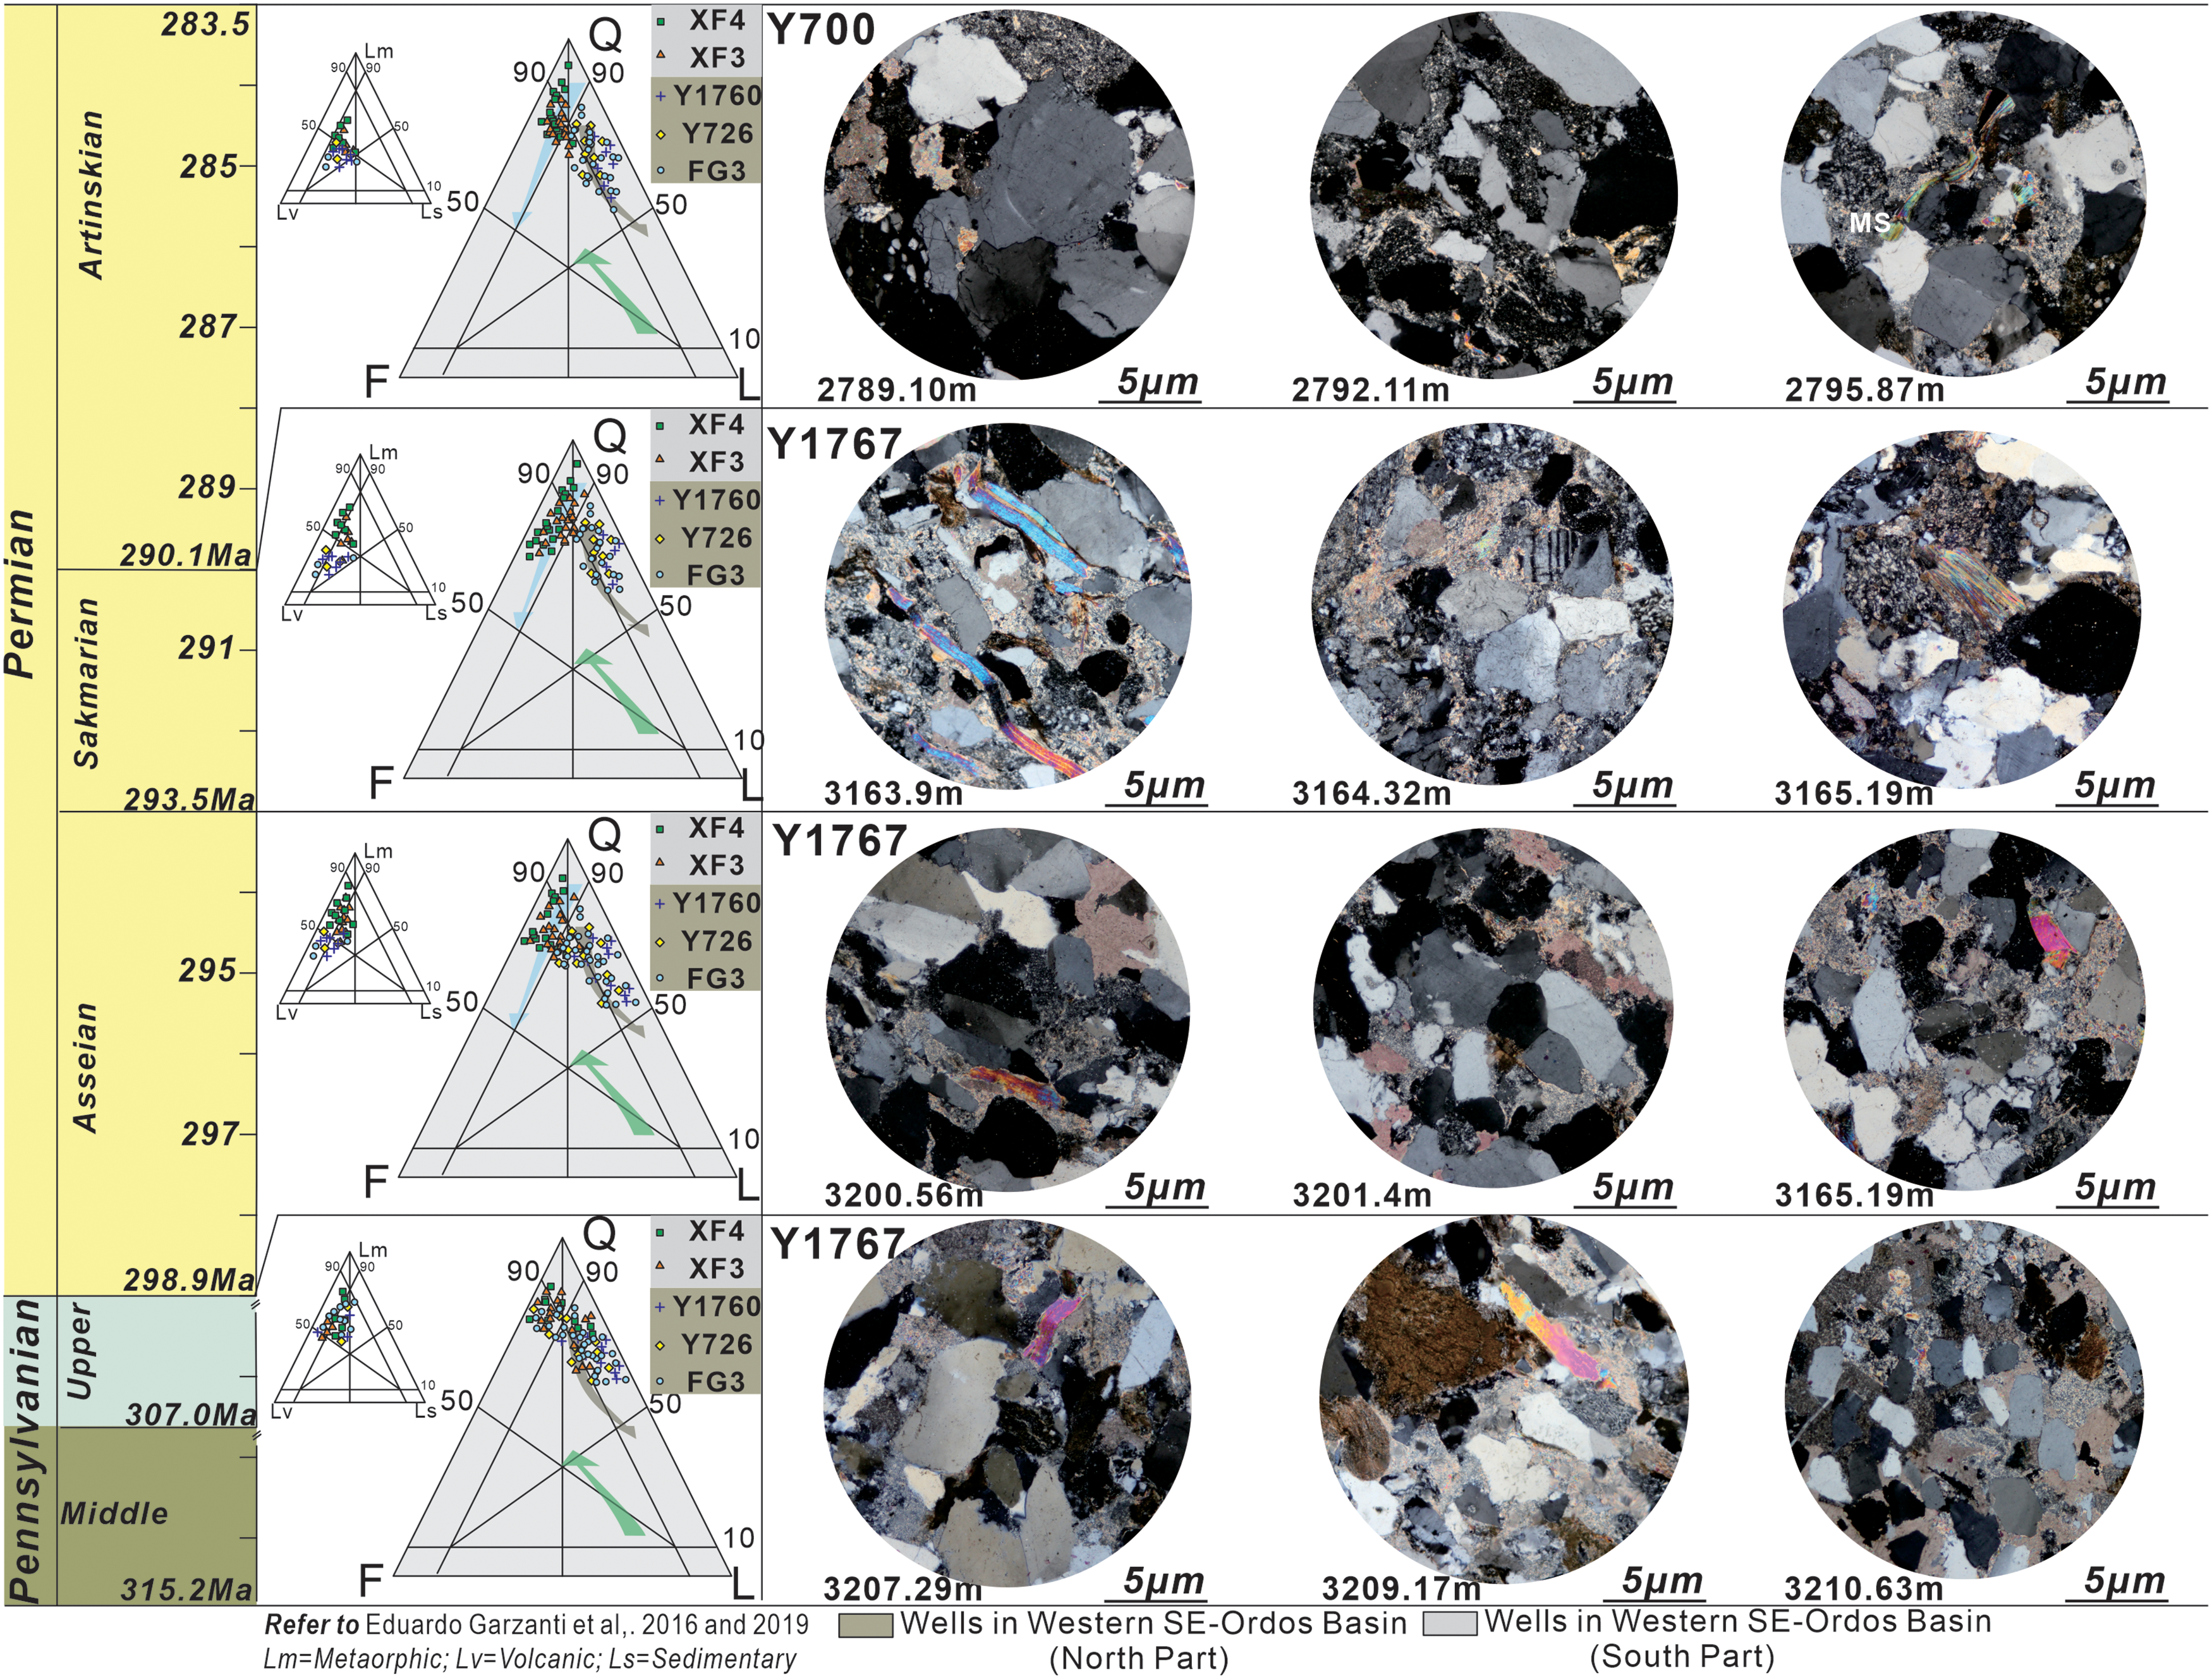
Thin sections of samples from the western part of the SE Ordos Basin and the sandstone classification based on the ternary diagram. A sheet-shaped mineral mass is identified in the thin sections.

(1) Eastern part of the SE Ordos Basin
The sandstone contents of the wells from the eastern areas, including wells G2, DJ53, DJ19, H4 and YH9, are plotted on the quartz–felspar–lithics (QFL) diagram (Garzanti, Reference Garzanti2019) (Figure 10). We found that during the late Pennsylvanian, the sediments in the eastern part of the SE Ordos Basin may have been provided from only a single provenance area from the Yinshan orogenic belt in the north (Chen et al. Reference Chen, Wang, Li, Evans, Chen and Wei2021; Fu et al. Reference Fu, Yu, Li, Peng and Shi2021 b), according to former study results, and the sandstones have high values of quartz and lithics, dominated by metamorphic sediments (Li et al. Reference Li, Gao, Meng, Wu, Niu, Qiao and Elsworth2019; Yin et al. Reference Yin, Tian and Wu2020; Chen et al. Reference Chen, Wang, Guo, Wu, Li, Wu and Zhao2020). From the upper Asselian, Sakmarian and Artinskian stages, by combining the reconstructed provenance area, we discovered that sandstone from the northern Qinling orogenic belt is characterized by high felspathic and volcanic lithic contents. Moreover, as shown in the ternary diagram in Figure 10, during the period with multiple provenances, the sections have two end points, namely, felspathic and lithic sections. The wells in the southern areas have a high lithic value, while the wells in the north are enriched in feldspars. Thus, we infer that the sediments from the multiple S2S system may not be merged and that sediments from various provenance areas are not mixed well.
(2) Western part of the SE Ordos Basin
We selected wells XF4 and XF3 in the north and wells Y1760, Y726 and FG3 in the south as representatives of the western part of the SE Ordos Basin and plotted their sandstone contents in the QFL plot (Figure 11). From the Asselian to the Artinskian stages, the sandstone in the drainage basin maintained a quartz-dominated and metamorphic and volcanic lithic mixture. Additionally, in the thin sections, we found that mica was present (Figure 11) and that the matrix content increased. Thus, we infer that the sediments from the multiple S2S systems may be merged and that sediments from various provenance areas are mixed well.
5.2 Impact of the paleoenvironment on various S2S systems
As mentioned above, we reconstructed the sea level change in the open setting in the west and the semiclosed setting in the east (Figure 7). Additionally, DJ53 showed that from the Asselian stage to the Artinskian stage, ten cycles of sea level fluctuation were identified. In contrast to well XF8 in the western block, we identified 16 cycles. This finding indicated that the sediment preservation in the closed restricted depositional area was lower than that in the open area. This may have led to various depositional processes and S2S system formation. Additionally, as the above method stated, we evaluated the sedimentation rate by referring to the ratio of (La/Yb)N (Goldstein & Jacobsen, Reference Goldstein and Jacobsen1988) and reconstructed the relationship with the paleoenvironment.
5.2.1 Semiclosed merged region: eastern part of the SE Ordos Basin
We selected well DJ53 in the shallow coastal area in the semiclosed setting (according to the paleomorphology in Figure 5). We observed that the LFF (estuary lithofacies association) at the bottom and LFD (coarse-grained meandering or braided channel lithofacies association) and LFE (interdistribution channel lithofacies association) are found at the tops of the core samples (Figure 12). Additionally, regarding the sedimentary structure, lenticular bedding and flaser bedding are found at the bottoms, and massive carbonaceous mudstone is found at the tops. This finding is an indication of the tidal setting, which then evolved into interdistributary bays.
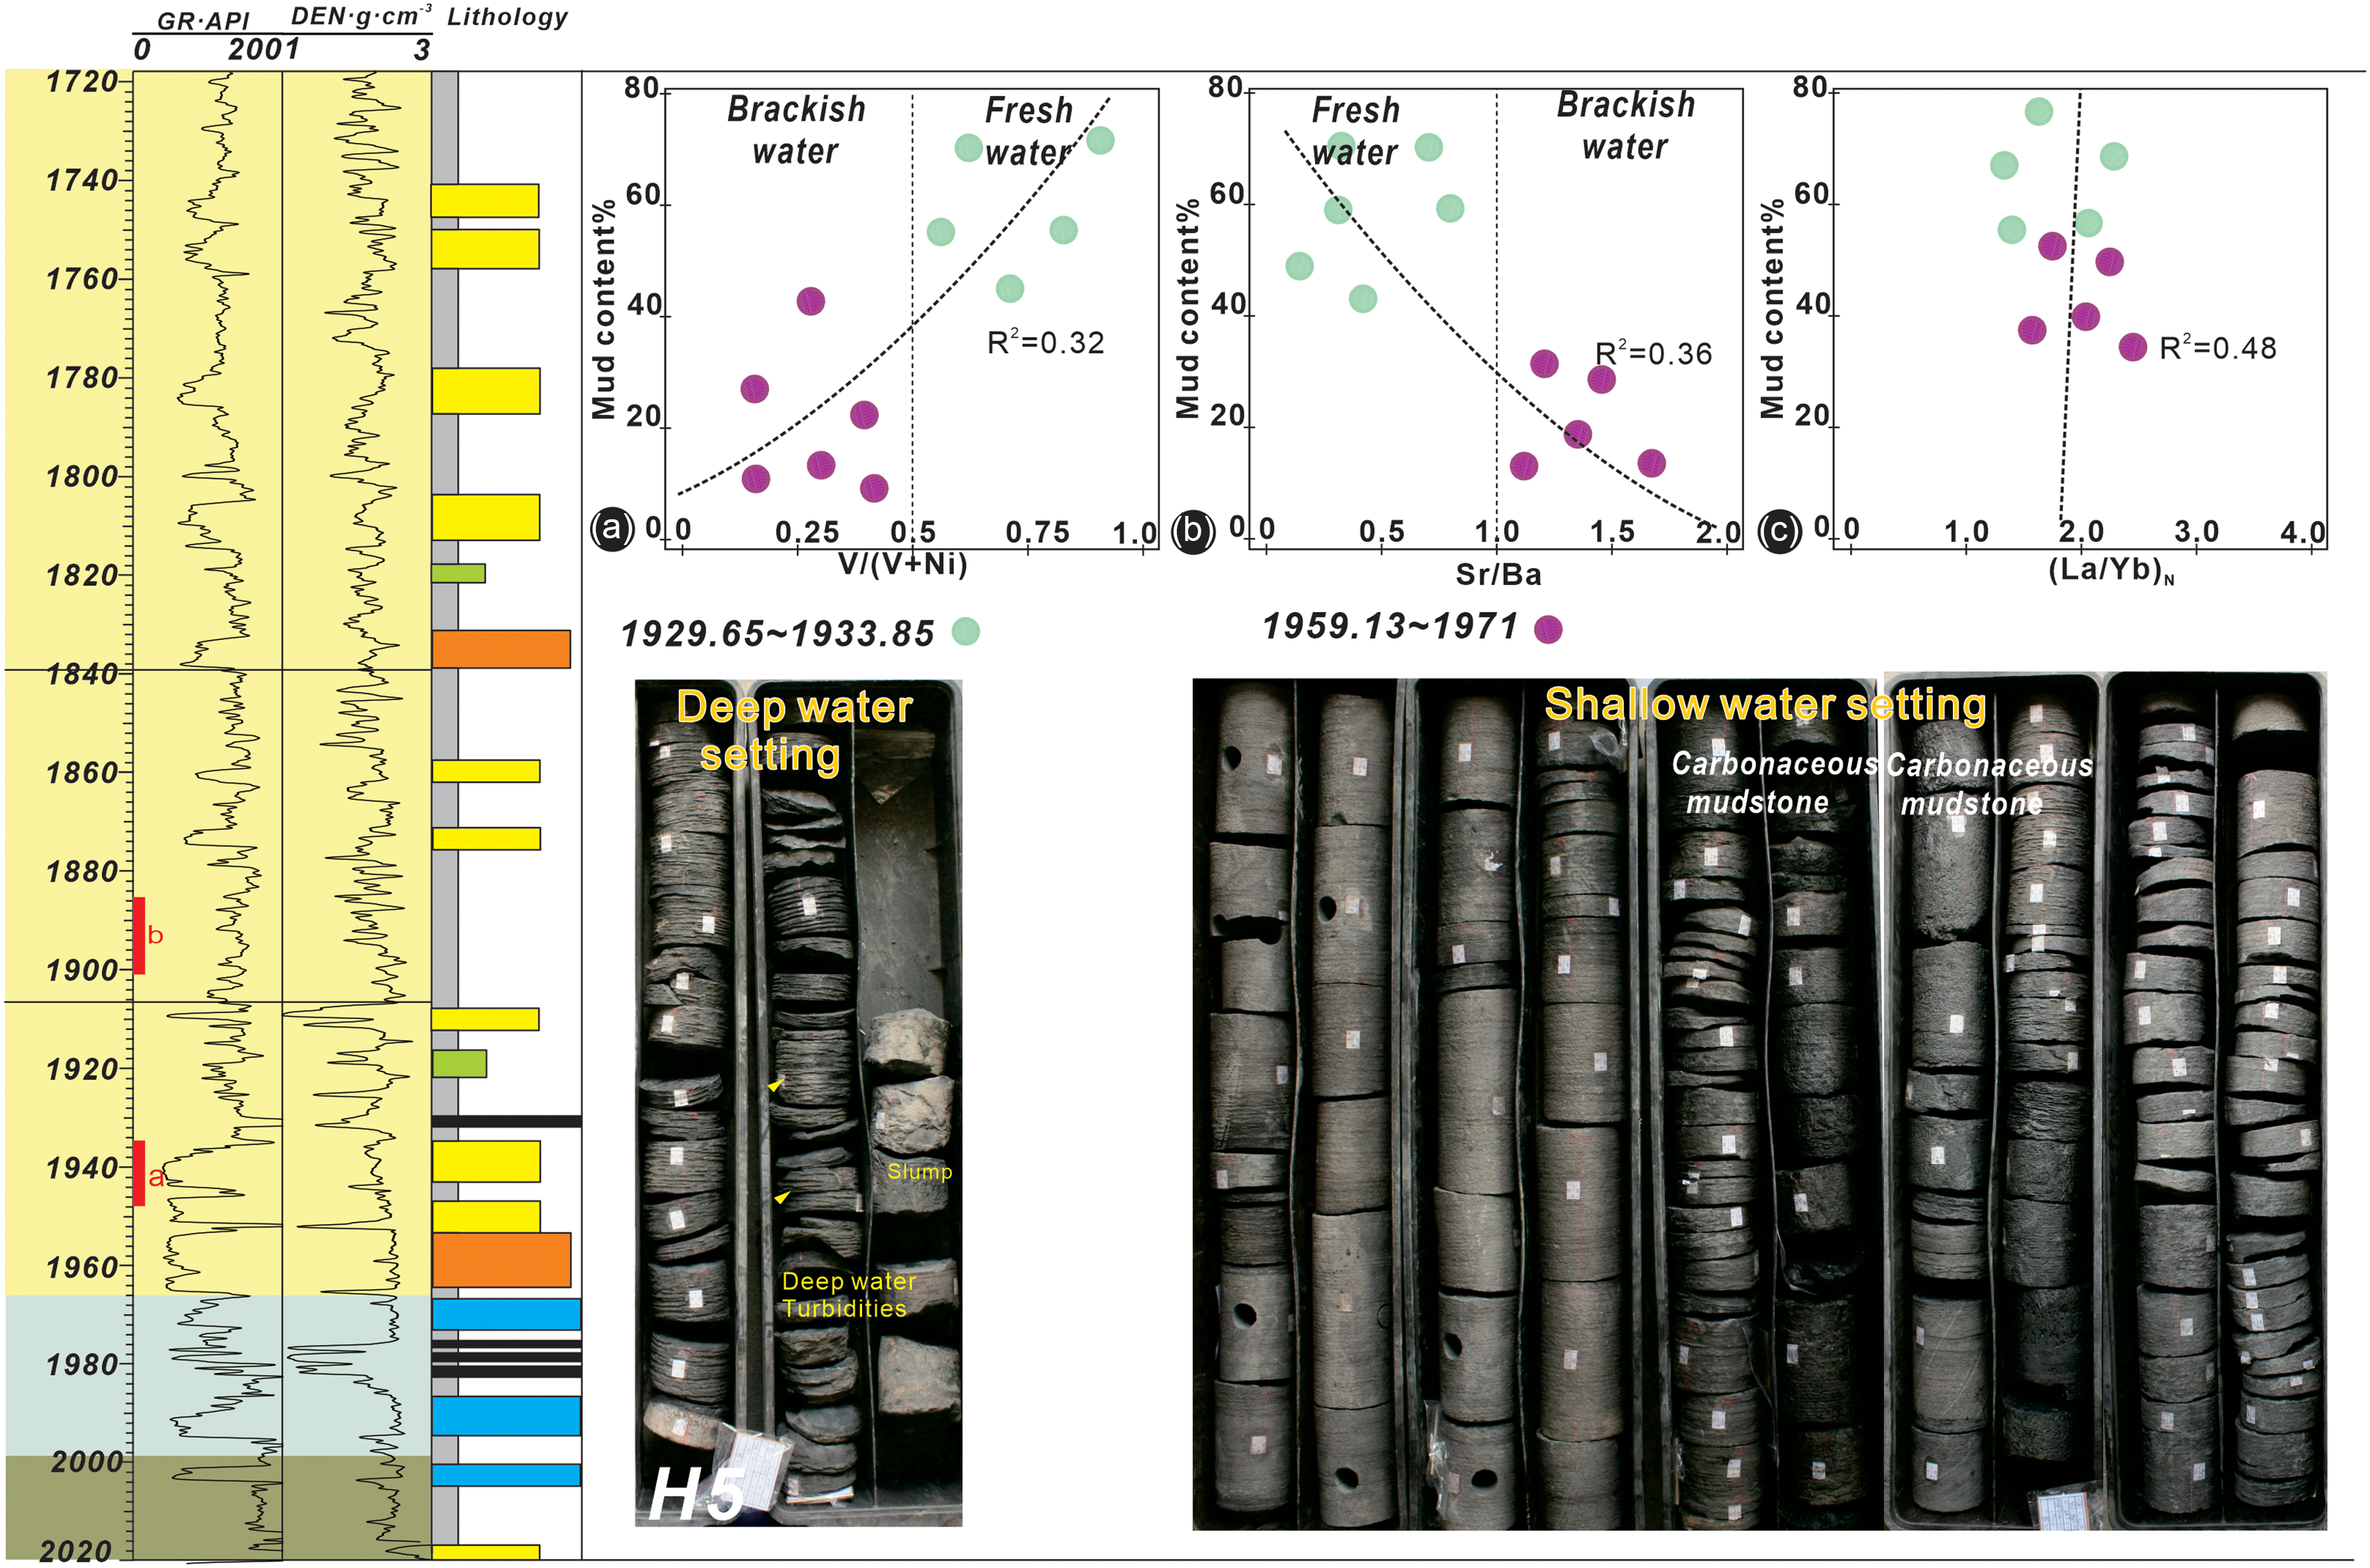
Fine-grained core samples from well DJ53 in the Shanxi Formation interval, representing the deposits in the semideep water offshore setting. Based on the lithofacies association, we identified lenticular bedded fine-grained sandstone (Fcl) and flaser bedded fine-grained sandstone (Fcf). The cross-plot shows the relationship between the mudstone and V/(V+Ni), Sr/Ba and (La/Yb)N. The ratios of V/(V+Ni) and Sr/Ba indicate the impact of the depositional setting on the fine-grained sediments preserved in the drainage basin, and (La/Yb)N shows a positive relationship between the depositional rate and the mudstone content (Goldstein & Jacobsen, Reference Goldstein and Jacobsen1988).

A cross-plot of the thickness of mudstone and the V/(V+Ni) and Sr/Ba ratios is shown, and high values of V/(V+Ni) and Sr/Ba ratios indicate a semiclosed setting. Moreover, the plot showing the (La/Yb)N versus mudstone thickness also shows a strong fit. This result indicates that the drainage in the semiclosed setting could transport and disperse large quantities of mud within the low-accommodation basin. Similarly, studies of barrier spits and beach plains, such as Grays Harbor, USA (Vanderburgh et al. Reference Vanderburgh, Roberts, Peterson, Phipps and Herb2010; Peterson et al. Reference Peterson, Linde and Vanderburgh2020), or bay environments, such as Willapa Bay, USA (Twichell et al. Reference Twichell, Cross and Peterson2010; Peterson et al. Reference Peterson, Linde and Vanderburgh2020), have also indicated that most sediments are deposited in coastal areas in a semiclosed setting.
We selected another well, H5, which revealed massive carbonaceous mudstone at its bottom and slumped and pure shale at the top. The lithofacies association mainly contains interdistributary bay facies (LFEs), which indicates a deep-water setting (Figure 13). This finding is shown as a cross-plot between the mud content and the V/(V+Ni) and Sr/Ba ratios, showing a poor correlation. Additionally, the poor fit between the thickness of the mudstone and the (La/Yb)N ratio indicates a weaker relationship between the sedimentation rate and fine-grained sediment accumulation. We infer that the depocenter area contained pure mudstone with high organic matter.
Fine-grained core samples from well H5 in the Shanxi Formation interval. Cross-bedding and slumped structures indicated an onshore setting in a semiclosed environment. The plot shows a positive relationship between the V/(V+Ni) ratio and the thickness of the mudstone and a negative relationship between the Sr/Ba ratio and mud content. These relationships indicate that an increase in external water input led to a higher mud content. The (La/Yb)N ratio shows a positive relationship between the depositional rate and mudstone content.

5.2.2 Open merged region: western part of the SE Ordos Basin
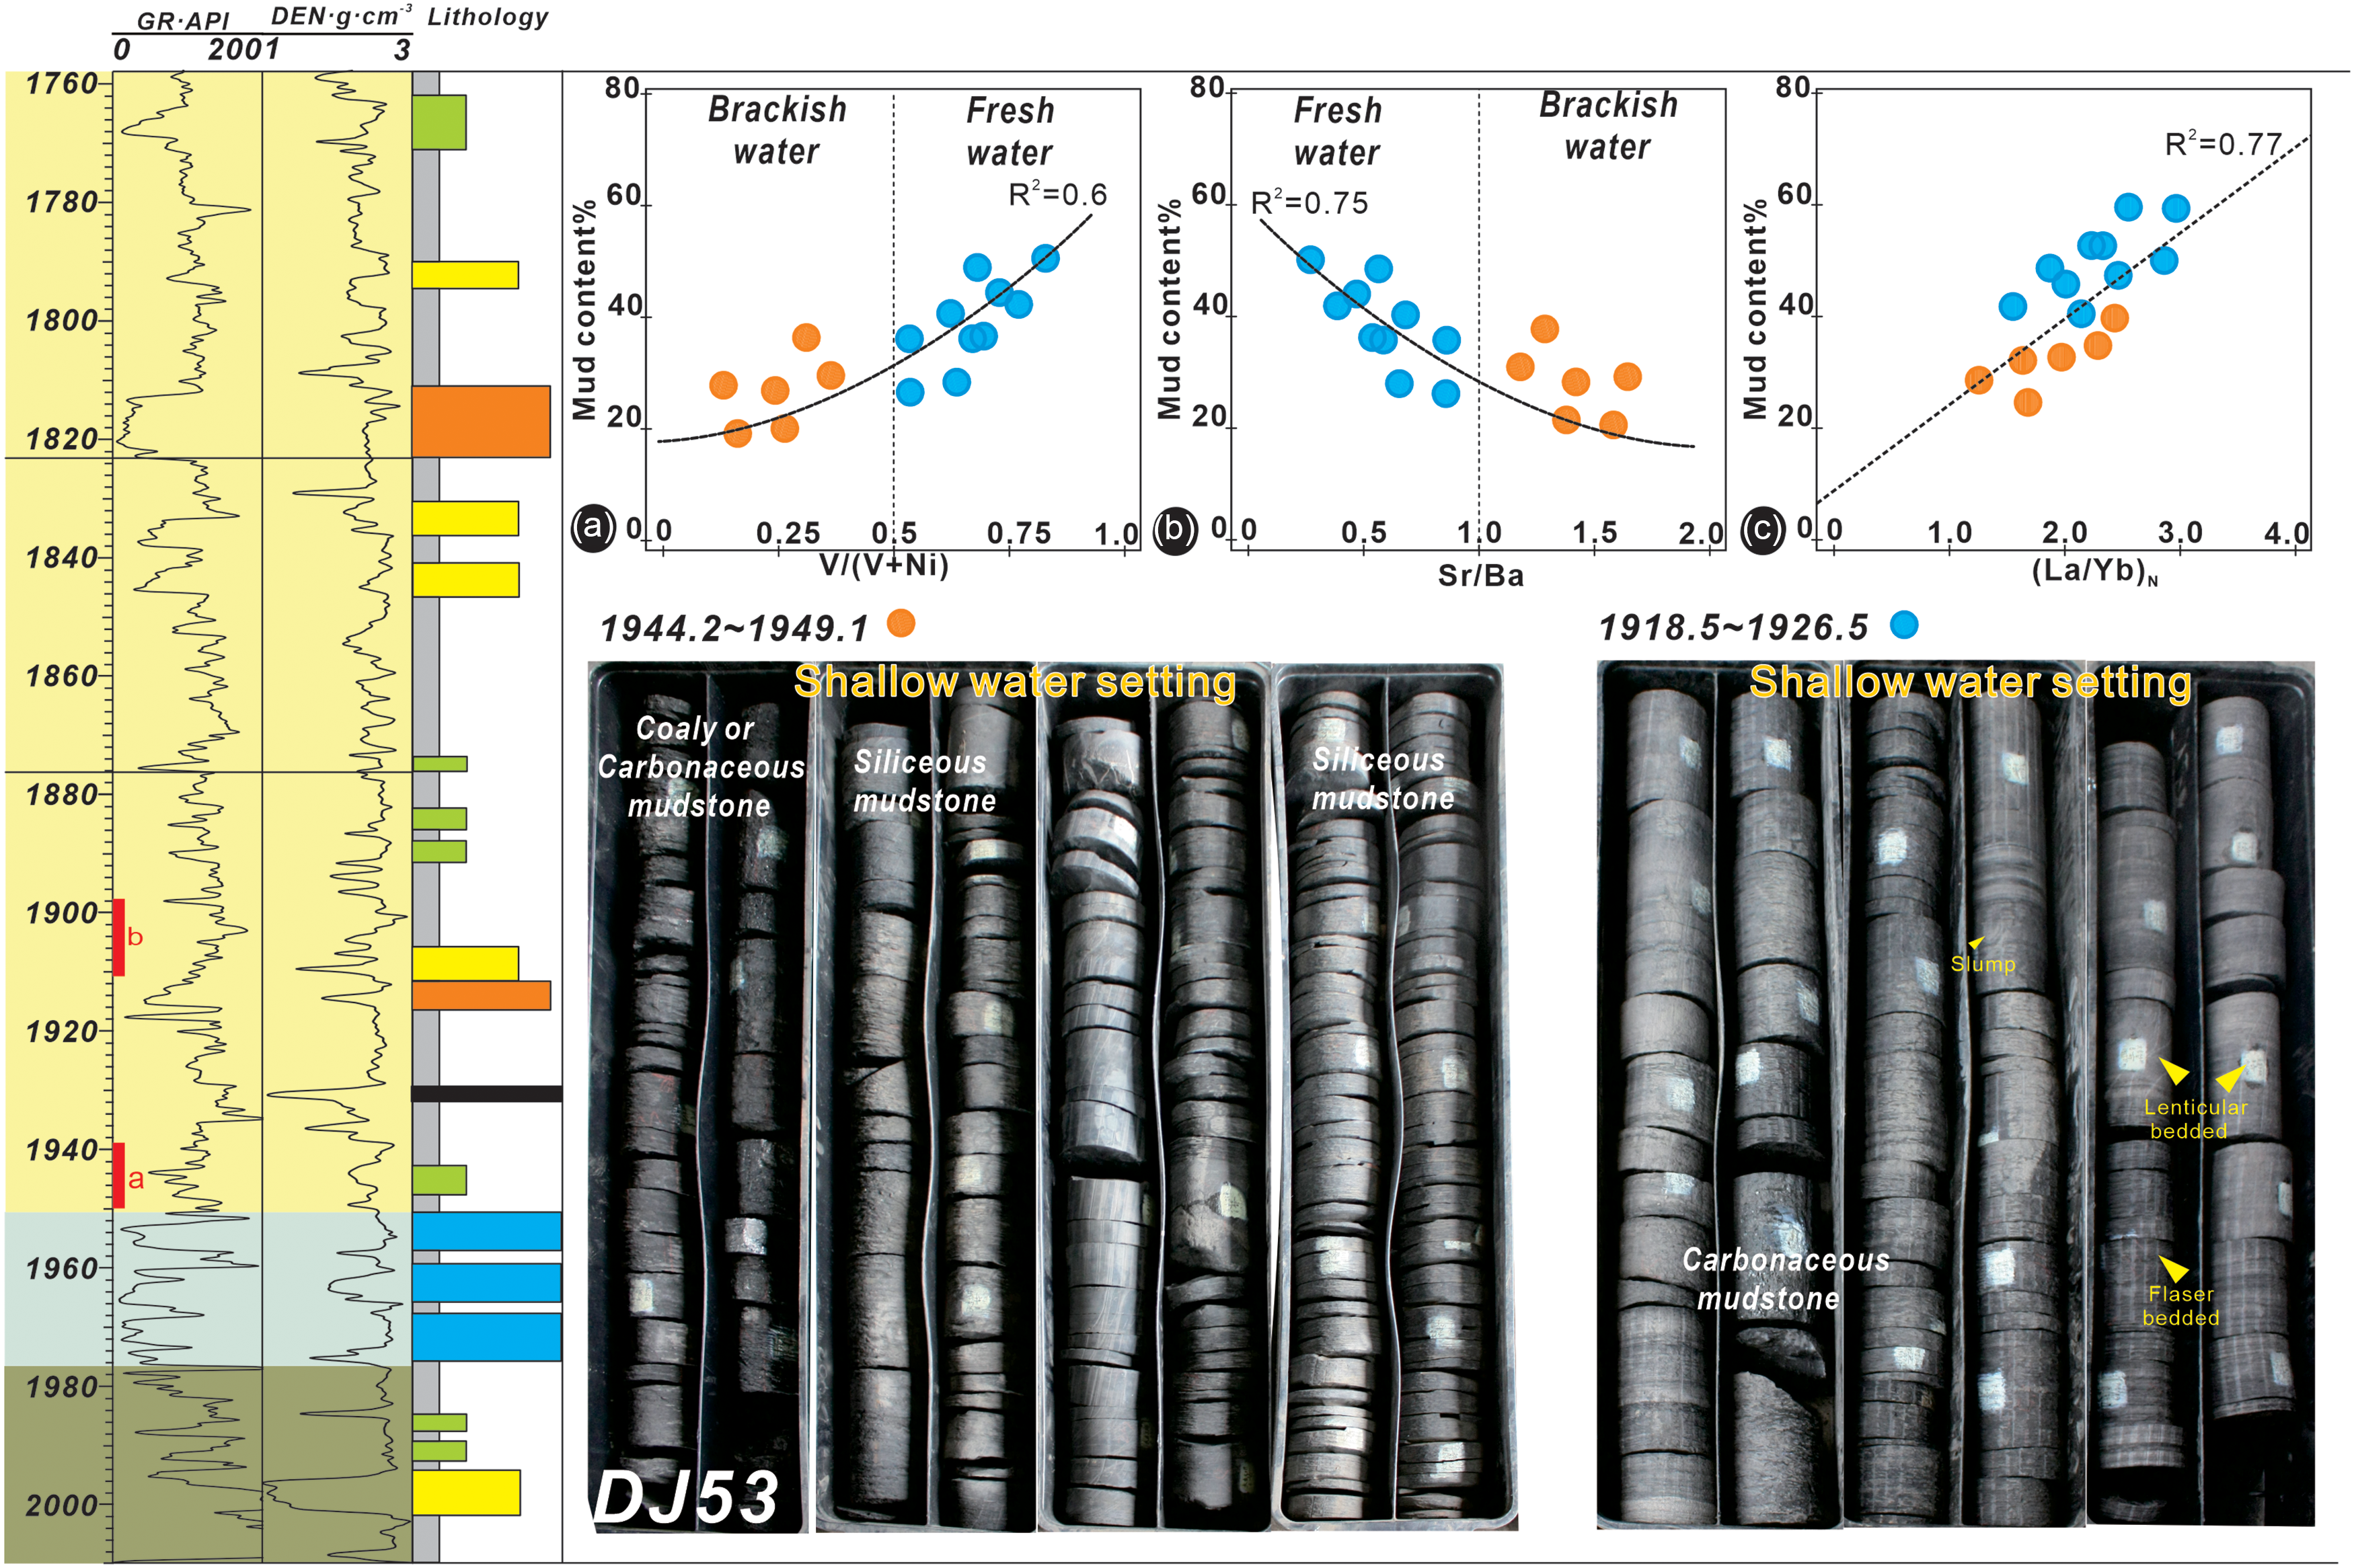
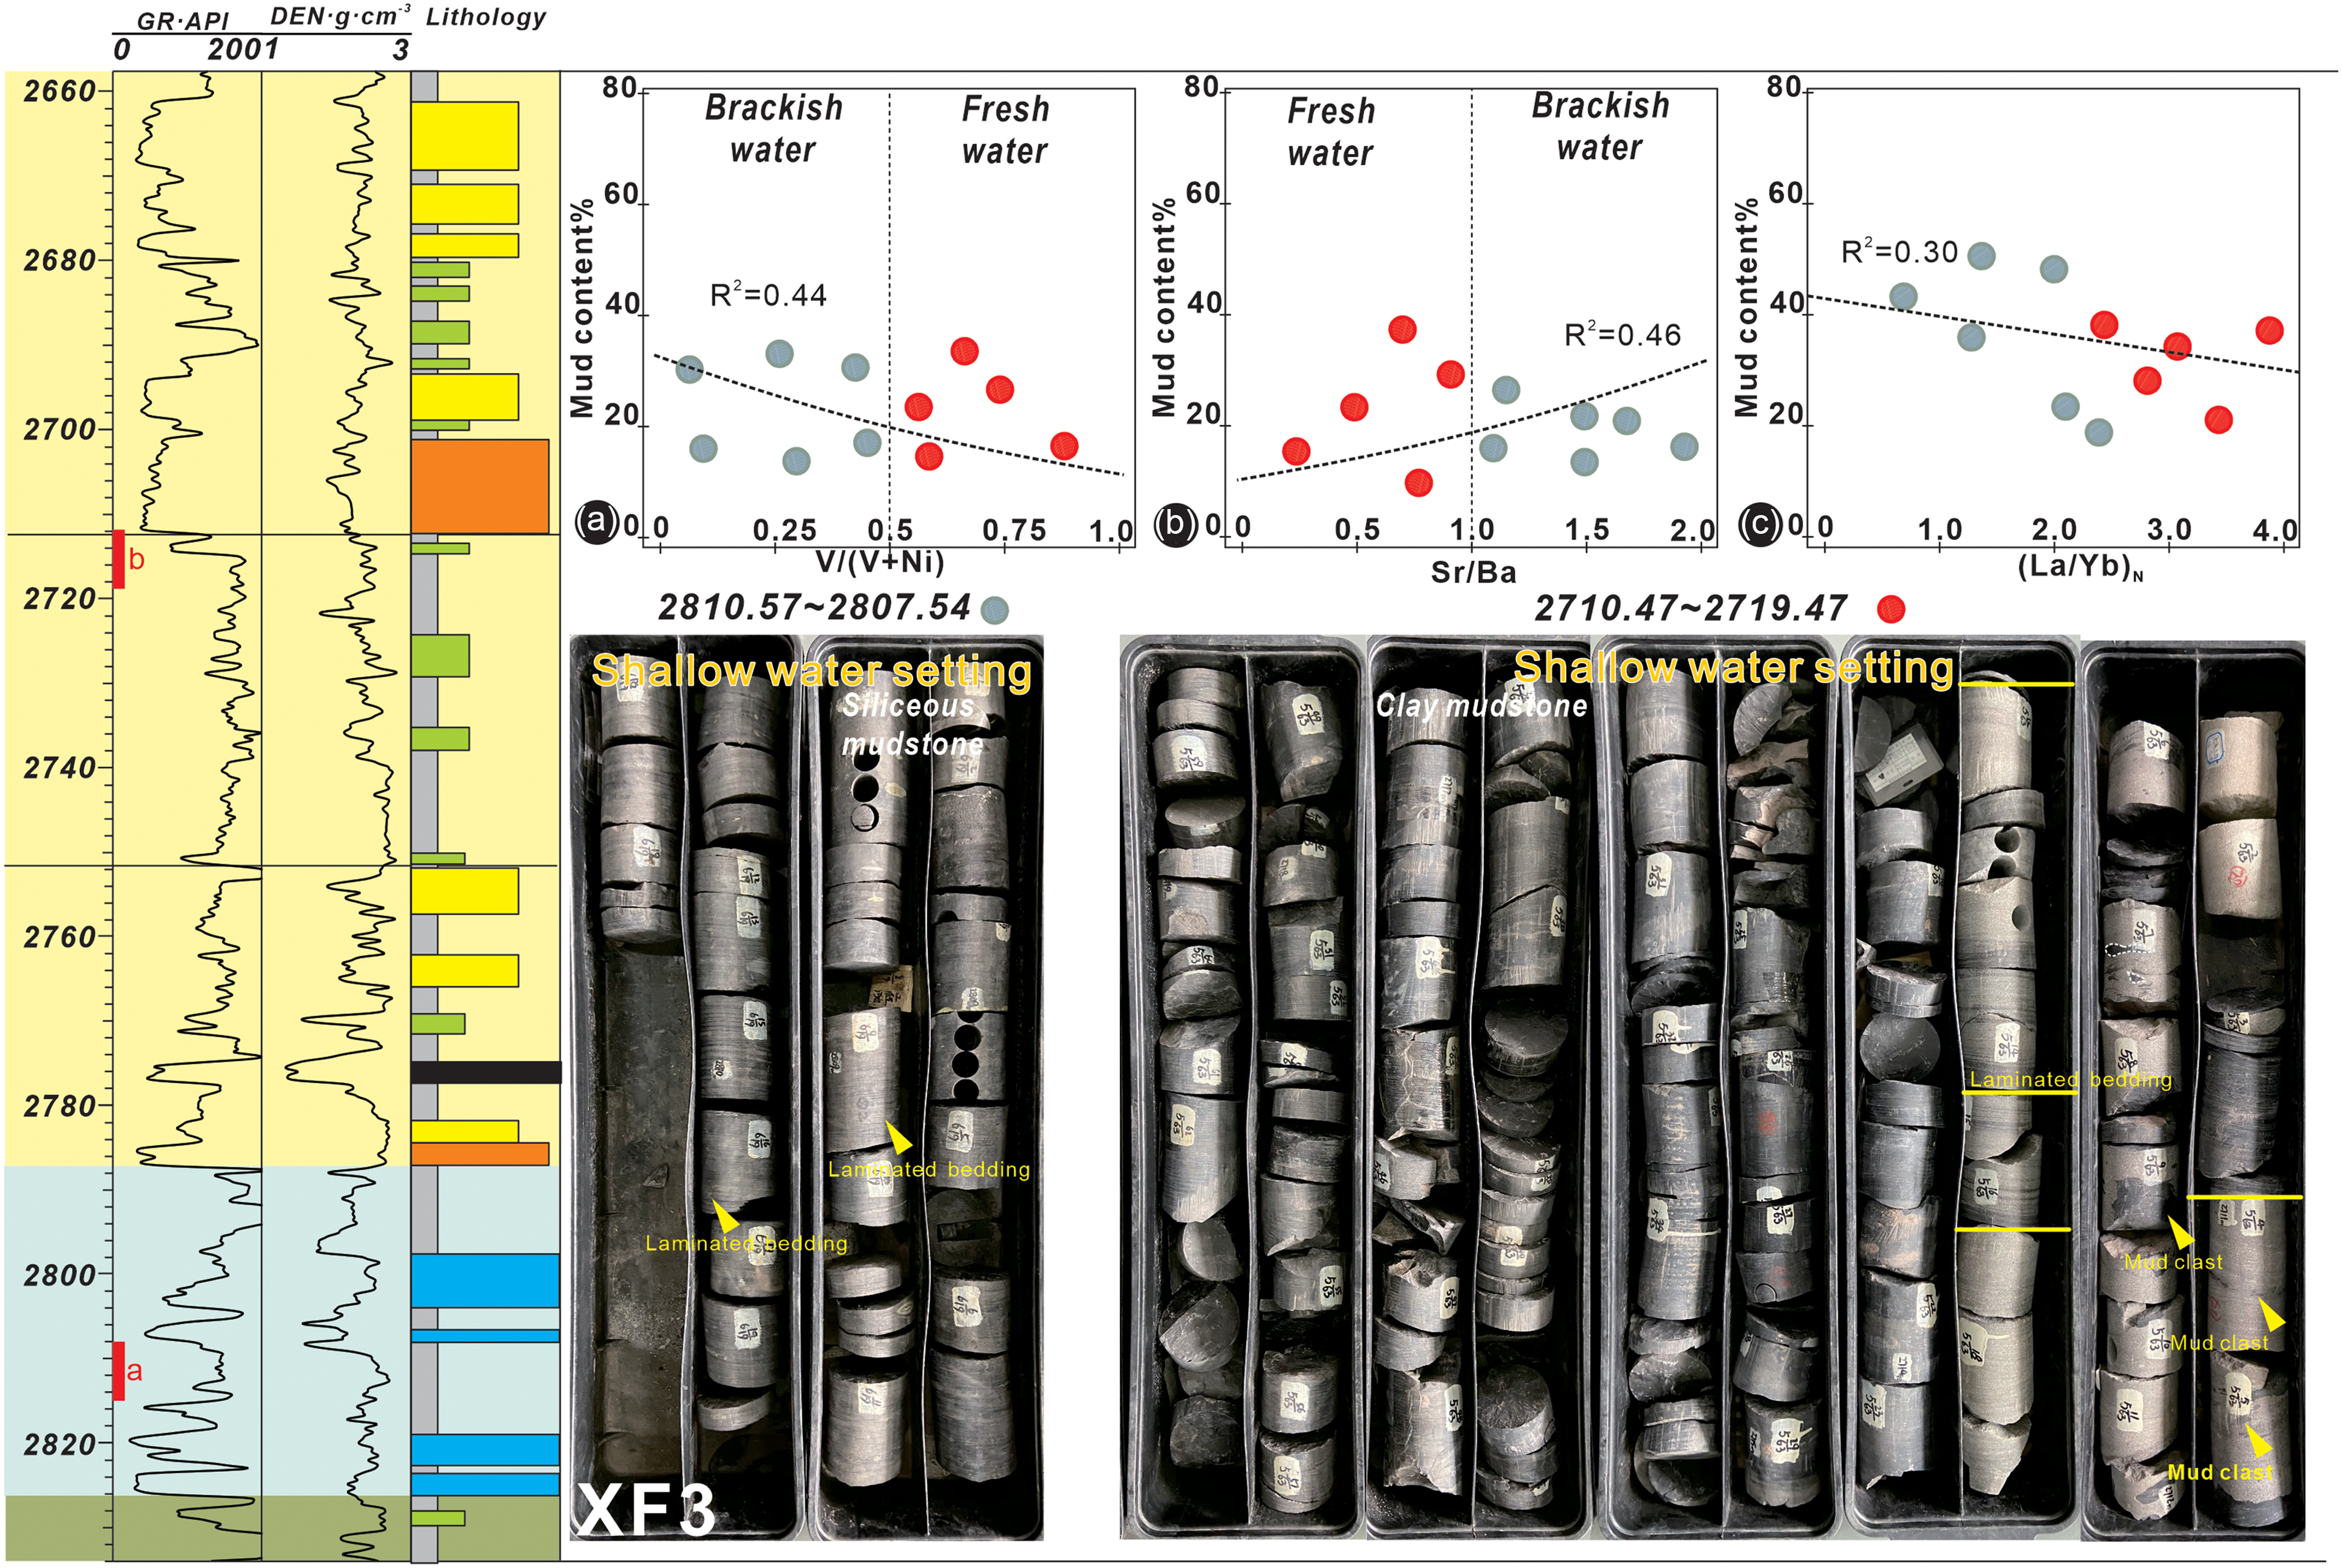
We selected well XF3 and found that the lithofacies included LFA, LFB, LFC and LFD. (Figure 14). Additionally, we found mud clasts at the bottom and laminated bedding in the top layer. According to the lithofacies association description, this finding indicates a shallow-water coastal setting, which is a typical open environment. The cross-plot between the mudstone content and the V/(V+Ni) and Sr/Ba ratios shows that more fine-grained deposits were deposited in the brackish setting. The fitting curve between mudstone and (La/Yb)N shows a negative correlation. We infer that in the open setting, intense hydrodynamics exchange mud with the open sea setting and less mud accumulates.
Fine-grained core samples from well XF3 in the Shanxi Formation interval. Some slump structures, mud clasts and wavy bedding were identified in the core samples, indicating an intense hydrodynamic setting within the shallow water setting. The ratios of V/(V+Ni) and Sr/Ba show a low correlation with the mudstone content, while (La/Yb)N shows a negative relationship between the depositional rate and mudstone content.

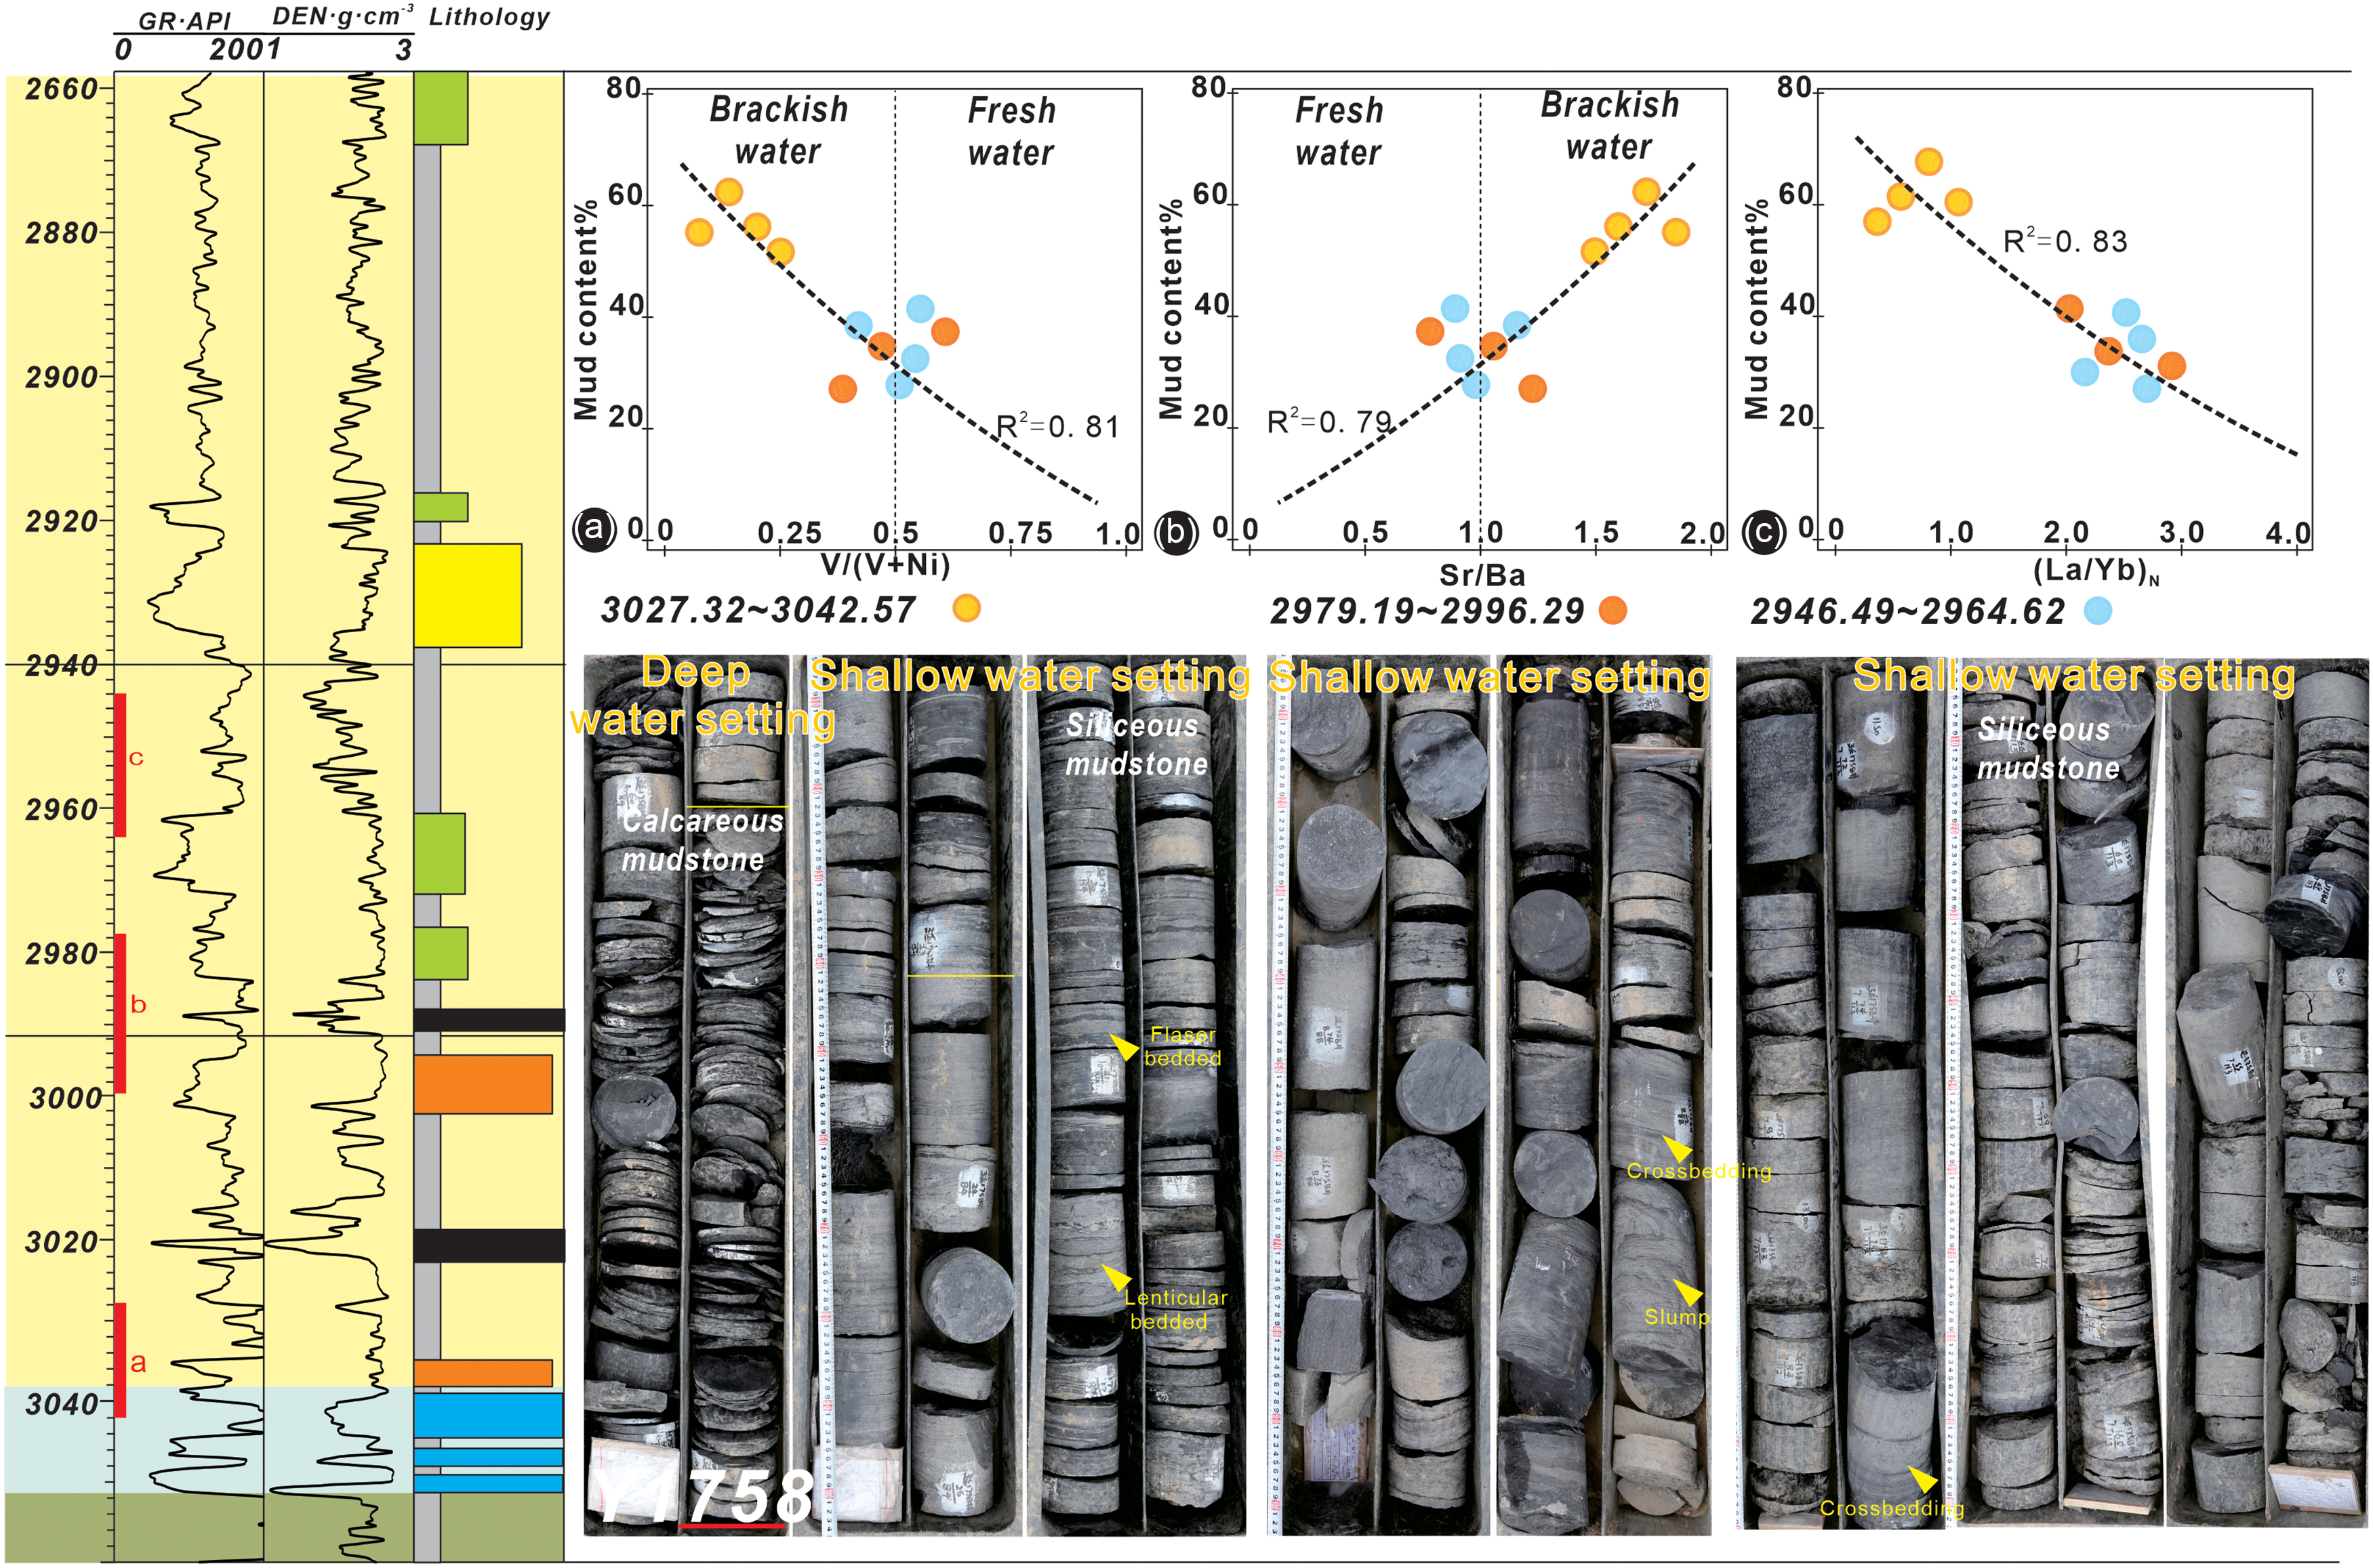
To characterize the depocenter, we selected well Y1758, which contains massive siliceous mudstone at its bottom and calcareous mudstone at the top (Figure 15). In the bottom layer, we identified wavy cross-bedding, and LFA and LFC developed, indicating shallow-water settings. The vertical lithofacies association shows a joint layer between the coarse-grained sediments with slump structures at the bottom and the fine-grained shales at the top. The fit of the cross-plot between mudstone and V/(V+Ni) and Sr/Ba is poor, while the fit between the mudstone content and (La/Yb)N is 0.8. Accordingly, we infer that the fine-grained deposits in the depocenter area were mainly provided by the multiprovenance system by turbidites or slumps.
Fine-grained core samples from well Y1758 in the Shanxi and Shihezi Formation interval. Laminated bedding developed in massive dark mudstone, which indicates a deep-water or deep-water setting within the open setting. The ratios of V/(V+NI) and Sr/Ba have a strong fit with the mud content and indicate a negative relationship between the (La/Yb)N value and the depositional rate.

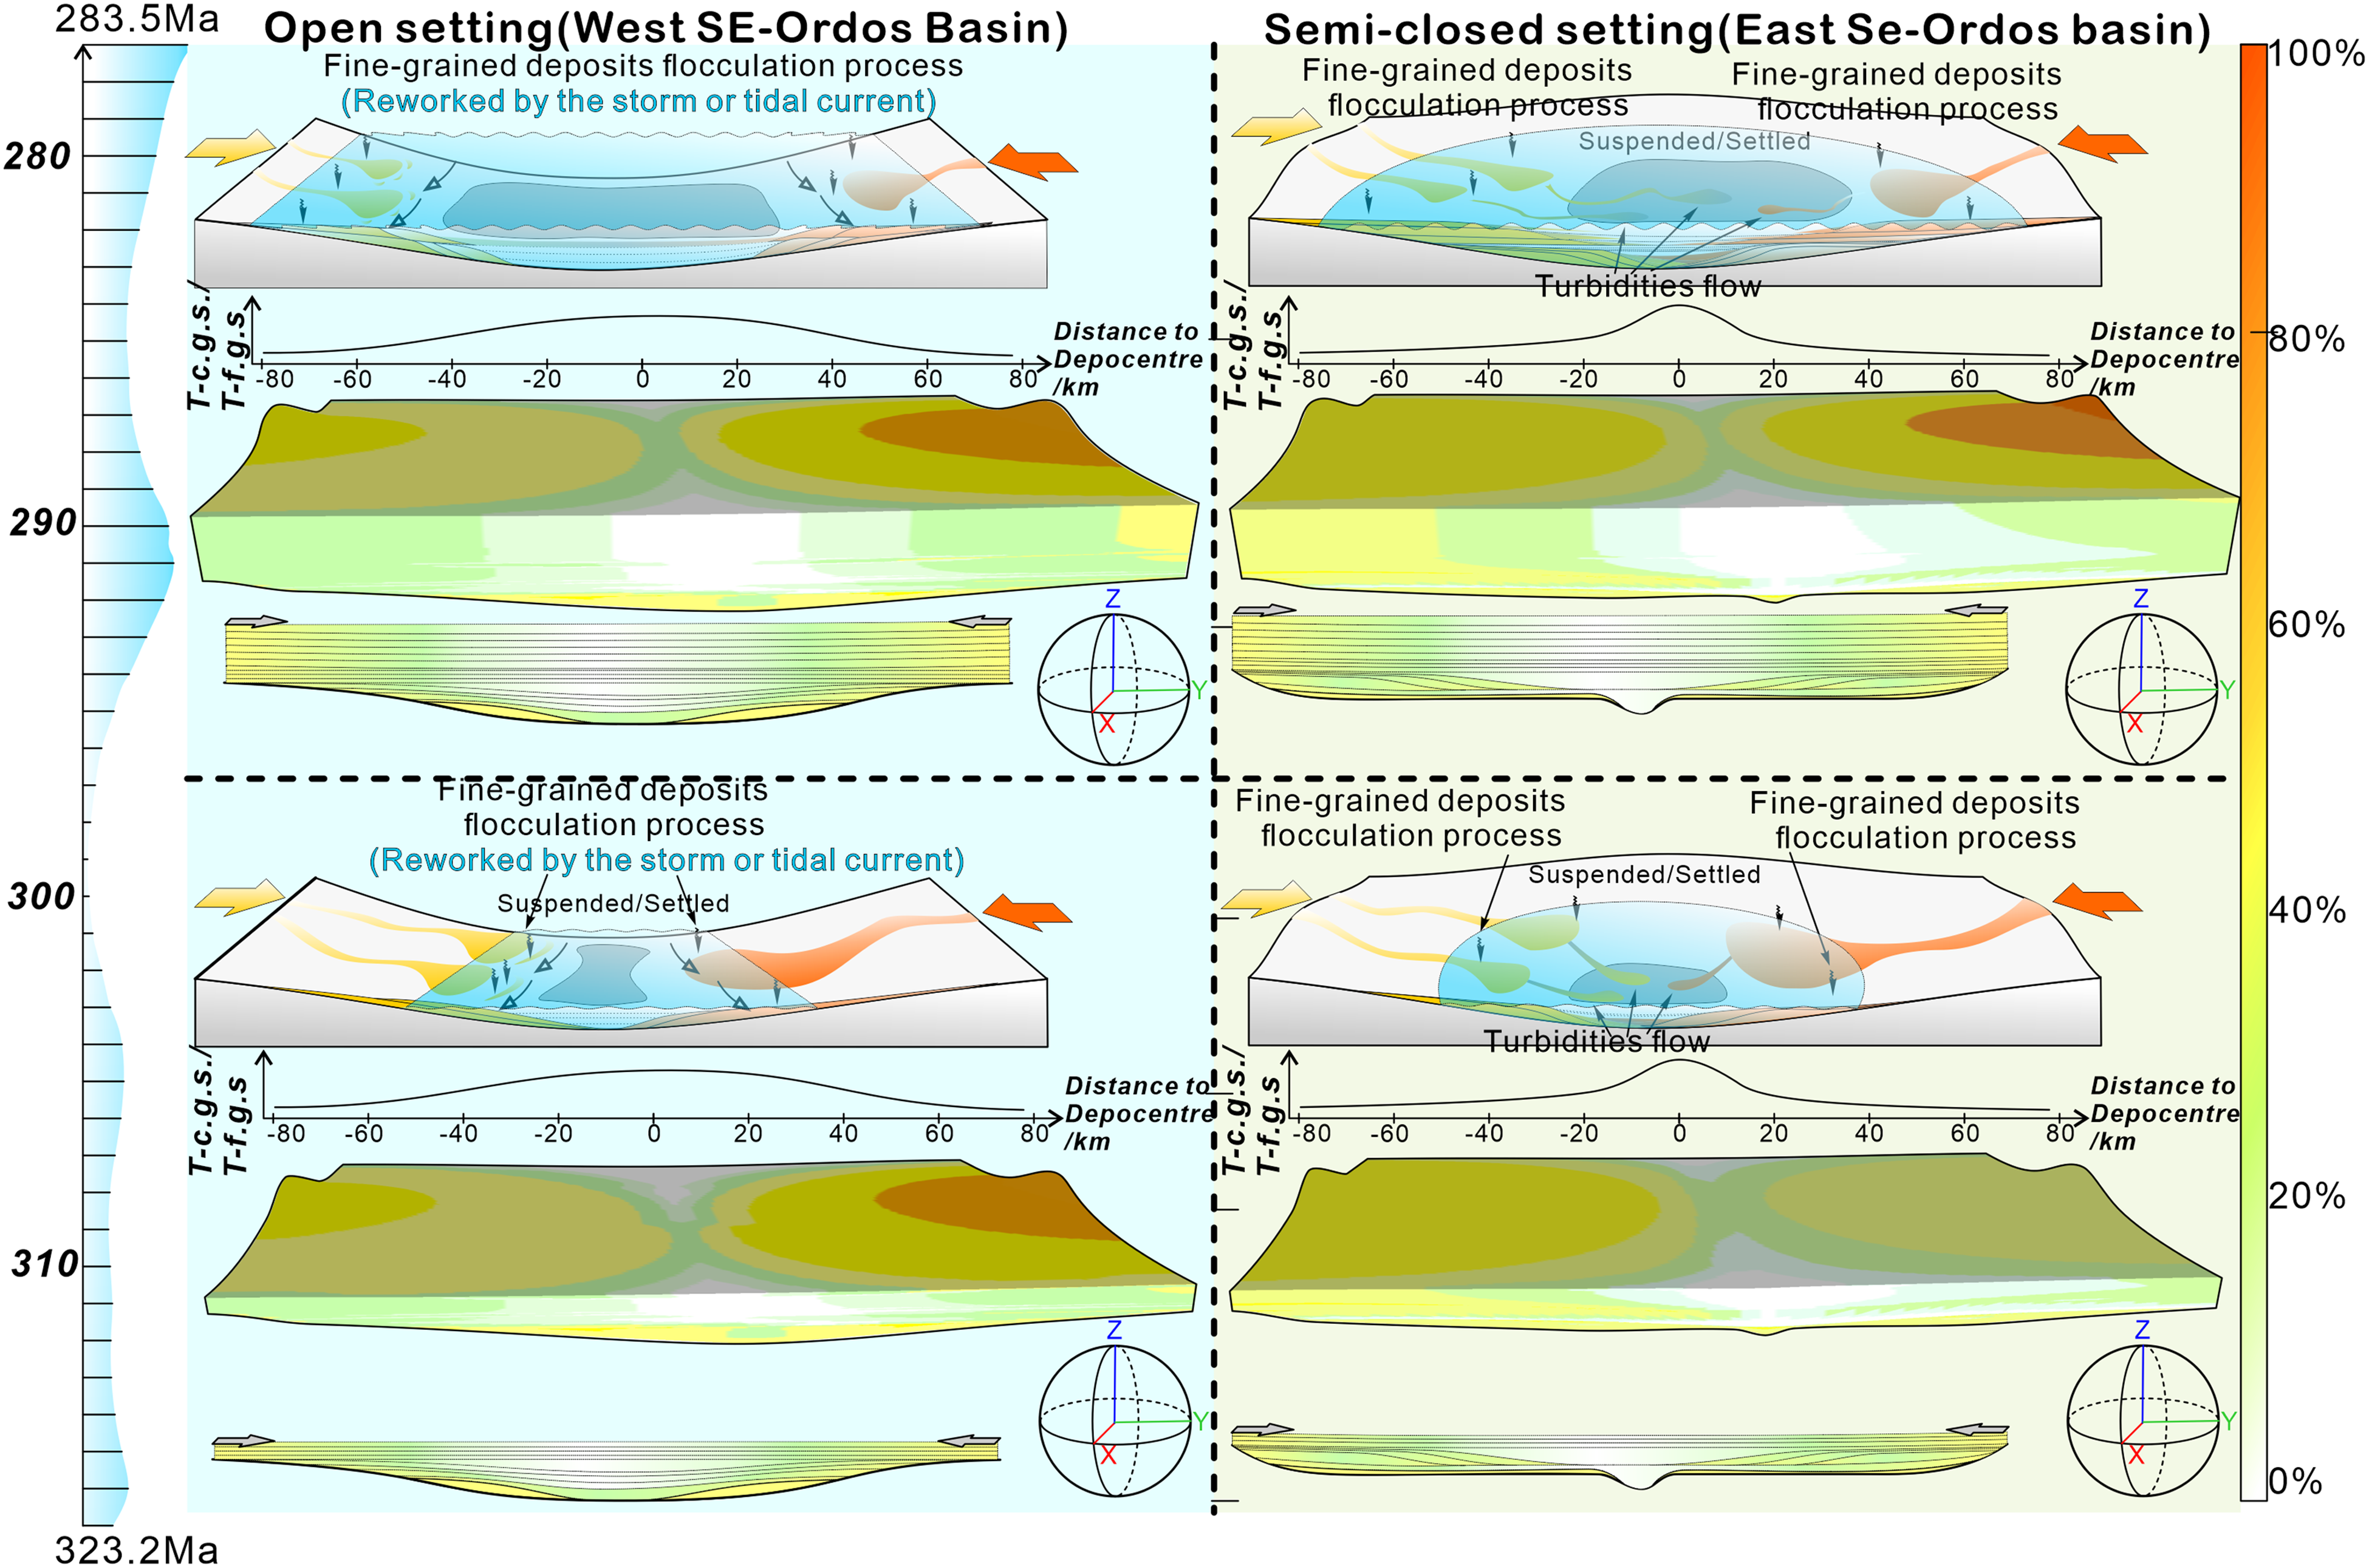
Comparison of the two types of sediment infilling processes, referring to the results of stratigraphic simulations. A) and B) The infilling process, merging process and profiles in an open setting and C) and D) A semiclosed setting. During the low sea level stage, sediments with multiple source areas are input into the drainage basin and present two different stratigraphic stacking patterns in the open setting and semiclosed setting. In the open setting, mixed sediments and clinoforms develop only in the basin margin area, and the prograding delta is characterized by a high progradation rate and low aggradation rate. The clinoform in the semiclosed setting presents a low progradation rate and a high aggradation rate. Until the high sea level stage, prograding deltas are characterized by a similar progradation rate and aggradation rate, leading to a planar morphology.

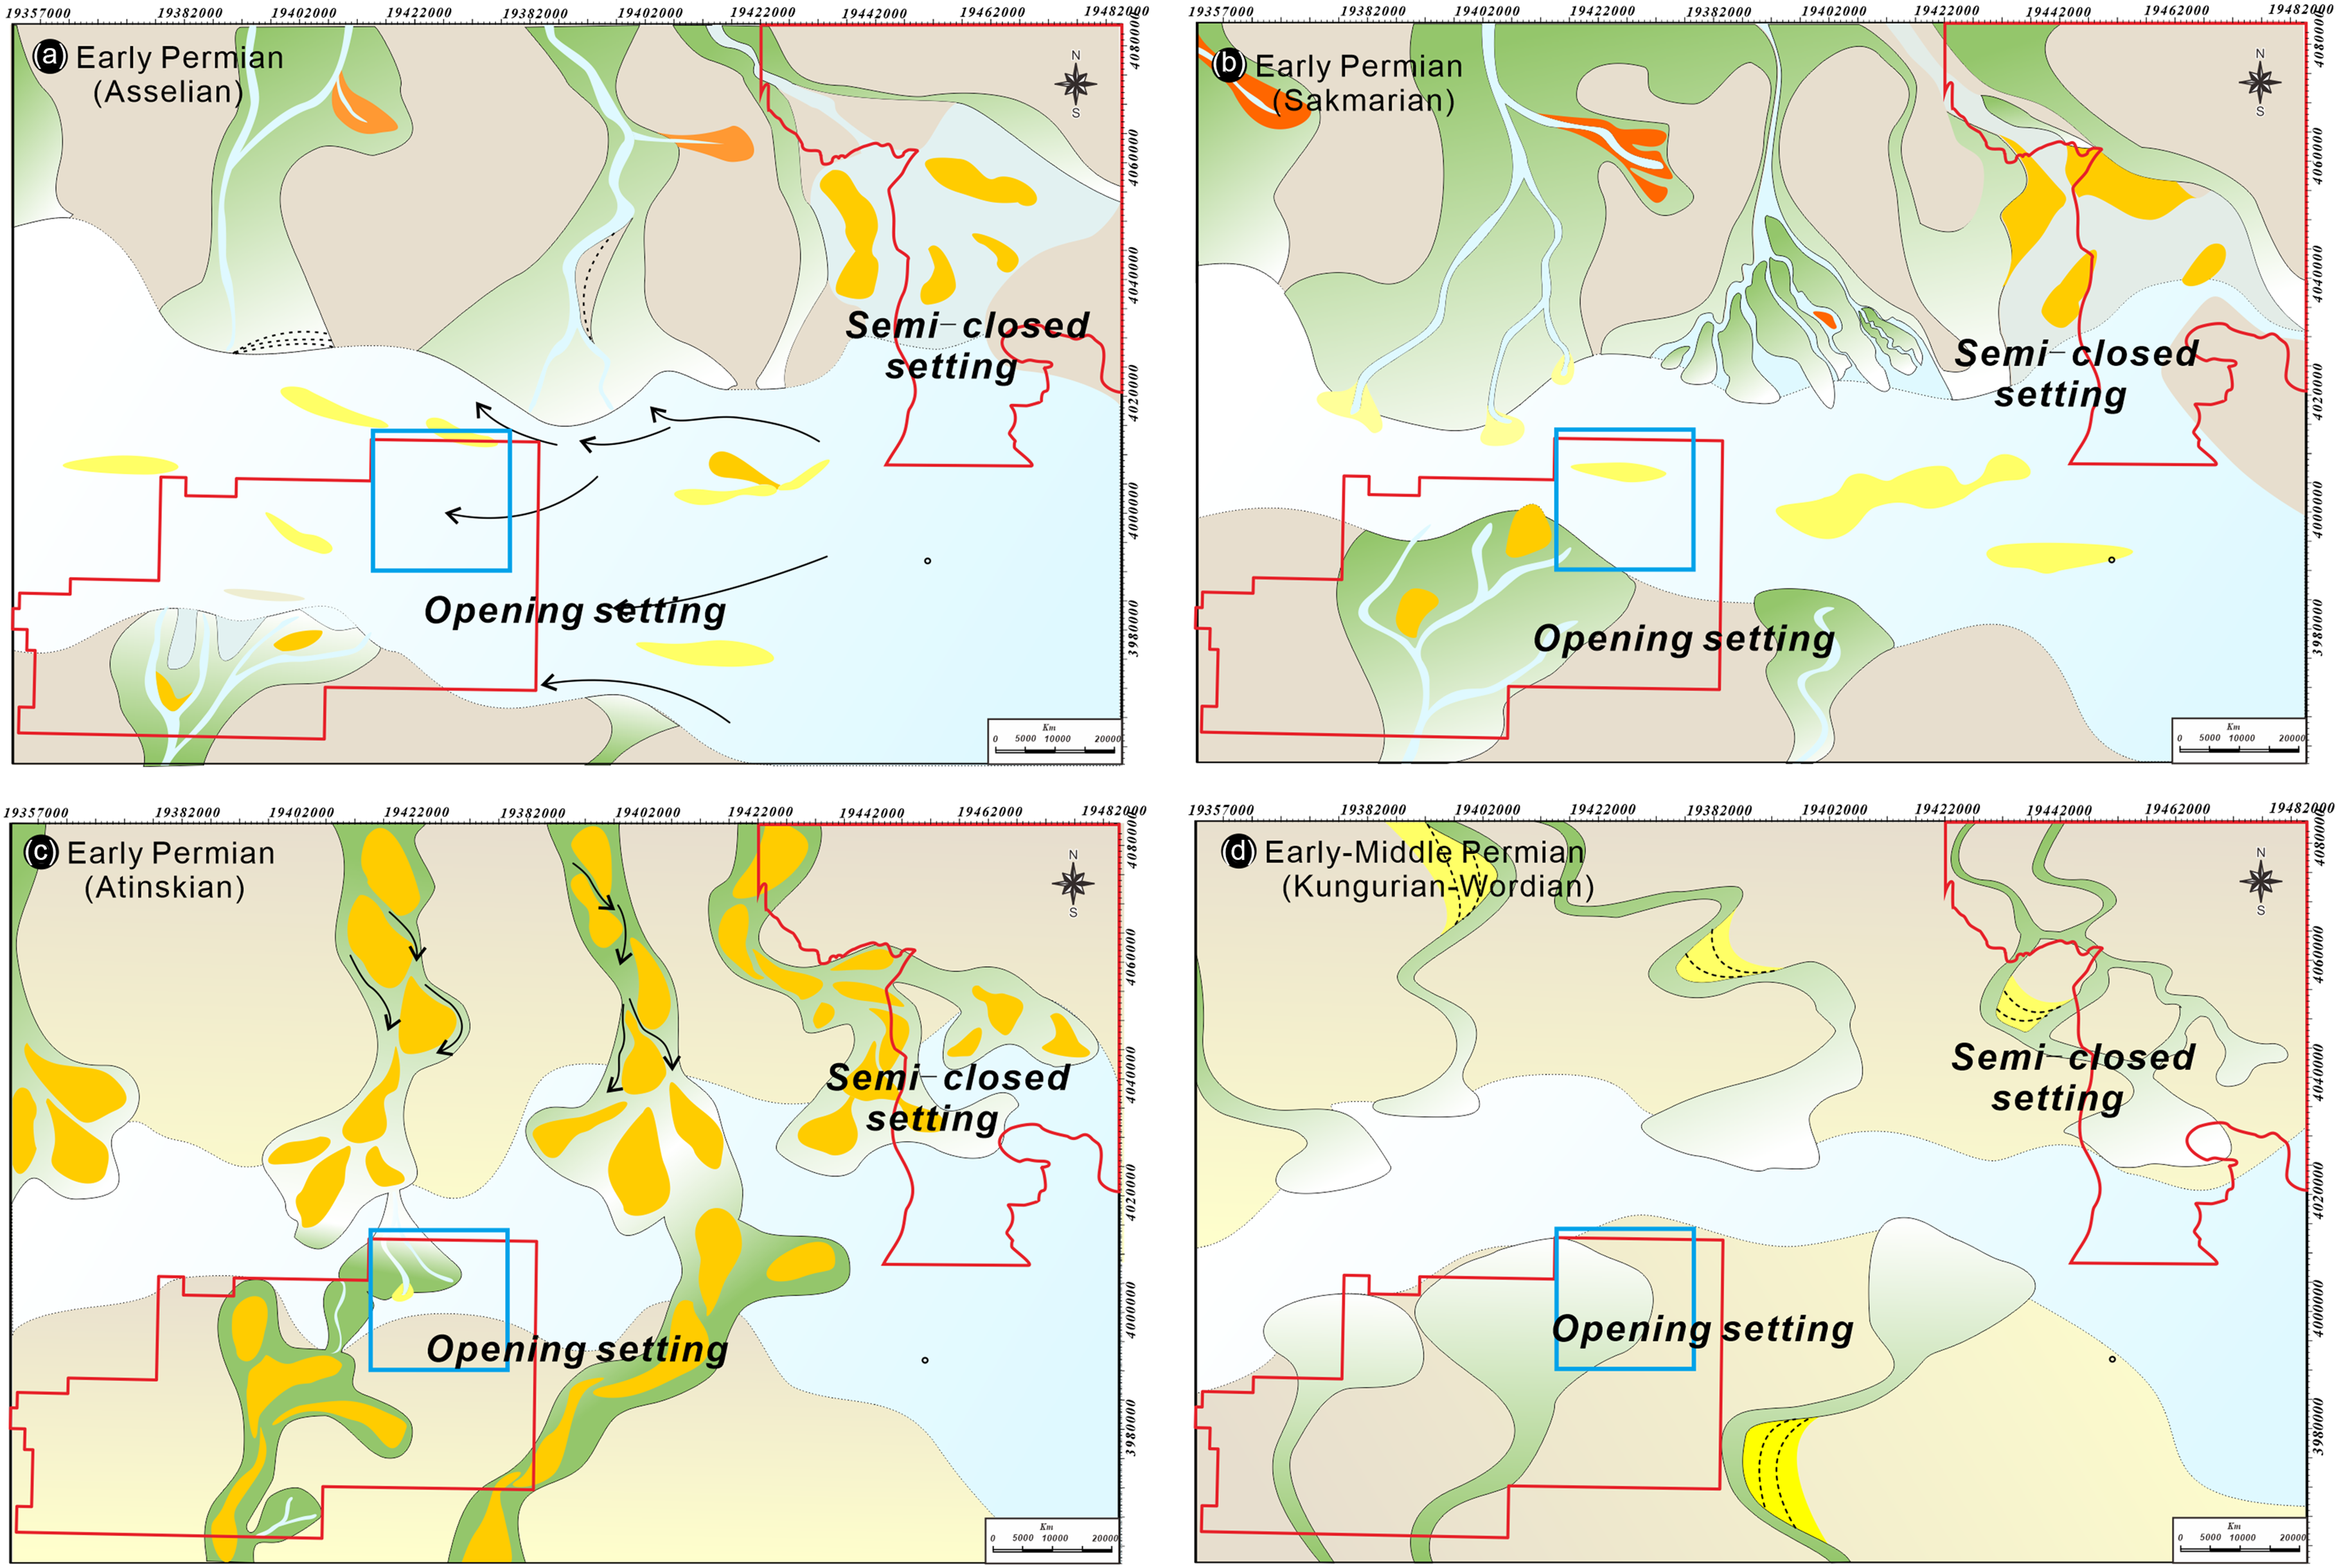
Facies association in the SE Ordos Basin during the Pennsylvanian to middle Permian.


5.3 Impact of the accommodation space area on various S2S systems
We reconstructed the infilling process in the semiclosed setting (Figure 16) and facies association distribution of the SE Ordos Basin during the early Permian (Figure 17). Furthermore, according to the parameter statistics (Table 3 and Table 4), we input the parameters, including the subsidence rate (4th column in Table 3), sediment budget (9th column in Table 3), slope angle (8th column in Table 4), initial water depth and local relative sea level (Figure 7), into the software. Then, we set the lowest concentration of debris in the channels. Referring to the study of Yin et al. (2016) on intermountain rivers and grain size in Table 4, we set the concentration of debris to 0.1 g/L in this study. Finally, we simulated the sedimentary process with Dionisos© software and showed the merging process in open and semiclosed settings (Figure 16).
-
(1) Regarding the closed setting, the sediments in the drainage area can hardly exchange the sediments with the outside, and its hydrodynamic setting has low energy, leading to most fine-grained deposits accumulating in the depocenter area. The sediments from the multiple source areas input progradational sediments into the shallow-water setting during the deposition of low sea-level systems tracts. In the upper transgressive or highstand systems tracts (Figure 16), the mass sediments were transported by multiple S2S systems, which led to an overfilling process in the basin with low-accommodation space. Referring to the study of Olariu et al. (Reference Olariu, Zhou, Steel, Zhang, Yuan, Zhang, Chen, Cheng and Kim2021), the low tectonic subsidence rate limits the rise in the accommodation space. Thus, we infer that the fine-grained sediments occupied the accumulation space in the sink area.
-
(2) Regarding the open setting, tidal reworking and wave currents may have led to a high-energy hydrodynamic setting. Some prograding deltas developed along the coastline during low sea level system tract deposition. During sea level rise, the reworking process carried away fine-grained deposits, and sufficient accommodation space was created. Additionally, the simulated results show a joint layer between the coarse-grained sediments and the fine-grained sediments.
5.4.1 Intense interaction in multiple provenance areas
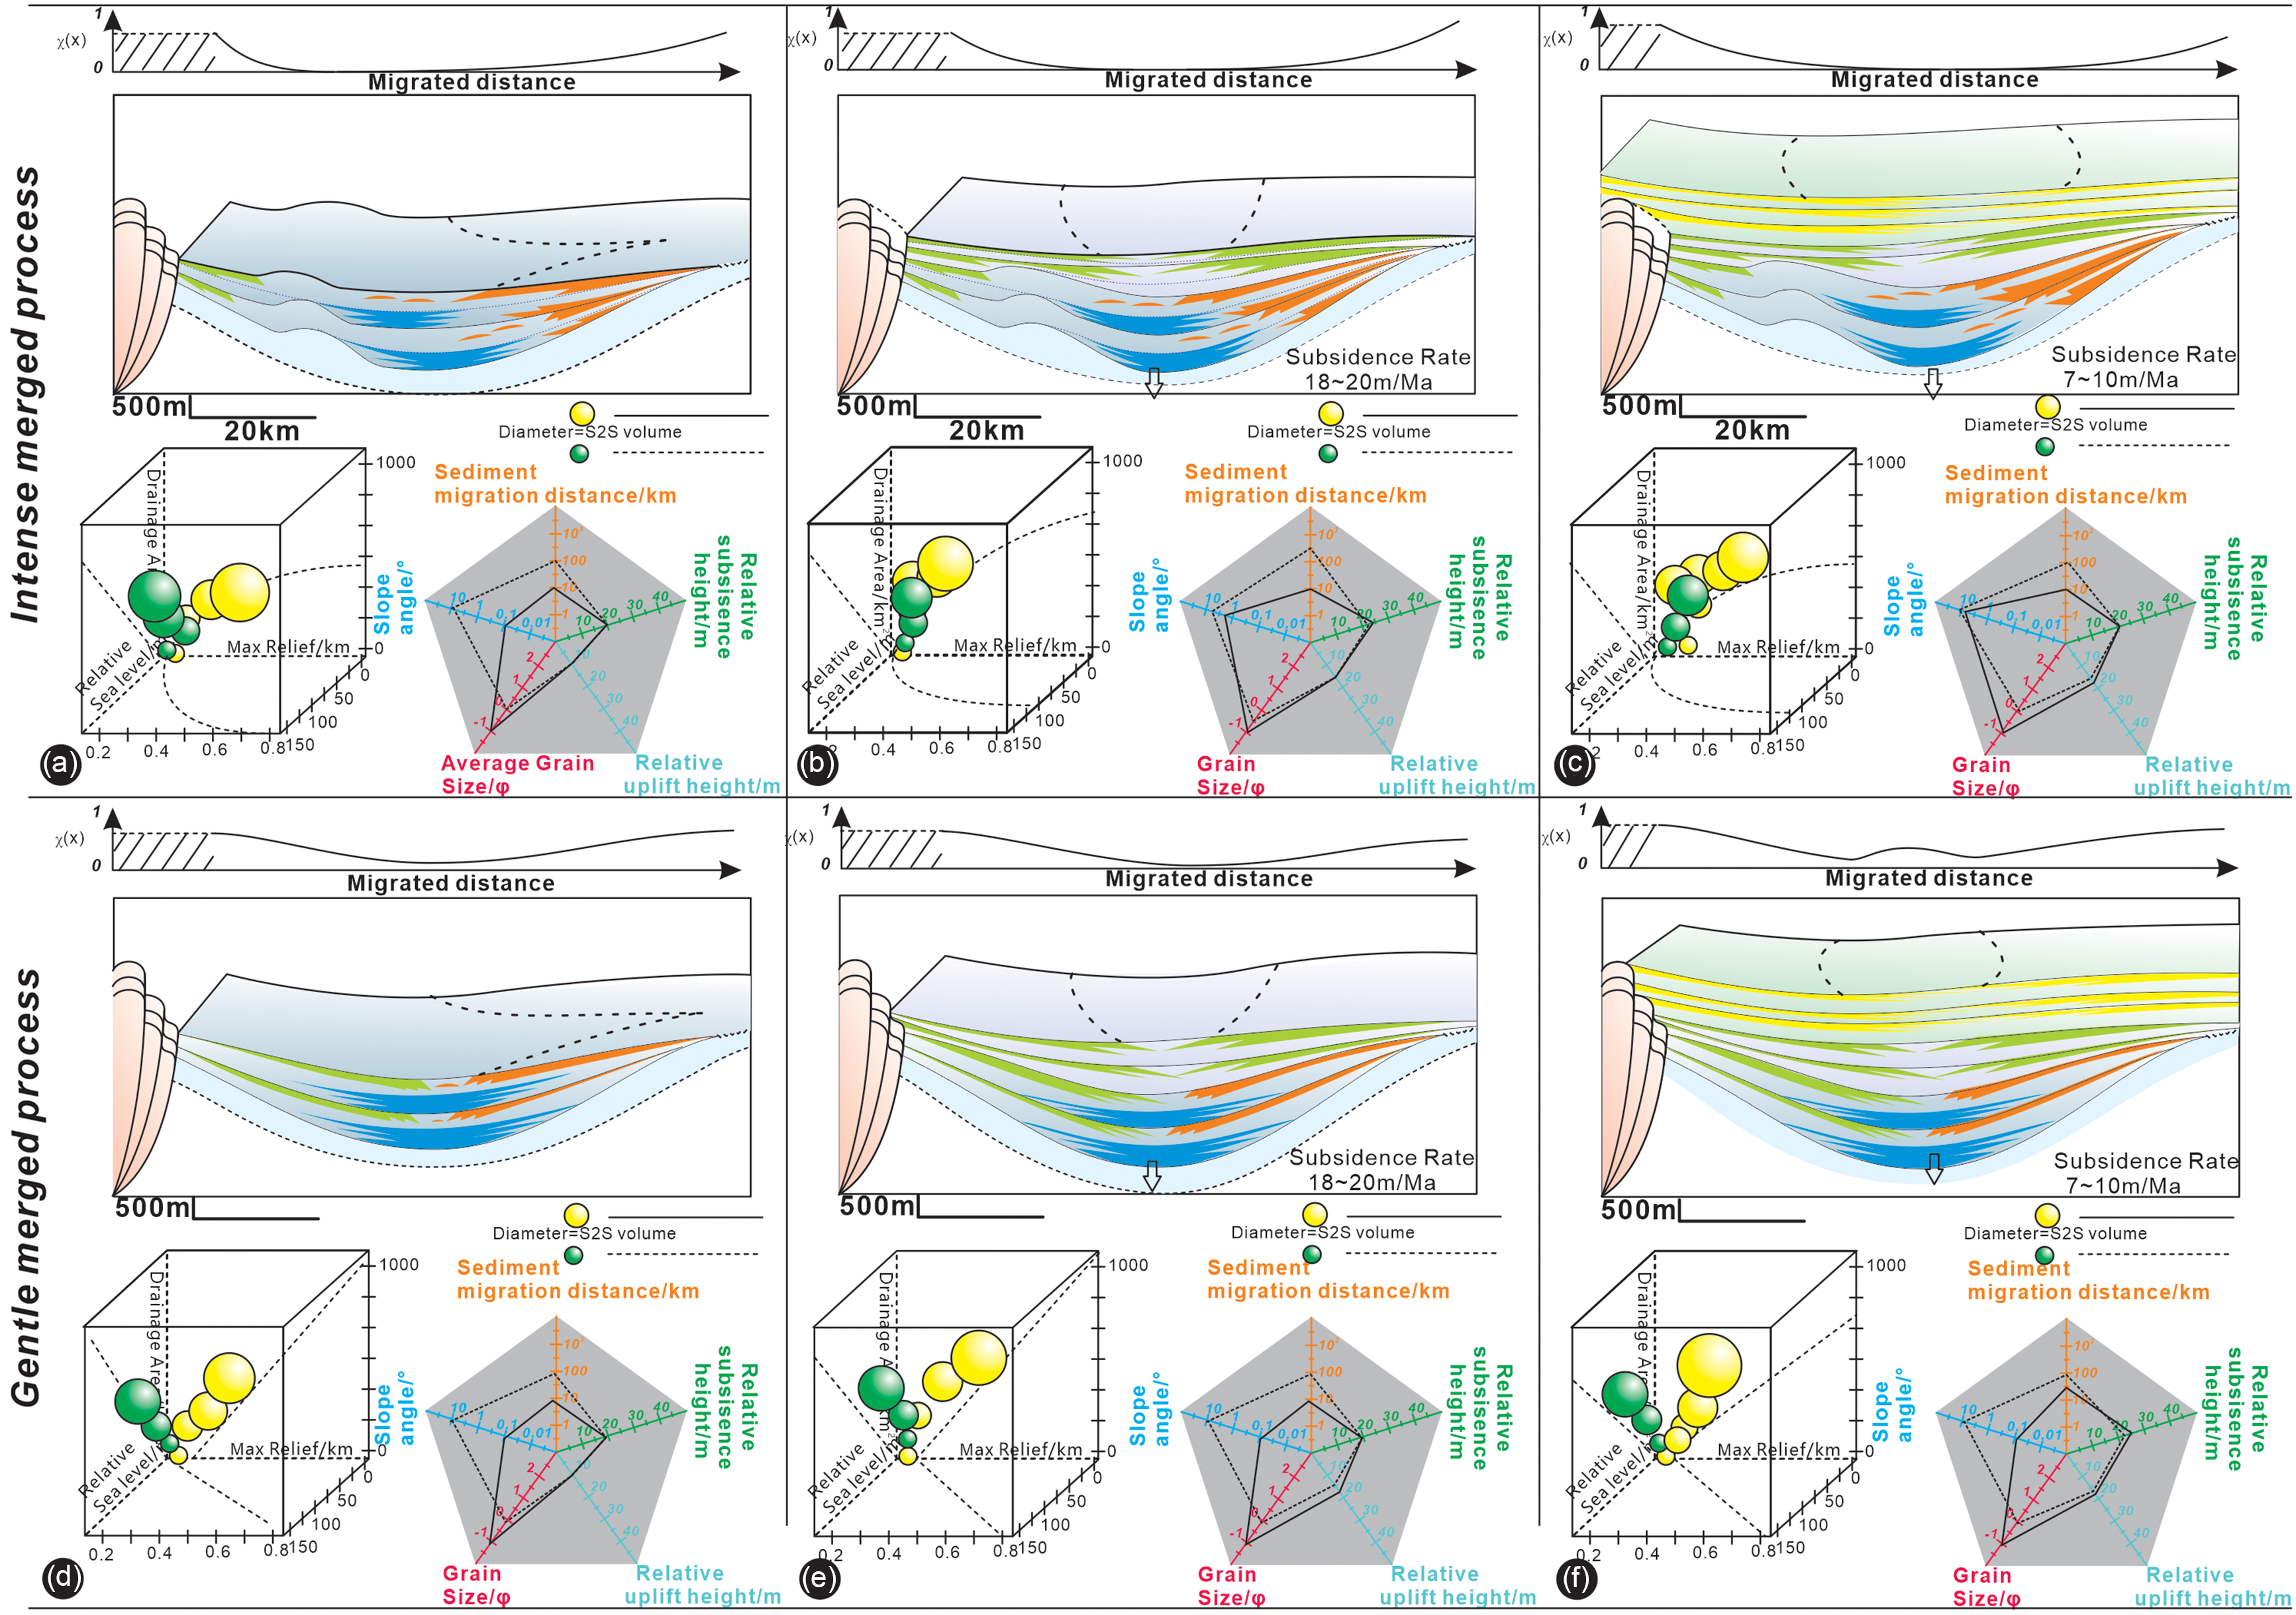
For the closed setting, we calculated the corresponding mass balance coordinate (χ(x)) by inputting the S2S parameters (Table 4) into equation (2). The curve between the χ(x) value and the migration distance shows a downward concave trend, decreasing sharply from 0.7 to 0.2. This result indicates the clear boundary between the coarse-grained deposits and fine-grained deposits in the semiclosed setting. Additionally, by plotting the parameters of each S2S system from the multiprovenance areas onto the cobweb plot, we obtained the impact factors for the S2S system in various settings. Moreover, by plotting the total S2S system volume (Q), relative sea level (S), maximum relief from the paleomorphology (H) and drainage area (A) in the bubble chart in Figure 18 with Graph© and MATLAB© software, we determined the dominant system according to the fitting equation of the above parameters and the S2S system volume (Q): Q=a·S+b·eA+c·ln(H) (a=0.31, b=0.55, c=1.2, R2=0.75). From the equation shown, we infer that the drainage area is the dominant factor.
Factors controlling the S2S system in the SE Ordos Basin. The upper list shows the multiple sediment source infilling and interaction processes in the eastern block, which are characterized by the intensity of the merging process and the semiclosed infilling setting. (a) to (c) The response of the infilling process. The lower list shows the response in the western block. These results ((d) to (e)) show a gentle infilling process and open setting. The relationship between the mass balance coordinate (χ(x)) and the migration distance shows a coarse-grained distribution in the infilling pattern. The regular hexagonal cobweb diagram presents the S2S parameters of the S2S system from the northern and southern margins. The drainage area, relative sea level and maximum relief are plotted in the bubble plot, and their relationship with the S2S system volume is reconstructed. Considering the weights in the fitting formula, their factors controlling the S2S system that developed during the early Permian to the middle Permian are inferred.

As shown in Figure 18(a), during the low sea level systems tracts, a mass of sediments migrated into the sink area and the slope declination determined the sediment dispersal process (Zhu et al. Reference Zhu, Zeng, Li, Dong, Zhu, Zhao and Huang2017). We infer that the S2S systems were initially dominated by the slope angle during this period. With sea level rise, the distal migration distance led to the preservation of more fine-grained sediments in the sink area (Figure 18(b) and (c)). More importantly, the drainage area directly determined the accommodation space. The large drainage area could provide sufficient space for sediment preservation. Especially for the Ordos Basin during the early Permian period, Chen et al. (2022) noted that this period is a typical transition from an icehouse to a greenhouse and brings in a large amount of sediments. This highlights the impact factors of the drainage area and their effect on the S2S system volume.
5.4.2 Gentle interaction in the multiple provenance areas
We also calculate the responding mass balance coordinate (χ(x)) in the open setting within the basin with low-accommodation space (Figure 18). Additionally, the χ(x) value of the curve and the migration distance are characterized by a concave upward shape. This curve shows a gentle declining trend along the migration distance, from 0.7 to 0.4. By combining the cobweb plot and the bubble chart in Figure 18, we obtain the following fitting curve: Q=a·S+b·A+c·H (a=1.03, b=0.15, c=0.62, R2=0.68). From the equation, all the above factors present a linear relationship with the S2S volume. We infer that, as sufficient accommodation space is provided, both of the above factors could influence the multiple sediment source infilling processes in the open setting.
5.5 Implication for petroleum exploration
Ideal reservoir exploration in basins with low-accommodation space, such as intracratonic basins, should involve reconstructing the paleomorphology and classifying the various infilling drainage basins in detail, such as for semiclosed or open settings.
Within a semiclosed setting, as the accommodation space in the depocenter area may be occupied by massive fine-grained deposits, the coarse-grained sandstone accumulates near the coastline around the low uplift area and is deposited on a relatively high-angle slope. The area with coarse-grained deposition may be a favorable exploration area. In contrast, the coastline in the open setting area is mostly reworked by tidal or wave currents. In the depocenter area, massive sediments are deposited in multiprovenance systems. Thus, we should focus on the depocenter area in an open setting within a basin with low-accommodation space.
6. Conclusion
In this study, we compare two blocks in the SE Ordos Basin. The western block has the characteristics of an open setting, while the eastern block is surrounded by local uplift and is characterized as a semiclosed setting. We reconstruct the various infilling process insights from the source-to-sink system and reconstruct their relationship with the paleosetting.
-
(1) With U–Pb and HMA data, we identified the provenance area of the SE Ordos Basin. During the Asselian and Sakmarian stages in the early Permian, the eastern and western parts of the SE Ordos Basin were mainly provided with sediments from the northern margin of the cratonic basin, while in the Artinskian stage in the early Permian, the source areas of the SE Ordos Basin were dispersed.
-
(2) With the interpreted seismic profile, we identified prograding deltas in various paleoenvironmental settings, namely, semiclosed and open settings. The semiclosed setting witnessed an intense merging process, while a gentle merging process was observed in the open setting. Furthermore, by combining the trace element ratios and quartz–felspar–lithic contents in the sandstone, we conclude that in the semiclosed setting, the sediments experienced limited reworking and fine-grained and coarse-grained sediments are interbedded. In the open setting, due to tidal or wave reworking processes in the offshore area, fine-grained sediments were transported into the deep-water area, and grains from multiple source areas were mixed.
-
(3) By integrating the interpreted seismic data and core samples, we reconstructed the S2S system in both the semiclosed and open settings. Mudstone occupies the accommodation space in the depocenter, and coarse-grained sediments are mostly found around the coastline.
-
(4) Insight from the statistical data and its responding geological setting transition, we compared the controlling factors, including the relative subsidence/uplift height, S2S volume and sediment migration distance, to the routing system developed in a low-accommodation space basin. We infer that in the semi-closed setting, as the low exchange rate between the drainage area and the extra-drainage area, the drainage area could provide an accommodation space and determined the routing system developed. Then, to the open setting, as the high exchange rate, not sufficient sediments supply may make the drainage as a starved area. Thus, we infer that both the factors, including the relative sea level, maximum relief from the paleomorphology, and drainage area could influence the S2S developed.
Supplementary material
The supplementary material for this article can be found at https://doi.org/10.1017/S0016756823000572
Acknowledgements
The authors would also like to acknowledge the research team at China University of Geosciences, Beijing, and CNOOC Research Institute. The authors also want to thank the journal reviewer Prof Xin and Prof. Susie and handling editor for their thoughtful and useful comments to improve this manuscript’s quality.
Financial support
This research was sponsored by the China Postdoctoral Science Foundation (No. 2022M723532) and China Postdoctoral Science Fund(Special funding) (No. 2023T160728).
Competing interests
All authors disclosed no relevant relationships.


 Open access