

Introduction
Hydrocalumite is a layered double hydroxide (LDH) mineral that forms hydrothermally, typically at the contact of sedimentary and igneous rocks. Natural LDHs constitute the hydrotalcite supergroup, in which Ca-Al members are included into the hydrocalumite group (Mills et al., Reference Mills, Christy, Génin, Kameda and Colombo2012). At present, the mineral has the International Mineralogical Association approved chemical formula of Ca4Al2(OH)12(Cl,CO3,OH)2·4H2O, which, according to the hydrotalcite-supergroup nomenclature (Mills et al., Reference Mills, Christy, Génin, Kameda and Colombo2012), may correspond to multiple mineral species due to the discrepancies in the anion content. The formal end-member formulae of minerals which hypothetically could be named ‘hydrocalumites’ have been listed as Ca4Al2(OH)12Cl2·4H2O, Ca4Al2(OH)12(OH)2·6H2O and Ca4Al2(OH)12(CO3)·6H2O (Sacerdoti and Passaglia, Reference Sacerdoti and Passaglia1988; Passaglia and Sacerdoti, Reference Passaglia and Sacerdoti1988; Mills et al., Reference Mills, Christy, Génin, Kameda and Colombo2012).
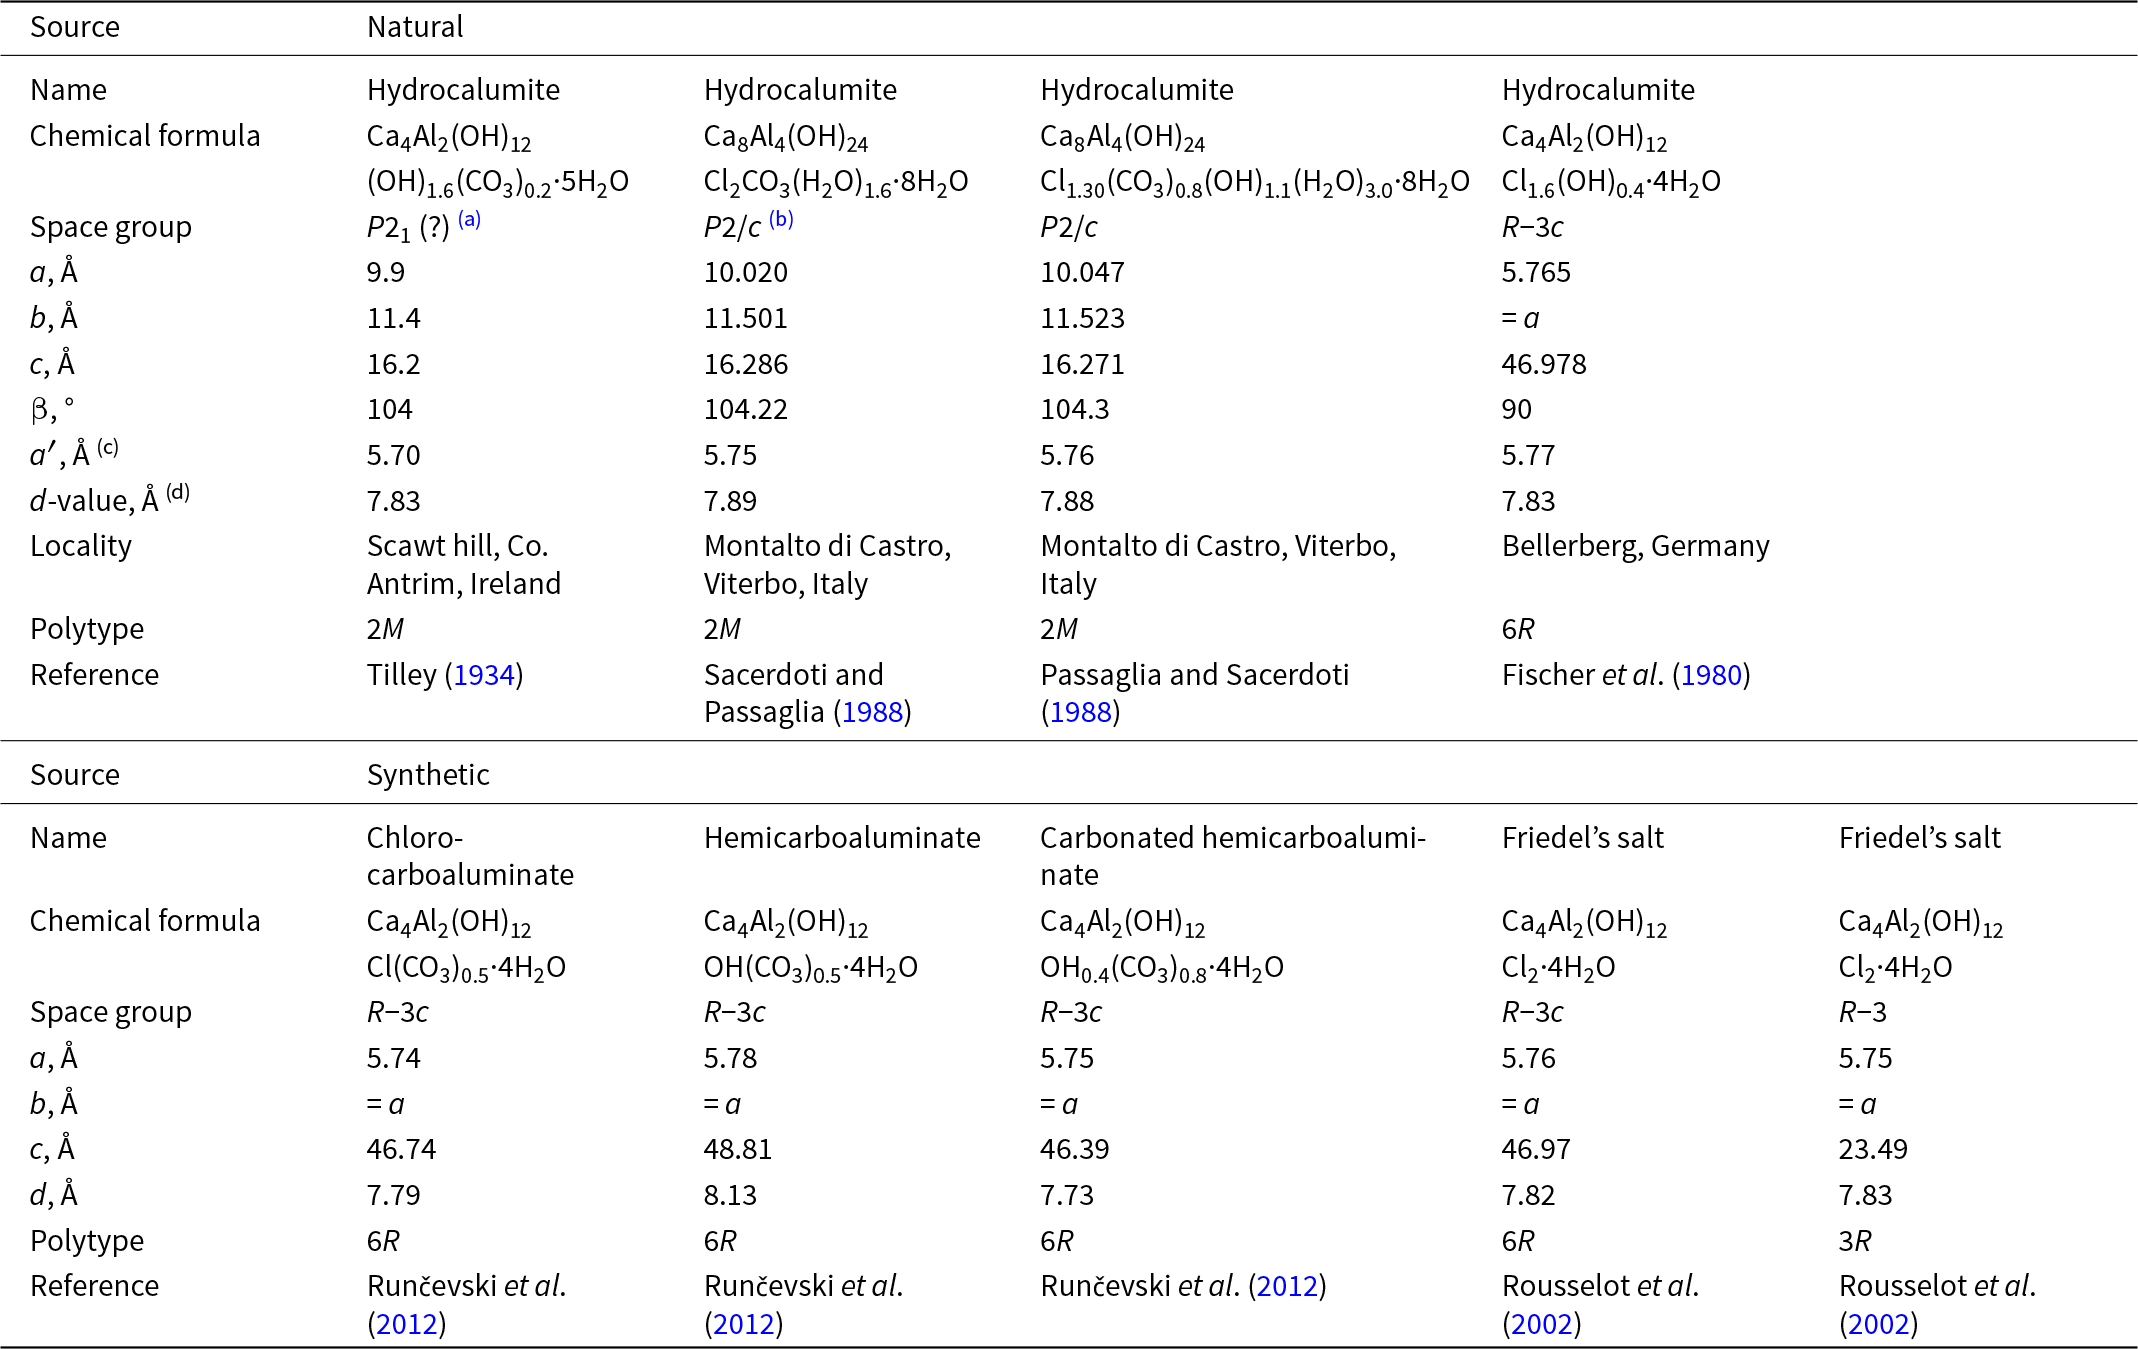
The crystal structures of LDHs consist of alternating positively charged cation layers, [Ca4Al2(OH)12]2+ in the case of hydrocalumite, and negatively charged interlayer content that may incorporate H2O molecules (Taylor, Reference Taylor1973). The structural features of the hydrocalumite-group minerals include (Sacerdoti and Passaglia, Reference Sacerdoti and Passaglia1988): (1) pronounced Ca-Al ordering in the octahedral layers, resulting in the formation of ordered superstructures; (2) the seven-fold coordination of calcium by six hydroxyl groups (as in other LDHs) and one H2O molecule pointing towards the interlayer. The examination of the unit-cell parameters (Table 1) reported for hydrocalumite and synthetic chemically related compounds shows that they have tendency to form polytypes, among which monoclinic (2M) and rhombohedral (6R) polytypes are predominant. The tendency of hydrocalumite and related compounds to cation ordering within the metal-hydroxide layers is similar to the quintinite-group members that also have a M 2+:M 3+ ratio of 2:1. For comparison, quintinite is known in five polytypes produced by combination of order/disorder of octahedrally coordinated cations and layer stacking sequences, among them monoclinic (with a different cell metric compared to hydrocalumite) and rhombohedral six-layer polytypes (Krivovichev et al., Reference Krivovichev, Yakovenchuk, Zhitova, Zolotarev, Pakhomovsky and Ivanyuk2010a, Reference Krivovichev, Yakovenchuk, Zhitova, Zolotarev, Pakhomovsky and Ivanyuk2010b; Zhitova et al., Reference Zhitova, Krivovichev, Yakovenchuk, Ivanyuk, Pakhomovsky and Mikhailova2018).
Unit-cell metrics reported for hydrocalumite and closely related synthetic materials
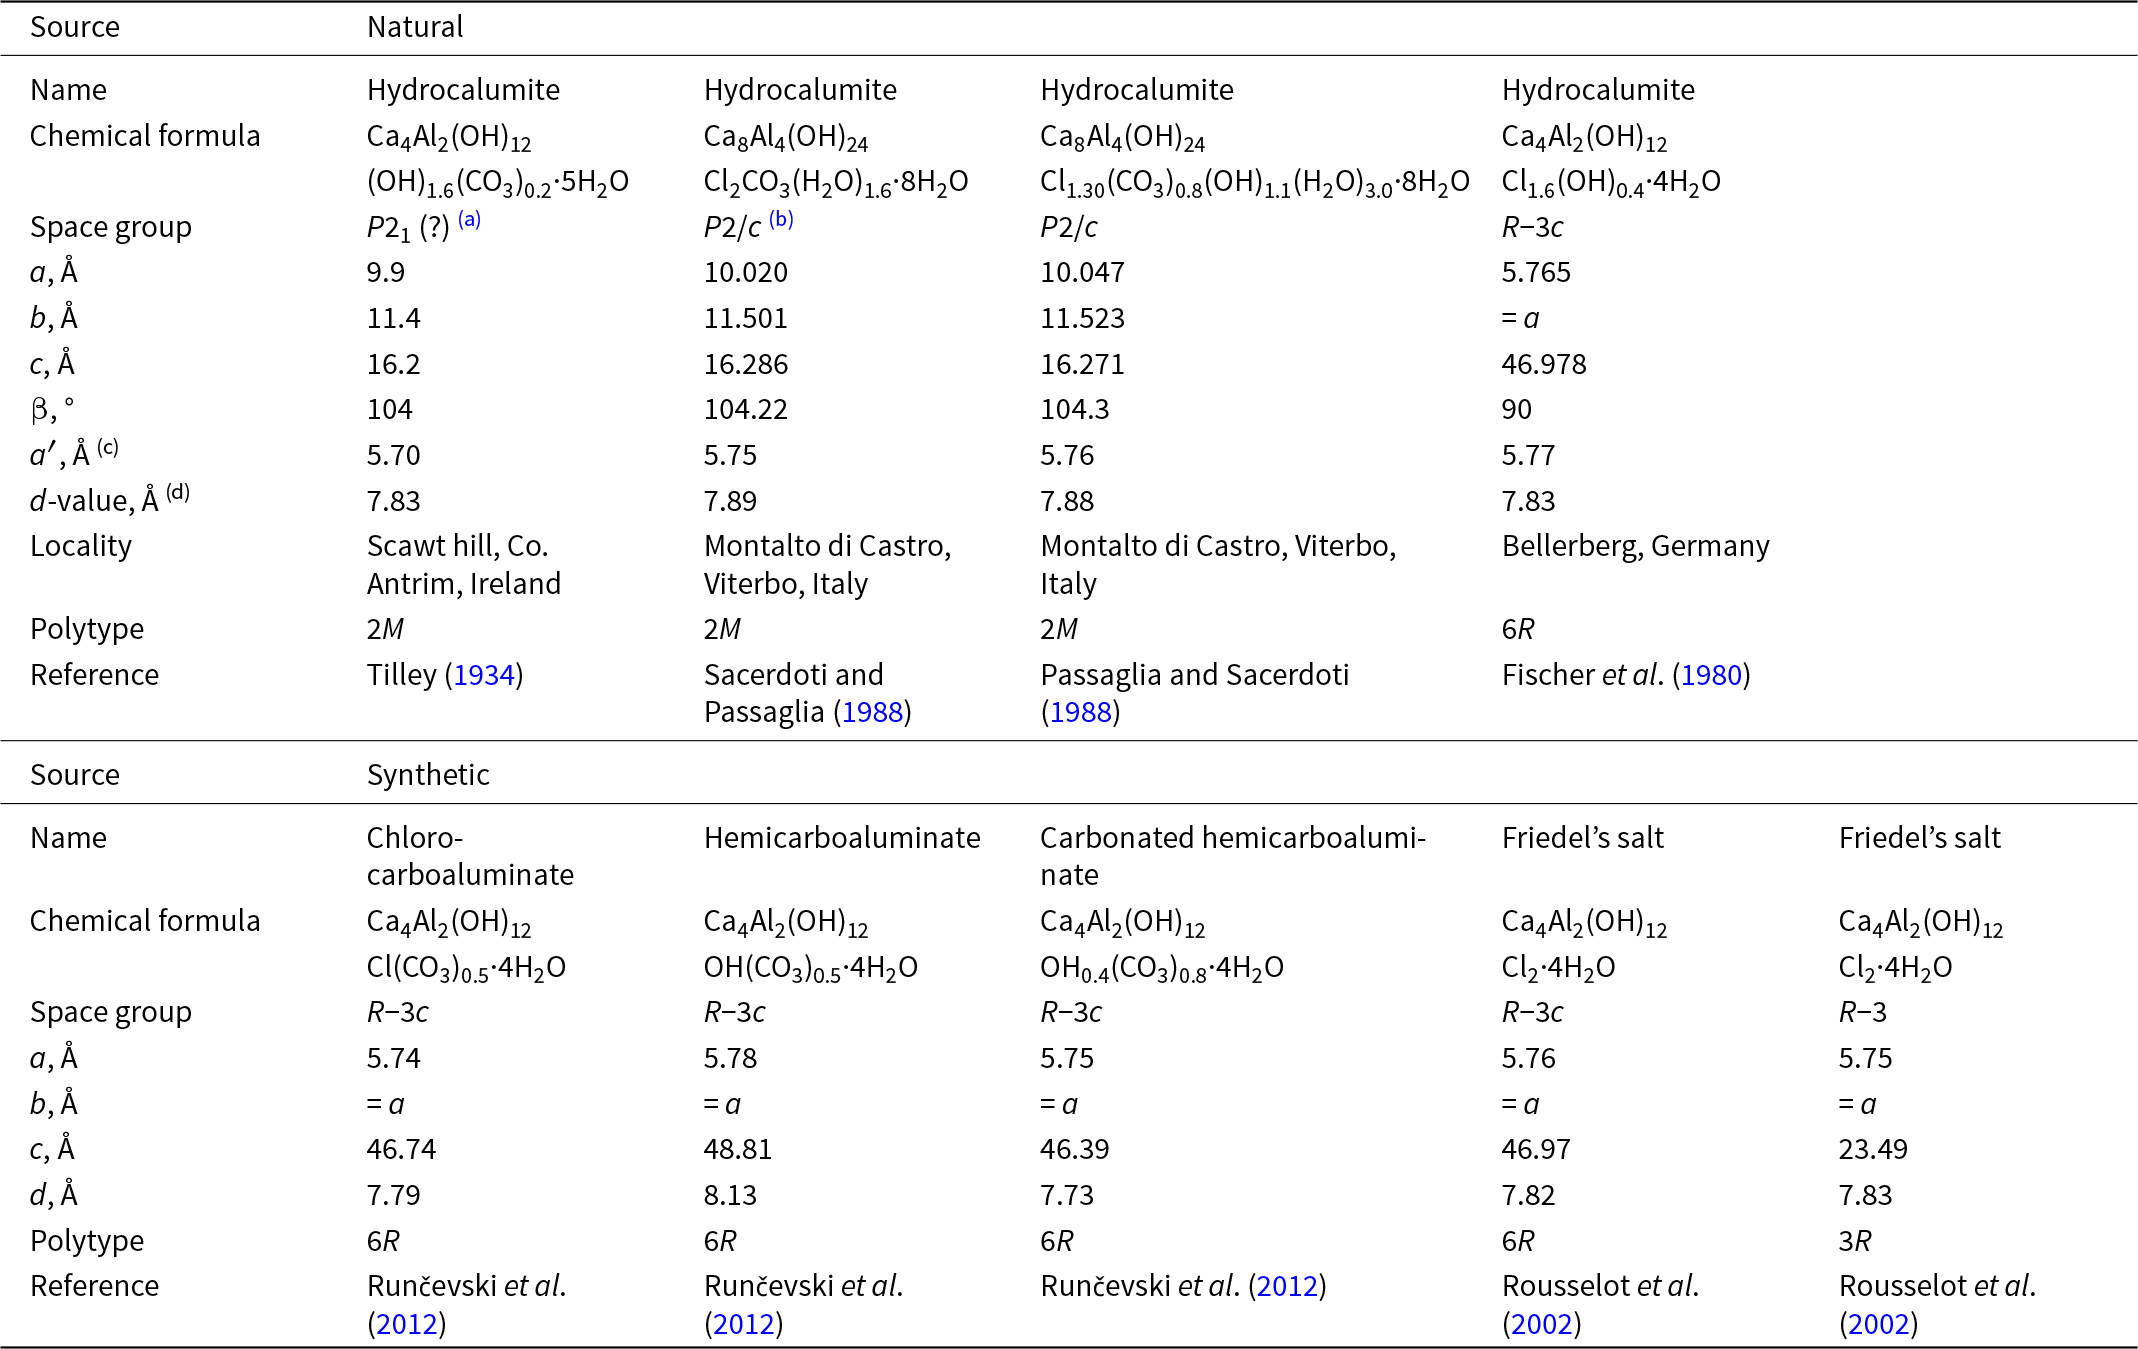
Table 1 Long description
The table compares six hydrocalumite-group minerals by composition, crystallographic symmetry, unit-cell parameters, interlayer spacing, and literature source. Carbocalumite, Mampsisite, Rotemite, Kuzelite, and Mariakrite have the same calcium–aluminum hydroxide layer composition, while Amoraite has a larger layer composition and additional interlayer components. Symmetry varies: Carbocalumite, Rotemite, and Kuzelite are trigonal, whereas Mampsisite, Amoraite, and Mariakrite are triclinic. Space groups are R minus 3 c for Carbocalumite and Rotemite, P minus 1 for Mampsisite, Amoraite, and Mariakrite, and the space group for Kuzelite is not reported. Unit-cell a is about 5.7 to 5.8 angstroms for all except Amoraite, which is much larger at about 15.3 angstroms; similarly, b is about 9.9 to 10.0 angstroms for the triclinic small-cell minerals but about 16.1 angstroms for Amoraite. The c dimension ranges from about 10.9 angstroms in Mariakrite to about 53.7 angstroms in Kuzelite, indicating large differences in stacking repeat along c. Interlayer spacing d ranges from about 7.6 to 9.0 angstroms for most minerals, but Mariakrite is higher at about 10.8 angstroms. Comparisons should be read with caution because the minerals differ in interlayer species and hydration, and one entry has an unknown space group.
Notes: (a) Transformed by Fischer et al. (Reference Fischer, Kuzel and Schellhorn1980) from P21, a = 9.60 Å, b = 11.40 Å, c = 16.84 Å; β = 69° or alternative variant given as C2/c, a = 9.6 Å, b = 5.7 Å, csinβ = 7.86 Å (Tilley, Reference Tilley1934). (b) The subcell is a = 10.020 Å, b = 5.751 Å, c = 16.286 Å and β = 104.22° (Sacerdoti and Passaglia, Reference Sacerdoti and Passaglia1988). (c) aʹ is the distance between two neighbouring M cations. (d) The d-value is the distance between two neighbouring octahedral sheets.
Hydrocalumite was first described from Scawt Hill (Antrim County, Northern Ireland, UK), the famous mineral locality where a volcanic plug of diabase composition intruded limestones and dolostones (Tilley, Reference Tilley1934). The approximate, simplified formula of the type material recalculated from the original chemical analyses (Tilley, Reference Tilley1934) is Ca4Al2(OH)12(OH)1.56(CO3)0.22·4.76H2O, i.e. hypothetically refers to ‘hydroxy-hydrocalumite’ (Mills et al., Reference Mills, Christy, Génin, Kameda and Colombo2012). Unfortunately, the type material from Scawt Hill has not been preserved in museum collections. The second detailed description of hydrocalumite used material from Boisséjour, Puy-de-Dôme; Auvergne-Rhône-Alpes, France, where the mineral occurs at the contact of marls and lava flows of the trachybasaltic composition of Puy de Gravenoire volcano (Grünhagen and Mergoil-Daniel, Reference Grünhagen and Mergoil-Daniel1963). The newly obtained material from Boisséjour has been studied in this work (see below). Other crystal-chemically characterized species of hydrocalumite include samples from Montalto di Castro, Viterbo, Italy (Passaglia and Sacerdoti, Reference Passaglia and Sacerdoti1988; Sacerdoti and Passaglia, Reference Sacerdoti and Passaglia1988), and Bellerberg, Eifel, Germany (Fischer et al., Reference Fischer, Kuzel and Schellhorn1980) (Table 1). The type material from Scawt Hill was studied by X-ray diffraction only in the early 1930s and the mineral was described as monoclinic (Tilley, Reference Tilley1934); the structure determination had not been carried out at the time (Table 1).
A crystal-chemical reinvestigation of hydrocalumite is of interest for the following reasons: (1) it is still unclear which ideal formula should be assigned to this mineral; (2) crystal structures of natural specimens were analysed more than 35 years ago; (3) in recent years, a number of new representatives of the hydrocalumite group have been described [rotemite, Ca4Cr2(OH)12Cl2·4H2O (Skrzyńska et al., Reference Skrzyńska, Müller, Juroszek, Krüger, Cametti, Pakhomova, Galuskina, Vapnik, Wo´zniak and Galuskin2025); carbocalumite, Ca4Al2(OH)12(CO3)·6H2O (Britvin et al., Reference Britvin, Murashko, Vapnik, Krzhizhanovskaya, Vlasenko and Vereshchagin2022); mampsisite, Ca4Al2(OH)12(CO3)·5H2O (Britvin et al., Reference Britvin, Murashko, Vlasenko, Vereshchagin, Bocharov and Vapnik2025); mariakrite, Ca4Al2(OH)12(H2O)4[Fe2S4] (Murashko et al., Reference Murashko, Vapnik, Vlasenko, Vereshchagin, Shelukhina, Pekov and Britvin2025); amoraite, Ca12Al6(OH)36(CO3)2(SO3)·15H2O) (Britvin et al., Reference Britvin, Murashko, Bocharov, Vlasenko, Vereshchagin and Vapnik2024)] that expand this group significantly; (4) the synthetic analogue and ‘relatives’ of this mineral are of importance for materials science applications.
The synthetic analogue of hydrocalumite (Buttler et al., Reference Buttler, Dent Glasser and Taylor1959; Linares et al., Reference Linares, Moscosso, Alzurutt, Ocanto, Bretto and González2016; Gevers and Labuschagné, Reference Gevers and Labuschagné2020; Jiménez et al., Reference Jiménez, Rives and Vicente2022; Rossi et al., Reference Rossi, Campos and Souza2020) is known as hydrated calcium aluminate and also as one of the aluminate ferrite monosubstituted (AFm) phases, which are important hydration products in the Portland and hydraulic cements. The synthetic analogue of hydrocalumite is used in concrete production as an additive in cement (Pöllmann, Reference Pöllmann2012; Lavagna and Nisticò, Reference Lavagna and Nisticò2022). The pure chloride end-member of hydrocalumite is known as Friedel’s salt (Birnin-Yauri and Glasser, Reference Birnin-Yauri and Glasser1998). The synthetic hydrocalumite-like materials also have good heavy metal and anion sorption properties, with an affinity towards arsenate, phosphate, selenite and tungstate (Glasser, Reference Glasser2001; Zhang and Reardon, Reference Zhang and Reardon2005; Chrysochoou and Dermatas, Reference Chrysochoou and Dermatas2006; Segni et al., Reference Segni, Vieille, Leroux and Taviot-Guého2006; Grover et al., Reference Grover, Komarneni and Katsuki2010; Fan et al., Reference Fan, Wang, Feng, Zhou, Zhang, Ding and Liu2025). Another application of these materials is in the catalysis of organic reactions (Jiménez et al., Reference Jiménez, Rodrigues, Trujillano, Madeira and Vicente2025a, Reference Jiménez, Trujillano, Gil, Rives and Vicente2025b; Karádi et al., Reference Karádi, Szerlauth, Kukovecz, Kónya and Varga2025; Perez-Merchan et al., Reference Perez-Merchan, Moreno-Tost, Malpartida, García-Sancho, Cecilia, Merida-Robles and Maireles-Torres2025). Therefore, we hope that the new data on hydrocalumite reported in the present paper might be of interest to mineralogists, crystal chemists, geochemists and materials scientists.
Materials
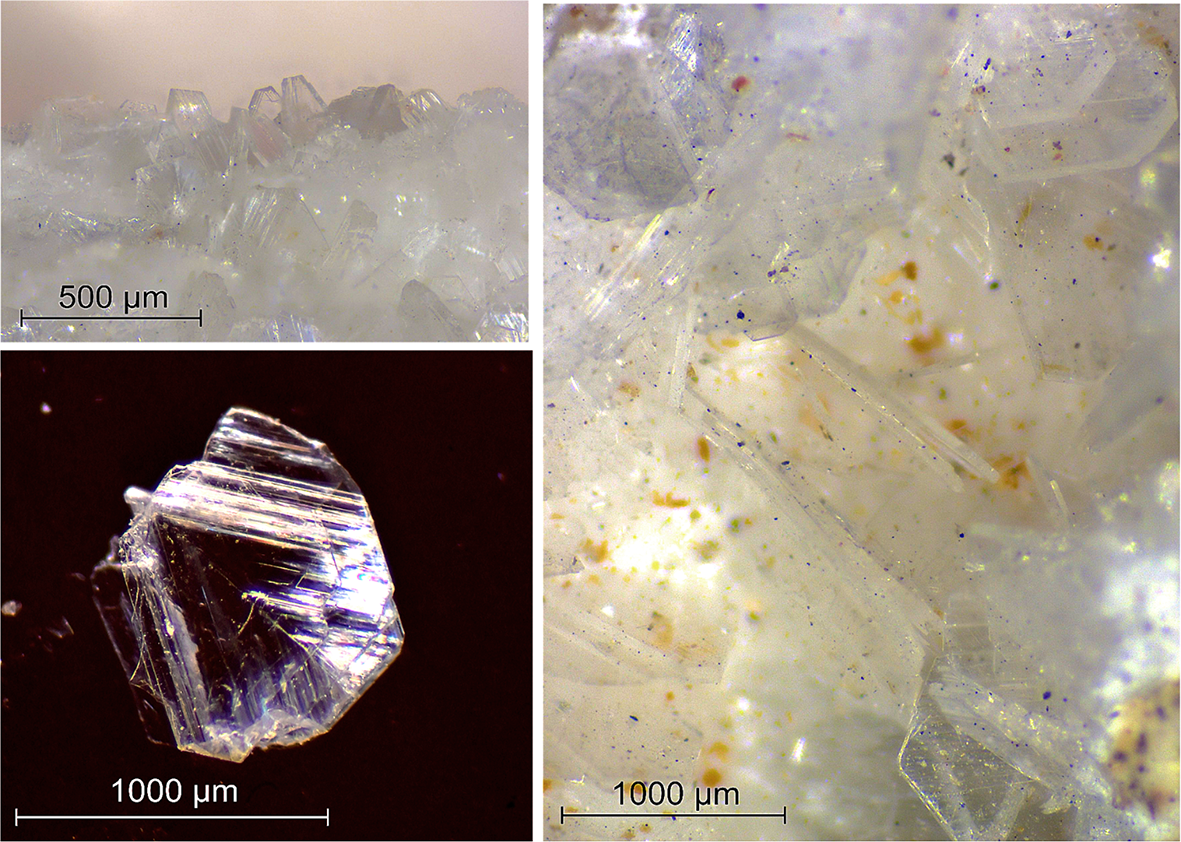
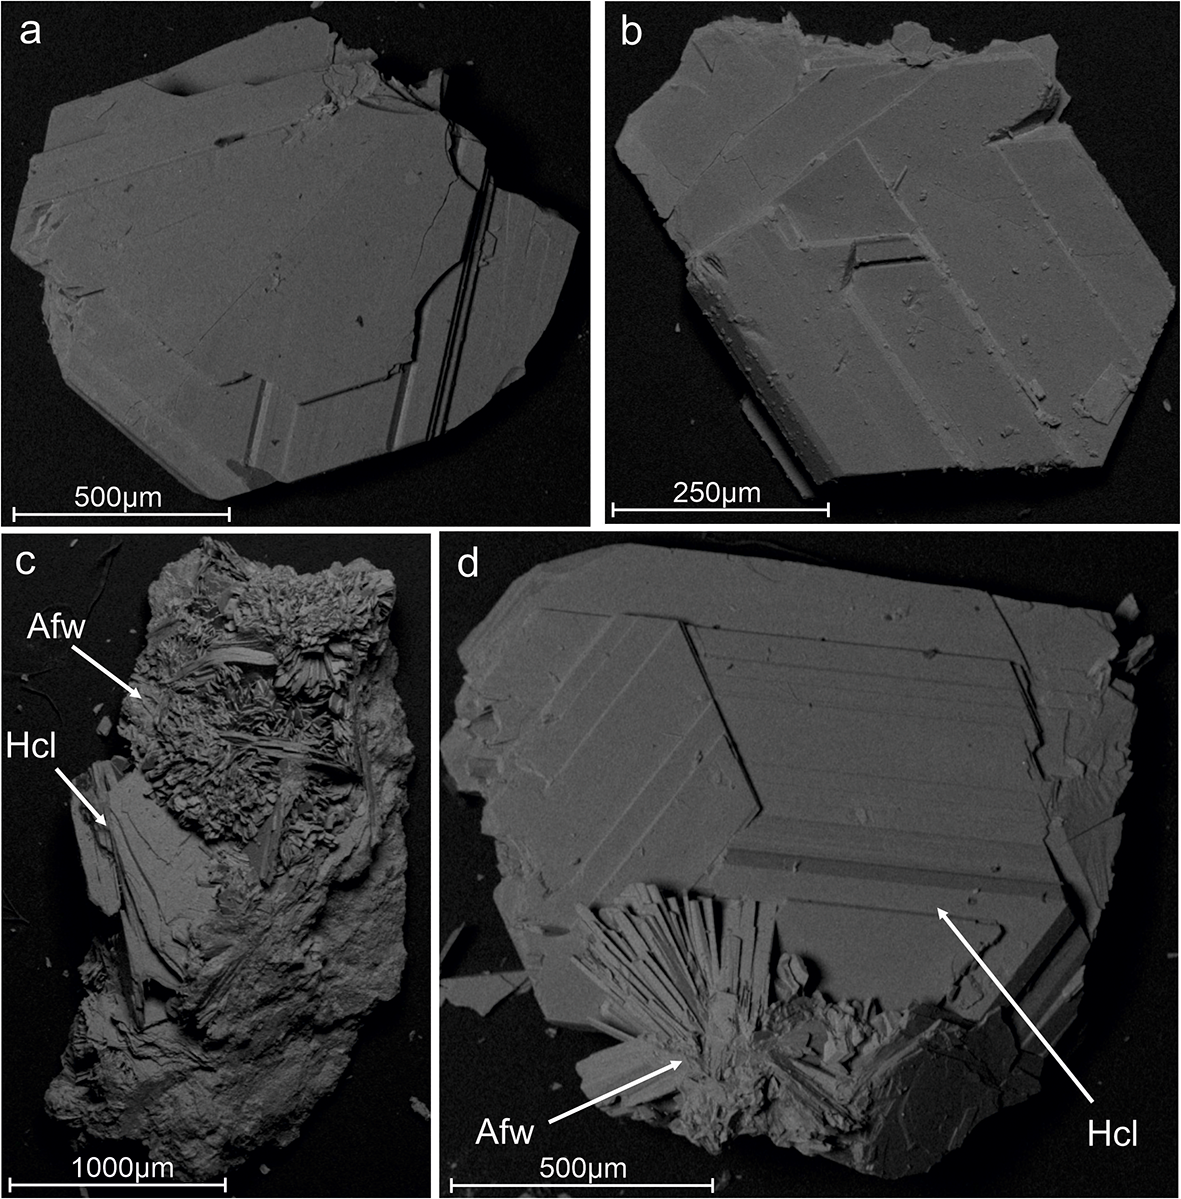
The hydrocalumite sample studied in this work originates from Boisséjour, Beaumont, Clermont-Ferrand, Puy-de-Dôme, France, and is stored in the collection of the Natural History Museum in Paris under catalogue number MNHN_MIN_171.23. Hydrocalumite from this locality was studied by Grünhagen and Mergoil-Daniel (Reference Grünhagen and Mergoil-Daniel1963). The mineral forms colourless transparent pseudo-hexagonal crystals, tabular on {001} and with perfect, mica-like (001) cleavage (Fig. 1). The mineral is found in association with afwillite, Ca3Si2O4(OH)6 (Fig. 2).
Hydrocalumite crystals in the sample studied. The lower left image shows the mica-like cleavage and pseudo-hexagonal crystal that has been used for electron-microprobe analysis.

Figure 1 Long description
The image A showing a pale background with multiple translucent, irregular fragments clustered across the frame. A scale bar at the lower left reads 500 micrometers. The image B showing a dark background with a single translucent, angular fragment near the center. Bright linear reflections run across the fragment. A scale bar at the lower left reads 1000 micrometers. The image C showing a pale background with several translucent fragments overlapping. Small yellow-brown specks are scattered across the fragments and background. A scale bar at the lower left reads 100 micrometers.
Back-scattered electron images of the hydrocalumite crystals studied. Hcl – hydrocalumite, Afw – afwillite (Warr, Reference Warr2021).
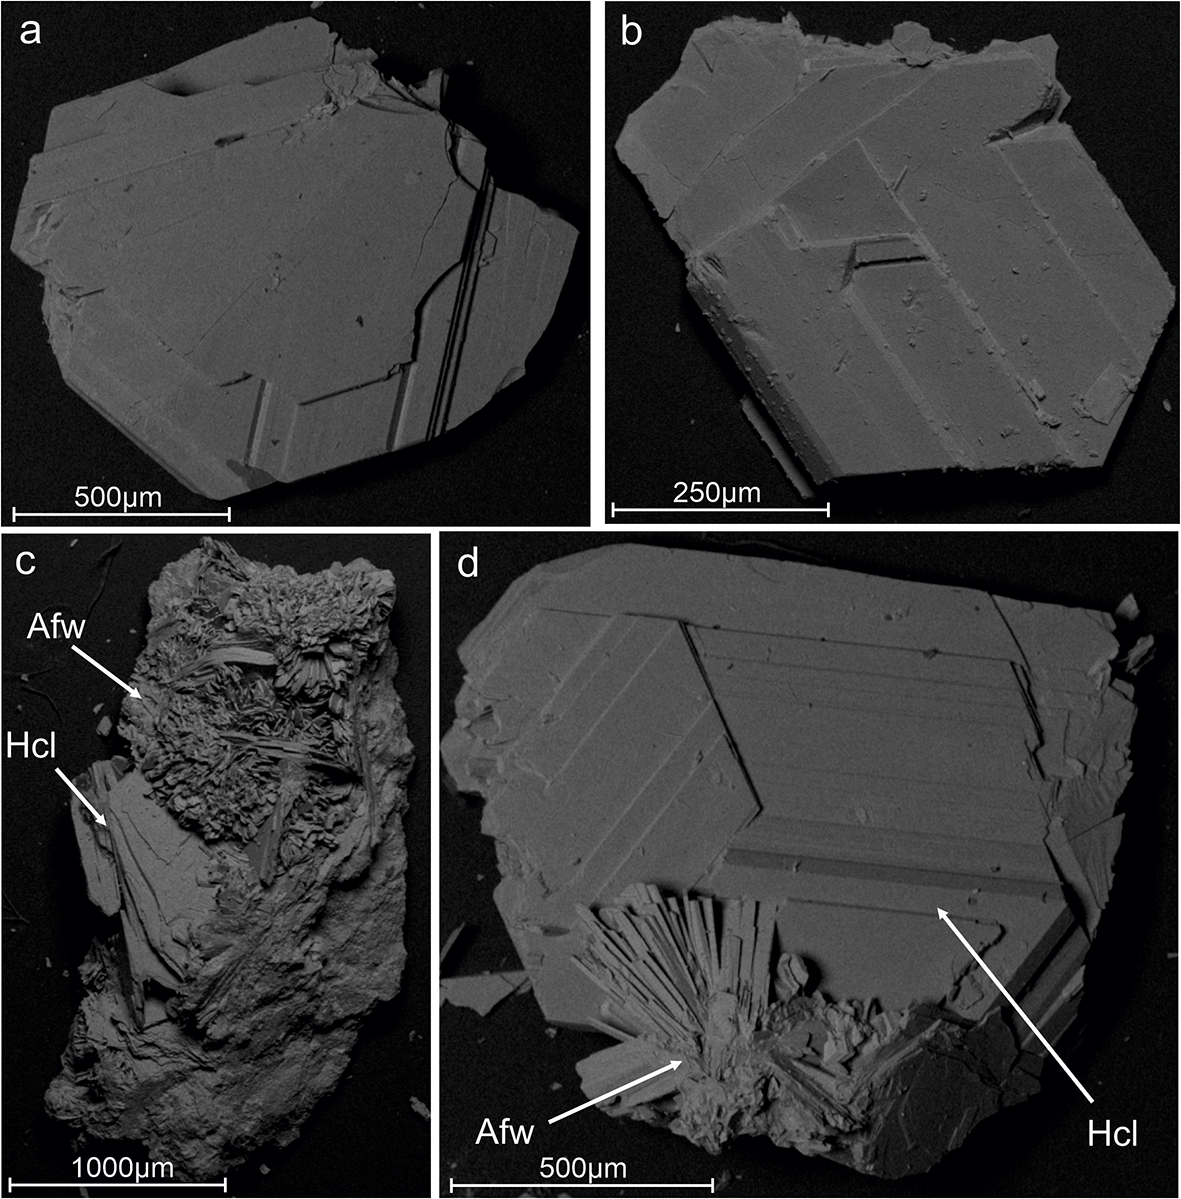
Figure 2 Long description
The image A showing a grayscale micrograph of a flat, plate-like fragment on a dark background. The fragment has straight edges, step-like terraces and multiple cracks. A scale bar at the lower left reads 500 micrometers. The image B showing a grayscale micrograph of a similar plate-like fragment on a dark background. The surface has broad flat faces with straight boundaries and several intersecting fracture lines. A scale bar at the lower left reads 250 micrometers. The image C showing a grayscale micrograph of an irregular, rough fragment on a dark background. Two arrows point to different regions labeled Afw and Hcl. A scale bar at the lower left reads 1000 micrometers. The image D showing a grayscale micrograph of a plate-like fragment with a rough, broken area along the lower edge on a dark background. An arrow points to a region labeled Hcl and the label Afw is placed near the lower left. A scale bar at the lower left reads 500 micrometers.
Methods
Electron-microprobe analysis
Four crystals of hydrocalumite were studied by scanning electron microscopy and electron-microprobe analyses, using polished and unpolished carbon-coated samples (Fig. 2). The elemental analyses were carried out using a Tescan Vega 3 LMH scanning electron microscope (Tescan, Czech Republic), equipped with an Oxford X-Max 80 mm2 energy-dispersive spectrometer (Oxford Instruments Ltd., UK), operating at an accelerating voltage of 20 kV and a current of 0.9 nA; the collecting time was 20 s for each of the spectra. The standards were Al (Al2O3), Ca (diopside), Cl (Cs2ReCl6). Contents of other elements with atomic numbers > 7 are below detection limits. The energy-dispersive spectra were processed automatically using the AzTec Energy software package. The advantage of the energy-dispersive (ED) spectrometer is the low voltage and relatively short analysis time with the possibility of beam defocusing, which has a positive effect on the stability of the highly hydrated mineral.
Single-crystal X-ray diffraction
The single-crystal X-ray diffraction (SC-XRD) data have been obtained on a four-circle diffractometer Rigaku XtaLAB Synergy-S (at 50 kV and 1.0 mA, MoKα radiation, room temperature, frame widths 0.5° in ω and exposure time 12 s), equipped with a micro-focus sealed X-ray source PhotonJet-S and a high-speed direct-action detector HyPix-6000HE. The data were processed in the CrysAlisPro software package (CrysAlis PRO, 2014); an empirical absorption correction was calculated based on spherical harmonics using the SCALES ABSPACK algorithm. The crystal structure was solved from scratch by the Intrinsic Phasing method using SHELXT (Sheldrick, Reference Sheldrick2014), and refined by the least-squares method using SHELXL (Sheldrick, Reference Sheldrick2015), both implemented in Olex2 software (Dolomanov et al., Reference Dolomanov, Blake, Champness and Schröder2003).
Powder X-ray diffraction
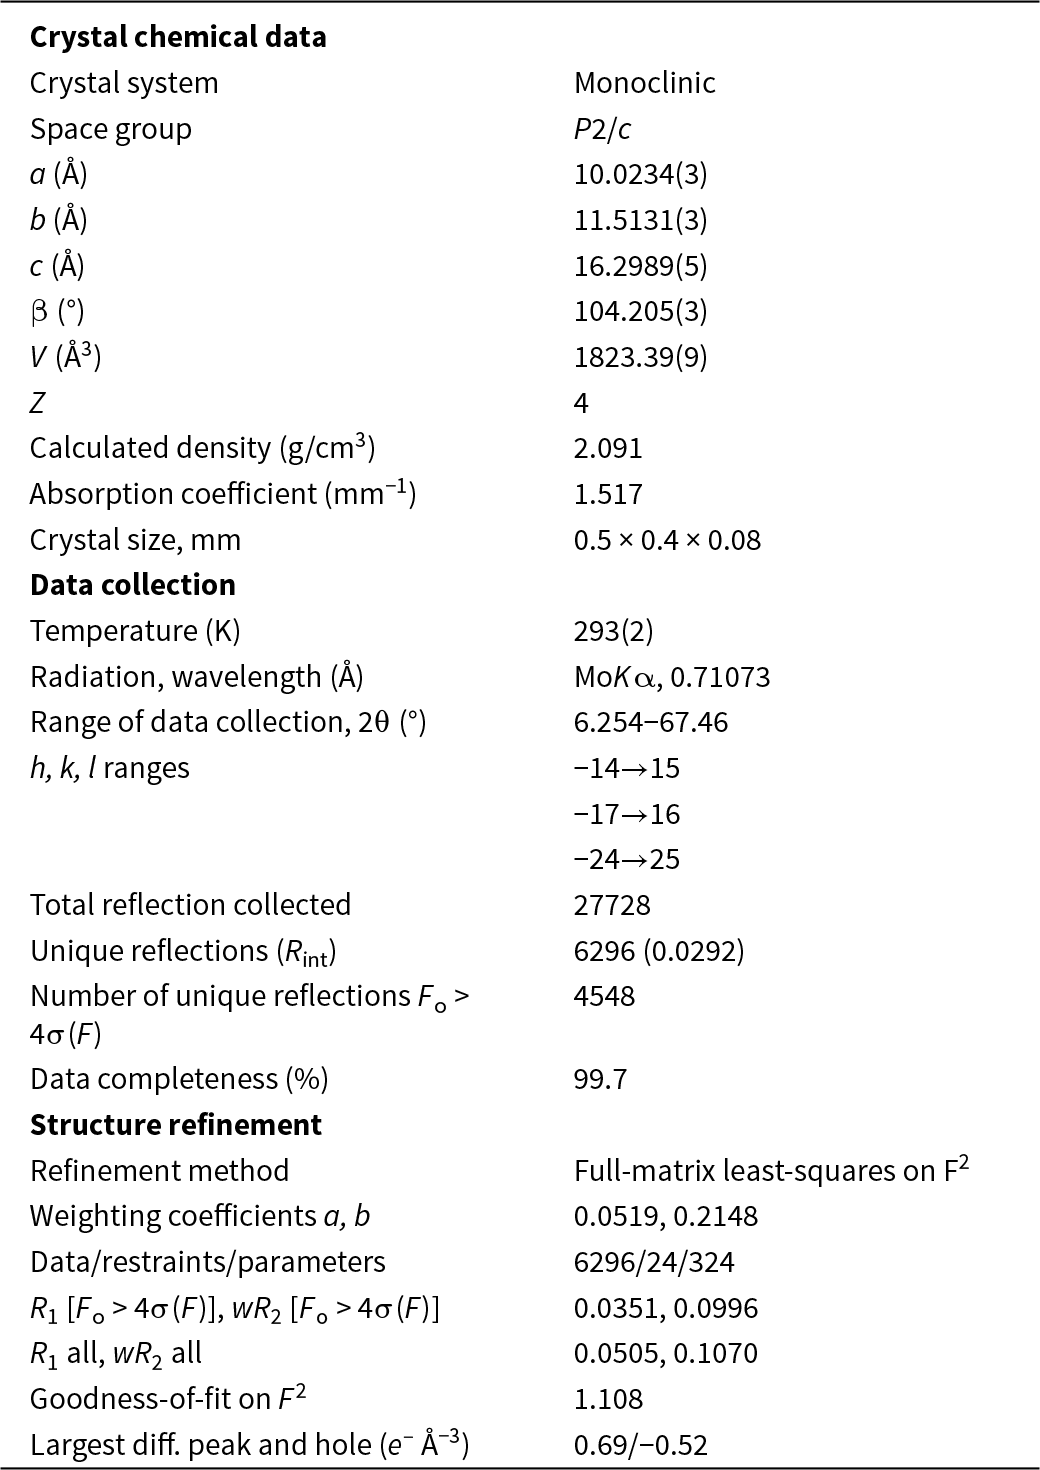
Powder X-ray diffraction data were collected from the hydrocalumite crystal by means of Rigaku R-Axis Rapid II diffractometer (Debye-Scherrer geometry and d = 127.4 mm) equipped with a rotating anode X-ray source (CoKα and λ = 1.79021 Å) and a curved image plate detector. The data were integrated using the software package Osc2Tab/SQRay (Britvin et al., Reference Britvin, Dolivo-Dobrovolsky and Krzhizhanovskaya2017) and processed using the International Centre for Diffraction Data (ICDD) database incorporated into the PDXL program (Rigaku, Reference Rigaku2018). Topas 4.2 software (Bruker AXS, Reference Bruker2009) was used for the refinement of the unit-cell parameters and indexing of powder X-ray diffraction pattern by the Pawley method using the starting structural model of hydrocalumite reported therein (Table 2). The background was modelled by a Chebyshev polynomial approximation of the 10th order.
Crystal data, data collection information and structure refinement details for hydrocalumite
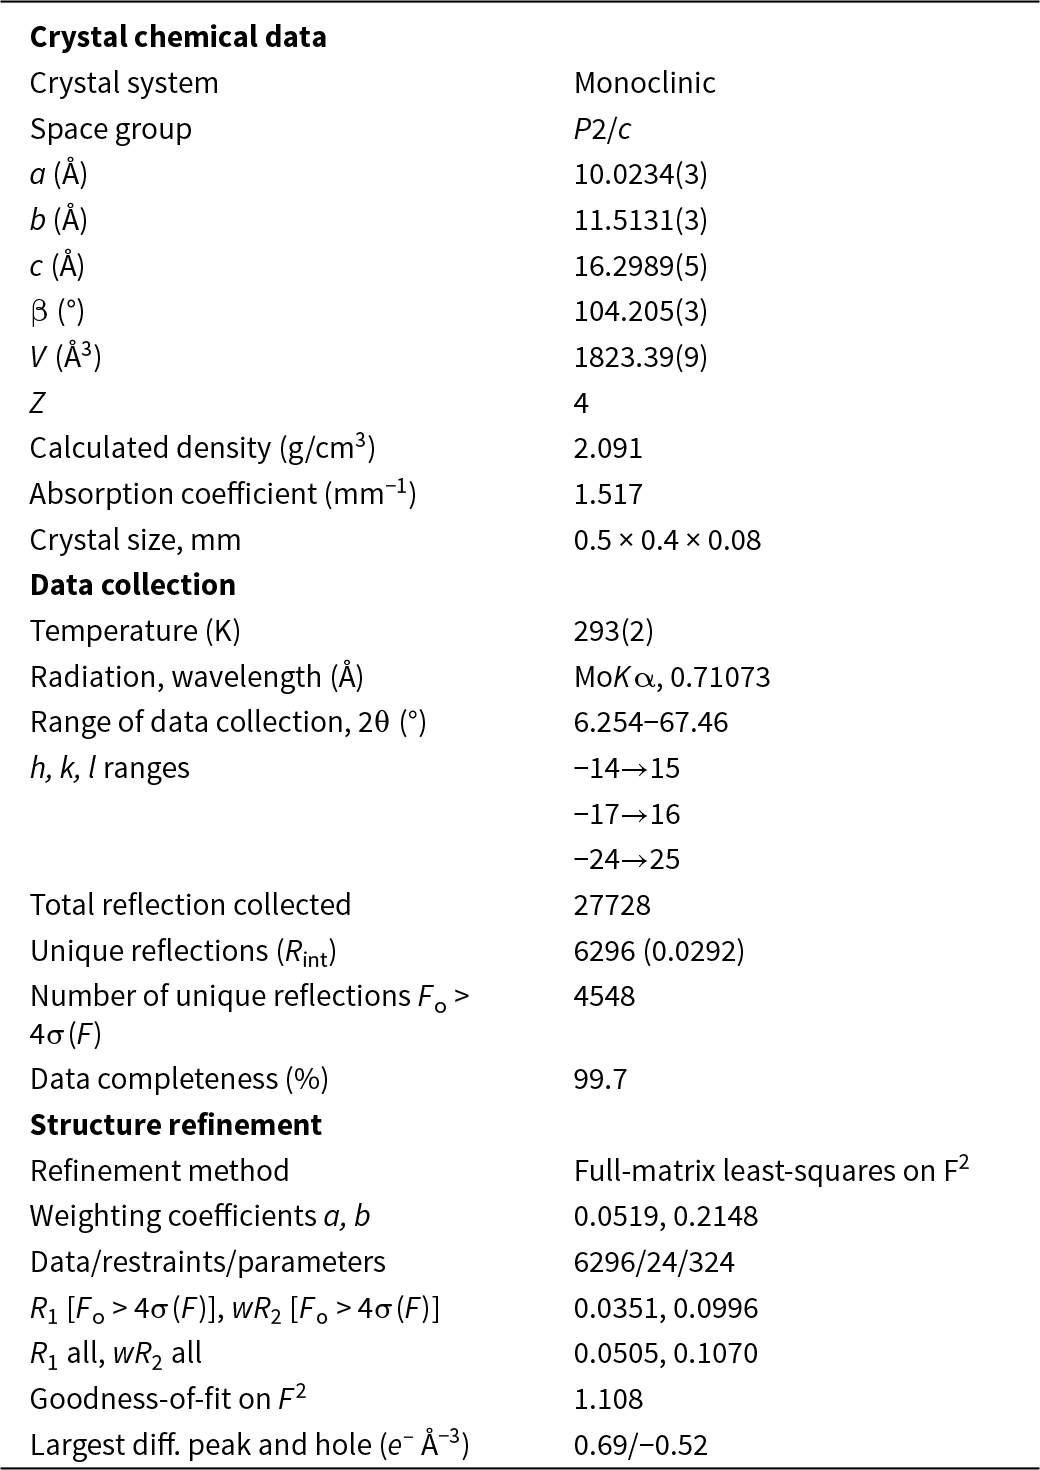
Table 2 Long description
The table compiles crystallographic unit-cell metrics for natural hydrocalumite and closely related natural and synthetic layered calcium aluminate hydrates. For natural hydrocalumite, three entries share a monoclinic setting with a around 9.9 to 10.05 angstroms, b around 11.4 to 11.52 angstroms, c around 16.2 to 16.29 angstroms, and beta near 104 degrees, all reported as the 2M polytype from Irish and Italian localities. A fourth natural hydrocalumite entry is rhombohedral, with a about 5.765 angstroms and a much longer c near 46.978 angstroms, reported as the 6R polytype from Germany. Across the natural entries, the nearest-cation spacing a prime stays tightly grouped near 5.70 to 5.77 angstroms, and the interlayer repeat distance d stays near 7.83 to 7.89 angstroms. Synthetic analogs (chloro-carboaluminate, hemicarboaluminate, carbonated hemicarboaluminate, and Friedel’s salt) are mostly rhombohedral 6R with a near 5.74 to 5.78 angstroms and c near 46.39 to 48.81 angstroms; one Friedel’s salt is a 3R polytype with c about 23.49 angstroms, roughly half the longer c values. The d spacing for synthetic phases ranges from about 7.73 to 8.13 angstroms, with the largest value in hemicarboaluminate. Space-group assignments include uncertainty or alternative settings in the sources, so comparisons should focus on the reported metric ranges and polytype groupings rather than exact symmetry labels.
Raman spectroscopy
The Raman spectrum was obtained with a Horiba Jobin-Yvon LabRam HR800 spectrometer, equipped with a solid-state laser (λ = 532 nm) at 50 mW output power and ∼6 mW power at the sample surface for an area of 2 × 2 μm. The spectrum was recorded with a resolution of 2 cm–1 at room temperature. The single crystal studied was orientated with its (001) face perpendicular to the laser beam (Fig. S1). The spectrum was further processed using LabSpec (Horiba) software.
Results
Chemical composition
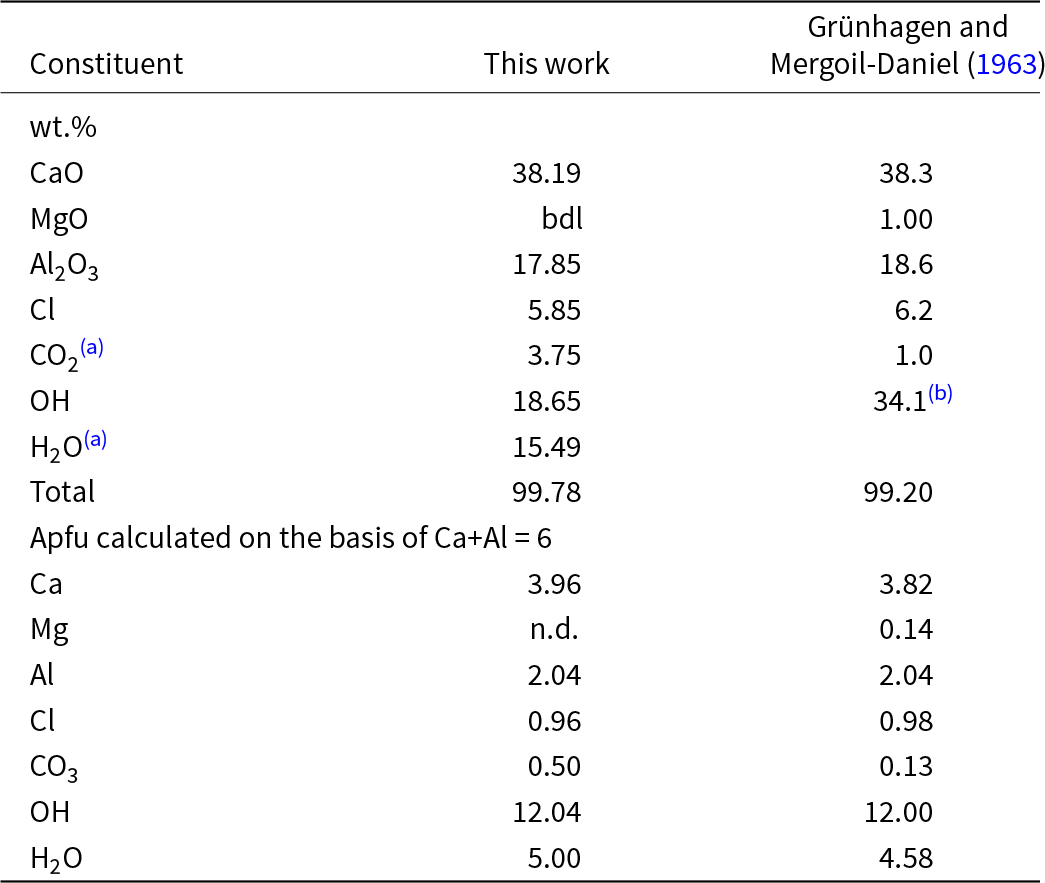
The grains studied (Fig. 2) contain the following elements with atomic numbers > 5: Ca, Al, Cl and O. The empirical formula was calculated based on Ca + Al = 6 atoms per formula unit (apfu). The amounts of H2O, OH and CO3 groups were calculated on the basis of the crystal-structure data (see below) that is also supported by Raman spectroscopy. The chemical composition of hydrocalumite is given in Table 3. The obtained empirical formula is Ca3.96Al2.04(OH)12.04Cl0.96(CO3)0.50·5H2O that can be idealized as Ca4Al2(OH)12Cl(CO3)0.5·5H2O.
Chemical composition of hydrocalumite from Boisséjour, Puy-de-Dôme, Auvergne-Rhône-Alpes, France
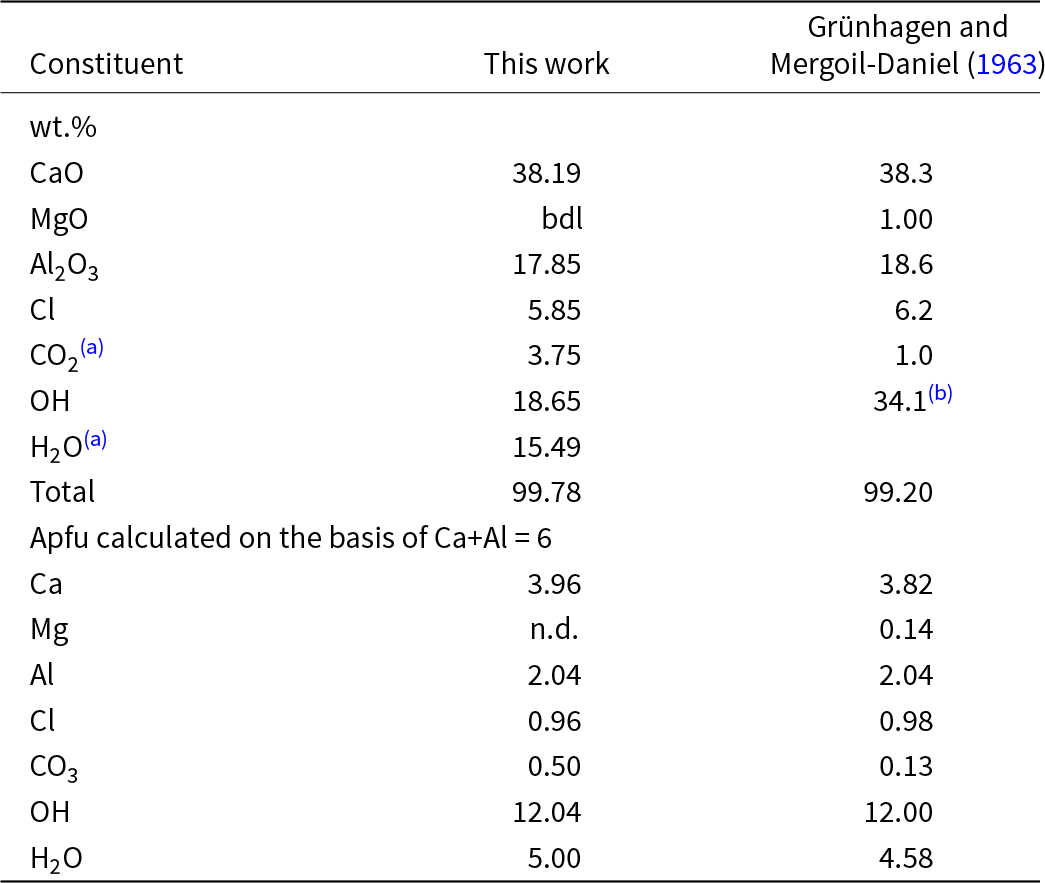
Table 3 Long description
The table reports chemical composition for a mineral sample, comparing a new analysis with values published in 1963. Major oxides and volatiles are listed in weight percent, followed by atoms per formula unit values normalized to a fixed calcium plus aluminum basis. In weight percent, CaO is about 38.19 in the new work versus 38.3 previously, and Al2O3 is 17.85 versus 18.6, showing close agreement for these major components. Magnesium differs most: it is below detection in the new work but reported as 1.00 previously. Chlorine is similar at 5.85 versus 6.2, while carbon dioxide is higher in the new work at 3.75 versus 1.0. Hydroxyl is lower in the new work at 18.65 compared with 34.1 previously, and the new work separately reports water at 15.49, whereas the earlier column does not list a separate water value. Totals are near complete for both datasets, 99.78 for the new work and 99.20 for the earlier work. In the normalized formula values, calcium and aluminum are essentially the same between studies, chlorine is close, carbonate is higher in the new work, magnesium is not detected in the new work but present previously, and water is slightly higher in the new work.
Notes: (a) calculated based on crystal structure data. (b) 34.1 wt. % is the total content of H2O represented by OH‒ groups and H2O molecules. bdl – below detection limit.
The comparison of our chemical composition data with those reported by Grünhagen and Mergoil-Daniel (Reference Grünhagen and Mergoil-Daniel1963) for their Boisséjour sample (Table 3) shows a good agreement, with the exception of the CO2 content, which could have been underestimated in the early measurements due to the difficulty of quantitative determination of carbon.
Raman spectroscopy
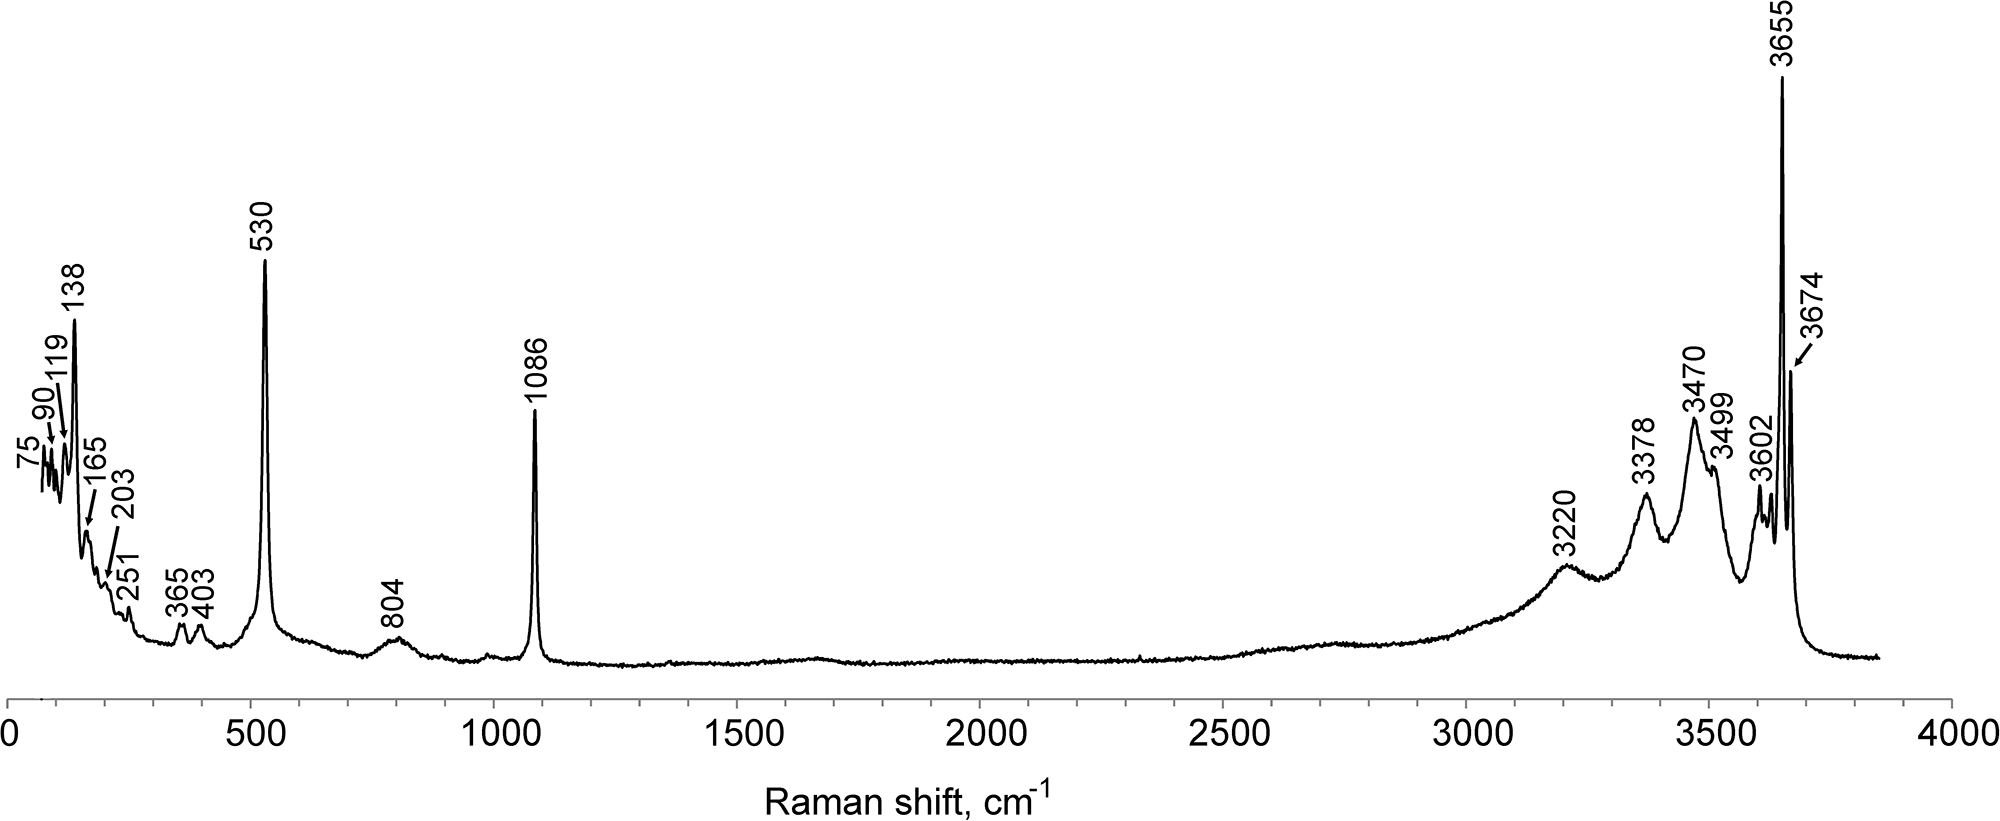
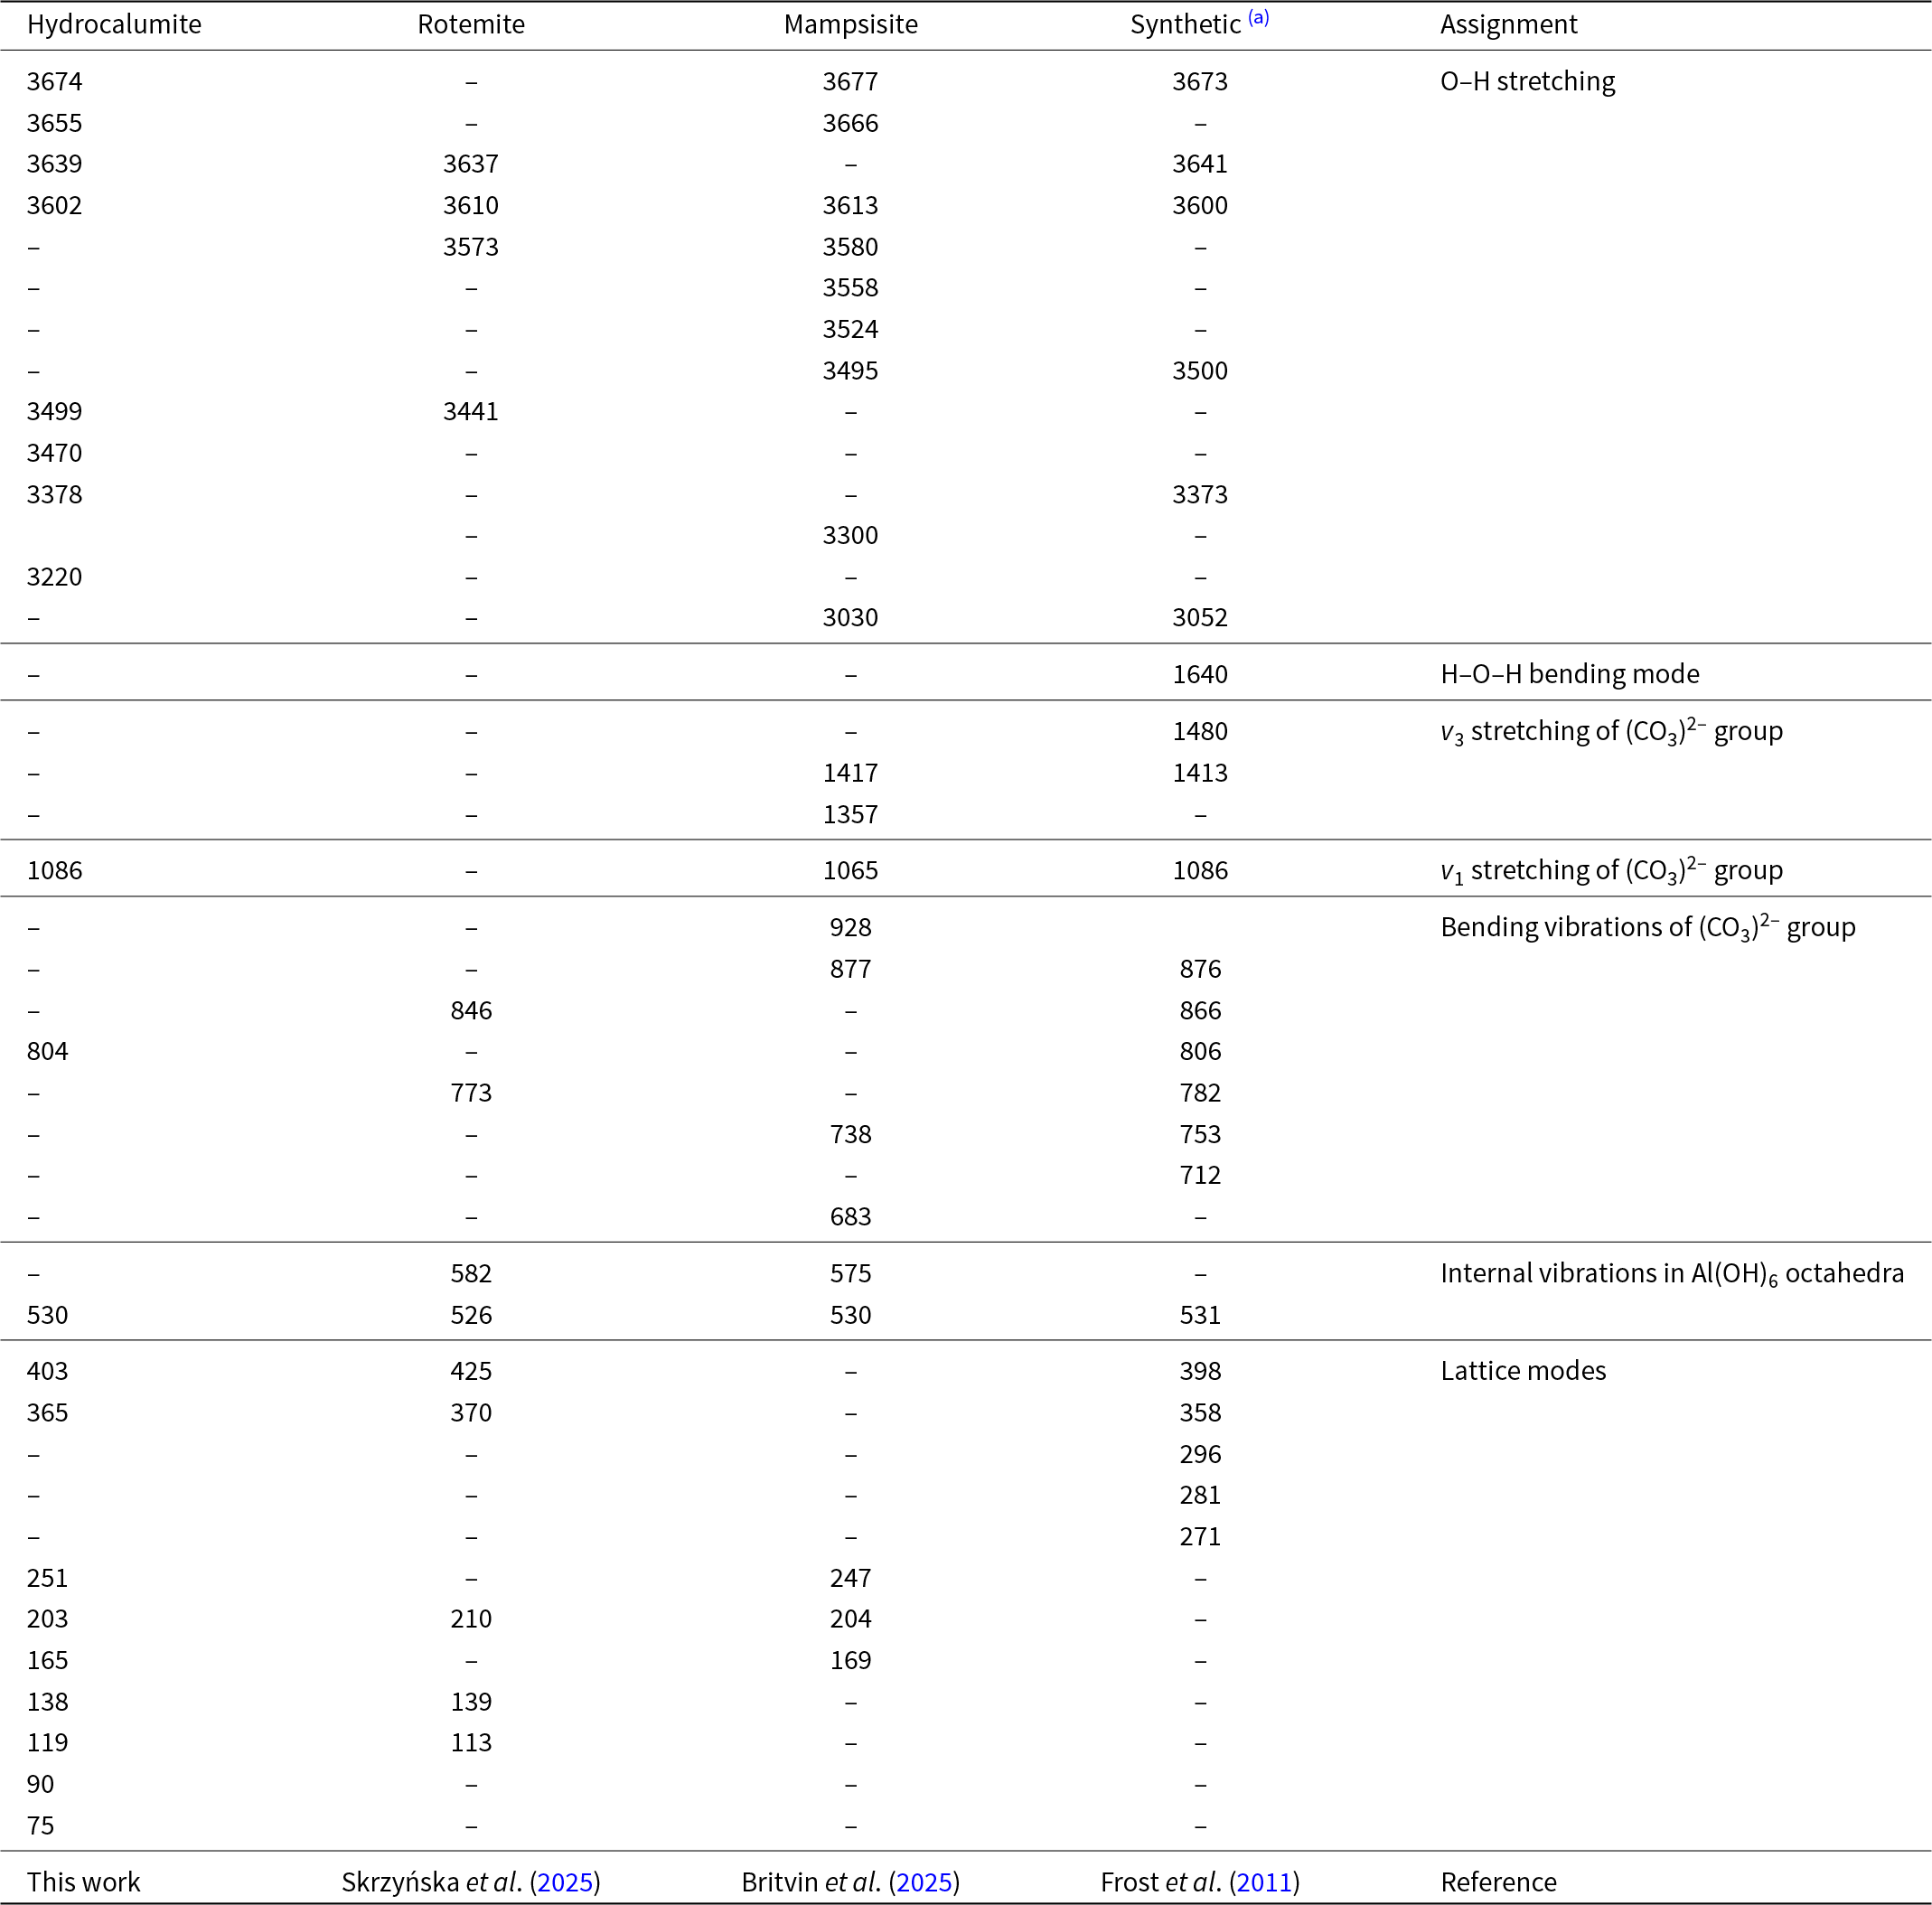
The Raman spectrum of hydrocalumite is shown in Fig. 3. The comparison of the positions of Raman bands of hydrocalumite with its synthetic analogue, rotemite and mampsisite, and their assignments are provided in Table 4. The spectrum contains bands of O–H stretching vibrations corresponding to hydroxyl groups and H2O molecules, and symmetric C–O stretching vibrations of carbonate groups that are in agreement with the newly determined chemical composition of the studied hydrocalumite.
Raman spectrum of hydrocalumite from Boisséjour, Puy-de-Dôme, Auvergne-Rhône-Alpes, France. The y axis is intensity.
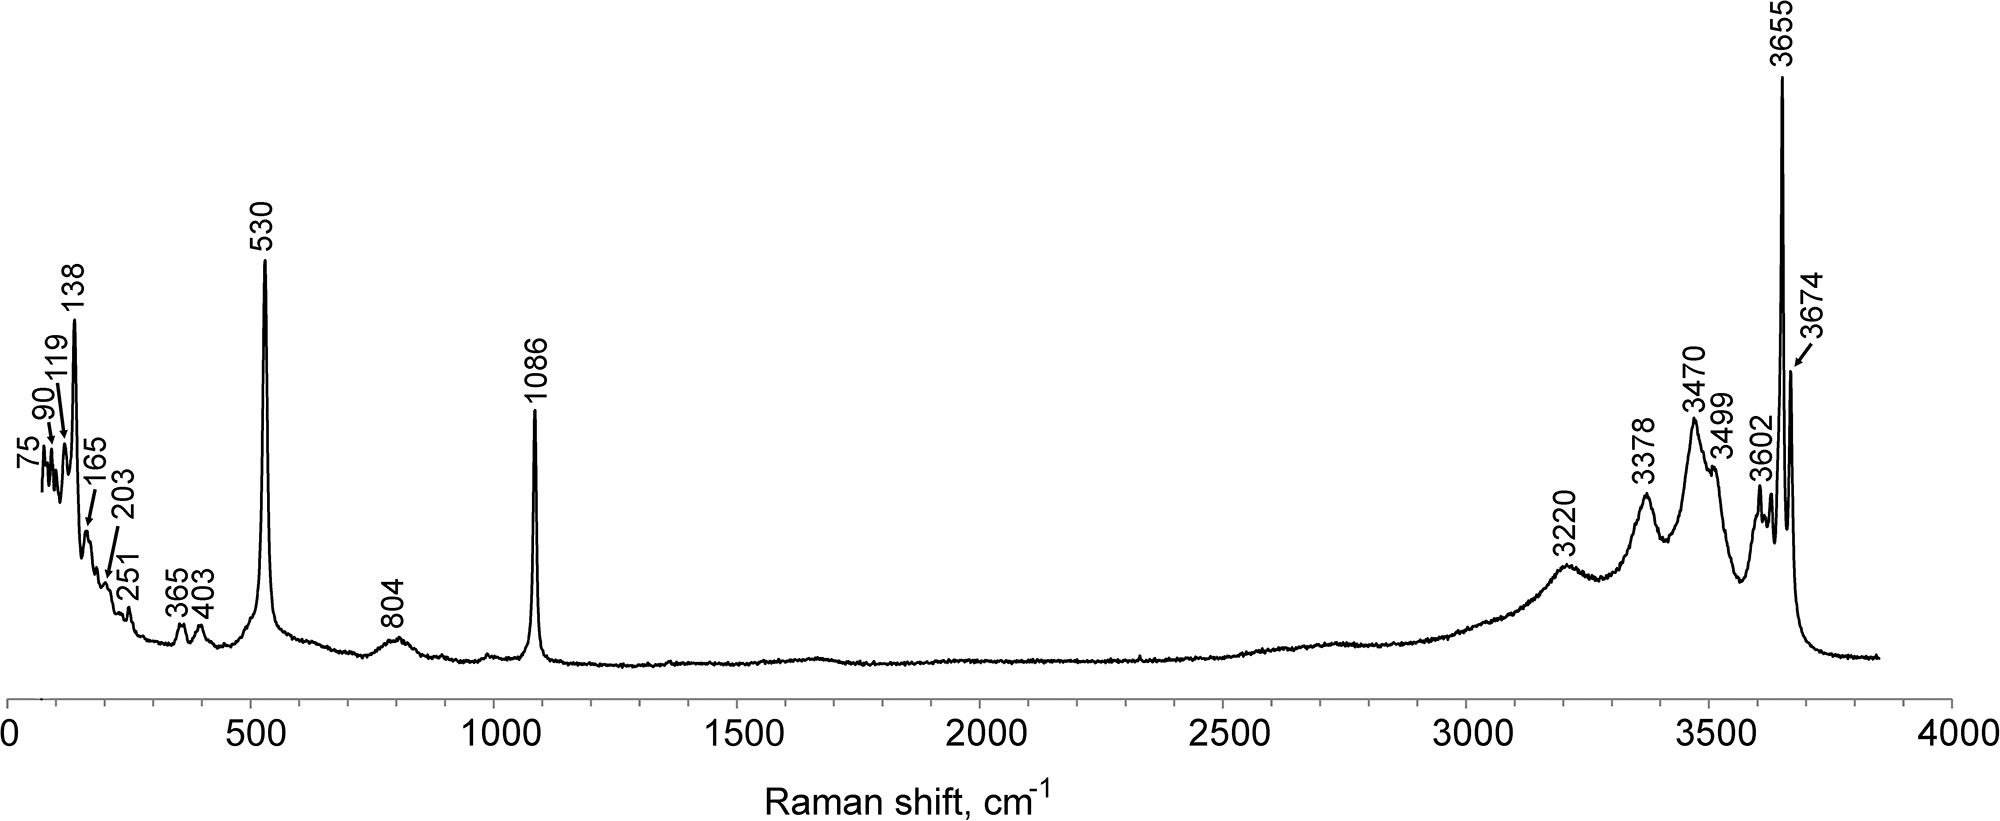
Figure 3 Long description
Raman shift, cm superscript minus 1 A single line plot shows a Raman spectrum. The x-axis label is Raman shift, cm superscript minus 1. The x-axis runs from 0 to 4000, with labeled ticks at 0, 500, 1000, 1500, 2000, 2500, 3000, 3500 and 4000. The y-axis label is not legible in the image.
Bands and their assignment in Raman spectra of hydrocalumite, rotemite, mampsisite and synthetic Ca6Al2(OH)16(CO3)·4H2O
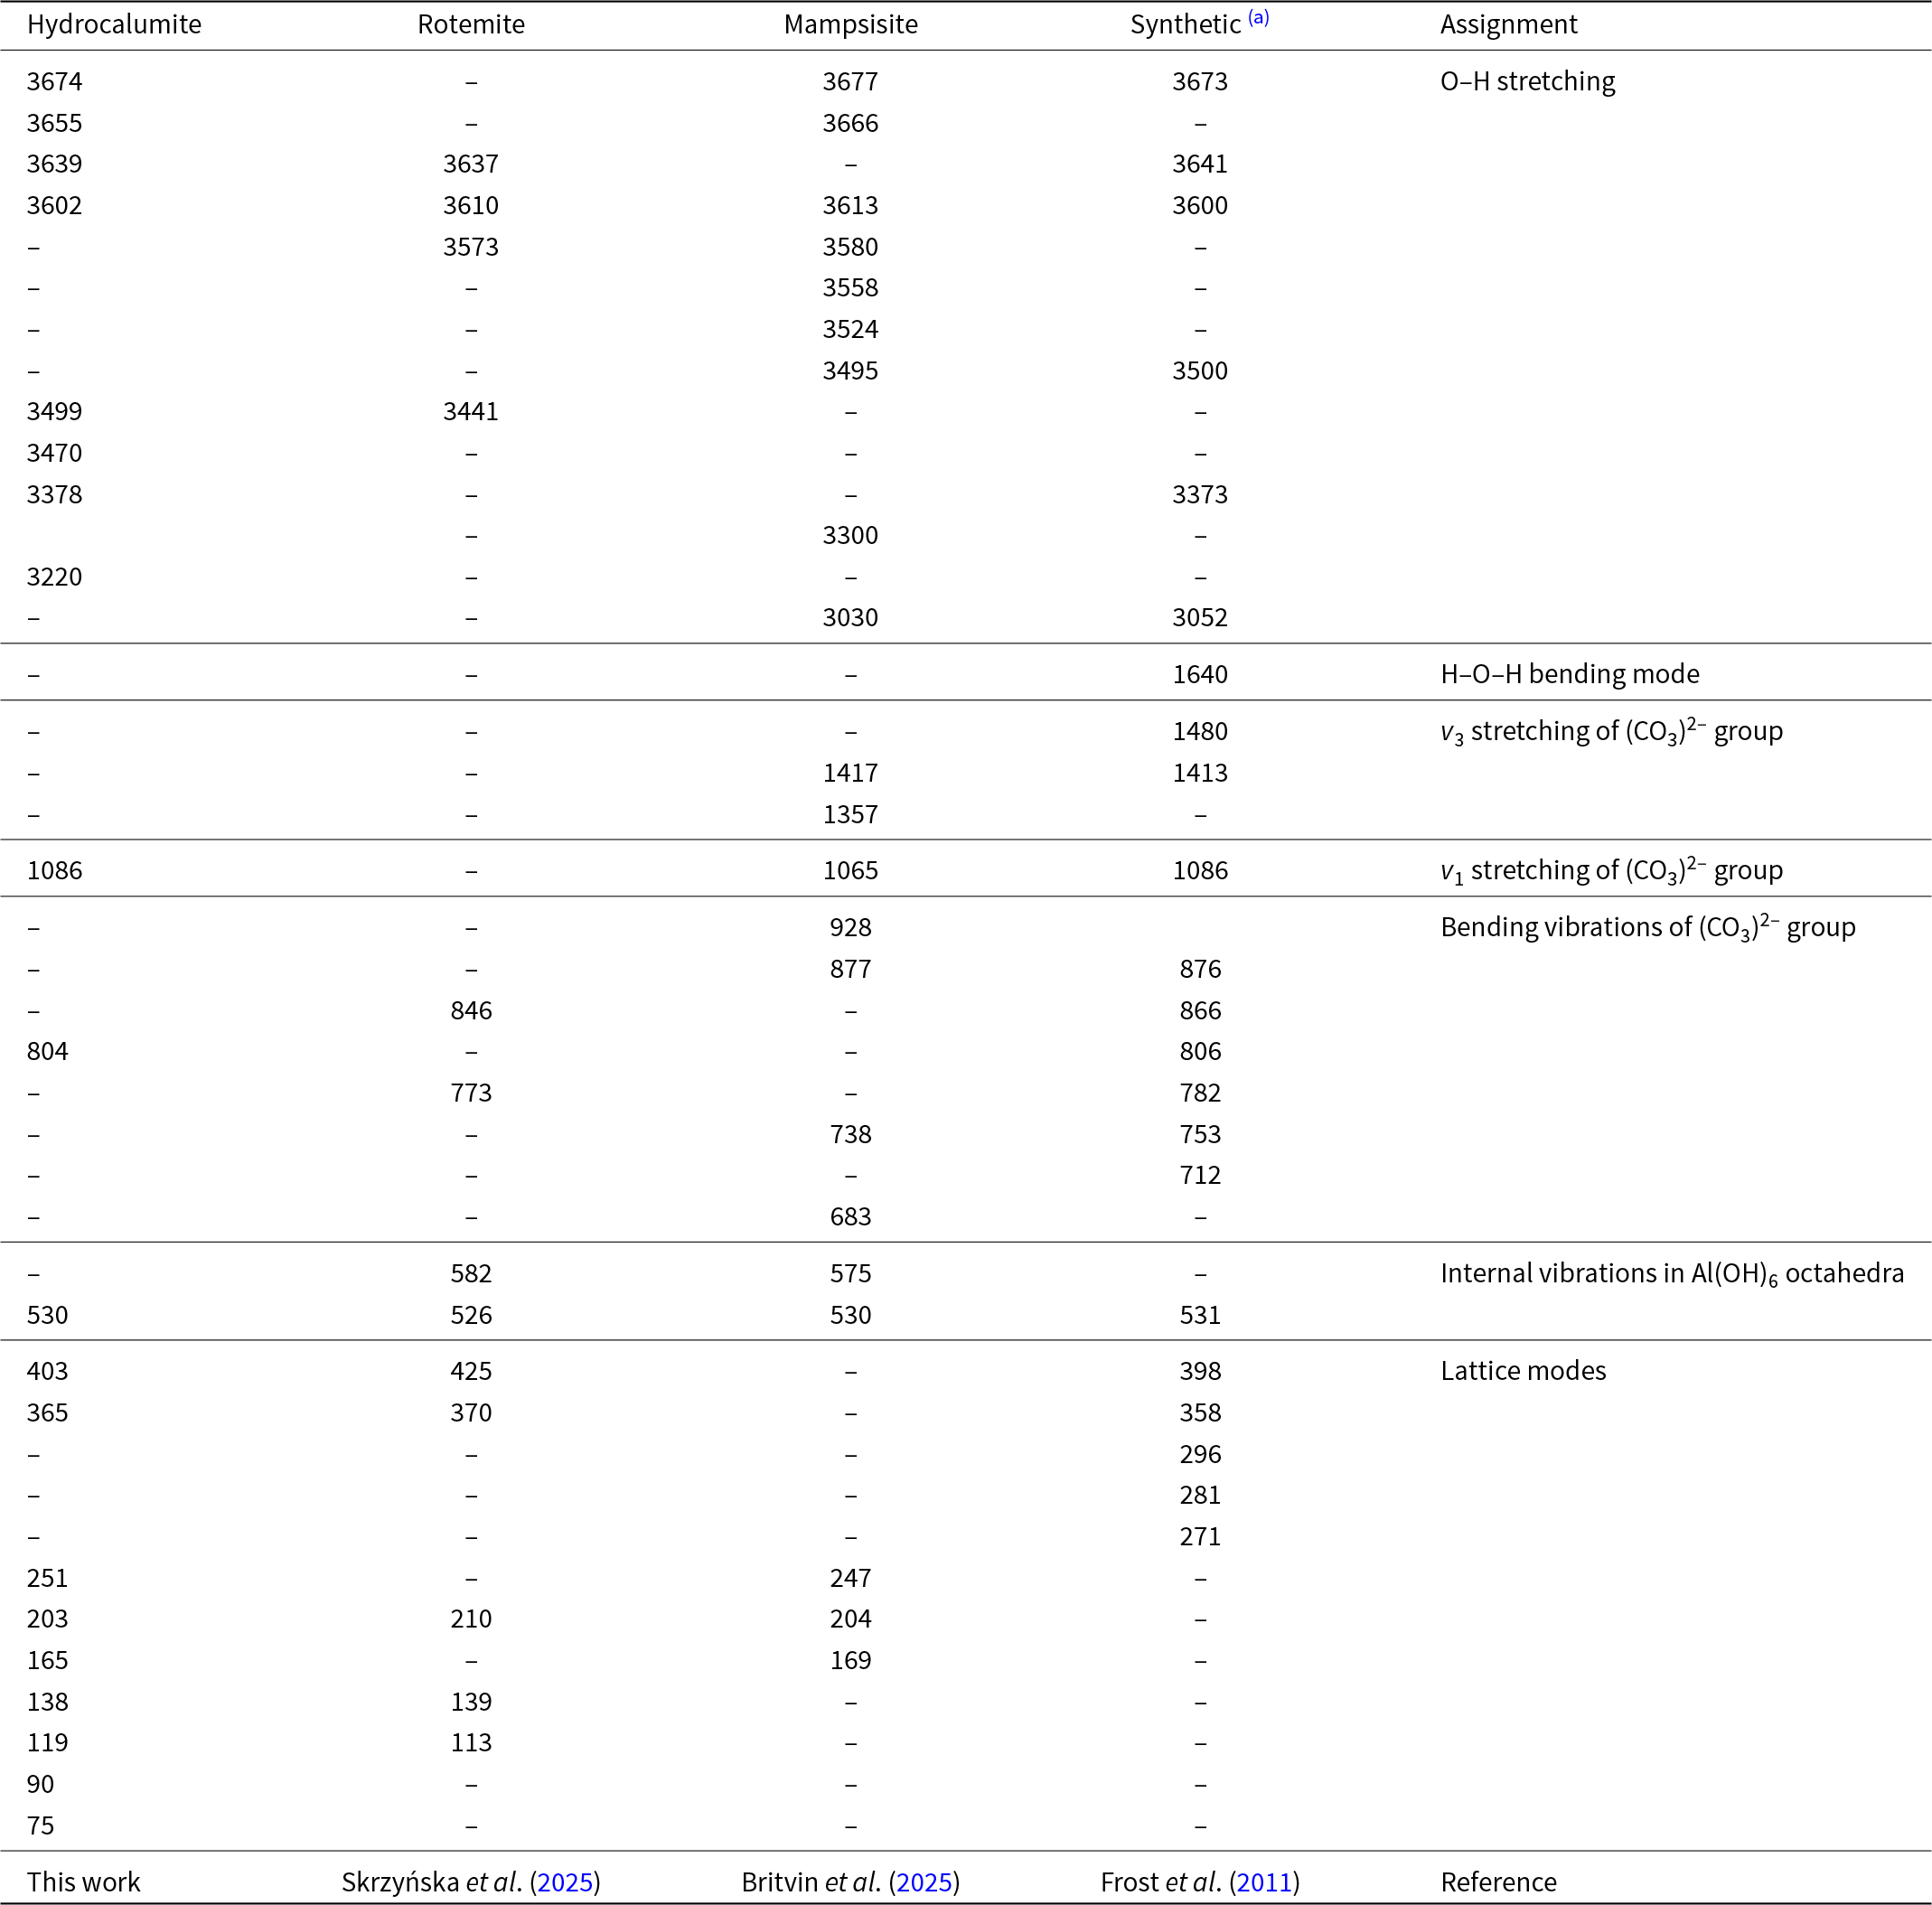
Table 4 Long description
The table lists Raman peak positions, in wavenumbers, for hydrocalumite, rotemite, mampsisite, and a synthetic analogue, alongside band assignments.
Notes: (a) the chemical formula is Ca6Al2(OH)16(CO3)·4H2O.
Single-crystal X-ray diffraction
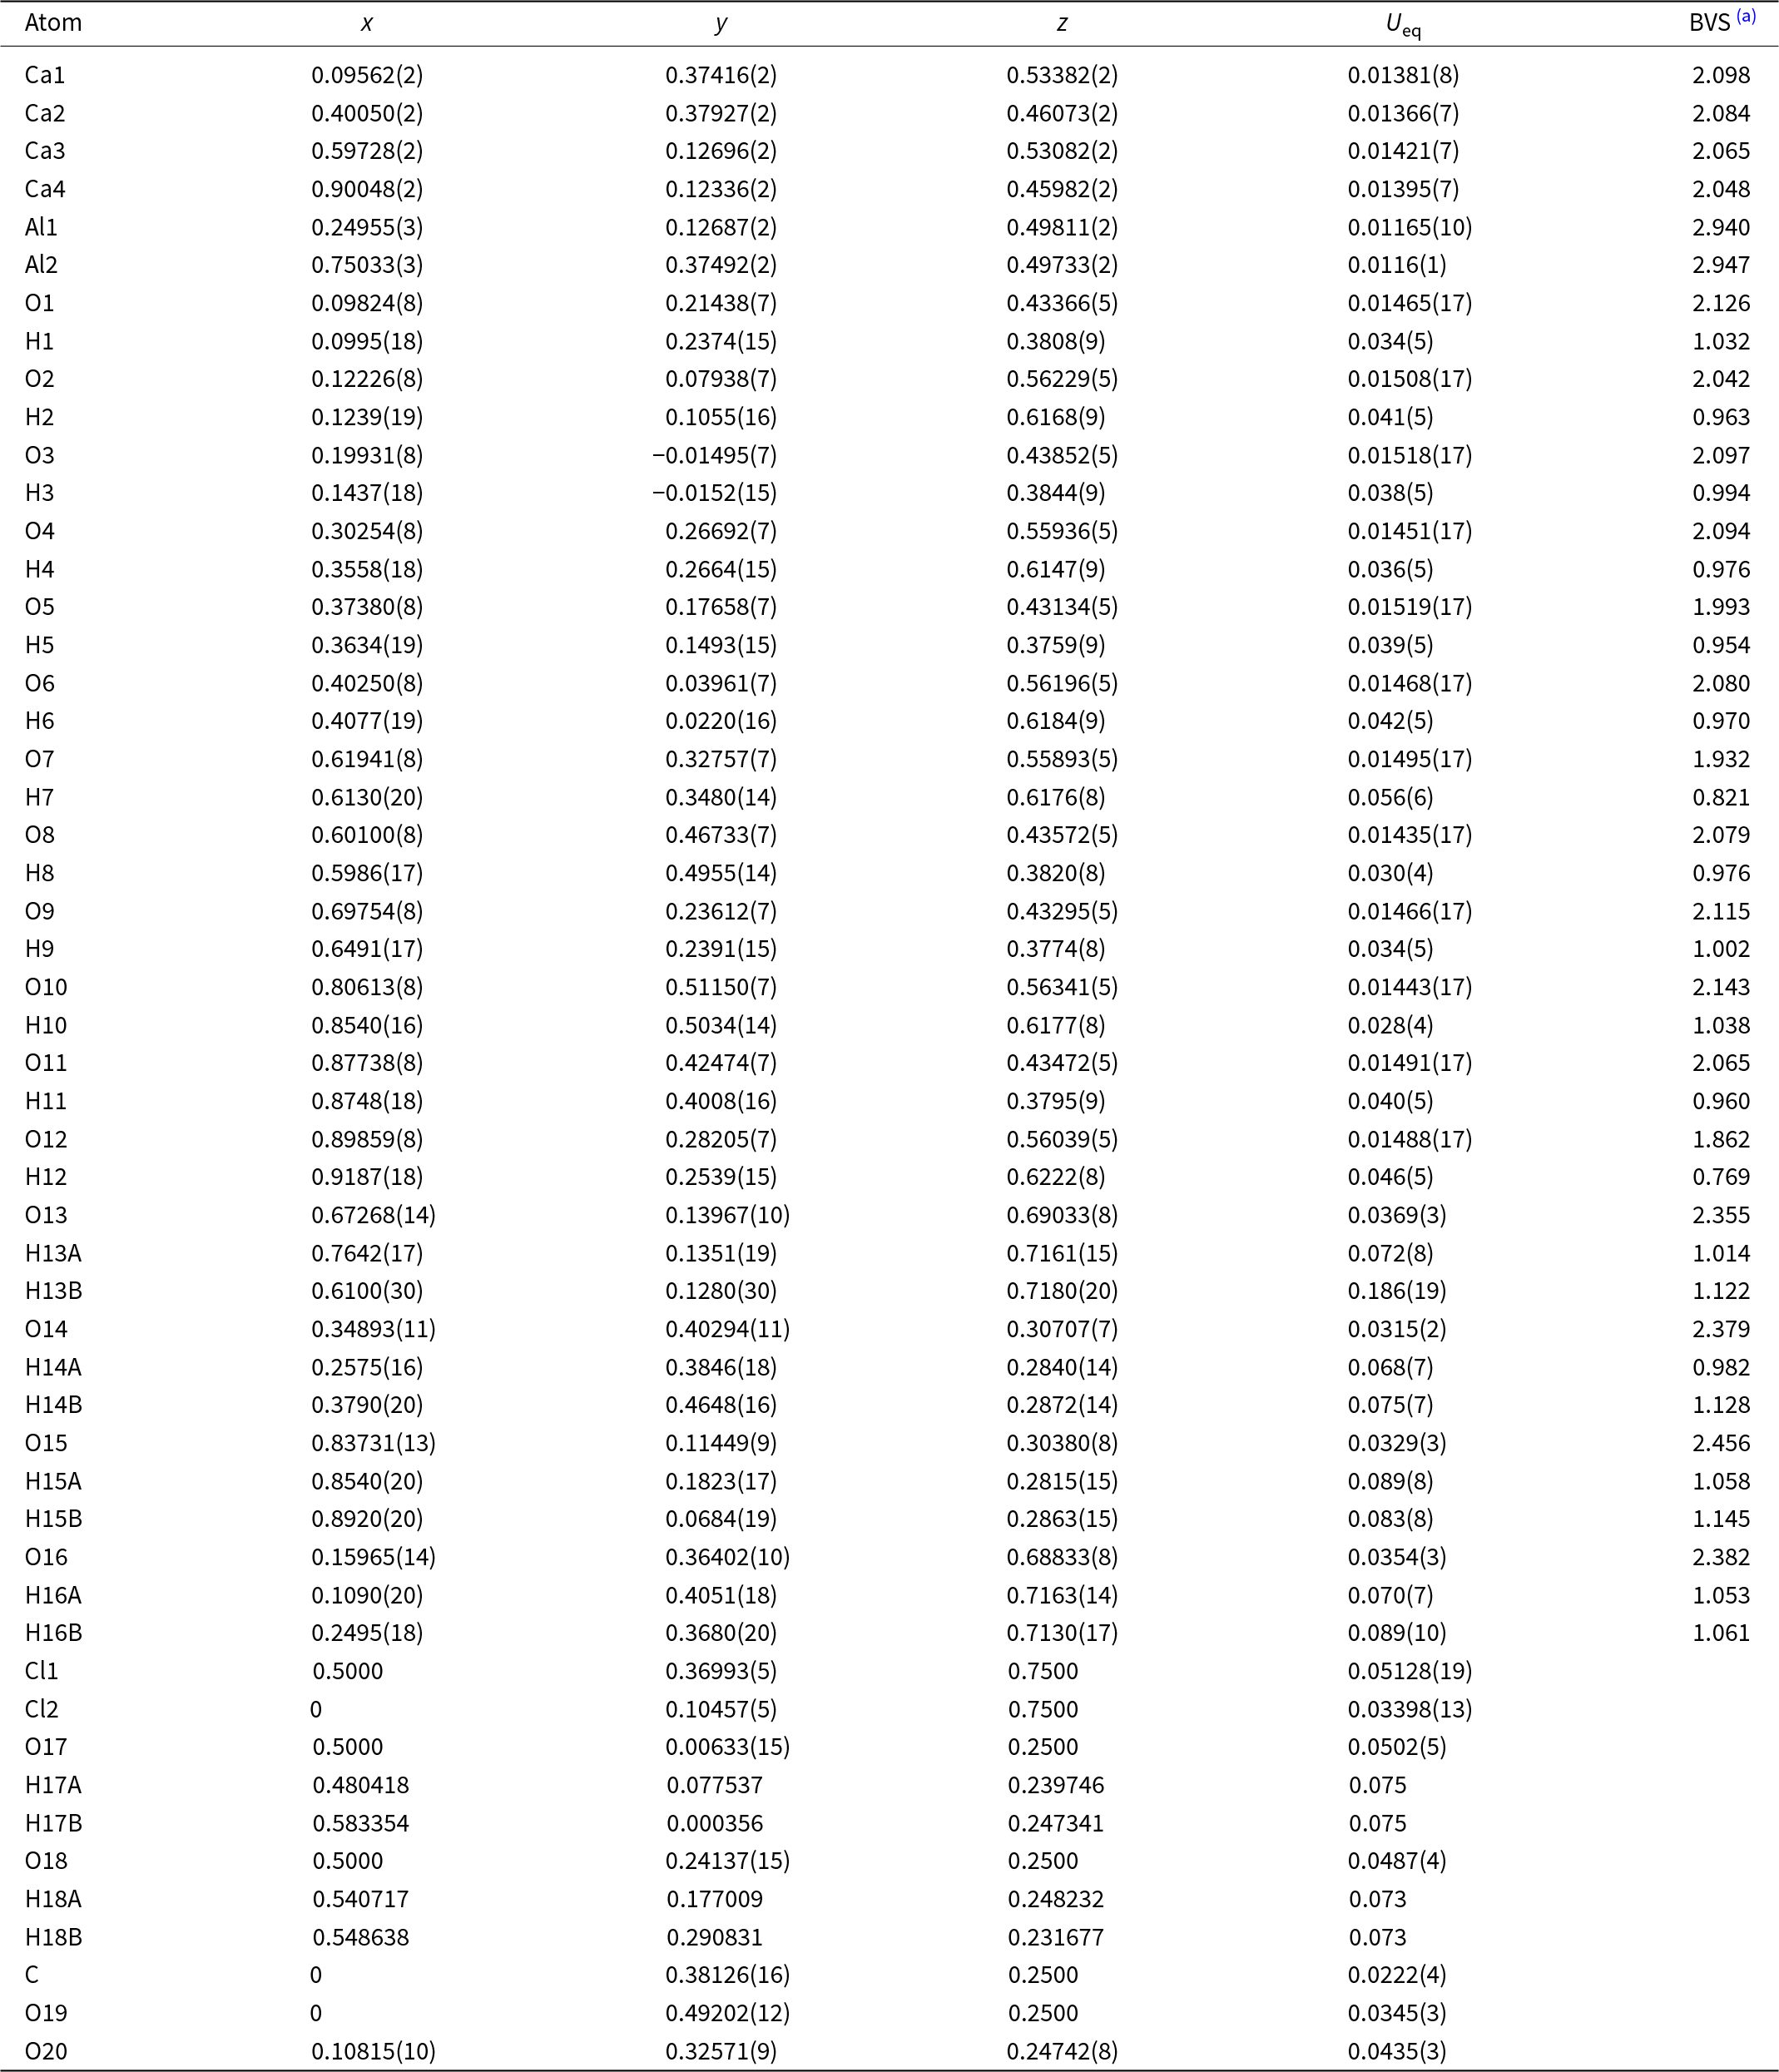
The crystal structure of hydrocalumite was solved by direct methods and refined to R 1 = 0.0505 for 6296 unique reflections in the monoclinic space group P2/c, a = 10.0234(3), b = 11.5131(3), c = 16.2989(5) Å, β = 104.205(3)°, V = 1823.39(9) Å3 and Z = 4 (Table 2). Atom coordinates, site occupancies and equivalent displacement parameters are given in Table 5. Selected bond lengths and angles are listed in Table 6, the hydrogen-bonding scheme is provided in Table 7. The anisotropic displacement parameters are given in Supplementary Table S1. The crystallographic information file (cif) has been deposited (1) via the joint Cambridge Crystal Data Centre CCDC/FIZ Karlsruhe deposition service; the deposition number is CSD 2517266 and (2) with the Principal Editor of Mineralogical Magazine and is available as Supplementary Material (see below).
Atom coordinates and equivalent displacement parameters (Å2) and bond-valence sums (BVS) for hydrocalumite
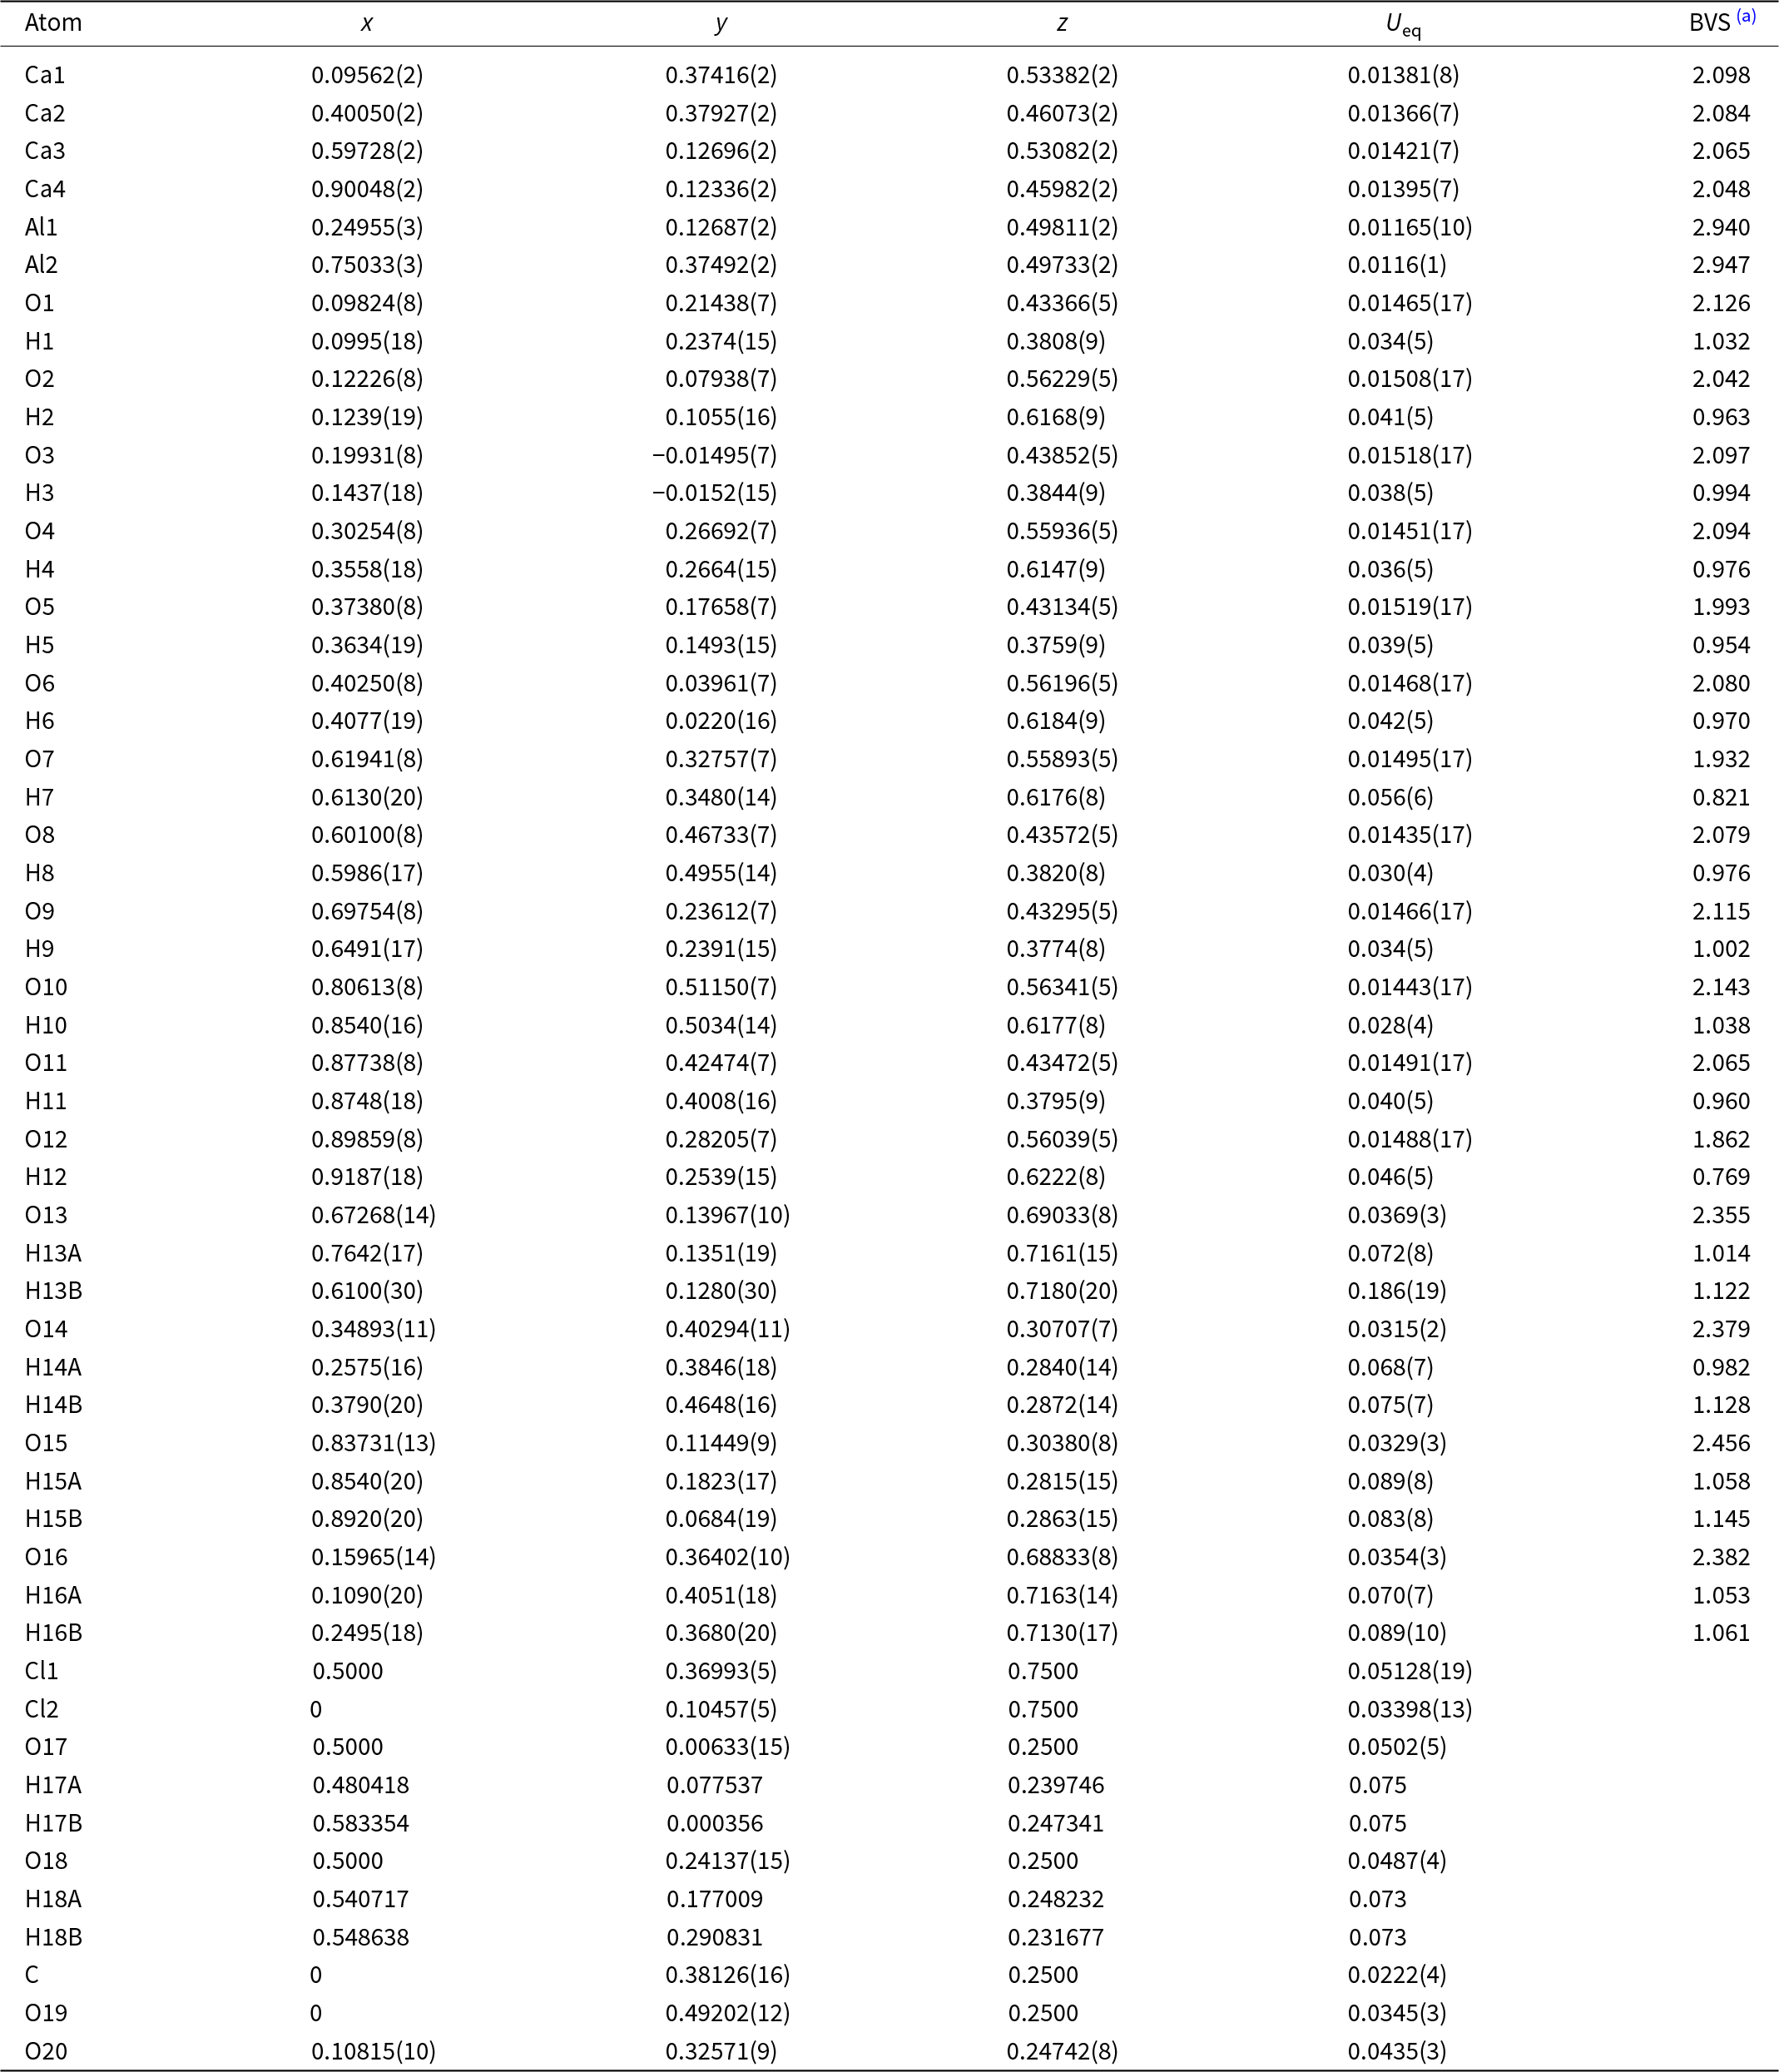
Table 5 Long description
Fractional atomic coordinates (x, y, z), equivalent displacement parameters (Ueq), and bond valence sums are listed for hydrocalumite for Ca, Al, O, H, Cl, and carbonate-related atoms. Calcium sites Ca1 to Ca4 have bond valence sums from about 2.048 to 2.098, and aluminum sites Al1 and Al2 are about 2.940 to 2.947, consistent with typical Ca and Al valences. Most framework oxygen atoms O1 to O12 have bond valence sums close to 2, ranging roughly from 1.862 (O12) to 2.143 (O10). Hydrogen atoms bonded to these oxygens generally have bond valence sums near 1, with values spanning about 0.769 (H12) to 1.038 (H10). Several higher-displacement water-like oxygen sites O13 to O16 show larger Ueq values (around 0.0315 to 0.0369) and bond valence sums around 2.355 to 2.456, with their associated hydrogens near 1. Chlorine sites Cl1 and Cl2 list coordinates and Ueq but no bond valence sums, and several later atoms (O17, O18, their hydrogens, C, O19, O20) also omit bond valence sums. Values in parentheses indicate reported uncertainties, and bond valence sums depend on the chosen calculation method, so small deviations from ideal valences should be interpreted cautiously.
Notes: (a) BVS – bond-valence strengths in valence units (vu) calculated using Econ21 software (Ilinca, Reference Ilinca2022).
Selected bond lengths in (Å) for hydrocalumite
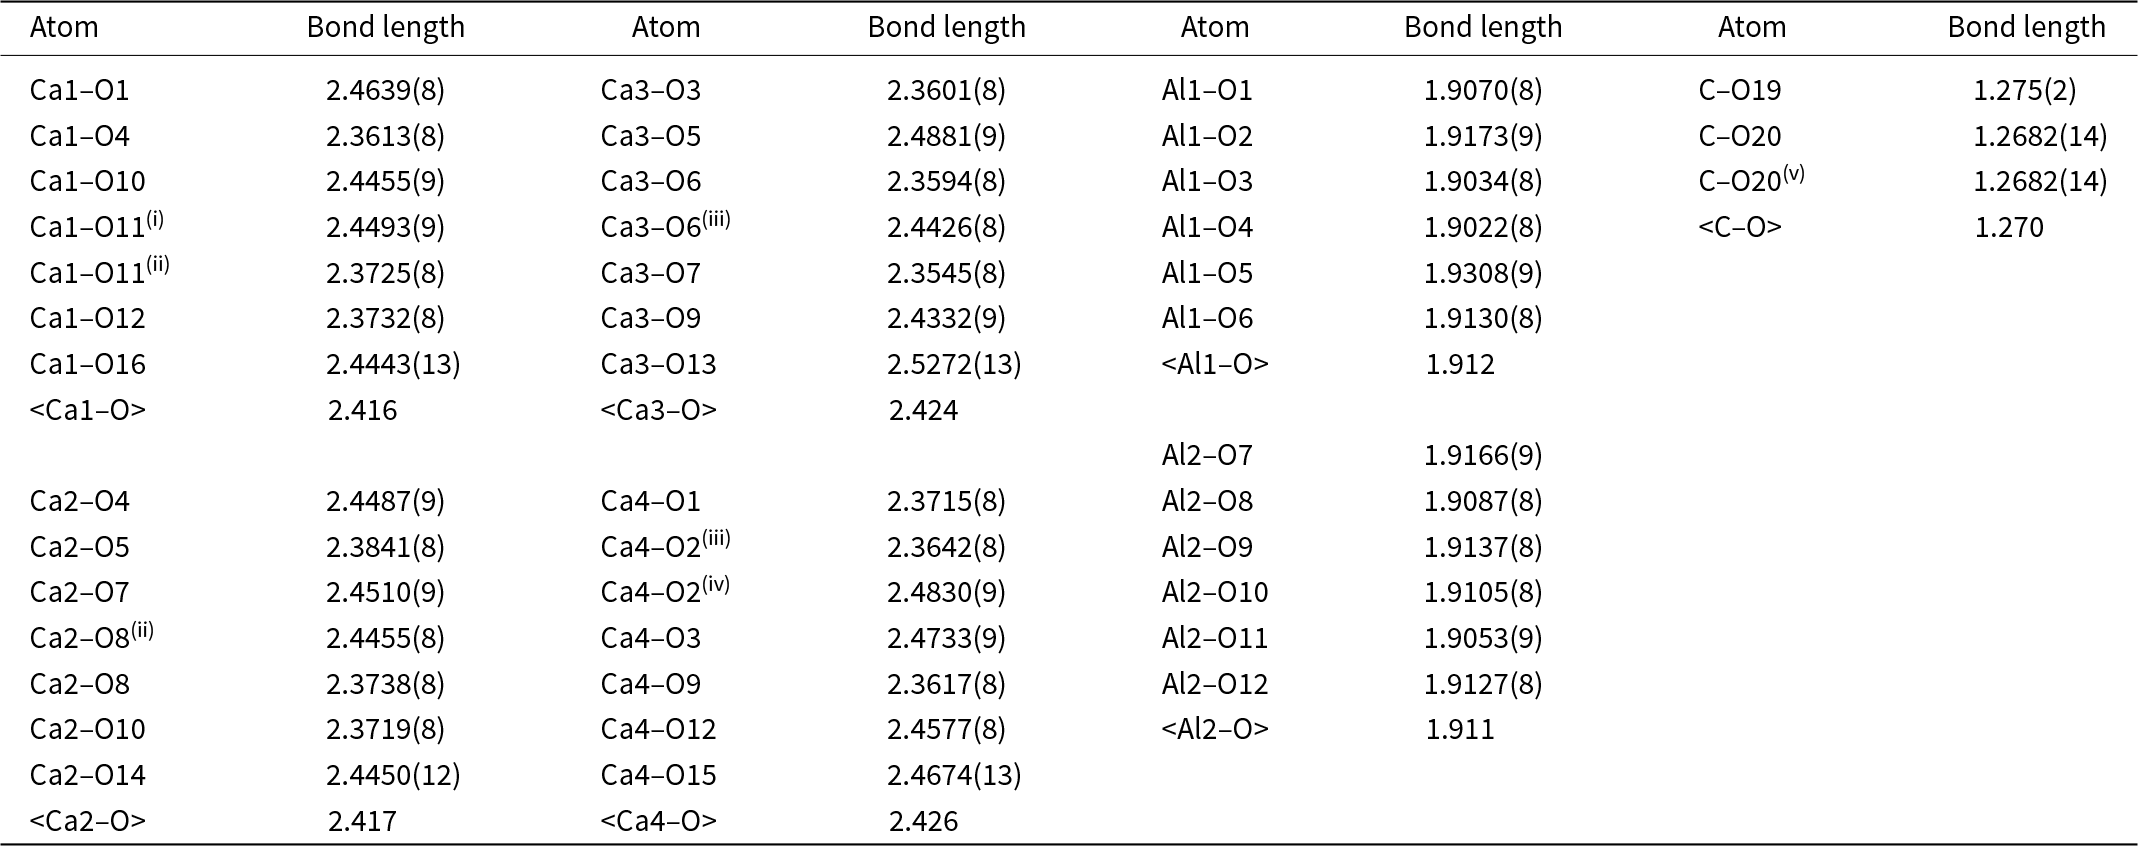
Table 6 Long description
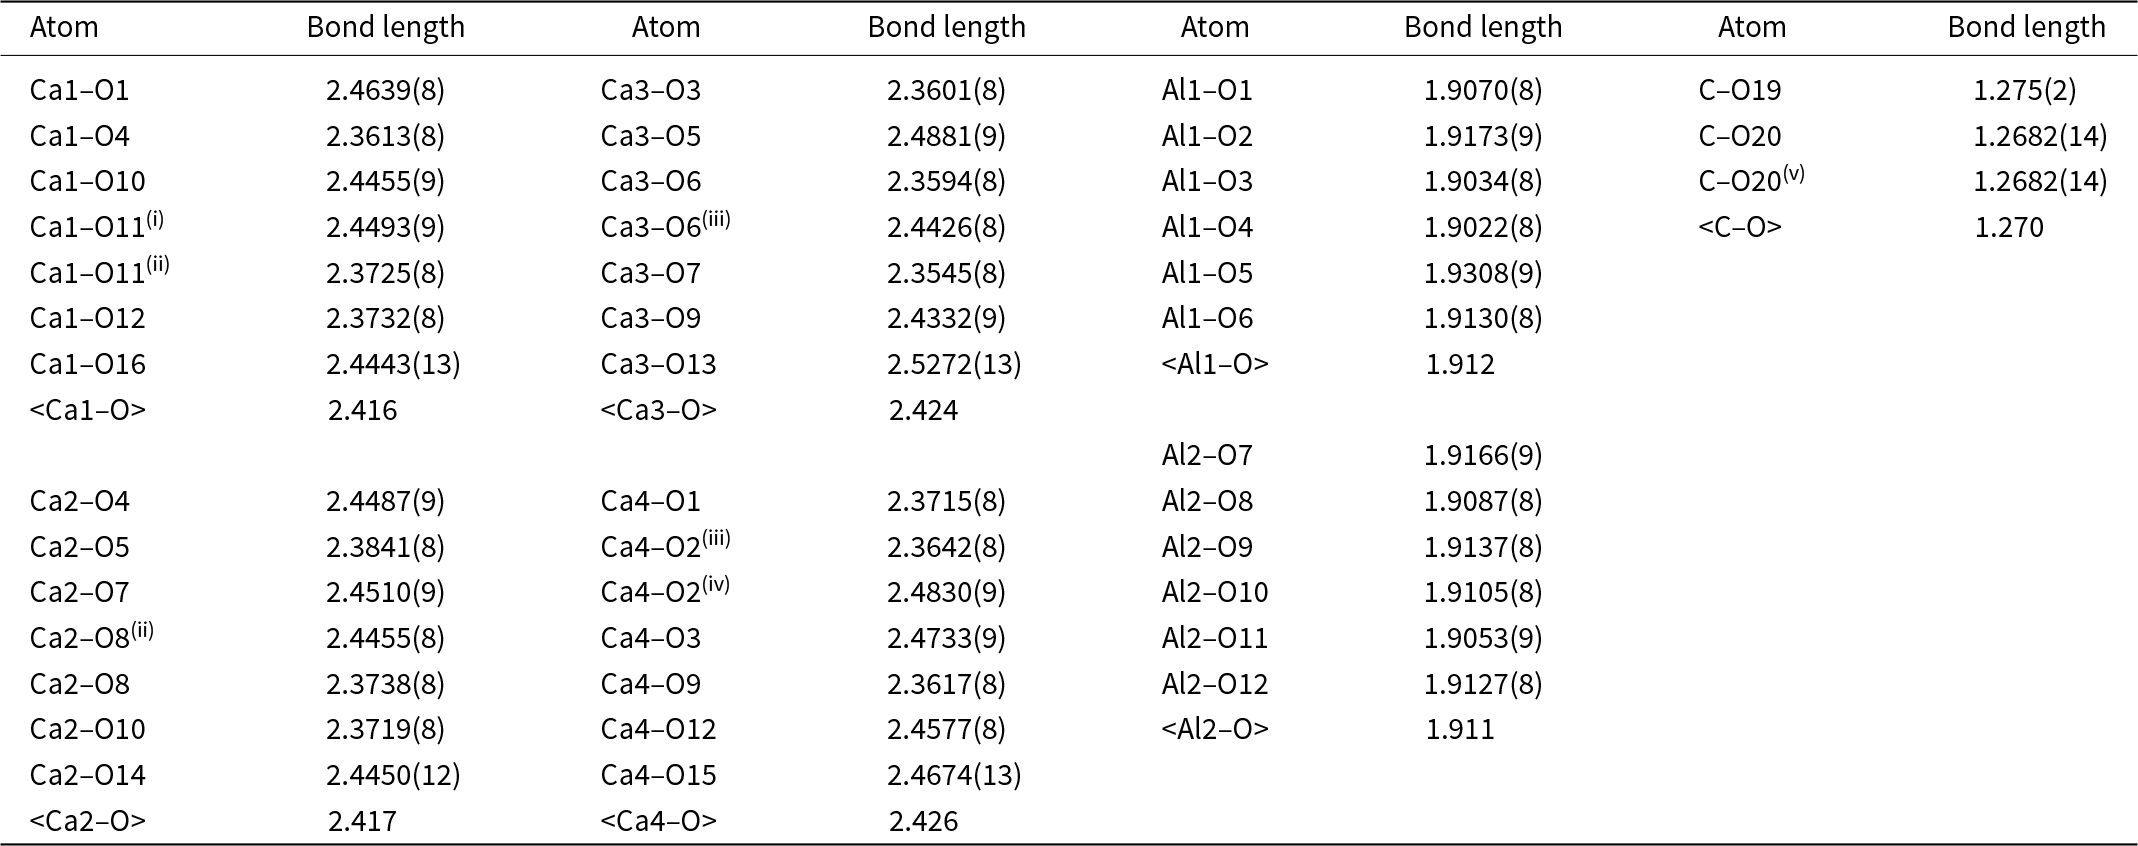
Bond lengths in angstroms are listed for hydrocalumite, pairing specific atoms with measured distances and uncertainties in parentheses. Calcium to oxygen bonds span roughly 2.35 to 2.53 Å, with the longest shown for Ca3 to O13 at 2.5272(13) and many others near 2.36 to 2.49 Å. Average calcium to oxygen distances are very similar across sites: Ca1 2.416, Ca2 2.417, Ca3 2.424, and Ca4 2.426. Aluminum to oxygen bonds are shorter and tightly grouped, about 1.90 to 1.93 Å, with averages of 1.912 for Al1 and 1.911 for Al2. The shortest aluminum to oxygen value listed is Al1 to O4 at 1.9022(8), while the longest is Al1 to O5 at 1.9308(9). Carbon to oxygen distances are about 1.27 Å, including C to O19 at 1.275(2) and C to O20 at 1.2682(14), with an average carbon to oxygen value of 1.270. Some entries reference symmetry-related atoms, so repeated labels can represent equivalent bonds rather than additional distinct sites.
Notes: Symmetry codes: (i) – 1 + X, + Y, + Z; (ii) 1 – X, 1 – Y, 1 – Z; (iii) 1 – X, – Y, 1 – Z; (iv) 1 + X, + Y, + Z; (v) – X, + Y, 1/2 – Z
Hydrogen-bonding scheme for hydrocalumite
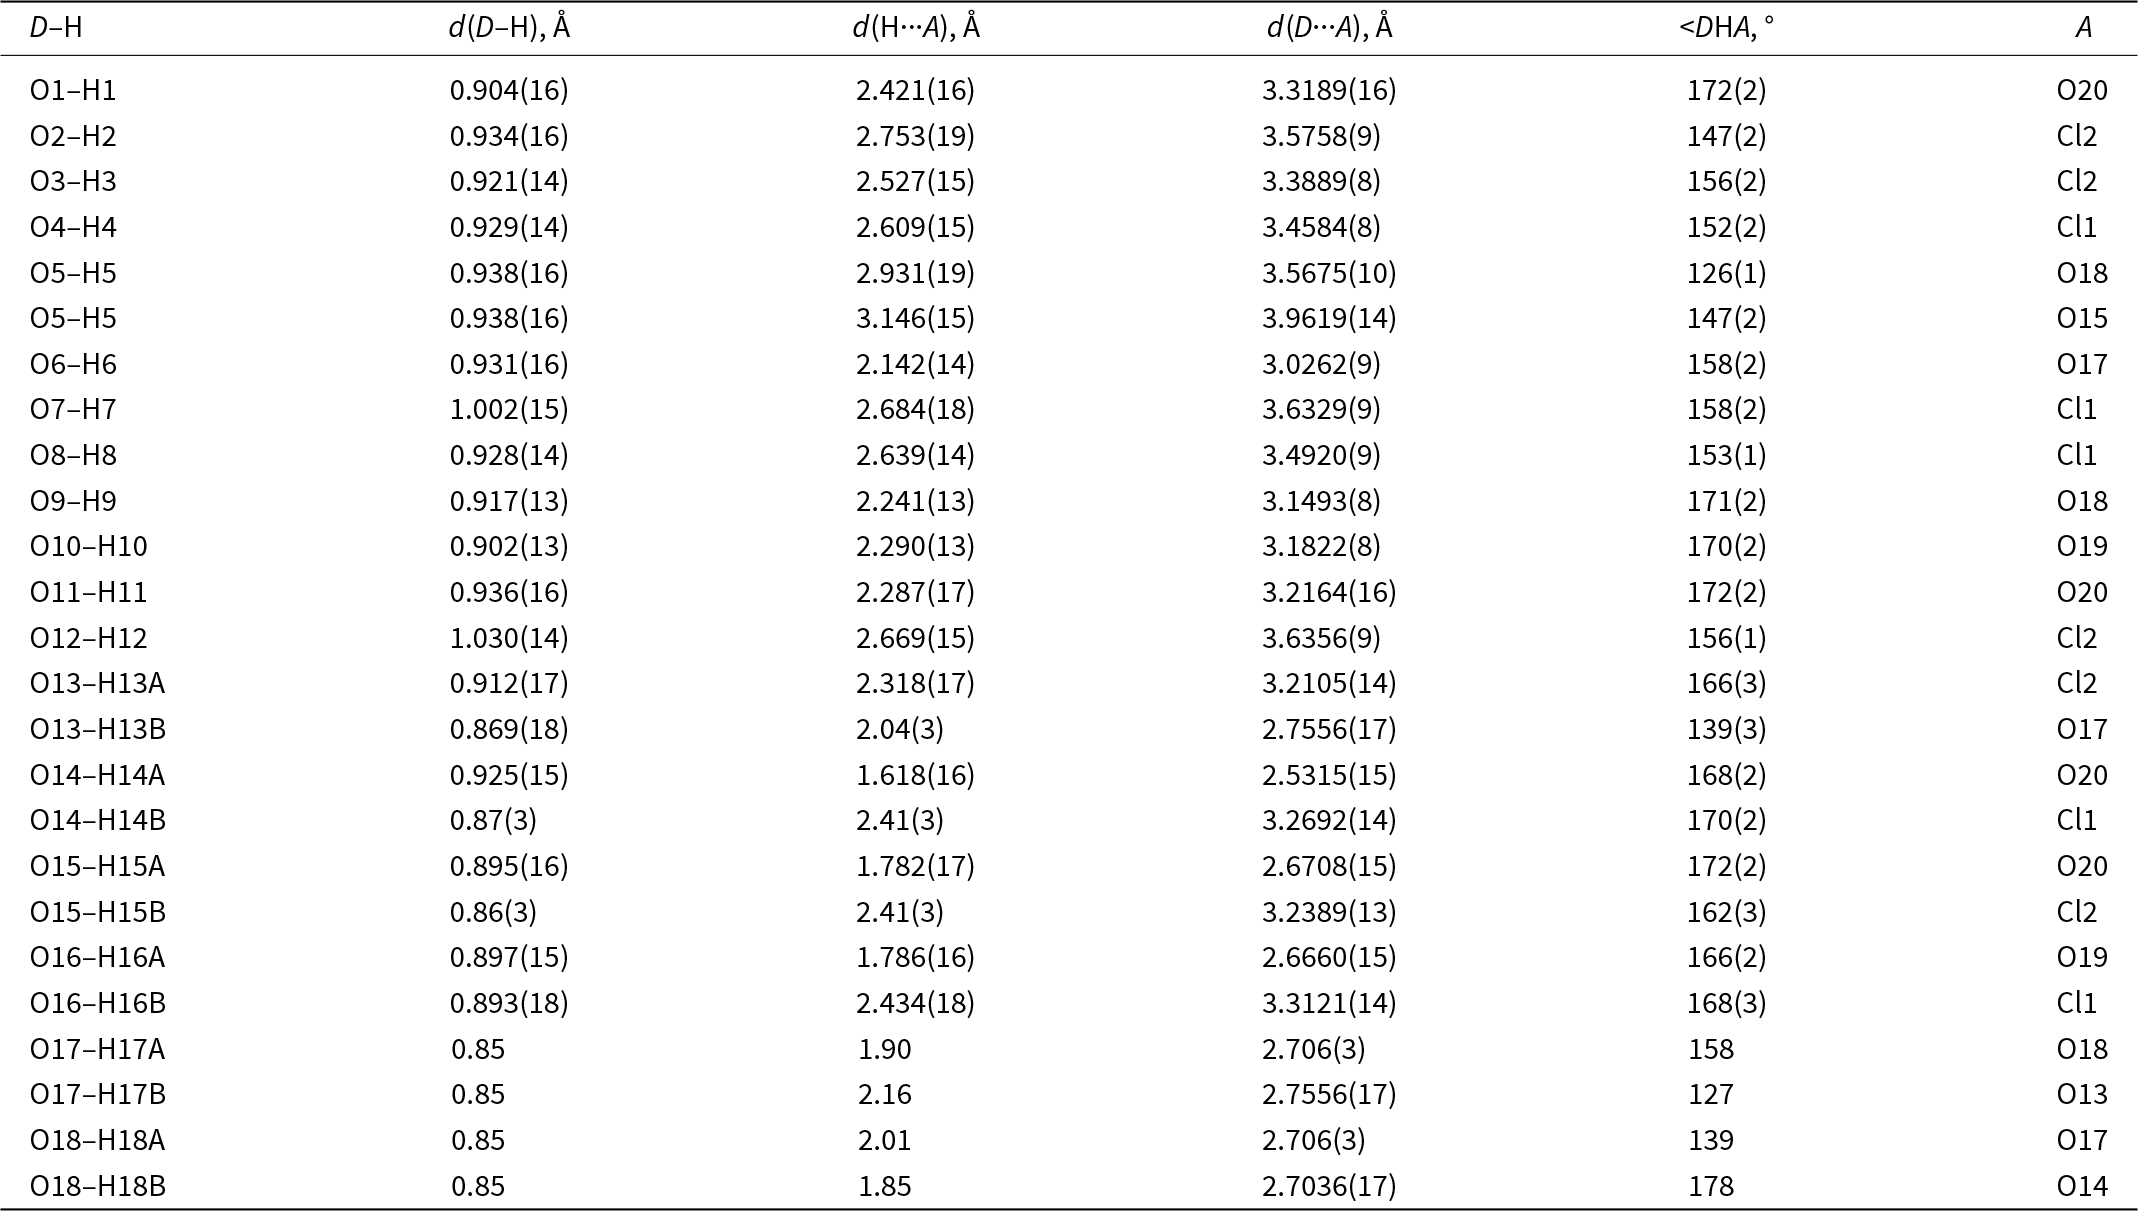
Table 7 Long description
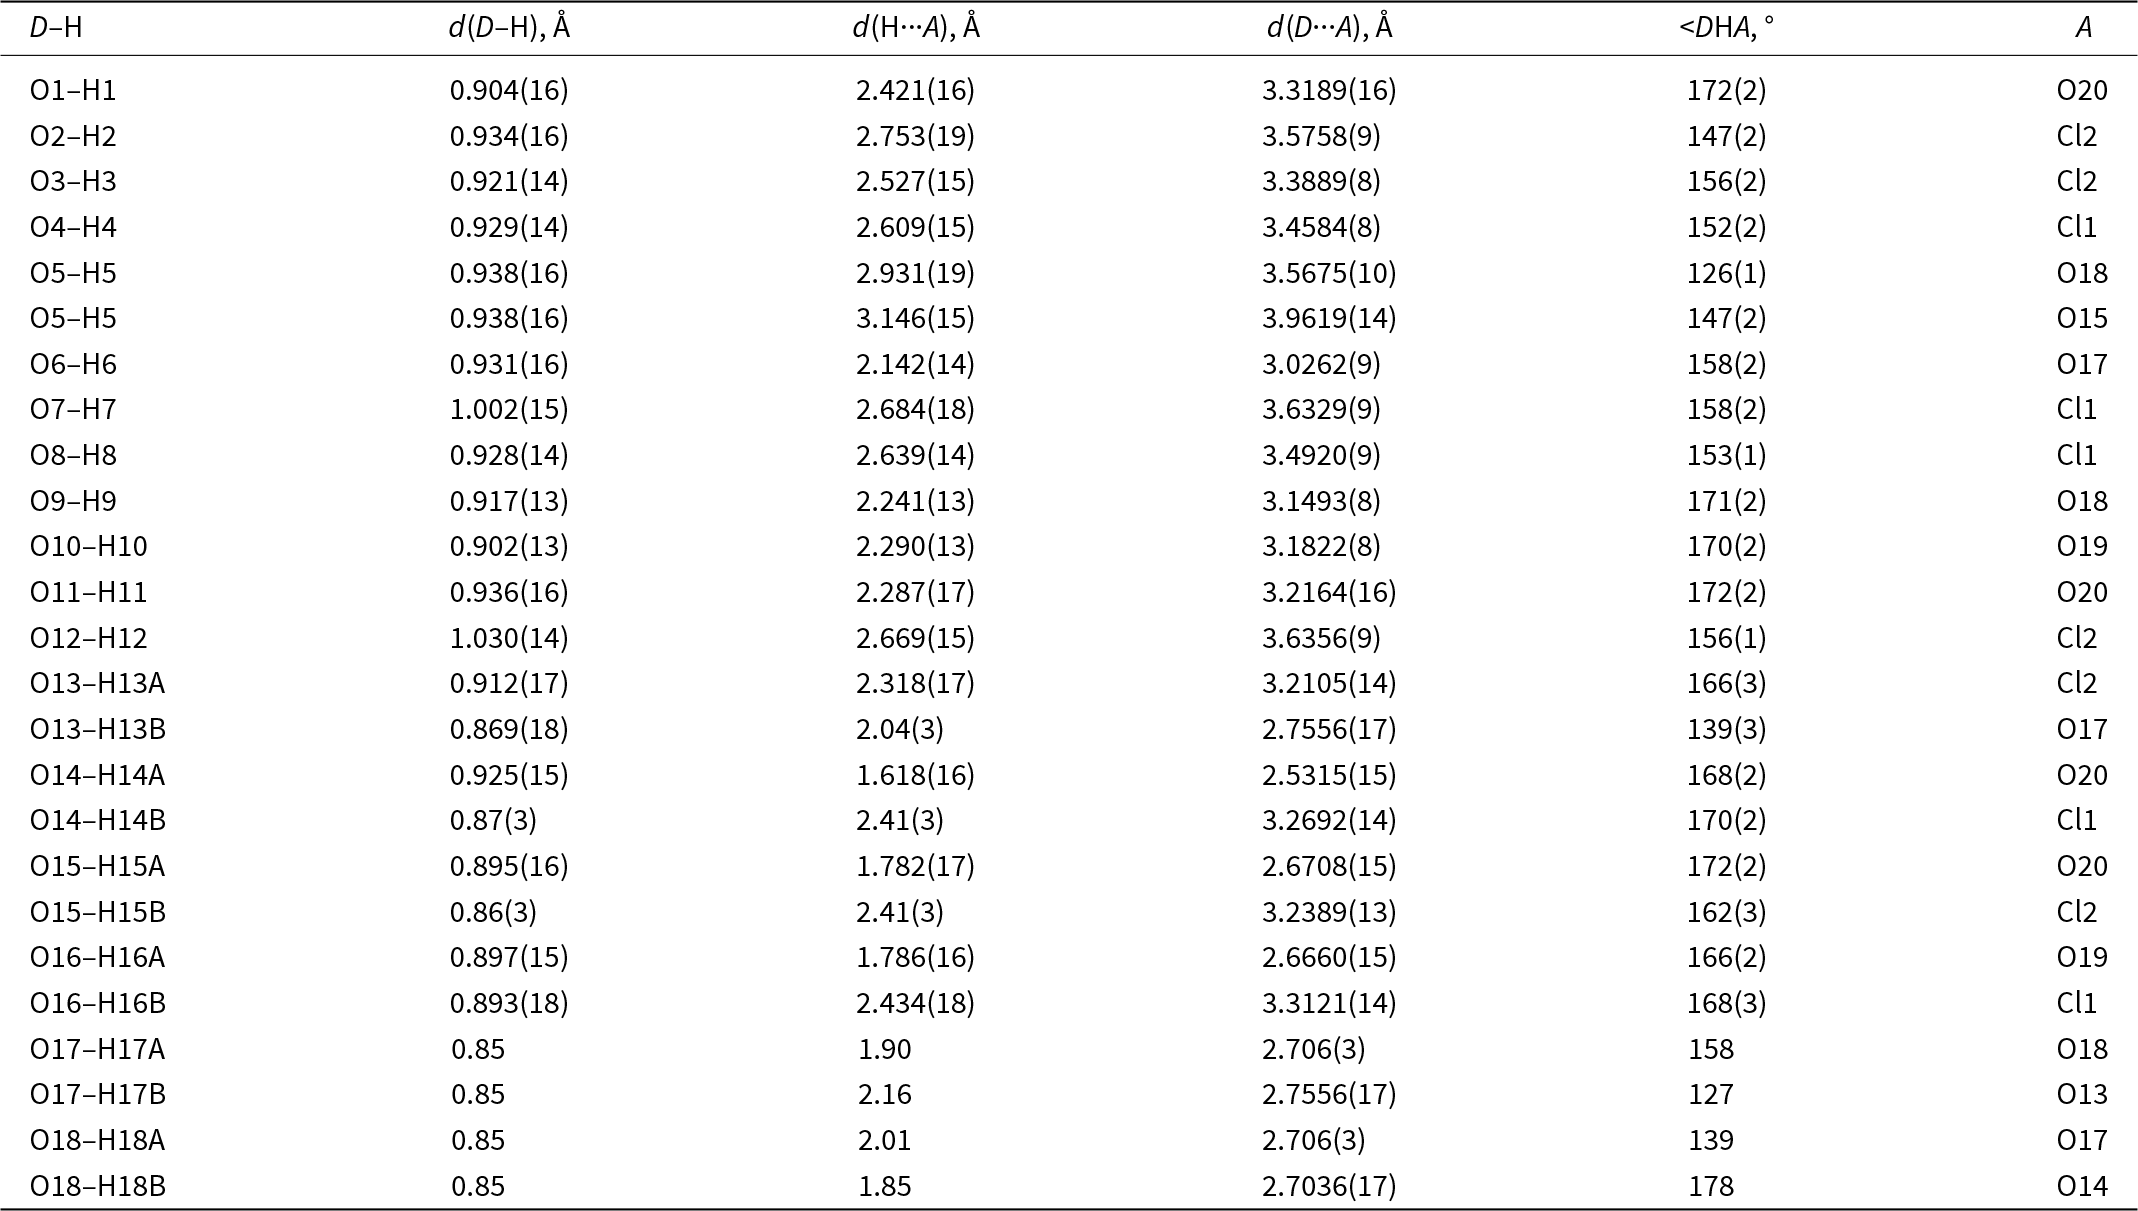
The table lists hydrogen-bond geometry for hydrocalumite, giving each donor oxygen and hydrogen pair, the donor to hydrogen distance, hydrogen to acceptor distance, donor to acceptor distance, the bond angle, and the acceptor atom identity. Hydrogen to acceptor distances span from 1.618 Å for O14–H14A to O20 up to 3.146 Å for one O5–H5 contact to O15, indicating a wide range from strong to weak interactions. The most linear interaction is O18–H18B to O14 with an angle of 178° and a short hydrogen to acceptor distance of 1.85 Å, consistent with a strong, well-aligned bond. Several other near-linear bonds to oxygen acceptors occur around 170 to 172 degrees, including O1–H1 to O20, O11–H11 to O20, and O15–H15A to O20. Contacts to chloride acceptors are generally longer and more bent, such as O5–H5 to O18 with a 126° angle and O17–H17B to O13 with a 127° angle, suggesting weaker hydrogen bonding. One donor, O5–H5, participates in two listed interactions, one to O18 and a longer one to O15, implying a bifurcated or competing contact. Values in parentheses indicate measurement uncertainty, and a few entries use fixed donor to hydrogen distances, so comparisons should consider differing precision.
Notes: D – donor, A – acceptor
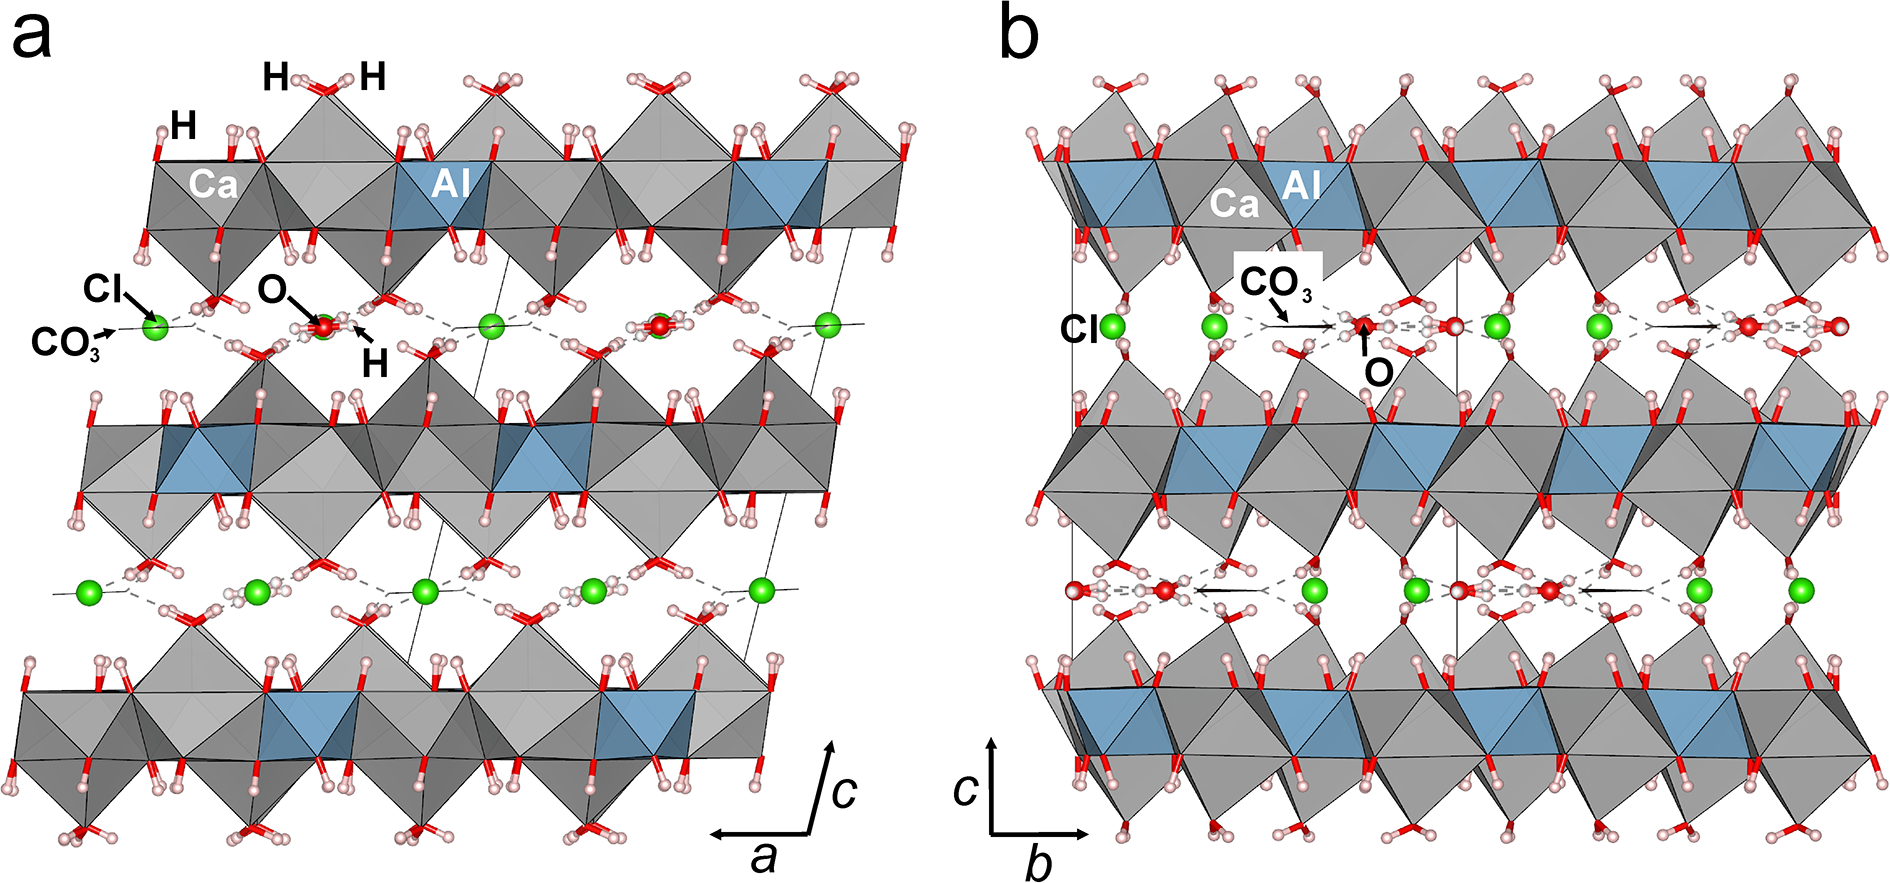
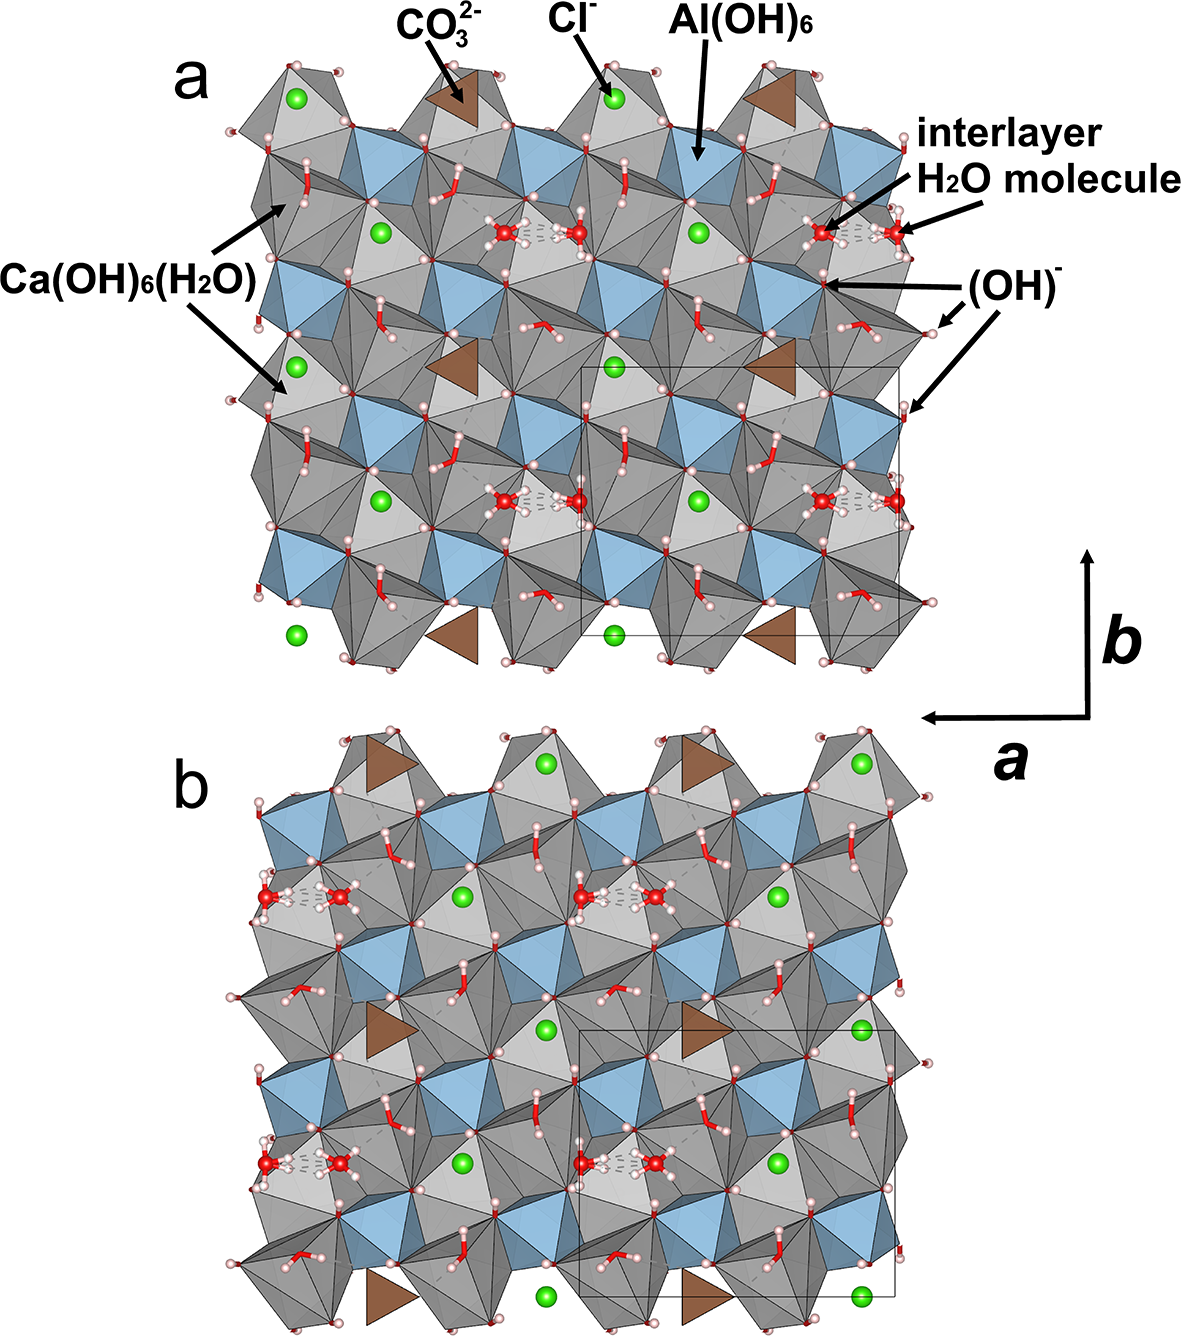
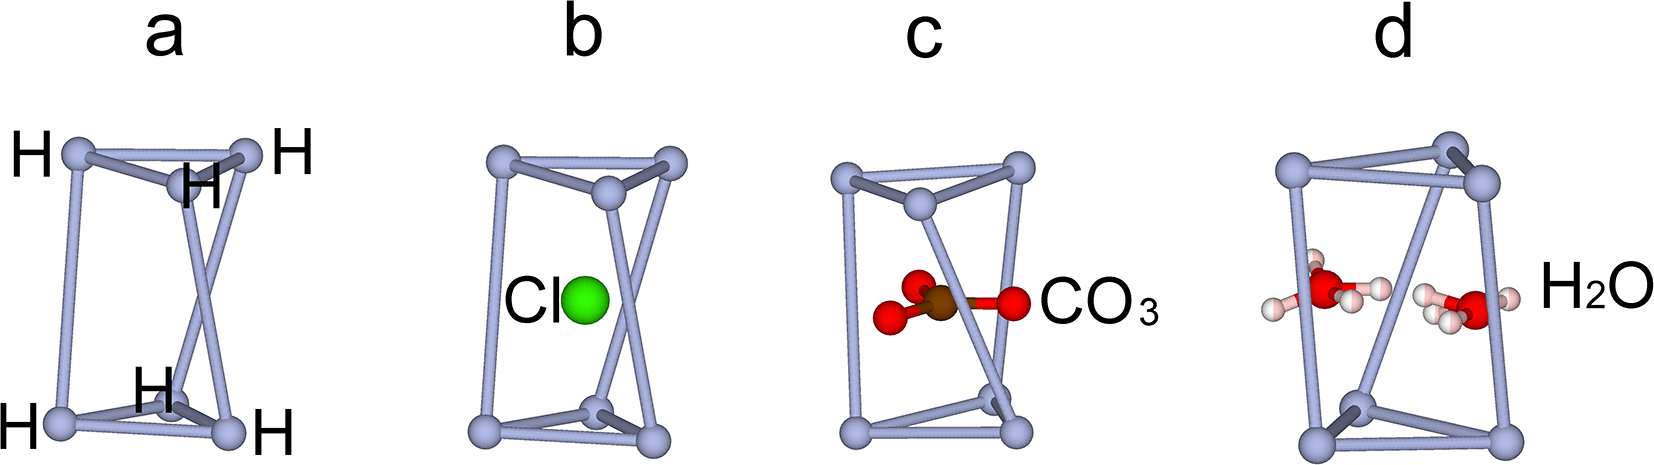
The crystal structure of hydrocalumite consists of alternating {Ca4Al2(OH)12(H2O)4}2+ layers and {Cl(CO3)0.5(H2O)}2– interlayers. The metal-hydroxide layers are stacked with the 2-layer periodicity (each second layer is translationally identical) (Fig. 4). The topology of the interlayer at z = ¼ and ¾ is identical; the same as the topology of the metal-hydroxide layers at z = ½ and 1 (Fig. 5). Each metal-hydroxide layer contains four symmetrically independent Ca sites with the average metal–oxygen distances of 2.416 (<Ca1–O>), 2.417 (<Ca2–O>), 2.424 (<Ca3–O>) and 2.426 Å (<Ca4–O>) [the average <Ca–O> bond length is 2.421 Å], and two symmetrically independent Al sites with <Al1–O> = 1.912 Å and <Al2–O> = 1.911 Å [the average <Al–O> distance is 1.9115 Å]. Each Ca site is coordinated by six (OH)– groups and one H2O molecule located at the interlayer level (Fig. 4). Each Al site is coordinated by six hydroxyl groups. Thus, the content of OH-groups and H2O molecules associated with Ca atoms is fixed by stoichiometry as 2 (OH) groups per 1 cation and 1 H2O group per 1 Ca. The interlayer space also contains (additional or extra) H2O molecules not bonded to Ca atoms. The occupancy of interlayer O atoms of H2O molecules gives 1.0 pfu of H2O molecules that is not associated with Ca atoms. The total H2O content is five molecules per six cations. The interlayer anions are: (i) Cl– (two sites) and (ii) (CO3)2– (one symmetrically independent group). The interlayer anions and H2O molecules are ordered (Fig. 5) with the Cl:CO3:H2O ratio equal to 1:0.5:1. Both (CO3)2– and Cl– anions are located in the centre (Fig. 6) of distorted octahedra (or twisted prism) built by upper and lower H atoms of (OH)– groups (Bookin and Drits, Reference Bookin and Drits1993). The H2O molecules are located at the middle of the distorted vertical faces of a twisted prism (Fig. 6). There is strong hydrogen bonding between H atoms of H2O molecules associated to Ca atoms and O atom of interlayer CO3 groups with H14A···O20 = 2.5315(15) Å (Table 7).
Crystal structure of hydrocalumite along stacking in the: (a) xz and (b) yz projections. The figure was visualized using Vesta (Momma and Izumi, Reference Momma and Izumi2011).
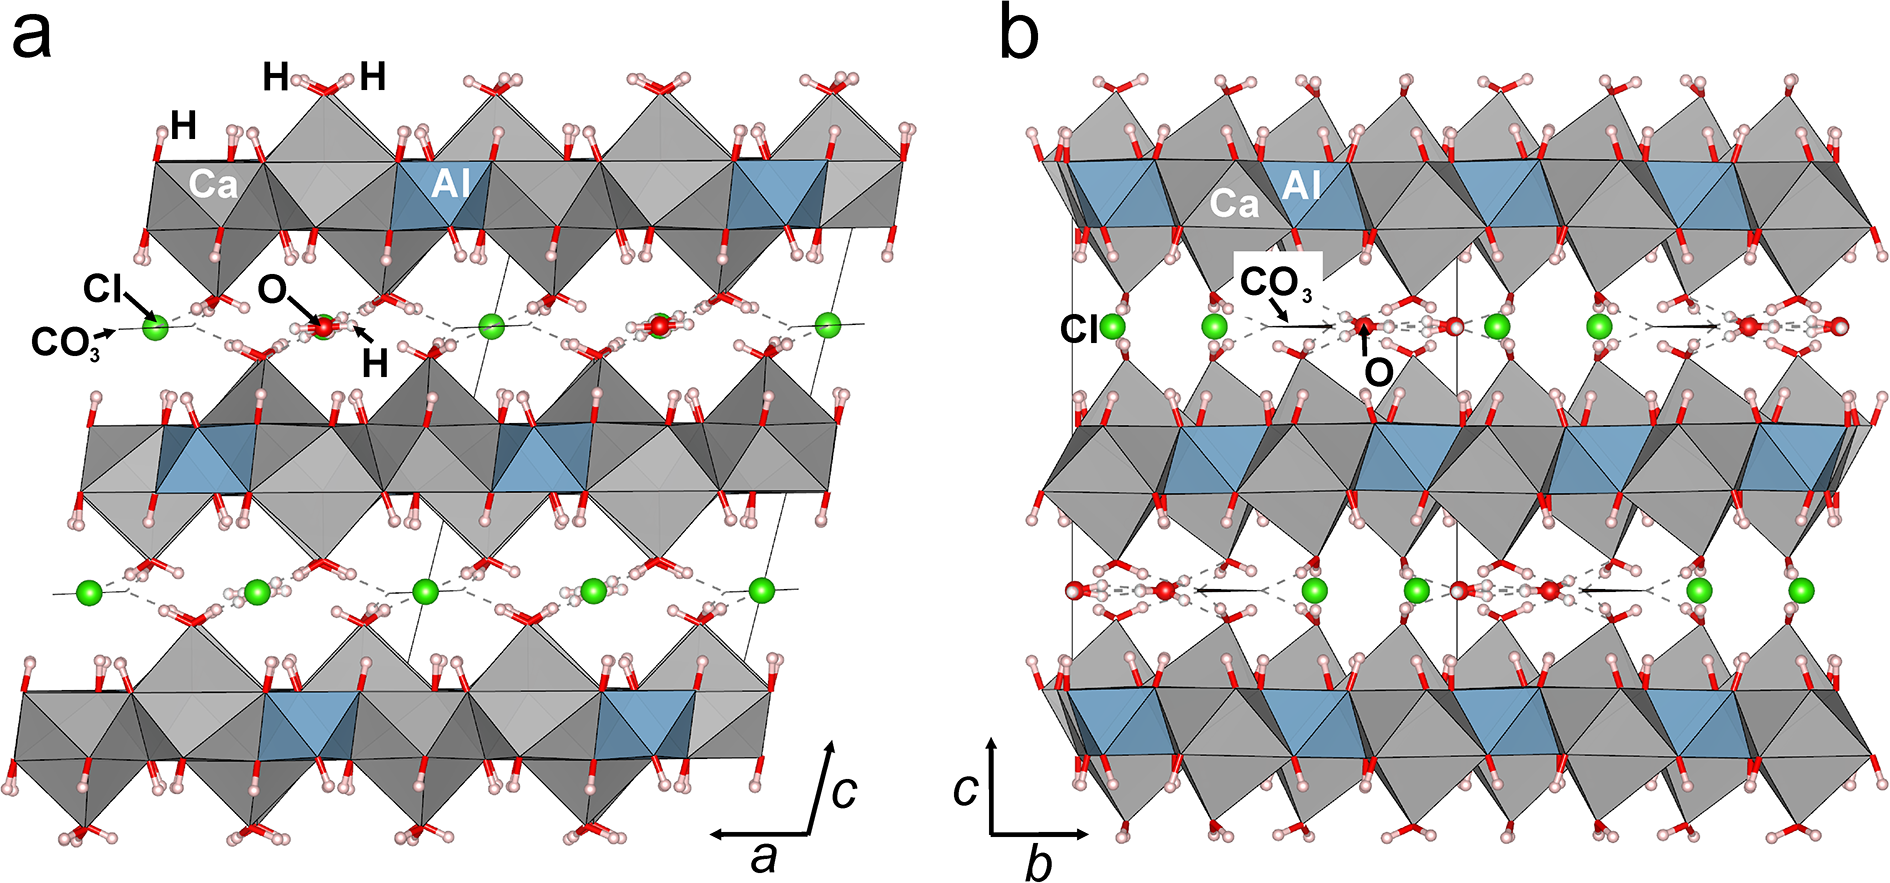
Figure 4 Long description
The image A shows the crystal structure of hydrocalumite in the a projection. It consists of alternating layers of metal-hydroxide and interlayers. The metal-hydroxide layers contain calcium and aluminum sites, labeled as Ca and Al, respectively. These layers are depicted as blue and gray polyhedra. The interlayers contain chloride and carbonate ions, labeled as Cl and CO3, along with oxygen and hydrogen atoms. The structure is arranged in a repeating pattern, with hydrogen atoms shown as small red spheres and oxygen atoms as larger red spheres. Chloride ions are represented by green spheres and carbonate ions are shown as black triangles. The diagram includes axes labeled a and c at the bottom right. The image B shows the crystal structure in the b projection, maintaining the same alternating layer pattern. The arrangement of calcium, aluminum, chloride and carbonate ions is consistent with the a projection, but the orientation is different, as indicated by the axes labeled b and c at the bottom right. Both images illustrate the periodic stacking and coordination of ions within the hydrocalumite structure.
Metal-hydroxide layers and interlayer is superimposed onto metal-hydroxide layer: (a) z = 0.7–1.1 and (b) z = 0.2–0.7. The structure of hydrocalumite is composed of metal-hydroxide layers built by Al(OH)6 octahedra (blue) and 7-coordinated Ca polyhedral Ca(OH)6H2O (grey). The interlayer molecules are superimposed onto the metal-hydroxide layer and are represented by carbonate group (brown), Cl‒ anions (green) and H2O molecules (O is red). See text for details. The figure was visualized using Vesta (Momma and Izumi, Reference Momma and Izumi2011).

Figure 5 Long description
The image consists of two diagrams labeled 'a' and 'b', illustrating the structure of hydrocalumite. In diagram 'a', the structure is composed of metal-hydroxide layers built by Al(OH) subscript six octahedra, shown in blue and seven-coordinated Ca polyhedral Ca(OH) subscript six(H subscript twoO), depicted in grey. The interlayer molecules are superimposed onto the metal-hydroxide layer and include carbonate groups, shown in brown, Cl anions, represented in green and H subscript twoO molecules, with O atoms in red. The labels indicate the positions of CO subscript three superscript two minus, Cl superscript minus, Al(OH) subscript six, interlayer H subscript twoO molecule and (OH) superscript minus. Diagram 'b' shows a similar arrangement with the same components, maintaining the periodicity and topology of the structure. The diagrams are oriented with axes labeled 'a' and 'b', indicating the crystallographic directions. The structure demonstrates the alternating layers and interlayer components characteristic of hydrocalumite.
The interlayer built by H atoms of upper and lower metal-hydroxide layers (in accord with approach of Bookin and Drits, Reference Bookin and Drits1993): (a) interlayer of O-type built by H atoms; (b) Cl atom; (c) CO3 group; and (d) H2O molecules.

Figure 6 Long description
This scientific diagram consists of four panels labeled a, b, c and d, each illustrating interlayer structures with different guest species within a prism-like framework. Panel a shows a structure built by H atoms, depicted as spheres connected to form a twisted prism. The H atoms are positioned at the vertices and along the edges. Panel b displays a similar prism with a Cl atom centrally located, represented by a green sphere. Panel c features a prism with a CO3 group, shown as red spheres and lines, centrally positioned within the structure. Panel d presents a prism with H2O molecules, depicted as red and white spheres, located at the midpoints of the side faces of the prism. Each panel maintains the same host framework while varying the guest species, highlighting how different interlayer species occupy the cavity of the prism-like structure. No units or scales are shown in the diagram, emphasizing the structural comparison rather than quantitative measurement. The diagram aims to compare the spatial arrangement and interaction of different guest species within the interlayer framework.
Powder X-ray diffraction
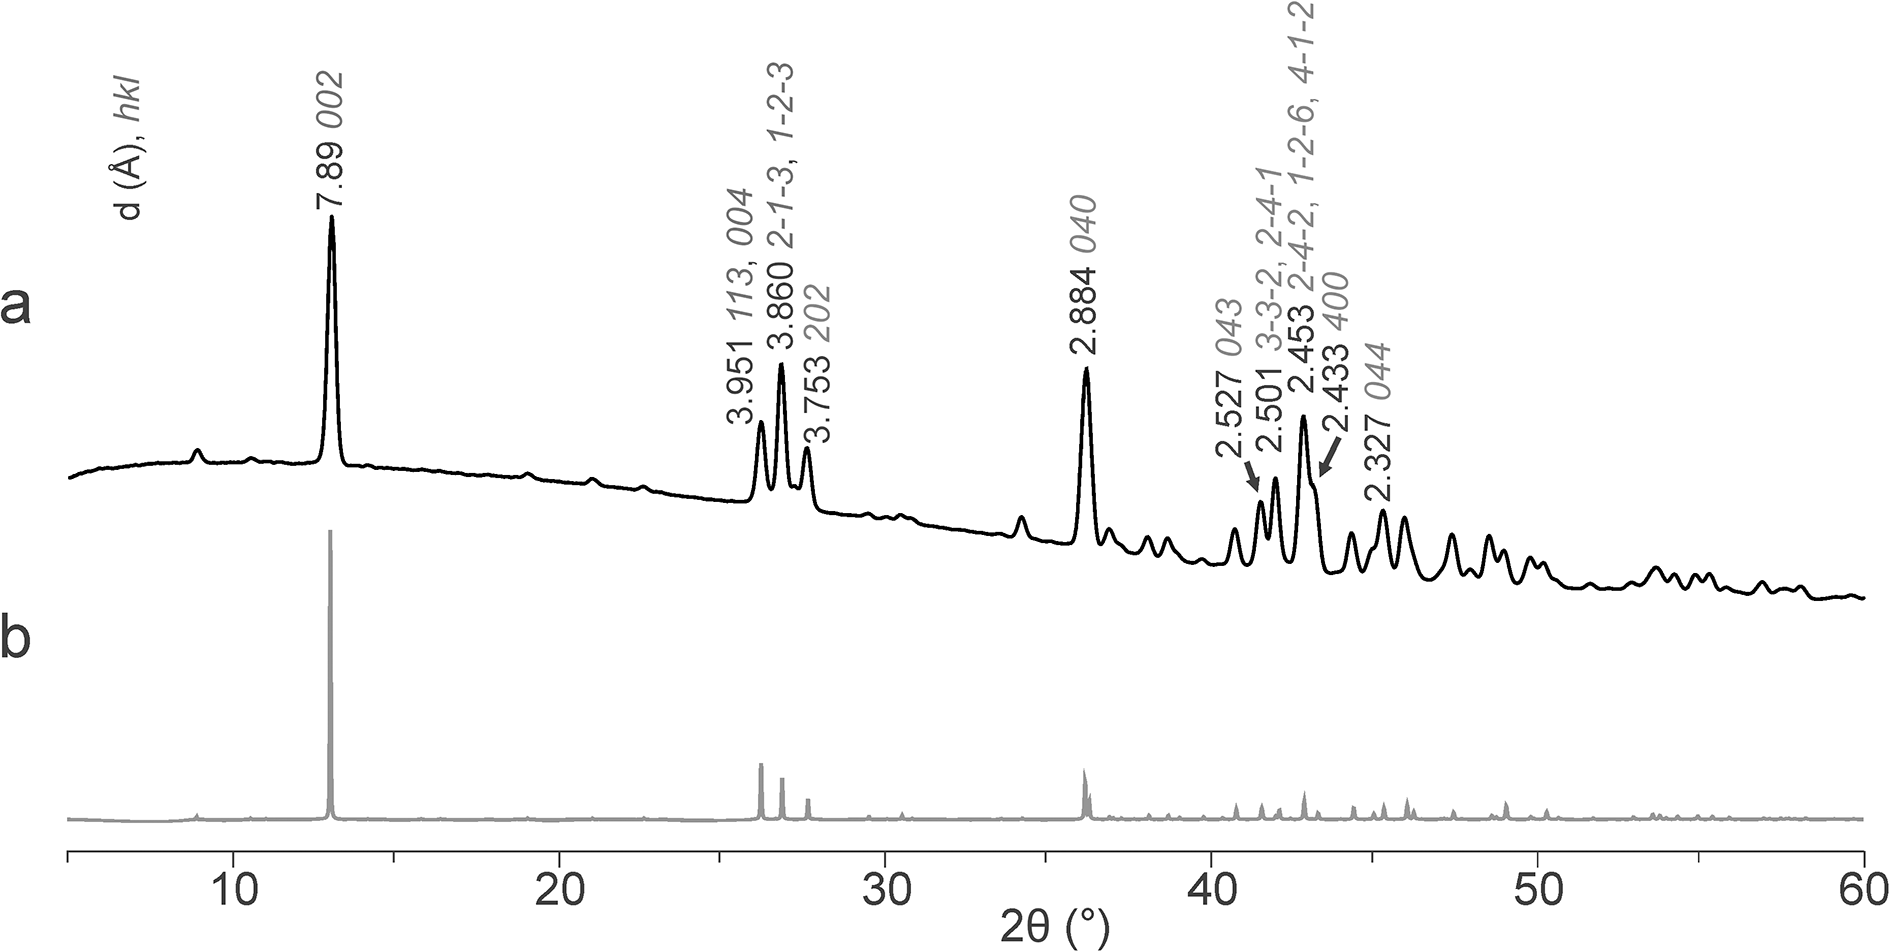
Powder X-ray diffraction data are given in Table 8, and the XRD pattern is presented in Fig. 7. The powder XRD data obtained in the present work are in a good agreement with those provided in the ICDD card # 01-078-2050 calculated on the basis of the crystal structure reported by Sacerdoti and Passaglia (Reference Sacerdoti and Passaglia1988) (Table 8). The unit-cell parameters of hydrocalumite refined from the powder XRD data are: a = 10.0433(12), b = 11.5337(11), c = 16.261(2) Å, β = 104.222(11)° and V = 1825.9(4) Å3 that is, in good agreement with those obtained by SC-XRD (Table 2).
Powder X-ray diffraction data for hydrocalumite

Table 8 Long description
Powder X-ray diffraction peak positions are listed as d-spacings in angstroms with relative intensities, comparing an ICDD reference card to measurements from this work; the measured peaks also include Miller indices h, k, and l. The dominant reflection matches exactly in both datasets at d 7.89 Å with 100 percent relative intensity and is indexed as 0 0 2. Other prominent measured peaks include d 2.884 Å at 73 percent (0 4 0), d 2.453 Å at 64 percent (2 −4 −2), d 3.860 Å at 59 percent (2 −1 −3), and d 3.951 Å at 34 percent (1 1 3). Several low-angle peaks appear only in the measured set, such as d 11.51 Å at 3 percent (0 1 0) and d 9.72 Å at 1 percent (1 0 0), indicating additional weak reflections beyond those reported in the reference list. Where both sources report the same reflections, d-spacings generally agree closely, while measured intensities are often higher than the reference for mid-range peaks, for example near 3.86 Å and 2.45 Å. The table contains many weak reflections at small d-spacings, with numerous intensities at only a few percent or below one percent, so minor differences may reflect detection limits, preferred orientation, or instrument and sample preparation effects. Miller indices are provided only for the measured dataset and some d-spacings correspond to multiple indexed reflections, indicating overlapping peaks.
Note: the ten strongest reflections are given in bold.
Powder X-ray diffraction patterns of hydrocalumite studied: (a) experimentally obtained and (b) calculated using crystal structure data reported in this work. Note: Pattern (b) was calculated using the Vesta program (Momma and Izumi, Reference Momma and Izumi2011).
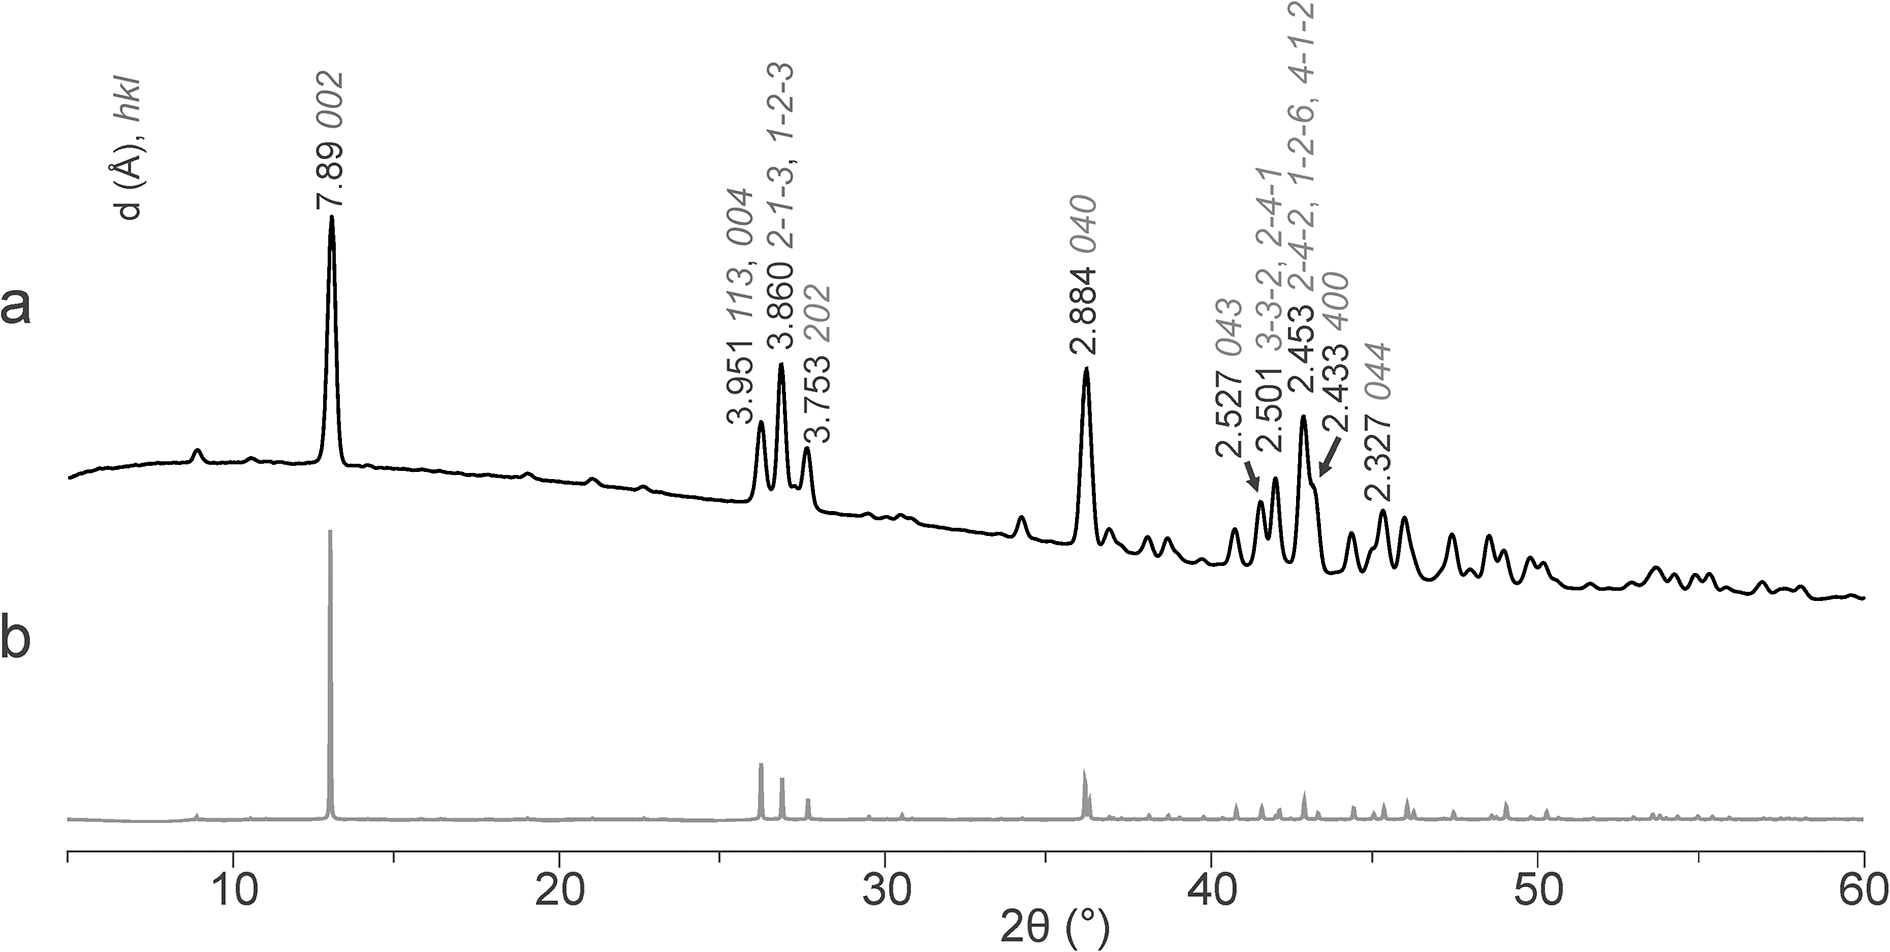
Figure 7 Long description
A line plot with the y-axis labeled “I (a.u.)” and the x-axis labeled “2θ (°)”. The x-axis runs from 0 to 60 with labeled ticks at 10, 20, 30, 40, 50 and 60.
Discussion
The hydrocalumite sample from Boisséjour studied in this work has the ideal chemical formula, Ca4Al2(OH)12Cl(CO3)0.5·5H2O, considering that 4 H2O groups are bonded to Ca2+, the formula of hydrocalumite may be given as Ca4Al2(OH)12(H2O)4Cl(CO3)0.5·H2O, and it crystallizes as the 2M polytype. The interlayer species, i.e., Cl–, (CO3)2– and (H2O)0, are ordered, which means that both chloride and carbonate anions can be considered as species-defining constituents. The anion ordering results in the unit-cell doubling along the b axis. Interestingly, hydrocalumite from Boisséjour is chemically and structurally identical to hydrocalumite from Montalto di Castro, Viterbo, Italy, described by Sacerdoti and Passaglia (Reference Sacerdoti and Passaglia1988) and Passaglia and Sacerdoti (Reference Passaglia and Sacerdoti1988). In general, the presence of several interlayer species-defining anions is not typical for natural LDHs. For example, a clear boundary has been observed between the CO3- and Cl,OH-dominant species within the stichtite–iowaite–pyroaurite–woodallite solid-solution system from the Terektinsky Range, Gorny Altai, Russia (Zhitova et al., Reference Zhitova, Pekov, Chukanov, Yapaskurt and Bocharov2020). The ordering of interlayer anions observed in natural and synthetic Ca-Al compounds by us and other authors (see Tables 1 and 9) suggests that, in addition to purely CO3-, Cl- and OH-dominant ‘hydrocalumites’, other members may exist with the simplified formulae Ca4Al2(OH)12Cl(CO3)0.5·nH2O (described here), Ca4Al2(OH)12(OH)(CO3)0.5·nH2O and Ca4Al2(OH)12Cl(OH)·nH2O.
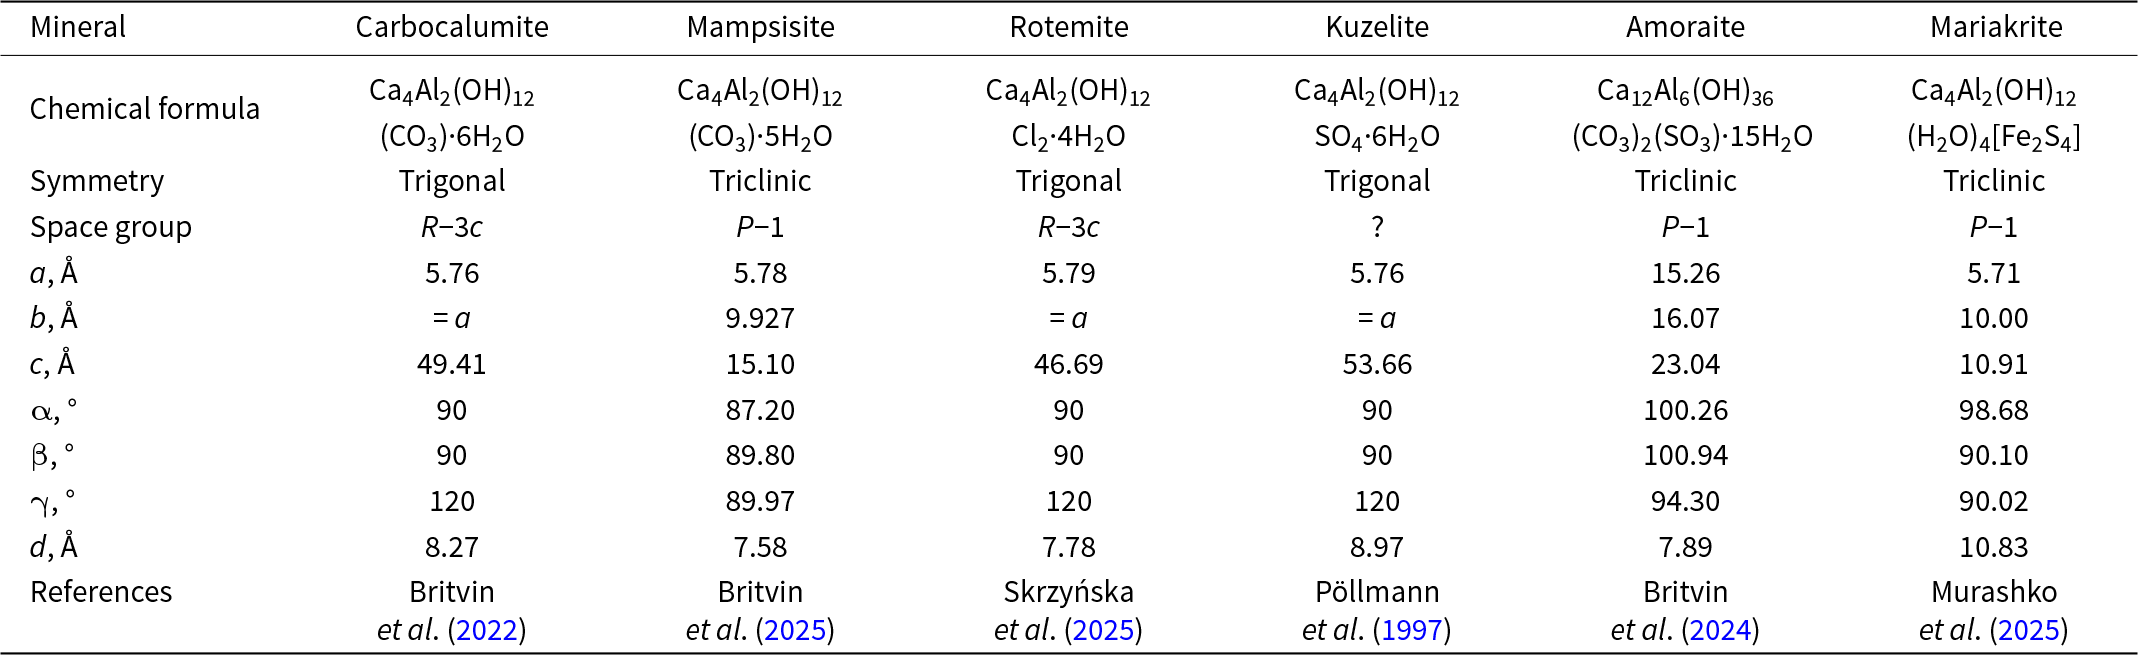
Hydrocalumite-group members(a), except hydrocalumite (which is given in Table 1)
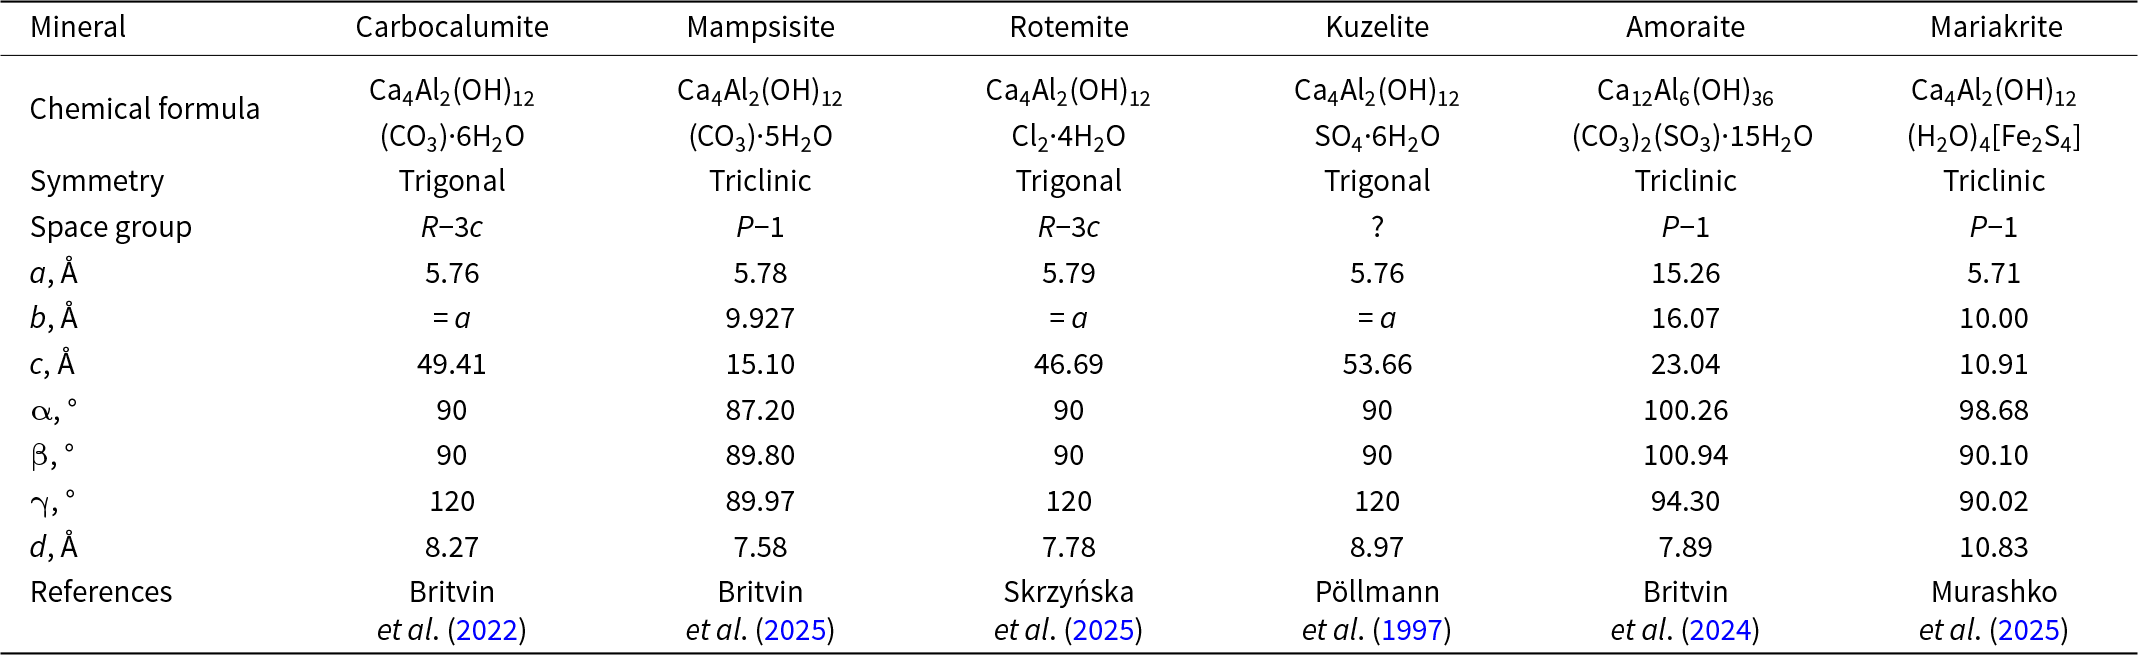
Table 9 Long description
The table compares six hydrocalumite-group minerals by composition, crystallographic symmetry, unit-cell parameters, interlayer spacing, and literature source. Carbocalumite, Mampsisite, Rotemite, Kuzelite, and Mariakrite have the same calcium–aluminum hydroxide layer composition, while Amoraite has a larger layer composition and additional interlayer components. Symmetry varies: Carbocalumite, Rotemite, and Kuzelite are trigonal, whereas Mampsisite, Amoraite, and Mariakrite are triclinic. Space groups are R minus 3 c for Carbocalumite and Rotemite, P minus 1 for Mampsisite, Amoraite, and Mariakrite, and the space group for Kuzelite is not reported. Unit-cell a is about 5.7 to 5.8 angstroms for all except Amoraite, which is much larger at about 15.3 angstroms; similarly, b is about 9.9 to 10.0 angstroms for the triclinic small-cell minerals but about 16.1 angstroms for Amoraite. The c dimension ranges from about 10.9 angstroms in Mariakrite to about 53.7 angstroms in Kuzelite, indicating large differences in stacking repeat along c. Interlayer spacing d ranges from about 7.6 to 9.0 angstroms for most minerals, but Mariakrite is higher at about 10.8 angstroms. Comparisons should be read with caution because the minerals differ in interlayer species and hydration, and one entry has an unknown space group.
Notes: (a) among Ca-Al LDH pöllmannite, Ca6Al3(OH)18[Na(H2O)6](SO4)2×6H2O, (Britvin et al., Reference Britvin, Murashko, Vapnik, Krzhizhanovskaya, Vlasenko and Vereshchagin2022) is not mentioned because it has strong structural resemblance to wermlandite-group minerals due to the presence of interlayer cations in addition to anions.
One of the main problems for hydrocalumite and its chemistry is that in the first description (Tilley, Reference Tilley1934) only a small carbonate content was identified. Based on this, the formula of the original hydrocalumite could be written as Ca4Al2(OH)12(OH)1.56(CO3)0.22·4.76H2O (Mills et al., Reference Mills, Christy, Génin, Kameda and Colombo2012). It should be possible to distinguish between the Ca-Al LDHs with different anionic interlayer content by analysing their unit cell parameters, in particular, the interlayer distances (d) (see values in Tables 1 and 9). The d-value (or d 00n) for the type material is 7.83 Å (Tilley, Reference Tilley1934). Hydrocalumite with a mixed chlorine–carbonate interlayer such as that studied in this work and previously (Sacerdoti and Passaglia, Reference Sacerdoti and Passaglia1988; Passaglia and Sacerdoti, Reference Passaglia and Sacerdoti1988) has d = 7.88–7.89 Å, but chemically close synthetic material is reported with d = 7.79 Å (Table 1). Chlorine-dominant members are reported with the d-values within the range of 7.78–7.83 Å. Therefore, the currently available data differ from each other; only a few structural studies have been carried out for the Ca-Al minerals with CO32–, Cl– and OH– anions, which do not allow us to correctly describe specific interlayer contents. It is worth noting that the situation with end-members is even more complex because mineral species with close chemistry may correspond to different minerals as shown recently by the example of carbocalumite, Ca4Al2(OH)12(CO3)·6H2O (Britvin et al., Reference Britvin, Murashko, Vapnik, Krzhizhanovskaya, Vlasenko and Vereshchagin2022), and mampsisite, Ca4Al2(OH)12(CO3)·5H2O (Britvin et al., Reference Britvin, Murashko, Vlasenko, Vereshchagin, Bocharov and Vapnik2025) (Table 9), which differ slightly in their H2O content.
The chemical data on synthetic hydrocalumite-related materials also show the stable composition Ca4Al2(OH)12Cl(CO3)0.5·nH2O (as for our natural sample) known as chloro-carboaluminate (Table 1; Runčevski et al., Reference Runčevski, Dinnebier, Magdysyuk and Pöllmann2012) that crystallizes in the 6R polytype structure. The studies of synthetic materials such as Friedel’s salt indicate that the 2M polytype is metastable at room conditions, whereas the 6R polytype is stable, and that the phase transition between them occurs at 35°C (Runčevski et al., Reference Runčevski, Dinnebier, Magdysyuk and Pöllmann2012). The analysis of polytype diversity of synthetic Ca-Al LDHs (Table 1) shows that they crystallize in the 6R polytype structure. Of the hydrocalumite-group minerals, carbocalumite, rotemite and kuzelite are 6R polytypes (see references in Table 9) and mampsisite, amoraite and mariakrite are triclinic (Table 9). Thus, the 6R polytype is the most widespread polytype among both synthetic and natural Ca-Al LDHs.
The study demonstrates the species-defining role of two distinct anions in a single mineral species, thereby expanding the number of possible new mineral species to at least five (excluding hydrocalumite). The main questions that remain are the chemical nature of the holotype hydrocalumite and the existence of the remaining five or more compositions as separate mineral species. More systematic studies on hydrocalumites from various localities are needed to resolve these issues.
Acknowledgements
This research was funded by the Russian Science Foundation (project no. 22-77-10036-P for ESZ, AAZ, RMS, ANK and EKS). Technical support of the St. Petersburg State University Resource Centres “X-ray diffraction research methods” and “Geomodel” is carried out within the framework of SPbSU, grants No. 125021702335-5 and 124032000029-9, for both Resource Centres, respectively. We would like to thank electron probe microanalysis analyst Sharapat Kudayeva (IVS FEB RAS). We thank Uwe Kolitsch, an anonymous reviewer and the Structures Editor for their comments and Associate Editor Irina Galuskina and Principal Editor Stuart Mills for the manuscript handling.This article is published in a special issue celebrating the 150th anniversary of the Mineralogical Society of the UK and Ireland. We heartily congratulate the Society on this milestone anniversary and wish it continued prosperity. We would also like to thank the Society journal, Mineralogical Magazine, for its leading role in mineralogical literature that served well so many mineralogists, including the authors of the current paper.
Supplementary material
The supplementary material for this article can be found at https://doi.org/10.1180/mgm.2026.10207.
Competing interests
The authors declare none.