1.0 INTRODUCTION
1.1 Background
The idea of controlling the flow over aerodynamic geometries by active means such as blowing and suction has been around for almost 90 years(Reference Prandtl1). The obvious motivation to use active flow control is rooted in the assumption that active means can improve aerodynamic performance beyond the limits of an optimised geometric shape. In modern aircraft these limits are usually associated with flow separation. Flow separations generate pressure drag and lift losses, and usually unwanted nonlinear behaviours of aircraft forces and moments. Generally, performance of aircraft is improved by increasing the achievable lift and lowering the drag. But active means of flow control require additional systems and additional power on board and this appears as a strong barrier against design decisions to use active flow control in commercial aircraft.
The introduction of jet engines during the 1940s and 1950s presented a rather efficient source of pressurised air on board the aircraft. This motivated intense research on flow control by blowing(Reference Lachmann2,Reference Schlichting3) . Impressive lift gains were reported, but the blowing power to obtain these gains was generally rather high. This prevented the use on commercial aircraft, the designs of which enjoyed a steady increase of knowledge on mechanical high-lift devices at the wing leading and trailing edges. Note, that high-quality wind-tunnel experiments on active high lift are rather costly and special technical difficulties exist in measuring force data. This means that design sensitivities were often not accessible to researchers and this slowed down scientific progress. The use of active flow control on aircraft was therefore restricted to research aircraft, specialised aircraft, and a few military applications that were driven by specific performance demands of the customer.
This general picture of research in active flow control for aircraft has been changing over the last 20 years. Researchers can now obtain design sensitivities by using numerical flow simulations. The cost of these simulations is much lower than needed for experiments and the complete flow field data allows extracting flow phenomena responsible for performance changes. Also, new optical experimental methods were introduced that measure flow field data non-intrusively in planes and volumes. These methodological advances enabled significant knowledge increase in active flow control and the research area developed into a rich field with a broad range of conceptual approaches(Reference Gad el Hak4,Reference Brunton and Noack5) .
One of these approaches is flow control by steady blowing. Steady blowing is conceptually simple since it does not involve the complexity of moving parts or high-frequency valves. It merely needs a reliable source of pressurised air on board the aircraft. One may argue that the use of steady blowing cannot take advantage of all possible means to introduce artificial strain rates into the flow and that it excludes part of the potentials offered by exciting natural instabilities of the flow field and those offered by closed-loop control. On the other hand, knowing the potentials and sensitivities of steady blowing serves as a valuable reference solution sought before introducing technically more complex control alternatives. The present paper will therefore present a thorough review on recent research results in applications of steady blowing on the wings of commercial aircraft with large aspect ratio. The active control of the wing flow aims to extend the maximum achievable lift coefficient and the useful angle-of-attack range, as an improvement of existing mechanical high-lift devices or even replacements of these.
The stall of large-aspect-ratio wings at large angles of attack is usually caused by the response of the turbulent boundary layer to an adverse pressure gradient. The momentum loss in the boundary layer close to the wall results in reverse flow if the pressure gradient is large enough, as for high angles of incidence. Such boundary-layer separation often begins at the trailing edge, and this causes an unfavourable change of the Kutta condition, thereby reducing wing circulation and limiting its maximum. In other cases, local suction peaks at the wing leading edge are large enough to cause turbulent boundary-layer separation, which leads to premature leading-edge stall. This is typical for wings that use deflected high-lift flaps at the trailing edge to increase maximum lift. Another particular flow separation is observed as the result of the local suction peak generated by a deflected flap meant to improve flow turning and hence, wing lift.
These flow separations due to adverse pressure gradients can be suppressed by increasing the flow momentum close to the wall. With active blowing there exist three general paths to obtain this objective. The first and most obvious is to increase flow momentum directly by inserting a high-velocity tangential airstream close to the surface. The second is to improve turbulent mixing normal to the surface, so that parts of the boundary layer with high momentum feed areas with too little momentum. The third path is to redistribute the momentum distribution of the boundary layer by special means of convective transport. It appears that two strategies of active flow control use these paths effectively:
1. Tangential blowing of thin wall jets allows one to overcome the adverse pressure gradients from locally very large flow turning rates. This is a natural design choice to be applied at the suction side of a strongly defected flap or even a rounded trailing edge as sketched in Fig. 1. Tangential blowing is designed to exploit the potentials of the Coanda effect by taking advantage of both paths 1 and 2 described above.
2. Oblique blowing of air jets designed to generate longitudinal vortices in the boundary layer. The longitudinal vortices provide convective redistribution of momentum in the boundary layer, and they also enhance turbulent mixing. This approach follows the described paths 2 and 3.
Blowing of wall jets to obtain locally high flow turning.
The present paper will discuss the design sensitivities of these two flow control approaches and present typical application scenarios in lift augmentation of transport aircraft.
1.2 Flow parameters and performance factors
An important requirement for applications to commercial aircraft calls for low blowing effort associated with active flow control, as otherwise a significant engine growth occurs compared to using conventional high-lift systems. Active blowing may be characterised by several non-dimensional parameters, each describing a certain aspect of its technical realisation. The mass flow needed to supply the blowing device is described by the parameter
 $$\begin{equation}
{C_{\dot m}} = \frac{{{{\dot m}_j}}}{{{\rho _\infty }{v_\infty }{S_{ref}}}}
\end{equation}$$
$$\begin{equation}
{C_{\dot m}} = \frac{{{{\dot m}_j}}}{{{\rho _\infty }{v_\infty }{S_{ref}}}}
\end{equation}$$
where  ${\dot m_j}$ denotes the mass flow of the active jet, and ρ∞, v ∞are flow density and velocity at free stream conditions. Srefis the wing reference area. A change of the mass flow would relate to the size of a compressor, installed in the wing to provide pressurised air for blowing. The mass-flow coefficient is closely related to the velocity ratio of jet to external flow close to the jet exit,
 $$\begin{equation}
\lambda = {v_j}/{v_a}.
\end{equation}$$
$$\begin{equation}
\lambda = {v_j}/{v_a}.
\end{equation}$$
This velocity ratio governs the production of turbulence in the jet shear layer and hence, may be regarded as representative for turbulent mixing. An important parameter to characterise a device for manipulating flow momentum in the boundary layer is the momentum coefficient,
 $$\begin{equation}
{{C_\mu } = \frac{{{v_j}{{\dot m}_j}\, + ({p_j} - {p_a}){A_j}}}{{1/2{\rho _\infty }v_\infty ^{\rm{2}}{S_{ref}}}}}.
\end{equation}$$
$$\begin{equation}
{{C_\mu } = \frac{{{v_j}{{\dot m}_j}\, + ({p_j} - {p_a}){A_j}}}{{1/2{\rho _\infty }v_\infty ^{\rm{2}}{S_{ref}}}}}.
\end{equation}$$
The second term of the numerator in Equation (3) takes the pressure difference between the value in blowing slot and the external flow into account. Note that this term is only active for blowing by an under-expanded jet as otherwise the pressure difference can be neglected. Using this normalisation, the effort to provide blowing may be understood as an additional drag coefficient. This interpretation of the momentum coefficient is obvious for applications where high-pressure air for blowing is provided by bleed from the jet engine low-pressure compressor and hence, a loss of engine thrust in the order of the jet momentum of the blowing device is expected. Furthermore, the momentum coefficient is closely related to the pressure ratio, p t, j/pa, needed for operating the blowing device, at a given aircraft free stream Mach number. The required pressure ratio determines the type of compressor i.e. axial versus radial compressor.
Finally, the mechanical power needed for active blowing is important. For applications in fast-flying commercial aircraft one needs to consider the thermodynamic change of state when a compressor is applied to the external flow stream taken from a location close to the jet exit. We apply the definition:
 $$\begin{equation}
{C_{Power}} = \frac{{{E_j}{{\dot m}_j} - {E_a}{{\dot m}_a} + {p_j}{v_j}{A_j} - {p_a}{v_a}{A_a}}}{{1/2{\rho _\infty }v_\infty ^3{S_{ref}}}}
\end{equation}$$
$$\begin{equation}
{C_{Power}} = \frac{{{E_j}{{\dot m}_j} - {E_a}{{\dot m}_a} + {p_j}{v_j}{A_j} - {p_a}{v_a}{A_a}}}{{1/2{\rho _\infty }v_\infty ^3{S_{ref}}}}
\end{equation}$$
where E = cvT + 1/2v 2 is the specific total energy of the fluid and the differences between the flow states (j) and (a) represent the thermodynamic flow change over an ideal compressor located in a virtual stream tube that connects the inflow from the external stream to the jet orifice. Hence, the power coefficient is closely related to the electrical power needed to operate an ideal compressor for active blowing. The electrical power would come from a generator attached to the aero engine. Note that realisation of this approach involves three additional efficiency factors for energy conversion: the efficiencies of the generator, the electrical motor, and the compressor, in addition to the weight of these subsystems. These effects are not represented in Equation (4).
The aerodynamic gains from using active flow control are represented by a so-called lift-gain-factor (LGF). Since lift is a force it appears straightforward to normalise improvements in lift by the aerodynamic momentum invested into the device. As a reference for measuring the lift gain, we use a reference configuration without blowing,
 $$\begin{equation}
LGF = \frac{{{C_{L\max }} - {C_{L\max ,\,reference}}}}{{{C_\mu }}}
\end{equation}$$
$$\begin{equation}
LGF = \frac{{{C_{L\max }} - {C_{L\max ,\,reference}}}}{{{C_\mu }}}
\end{equation}$$
This means that the reference will change from application to application since active flow control is applicable to different configurations with various leading-edge and trailing-edge devices. For meaningful comparisons of obtained LGF values, it is important to use a suited configuration as reference, where the non-blowing case represents a fair lift coefficient that can be obtained without blowing. Details of these references will be given in the results sections of the paper.
Similarly important as lift gains are in many cases increased stall angles of incidence. Hence, the present paper will also report on recent progress to extend the useful incidence range of high-lift wings. It will turn out that large sensitivities are found and careful aerodynamic design to active flow control appears necessary in order to achieve solutions viable for aircraft flight.
2.0 TANGENTIAL BLOWING
2.1 Introduction
Tangential blowing is a long known approach to suppress or delay flow separation. A particularly large effect on lifting wings is obtained, if blowing is used to affect the flow at or close to the trailing edge, because lift is determined by the so-called Kutta condition. This application of tangential blowing is often called circulation control. The application on blunt trailing edges, as seen in Fig. 1, is appealing because of its simplicity. This was investigated from the 1960s on(Reference Davidson6) and a review on this work is given by Englar(Reference Englar, Joslin and Jones7). The work identified target regions for the geometrical parameters of effective blowing, which are the slot height and the radius of curvature versus the chord length. High blowing effectiveness is obtained by taking advantage of the Coanda effect. The tangential jet flow over the curved trailing edge remains attached to the surface because of the ability to entrain air from the surrounding flow. Then, low pressures are observed at the curved surface due to the balance of centrifugal and pressure forces across the curved flow stream, while viscous and turbulent diffusion downstream from the blowing slot continuously diminish excess velocities of the wall jet. Eventually, flow separation occurs in the region of pressure recovery. This determines the effective Kutta condition and hence, circulation. Unfortunately, aerofoils with blunt trailing edges have large drag without blowing and this precludes applications in commercial transport aircraft. This problem may be overcome by using a movable at the trailing edge. Special movables for Circulation Control (CC) were introduced by Englar(Reference Englar and Huson8), as displayed in Fig. 2.
Dual radius circulation control aerofoil, adopted from Reference Englar and HusonRef. 8.
While these devices were designed for geometric compactness, it turned out that higher blowing efficiencies are obtained by larger flaps, similar as sketched in Fig. 1. These are often called internally blown flaps and a significant knowledge base is available(Reference Lachmann2,Reference Schlichting3,Reference Joslin and Jones9,Reference Radespiel, Pfingsten, Jensch, Radespiel, Rossow and Brinkmann10) . Since the physics of the wall jet and the design of the blowing slot and turning geometry of internally blown flaps are similar to circulation control approaches, the internally blown flaps can be viewed as a special case of circulation control. Their effectiveness relies on properly using the Coanda effect; therefore, we call these devices Coanda flaps.
The flow field of a Coanda flap is schematically displayed in Fig. 3. Here it is assumed that the flap is hinged at a point close to the lower surface and the resulting knuckle shape of the flap functions as the Coanda surface. Upstream of the blowing slot one observes the main-wing boundary layer with a momentum thickness δ2. Blowing from the slot generates a wall jet that follows the curved Coanda surface. Viscous and turbulent diffusion cause the wall-jet thickness to grow, thereby reducing the momentum deficit that the wake of the main-wing boundary layer has. The curved Coanda surface generates a pressure minimum with pressure recovery downstream towards the trailing edge.
Flow field of Coanda flap and resulting lift behaviour.
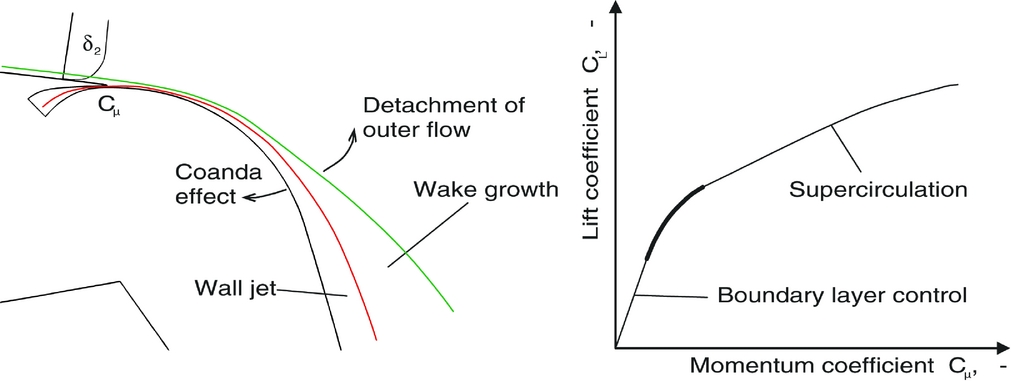
The development of the flow field depends on three factors(Reference Burnazzi and Radespiel11):
1. The strength of the wall jet affects the turbulent mixing between the jet and the outer flow and the ability to withstand adverse pressure gradient before separation occurs.
2. The momentum deficit of the incoming boundary layer, δ2, determines the wake above the wall jet and its growth downstream. It depends on the leading-edge geometry and aerofoil circulation.
3. The angle-of-attack changes circulation and the pressure distribution at the nose and at the Coanda flap, thereby affecting the interaction of wall jet and wake flow.
For small strengths of the wall jet, flow separation is located somewhere on the flap and the rise of lift with increasing momentum coefficient of blowing is rather high. This represents the regime boundary-layer control. With increasing strength of blowing, flow separation moves towards the trailing edge. Once the complete flap flow is attached, one observes a smaller rise of lift with blowing. This is the regime where blowing provides super-circulation. It is obvious that applications in commercial transport should operate at the transition in between boundary-layer control and super-circulation, as marked in Fig. 3 (right). Note that maximum lift at these conditions is usually determined by the increasing wake growth with angle-of-attack, which reduces overall flow turning provided by the flap. In other words, the strong effect of wake growth on lift is responsible for a nonlinear response of the lift to the angle-of-attack. The design problem of effective Coanda flaps may thus be summarised by the goal ‘stay attached and hold together.’
One can compare the success of different designs by comparing the blowing effort to provide a given maximum lift coefficient or to look at the gain in maximum lift coefficient at a given blowing strength. Alternatively, one can adjust the blowing momentum such that the flap flow just remains attached to the trailing edge and evaluate the lift-gain-factor for this condition.
2.2 Aerodynamic design
This section presents a review of recent design experience obtained in order to achieve high blowing efficiencies for applications in high-lift of commercial transport aircraft. It will be shown that efficient blowing requires a suited combination of blowing slot, Coanda turning surface, flap angle, and leading-edge geometries. Suited geometries were obtained by using a large number of numerical flow simulations by which the effects of design parameters were systematically varied and analysed. This work needed a representative study case. This is the transonic aerofoil DLR-F15 equipped with an internal blow flapReference Burnazzi and Radespiel(11) as displayed in Fig. 4.
DLR F15 aerofoil with a 25% high-lift flap, deflected by 65°, and using internal blowing along a suited Coanda geometry as a reference (left) and blowing slot details (right).

2.2.1 Numerical set-up
Using numerical flow simulations for design required a careful choice of the numerical set-up and specific efforts for validating the numerical results. The DLR flow solver TAU(Reference Schwamborn, Gerhold and Heinrich12) was employed for flow analysis. This simulation system solves the Reynolds-Averaged Navier-Stokes equations in finite volume formulation. Based on experience from literature(Reference Rumsey and Swanson13) and a large number of our own computations with different turbulence models we chose the model of Spalart and Allmaras with a correction due to flow rotation and curvature(Reference Shur, Strelets, Travin and Spalart14). This extension enables the one-equation model to provide good accuracy in regions where the streamlines have high curvature. This is important for the simulation of the Coanda effect, which is based on the equilibrium between the inertia forces, pressure forces, and the turbulent momentum transport in the direction normal to the convex surface. The numerical set-up was assessed by using grid convergence studies and by comparisons with wind-tunnel experiments. Grid convergence was assessed by numerical solutions on a grid with systematically reduced grid spacing in all coordinate directions. A sample grid is displayed in Fig. 5.
Hybrid grid with around 230,000 points used in the present flow analyses.

The evaluation of flow solutions indicated that the numerical errors in aerodynamic coefficients are less than 1% for the standard grid shown in Fig. 5(11). Wind-tunnel experiments with an aerofoil model with a representative flap were performed in the low-speed wind tunnel of Technische Universität Braunschweig at a Reynolds number of 1×10⁶. The tests provided oil flow pictures, pressure distributions, aerodynamic coefficients at the tunnel centre line, and flow field data from PIV for different angles of attack and blowing rates(Reference Pfingsten, Cecora and Radespiel15,Reference Pfingsten16) . Figure 6 shows a typical comparison between experimental and numerical results. It was observed that good agreement with the experiments could be only obtained from three-dimensional (3D) simulations that include the sidewall boundary layer. For low blowing rates, when separation occurred over the flap, the curvature correction of the turbulence model appeared to be necessary in order to predict the flow separation point on the flap.
Comparison of Cp distributions from numerical simulations and wind-tunnel experiments; M = 0.15, Re = 1×10⁶, α = 0°, flap deflection 45°, C μ = 0.045; data from Reference Pfingsten, Cecora and RadespielRef. 15.

2.2.2 Blowing geometry
On this basis a reference geometry and corresponding flow conditions are selected to serve for sensitivity studies. The geometry is plotted in Fig. 4. It features a 25% high-lift flap that is deflected by 65°. The Coanda surface has a constant curvature radius of 0.07 times the aerofoil chord length. The slot height is 0.0006 times the aerofoil chord. The freestream Mach number is chosen as 0.15, which is low enough to prevent transonic flow for a broad range of lift coefficients. This Mach number is representative for transport aircraft with short take-off and landing capabilities. The Reynolds number is 12 × 106, which is representative for an aircraft with 100 passengers.
Geometry parameters of wall jet blowing are slot height, Coanda radius, flap length, and flap deflection(Reference Jensch, Pfingsten, Radespiel, Schuermann, Haupt and Bauss17). The slot height turned out to be an important parameter. Smaller slot heights generally lead to increased maximum lift values for a fixed momentum coefficient of blowing. This is more thoroughly discussed further below, for a geometry with an effective nose device. The curvature of the Coanda surface is less important. Increasing the reference radius of 0.07·c to 0.11·c by a drooped hinge results in larger blowing rates to avoid flow separation at the flap, presumably because of the increased length of the flap upper surface, while the lift-gain-factor, LGF, remains merely the same. More effective is to employ a variable curvature, that has a radius of 0.035·c close to the blowing slot and 0.14·c further downstream. This resulted in a 5% gain of LGF, with respect to the present reference. Note that a variable curvature radius presents a mechanical difficulty when different flap angles are to be used during take-off and landing. A variation of the flap length showed that the largest lift gains are obtained for flaps with a length of 0.25-0.30 times the chord. The effects of lip bluntness of the blowing slot were also studied. It appeared that a bluntness of less than 0.0005·c is needed to keep lift losses due to lip bluntness below 1%. Finally, typical values of viscous losses in the blowing nozzle are analysed in Reference PfingstenRef. 16 using RANS simulations. It is found that viscous losses in the nozzle lead to about 4% lower average jet velocities, vj, for the current nozzle geometries employed.
During the simulations it was generally observed, that the angle-of-attack of maximum lift is much reduced at higher blowing rates. For example, a maximum lift coefficient of 5 is obtained at an angle-of-attack, αmax = 2°. This small stall angle makes it impossible to use the high-lift aerofoil on the wing of a transport aircraft, since the resulting aircraft angle-of-attack at landing will be negative.
2.2.3 Design for low boundary-layer losses
Using leading-edge devices for delaying stall to higher angles of incidence is generally well established. An excellent review of design and analysis of slats and droop noses, based on the aforementioned DLR-F15 aerofoil is presented by Wild(Reference Wild18). However, publications on suited leading edges for Coanda flaps are rare. Here, recent research into the potentials of installing a rigid droop nose, a flexible droop nose, and a slat is reviewed.
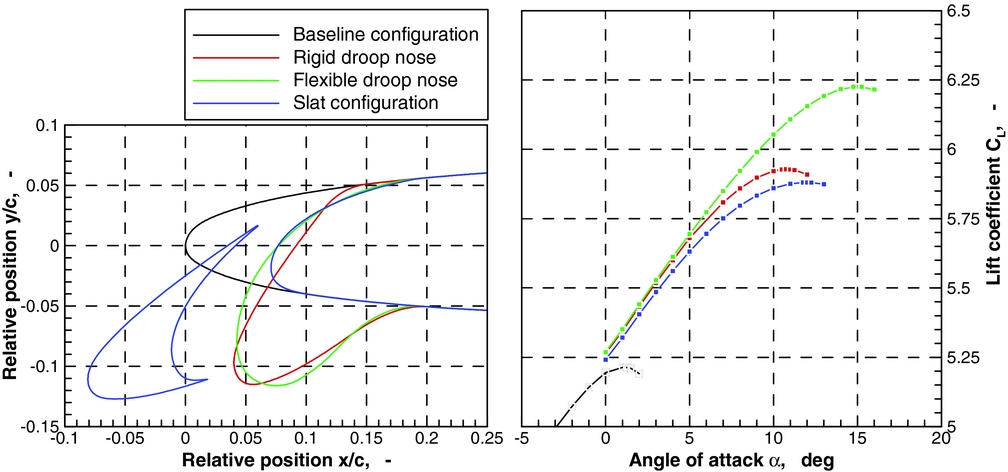
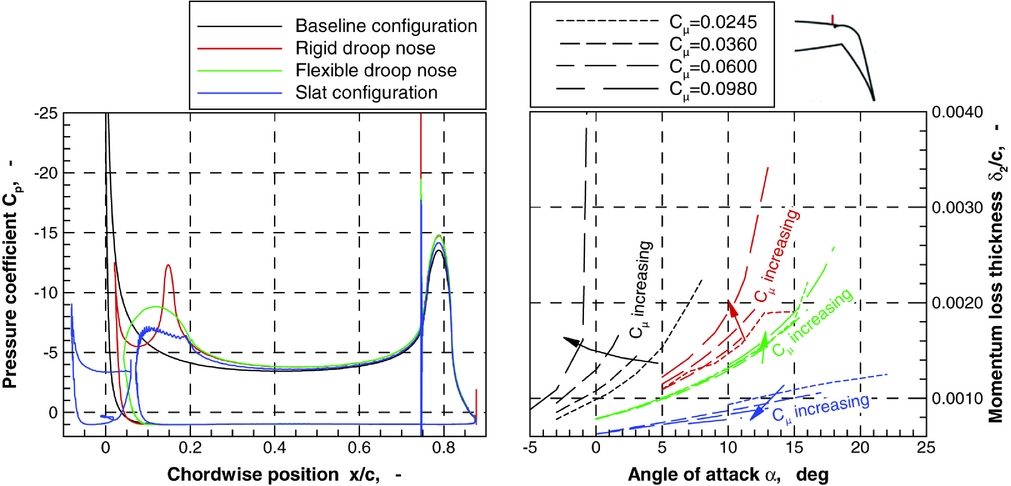
Our aerodynamic design of these devices assumed that 20% of the aerofoil chord is available for housing the leading-edge device. Rigid droop noses are obtained by deflecting the leading edge downward, without changing its shape. This approach does not involve structural deformations, except for the hinge-cover sheet at the lower surface. The rigid droop nose is characterised by two strong peaks of low pressure, as the deflection of the nose creates a new surface segment with high curvature on the suction side. Variation of the deflection angle showed that the best nose performance was obtained at a flap setting of 30°, as displayed in Fig. 7.
Comparison of leading-edge configuration at C µ = 0.06, Re = 12×106, M = 0.15. With kind permission from Springer Science+Business Media: CEAS Aeronautical Journal, Assessment of leading-edge devices for stall delay on an aerofoil with active circulation control, Vol. 5, 2014, 374, M. Burnazzi and R. Radespiel, Figs 21(a) and 21(b). (© Deutsches Zentrum für Luft- und Raumfahrt e.V. 2014.)

The flexible droop nose is generated by systematically varying camber and thickness distribution ahead of 20% aerofoil chord. The best solution is obtained by smoothly increasing the camber line angle until the leading edge, with 90° at that point. The local aerofoil thickness is also increased towards the nose, where a value of 1.6 times the original aerofoil thickness is selected. More design details are given in Reference Burnazzi and RadespielRef. 11. The resulting contour is plotted in Fig. 7 along with its lift curve. An impressive gain of maximum lift and stall angle is achieved, which is much larger than expected from experience with Fowler flaps(Reference Wild18).
The slat configuration is also displayed in Fig. 7. It has a deflection angle of 28°. Slat angle and gap were defined by using numerical optimisation of two-dimensional (2D) flow(Reference Burnazzi and Radespiel11). For the present applications with the Coanda flap, these parameters could likely be adapted to further improve the aerodynamic behaviour. However, the present configuration is considered as representative of flow features and performance trends that an optimised geometry would show. The lift results shown in Fig. 7 are rather unexpected, since the slat appears not to take advantage of its extended chord and the gap flow, relative to the rigid nose.
A detailed analysis of the aerodynamic behaviour is obtained by inspecting the pressure distributions and the development of the boundary-layer momentum thickness just upstream of the blowing slot(Reference Burnazzi and Radespiel19). All pressure distributions show a local region of low pressure at the Coanda turning surface, with a favourable pressure gradient upstream of it. This rules out flow separation towards the trailing edge of the main wing, which is quite different compared to employing a Fowler flap. The momentum thickness upstream of the blowing slot may be interpreted as the resistance that the incoming flow exerts against the intended flow turning. Figure 8 displays significant differences between the four configurations. Boundary-layer losses rise quickly with α and C µ for the clean nose, due to the high sensitivity of the nose suction peak, while the flexible droop nose shows rising losses with α but not with C µ. This is important for achieving high stall angles at high C µ. The slat shows generally rather low momentum thicknesses. However, further inspection of the velocity profiles at x/c = 0.73 (not shown here) reveals that significant losses are contained in the slat wake and these are not augmented by Coanda jet blowing(Reference Burnazzi and Radespiel19). This explains the early stall of the slat.
Pressure distributions for C µ = 0·.06, α = 1° and development of momentum thickness at x/c = 0.73, Re = 12×106, M = 0.15. With kind permission from Springer Science+Business Media: CEAS Aeronautical Journal, Assessment of leading-edge devices for stall delay on an aerofoil with active circulation control, Vol. 5, 2014, 374, M. Burnazzi and R. Radespiel, Figs 21(c) and 19(b). (© Deutsches Zentrum für Luft- und Raumfahrt e.V. 2014.)
While most of the active high-lift approaches assume that the compressed air needed for blowing is provided by bleed from the aircraft engine, an alternative is to generate compressed air by distributed compact compressors integrated into the wing. This bears the potential to take advantage of the suction slot needed to feed the compressor, as sketched in Fig. 9. Aerodynamic analysis of this approach must cover two partial problems:
1. Providing air with high-pressure recovery to the compact compressor.
2. Improving the aerofoil lift by reducing boundary-layer momentum losses thanks to suction.
Scheme of high-lift configuration with suction after (Reference Burnazzi and Radespiel20).
Unfortunately, these two objectives behave differently as the geometrical suction parameters are varied. These are suction inlet angle, inlet diffuser angle, and slot location along the aerofoil surface(Reference Burnazzi and Radespiel20). Therefore, a combined analysis is needed that takes pressure recovery and boundary-layer losses into account. For this purpose, the total pressure obtained at the end of the inlet duct is used to balance the jet momentum coefficient, by assuming a constant pressure ratio of the compressor. This results in a balanced lift coefficient that is a suited quantity to compare different geometries. Details may be found in Reference Burnazzi and RadespielRef. 20.
Dedicated flow simulations were performed for determining suited suction parameters using this approach. The aerofoil geometry had the flexible droop nose of Fig. 7. The results show that significant lift gains are obtained with suction(Reference Burnazzi and Radespiel20). Good inlet geometries have small inlet angles, relative to the wing surface and suited angles are between 10° and 20°. Good pressure recovery is obtained at rather small diffuser angles of around 3°. It also appears that forward locations of the suction slot, shortly behind the suction peak of the droop nose, are slightly more efficient than positions behind the wing box, while the application of suction on the deflected flap has no measurable benefit, according to the flow simulations. Based on these results a slot position at 61% of chord length is selected, since the small aerodynamic advantage of a more upstream suction slot would not justify a structural change of the wing box. This choice results in an increased maximum lift coefficient of 0.35 due to suction, which is 7% of the value obtained without suction.
2.2.4 Nondimensional blowing parameters
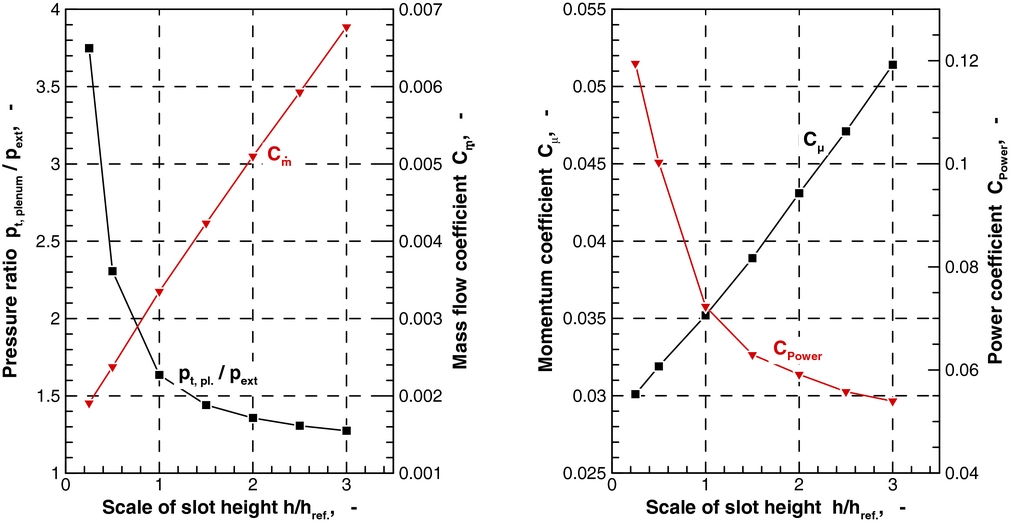
The DLR-F15 aerofoil with 65° Coanda flap and flexible droop nose was used to assess the effect of blowing slot height on the various wall jet blowing parameters. Figure 10 displays computational results where the blowing strength was adjusted to obtain a maximum lift coefficient, CL max = 5. The reference slot height was h ref = 0.0006·c. The blowing parameters defined in Section 1.2 were evaluated by integrating the numerically computed flow field at the blowing nozzle exit. The results identify the slot height as a design parameter with high impact. The slot mass flow needed to obtain CL max = 5 rises strongly with increasing slot height. Furthermore, it is observed that pressure ratio of the jet is reduced with increasing slot height. The variation of pressure ratio shows that the wall jet is supersonic for slots smaller than 0.7·h ref. The required momentum coefficient, C µ, rises with the slot height. That is, the lift coefficient of 5 can be most efficiently obtained with rather small slot heights, if C µ is the relevant blowing parameter for design. However, the chosen compressor technology puts a restriction on the achievable pressure ratio. For example, high-performance single-stage axial compressors can only generate pressure ratios up to values of around 2. On the other hand, if the power coefficient is regarded as the relevant blowing parameter one finds that it decreases with increasing slot height, since power scales with the cube of jet velocity.
Blowing parameters for varying blowing slot height needed to obtain CL max = 5, Re = 12 × 106, M = 0.15.
Surprisingly, the slot height also has a significant effect on aerofoil stall angle, as displayed in Fig. 11. Small slot heights with high jet velocities generate larger stall angles than larger slots. These observed sensitivities of the blowing slot height make the design difficult. It turns out that design decisions on a suited slot height must be based on an overall assessment of maximum lift, cost, and weight of the used system for providing compressed air, and requirements for a sufficiently large wing stall angle.
Stall angle for varying blowing slot height and CL max = 5, Re = 12 × 106, M = 0.15.
2.3 Scaling of lift augmentation
Applications of active high-lift systems in transport aircraft must provide flexibility to adapt the lift coefficient to the need of the specific aircraft. Moreover, transport aircraft use different lift coefficients at take-off and landing, as one-engine-out climb requirements call for a low-drag take-off configuration with a smaller lift coefficient than for landing.
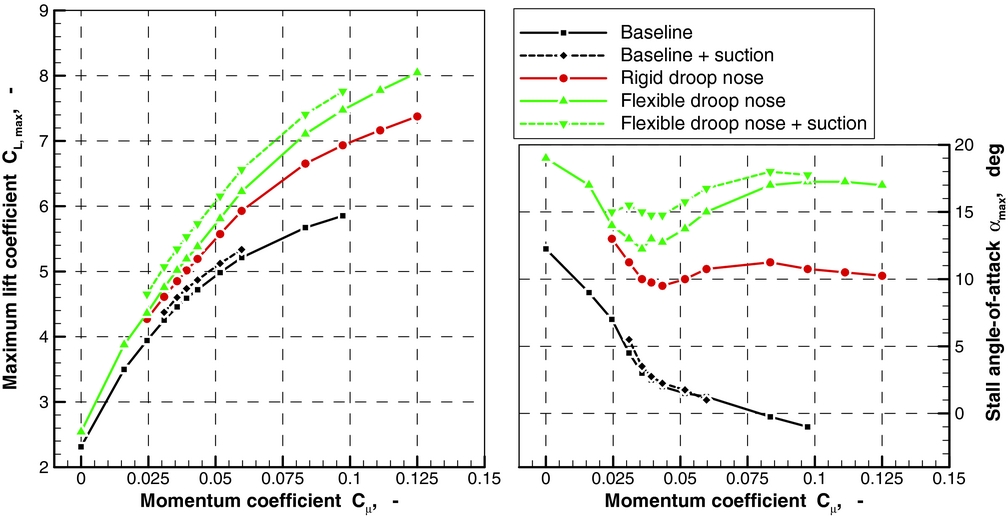
Coanda flaps can provide such flexibility. Figure 12 displays the range of maximum lift coefficients that can be obtained with different leading-edge devices and with and without suction, with a 65° Coanda flap(Reference Burnazzi and Radespiel20,Reference Radespiel and Burnazzi21) . Suited combinations of leading-edge device and suction open up a very broad range of achievable lift coefficients. The effect of these combined devices is to reduce the required momentum coefficient by more than 40% and to increase the aerofoil stall angles by 10°-18°, depending on blowing rates. Typical lift gain factors, LGF, at a maximum lift coefficient of 5 are 51 for the baseline, 70 for the flexible droop nose, and 82 with flexible droop nose and suction (see Section 4). Here, the corresponding aerofoil configuration without blowing was used as the reference, as required in Equation (5).
Maximum lift coefficient and stall angle over wall jet momentum for Re = 12×106, M = 0.15, suction slot at x/c = 0.61, flap angle 65°. With kind permission from Springer Science+Business Media: Notes on Numerical Fluid Mechanics and Multidisciplinary Design, Fundamentals in Coanda Flap Design, Vol. 127, 2014, 111, R. Radespiel and M. Burnazzi, Fig. 11, (© Springer International Publishing, Switzerland 2015.)
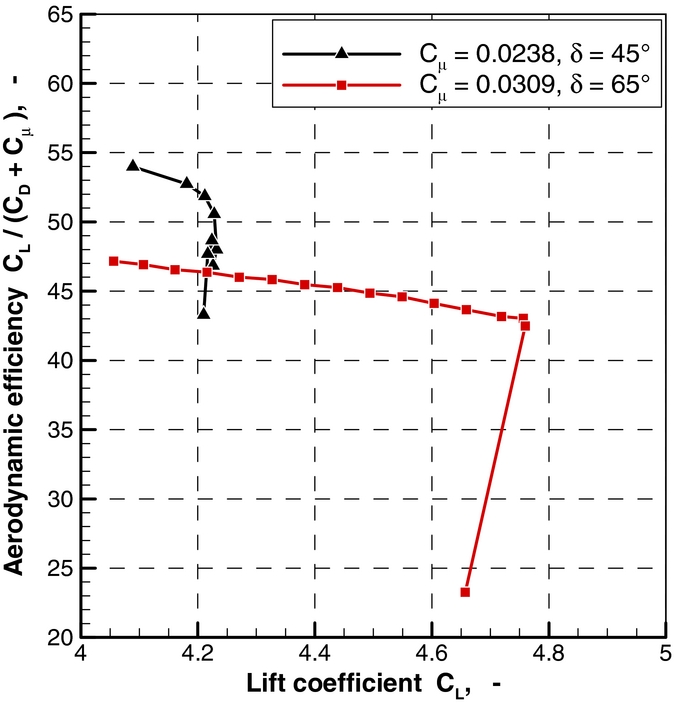
It is noted that the lift coefficients for small blowing rates and large flap deflection angles are obtained with flow separation on the Coanda flap. This is not acceptable if low-drag values are sought. In that case, flap deflection should be reduced. Figure 13 displays the aerodynamic efficiency obtained for two flap angles, 45° and 65°. The computed efficiency parameters include C µ as a penalty in the denominator, assuming that investing blowing momentum will generate a similar loss in aero-engine thrust. In the results of Fig. 13, the blowing strength is adjusted to provide maximum aerodynamic efficiency for both cases, respectively. This resulted in attached flow up to the trailing edge. The simulations show that Coanda flap angles can be used to adjust aerofoil performance to a desired range of aerodynamic efficiency. More results for aerodynamic efficiency are presented in Reference PfingstenRef. 16.
Aerodynamic efficiency with 45° and 65° deflected Coanda flaps and flexible droop nose; Re = 12×106, M = 0.15.
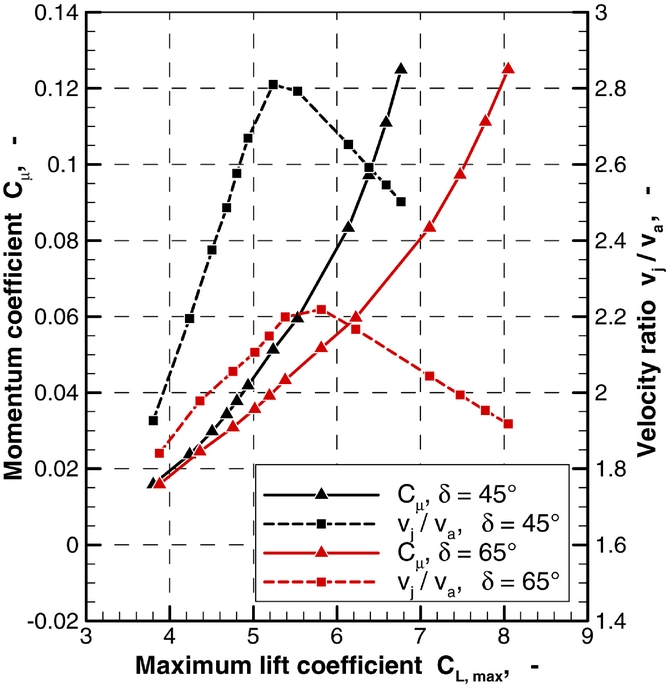
The numerical results are finally scrutinised for an answer to the question which blowing parameter scales the lift for a given Coanda flap. Figure 14 displays the required momentum coefficient and the required jet velocity ratio over maximum lift coefficient. The graphs of the velocity ratio display a sharply defined maximum. This maximum value indicates the point where critical flow occurs in the blowing nozzle for the first time. Further increase of blowing strength does not lead to larger velocities in the nozzle, but the under-expanded wall jet expands downstream, thereby creating a stronger Coanda effect and associated turning of the external flow. The results show that lift of the Coanda flap scales linearly with velocity ratio, for subsonic jet flow. This confirms that the physical relevant mechanism of wall jet blowing is turbulent momentum exchange across the wall-jet shear layer. Turbulent momentum exchange is the result of Reynolds stresses that are produced by tangential velocity gradients in the wall-normal direction. These flow gradients are proportional to the jet velocity ratio.
Required jet momentum coefficient and velocity ratio for maximum lift coefficient, flexible droop nose, Re = 12×106, M = 0.15.
3.0 MOMENTUM REARRANGEMENT
3.1 Introduction
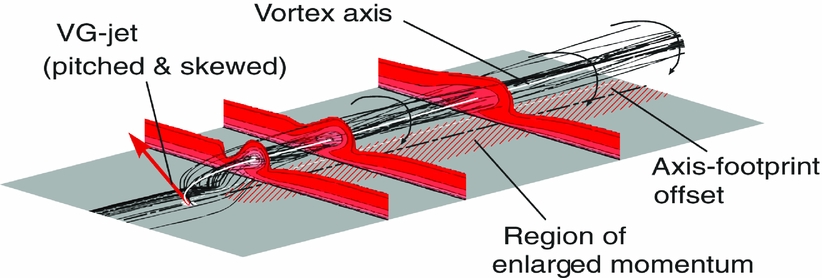
As pointed out in the introduction, longitudinal vortices can be an effective means to control a flow. Such vortices are produced upstream of a separation zone by means of a Vortex Generating (VG) device. Figure 15 shows a general overview of the flow structure downstream of a VG-Jet (VGJ). The vortex advects with the flow, except in the vicinity of the VG itself, while the vortex axis is approximately equivalent to a mean flow streamline. In the close vicinity of the VGJ exit, the jet axis bends in spanwise and vertical directions. The vortex axis is, thus, in a certain distance hc above the wall. Its footprint on the wall features a spanwise offset with respect to the VGJ position. On the downwash side of the vortex the velocity close to the wall increases, forming a region of enlarged momentum. On the other side of the vortex, the upwash will have the opposite effect; also the core of the vortex features a region of retarded longitudinal velocity. If the geometry of the jet is chosen appropriately, however, the positive effects prevail.
The structure downstream from a vortex generating jet.

The vortices can persist over remarkable streamwise distances(Reference Pauley and Eaton22). They rearrange the mean longitudinal momentum by direct transfer of fluid from the outer boundary layer closer to the wall, as well as by increased turbulent diffusion. There are, however, limitations: the separation line should be more-or-less orthogonal to the vortex axis, i.e. to the average streamlines, and the vortex should be not too small compared to the characteristic size of the separation – otherwise it will simply follow the streamlines bending around the separation and have little effect.
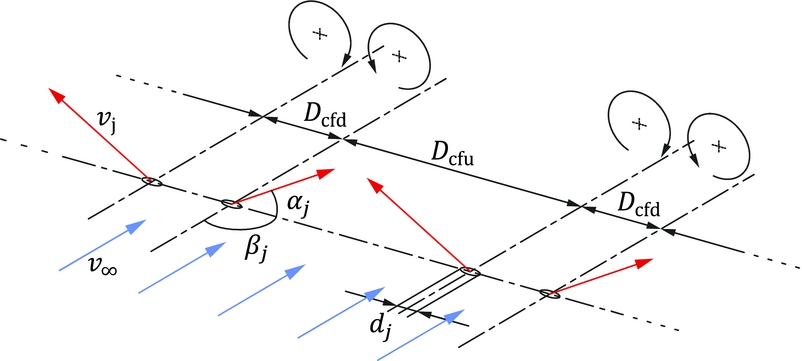
The most common VG geometries are halved delta wings for mechanical vane VGs and either pitched and skewed circular holes or skewed slots for fluidic VGJ, which are referred to as ‘Vortex Generating Jets’ (VGJs). By the way they work, vortex generating devices are sensitive to the arrangement relative to the oncoming flow, in terms of orientations, spacings, and size. Herein, we focus on a fluidic device, a jet emanating from a pitched and skewed circular hole. While being the geometrically most simple setup, it is also often found to be the most effective one – as will be shown later. The geometrical parameters of VGJs are sketched in Fig. 16; the individual jet is defined by the hole diameter dj, pitch angle αj, and skew angle βj.
Definition of geometrical parameters for VG-jets (here: in a counter-rotating array).

Vortex pairs might be combined into three different setups, which are, following the nomenclature in Reference Pauley and EatonRef. 22, counter-rotating common-flow-up (cfu), counter-rotating common-flow-down (cfd), and corotating arrays. Figure 16 shows the definition of distances D cfd and D cfu in a counter-rotating array. For a spanwise row of ‘many’ individual VGJs, counter-rotating arrays always comprise both cfu and cfd pairs. In contrast, in a corotating array only one equidistant spacing is necessary.
3.2 VGJs in plain boundary-layer flows
3.2.1 Methodology
The studies that will be reviewed here(Reference Ortmanns23,Reference Casper, Kähler and Radespiel24) were done in a zero pressure gradient turbulent boundary-layer flow (ZPG-BL), established over a 5.7 m long flat plate in a 1.3 m wind tunnel. The characteristic boundary-layer parameters are thickness δ99 ≈ 87 mm, displacement thickness δ* ≈ 11 mm, and momentum loss thickness θ ≈ 8 mm; with flow velocities of 25 ms−1 and 45 ms−1 the Reynolds number based on momentum loss is, thus, Reθ ≈ 12,700 for 25 ms−1 and Reθ ≈ 24,000 for 45 ms−1. The studies of the single VGJ were done at the higher velocity, and the VGJ arrays with the lower velocity.
Since the ZPG-BL does not show separations, to assess the control effect for various geometrical setups of VGJs, herein the approach proposed by Reference OrtmannsRefs 23-Reference Mahmood and Radespiel25 is used: a parameter for the ‘increase of longitudinal momentum.’ Others have used the local increase in wall shear stress(Reference Johnston and Nishi26,Reference Godard and Stanislas27) or parameters of the vortex e.g., circulation or peak vorticity(Reference Pauley and Eaton22,Reference Ortmanns23) . The latter ones have the disadvantage of not taking into account the position of the vortex: A strong vortex far away from the wall might not be effective for separation control. The shear stress has the disadvantage of being a pointwise value: while the positive influence of the vortex might be assessed, it does not balance them with detrimental regions.
In both Reference OrtmannsRefs 23 and Reference Casper, Kähler and Radespiel24, the ZPG-BL was measured using a Stereo-PIV system with the lightsheet orthogonal to the plate surface and the oncoming flow. This resolves the vortical secondary motion as well as the change of the longitudinal velocity of the BL due to the vortex. To calculate the ‘increase of longitudinal momentum,’ the flow field without the vortex structure (reference BL) is subtracted from the flow field including the vortex. Then, the change of the longitudinal momentum (∝Δu 2) due to the vortex is integrated over span, such that regions of lower momentum, where the flow has decelerated, are balanced with regions, where momentum is increased. This parameter gives an integral view on the effect of the vortex. Herein, we use the parameter qualitatively, where ‘more momentum increase’ is hypothesised to correlate to ‘better control effect.’ Refer to Reference OrtmannsRefs 23-Reference Mahmood and Radespiel25 for exact definition and quantitative discussion.
3.2.2 Geometry of the single jet
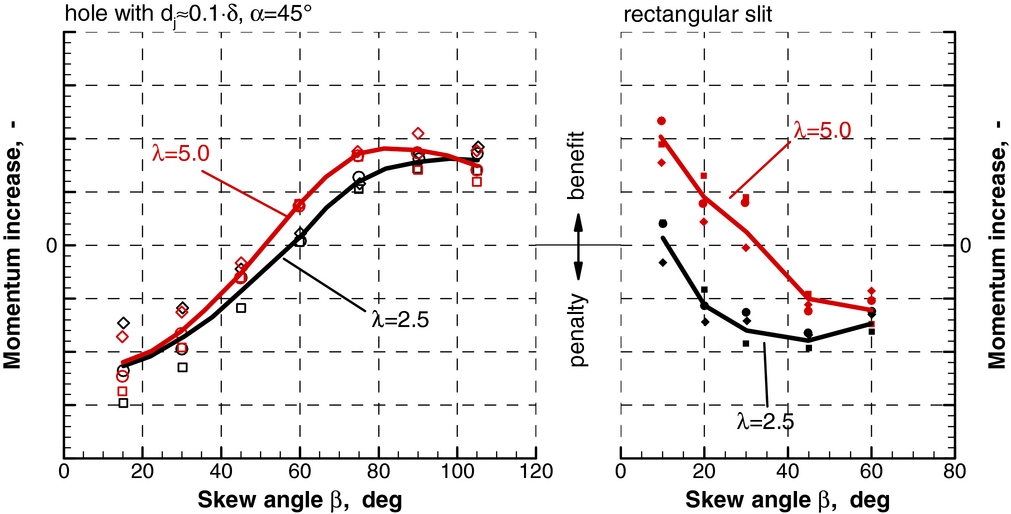
In Reference OrtmannsRef. 23 a comprehensive comparison of skewed slots with pitched and skewed holes was done. Figure 17 shows the results for a variation of skew angle for a 45°-pitched hole (left) and a slit (right) in the ZPG-BL discussed above. The circular hole has a size of dj ≈ 0.1·δ. The slit has the same cross-sectional area as the hole and an aspect ratio of 5. The different symbols are different downstream distances, which will not be discussed in detail here, since the conclusion is the same for any of the distances. For both VGJ types a sensitivity on skew angle can be seen. For the 45°-pitched hole a skew angle of 90° is the best choice, which has also been concluded in other studies e.g., Reference OrtmannsRefs 23 and Reference Godard and Stanislas27. For the slit, small skew angles seem most beneficial. This is comparable to the typical setup of mechanical vane-type VGs(Reference Prandtl1) – it seems that the process to produce a vortical structure is similar for slit-type jets and vane VGs and, thus, features similar sensitivity. However, a comparison between the slit and the circular hole reveals that the slit is more sensitive to the skew and to the blowing ratio λ. The sensitivity to skew angle is disadvantageous: If the oncoming flow varies by, say, 20° (which is not unlikely, since the application is close to a separated region), the slit might become ineffective, while the hole does not. Also, the circular jet has more effect already at smaller velocity. Since both jets featured the same cross-sectional area, same velocity ratio also means same mass-flow requirement. In summary, the study(Reference Ortmanns23) clearly shows the arguments for the circular hole as the most interesting VGJ geometry.
Momentum increase close to the wall for differently skewed holes (αj = 45°) and slits, in distances 0.5·δ, 7·dj, and 2·δ, 27·dj downstream from the jet; adopted from Reference OrtmannsRef. 23.
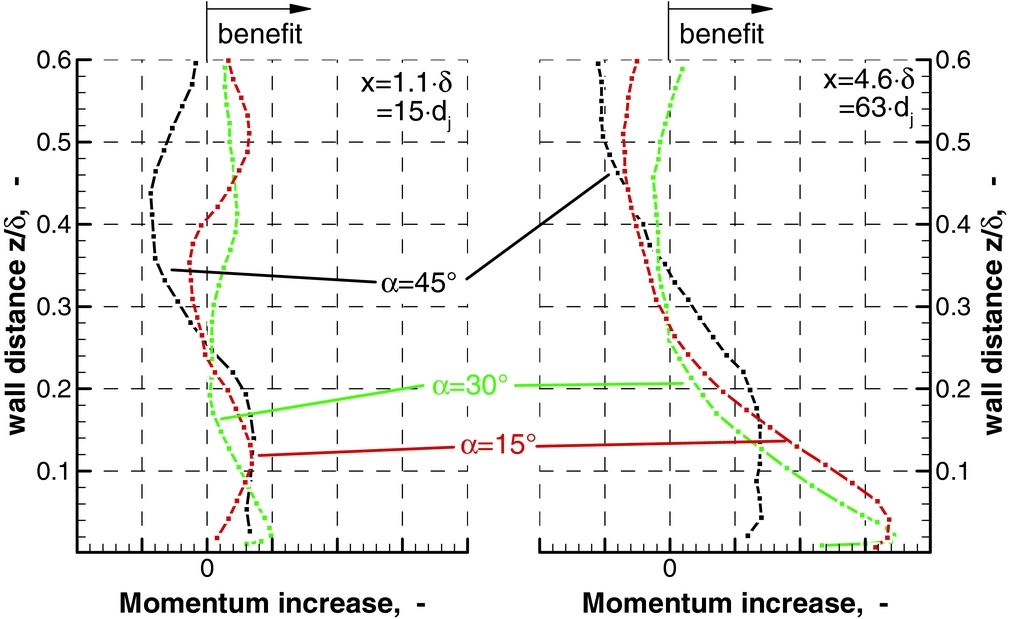
Also in Reference OrtmannsRef. 23 the influence of the pitch angle αj was investigated, which interestingly was barely studied before. Figure 18 shows again the parameter assessing the momentum increase, resolved for a larger region of the ZPG-BL. The skew angle was fixed at βj = 90°. The curves show a characteristic profile, where closer to the wall the momentum can be increased (due to the downwash), while at some distance the retarded flow surrounding the core of the vortex decreases the momentum. Though trends are qualitatively similar for all pitch angles, αj = 30° seems to be the most interesting choice: The momentum near the wall is increased with respect to the αj = 45° case, at the same time the momentum loss in the vortex core is the least. With larger distances downstream from the jet (right subfigure) there might be a benefit in using an even smaller pitch of 15°, since the momentum benefit spreads out over a larger depth.
Momentum increase/decrease in the turbulent boundary layer for hole, βj = 90°, with variation of pitch angle; adopted from Reference OrtmannsRef. 23.
3.2.3 Spanwise arrays
In the same ZPG-BL setup as in Reference OrtmannsRef. 23 (also refer to Reference Casper, Kähler and RadespielRef. 24), vortex pairs have been studied using, again, the momentum increase as the assessment factor. In Reference Godard and StanislasRef. 27 it was concluded that, for an otherwise plain problem, the counter-rotating array is more effective than a co-rotating row of VGJs. The same conclusion can be deducted from the data in Reference Pauley and EatonRef. 22, though it is not explicitly discussed there. Therefore, in this section we will focus on a counter-rotating array in the ZPG-BL and discuss the influence of the spacing between the individual VGJs.
The results of this study are shown in Fig. 19. The left subfigure is for the common-flow-down configuration, and the right one for the common-flow-up configuration. Data was acquired for various downstream distances, where x/dj = 0 is the position of the VGJs. Both, the cfu and cfd arrays are able to significantly increase the momentum. Here, the integral assessment over the span using the momentum increase uncovers that both configurations are similarly effective, although in literature often the cfd configuration is favoured, because the downwash between the two vortices is believed to be beneficial. In contrast, here it is shown that also the cfu configuration can increase the momentum: although there is an (detrimental) upwash between the vortices, the downwash on the two sides of this array spreads out over a relatively large area.
Momentum increase/decrease in a counter-rotating array with various distances; αj = 30°, βj = 90°, λ = 3.1.
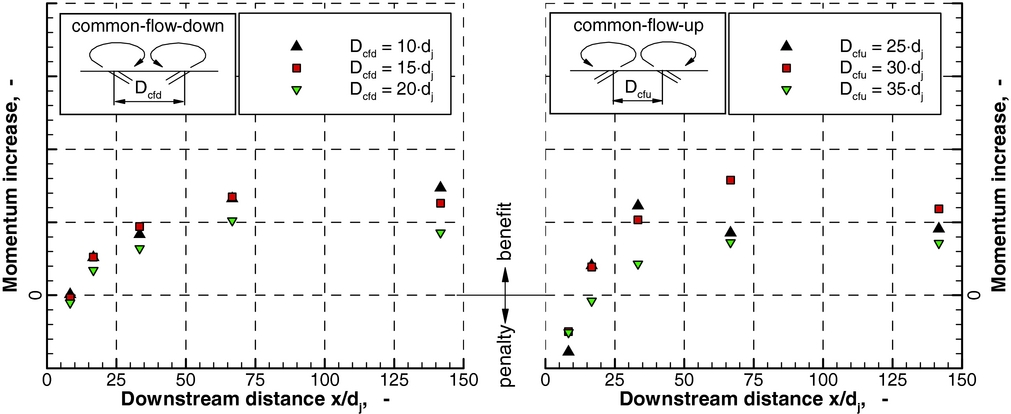
A comparison between the spacings for the configurations reveals that for the common-flow-down VGJs a spacing of about 10-15·dj is a good choice. For the common-flow-up configuration the spacing must be much larger, basically because of the spanwise vortex axis offset; a spacing of around 30·dj seems effective. For both configurations too large spacing will give lesser momentum increase.
It is noted that the vortex axis, as discussed above, features an offset in spanwise direction. Obviously, the optimal spacing rather depends on the separation of the two vortex axis, not on the spacing of the jet holes. Therefore, since the spanwise offset will change with varying αj, the data in Fig. 19 is only valid for 30° pitched holes. For larger pitch angles, the spanwise offset is smaller, therefore smaller D cfd and larger D cfu should be used, and vice versa.
3.3 VGJ arrays in swept aerofoil flows
In contrast to 2D problems, boundary layers in swept flows feature a more complex physics. In simple swept flows the boundary layer will be twisted due to the crossflow component. It is known that this encourages a certain sense of rotation for vortices embedded in the BL(Reference Meunier and Brunet28). A twisted BL can be found at the leading edge of an infinitely swept aerofoil. On a swept wing, close to the leading edge, the twist of the BL supports vortices, where the secondary flow closer to the surface has an upwind component towards the vector of v ∞ (pointing ‘to the root’ of a wing with backward sweep), while the secondary flow at the BL edge points in the direction of v ∞ (‘to the tip’). Hence, a VGJ with a jet orientation ‘towards the wing root’ could utilise this effect – we will call this configuration ‘favourable’ in the following.
To study the influence of 3D boundary layers on the control effect of longitudinal vortices, in Reference Mahmood, Scholz and RadespielRef. 29 various configurations were studied at the leading edge of a 30° infinitely swept aerofoil. The aerofoil is a two-element DLR-F15 configuration(Reference Wild18) (for the flap setting refer to Reference Mahmood, Scholz and RadespielRef. 29) at 8.5° angle-of-attack, which features a distinct suction peak and, at higher angles, will stall with a turbulent leading-edge stall. Extensive RANS simulations were done with VGJs upstream of the leading-edge separation point. To study the VGJ cases, a 3D-extruded mesh with periodic boundary conditions was used, which allows one to resolve the local 3D structure of the vortices in the otherwise 2.5D scenario. One single VGJ is resolved and the periodic BCs effectively define the VGJ array spacing. The Reynolds number based on aerofoil chord was 2.8 Mio. Numerical simulations of VGJs with RANS methods, also in comparison to scale-resolving simulations, were found to capture the effect of the VGJs on the flow.(Reference Mahmood and Radespiel25)
The characteristics of the accompanying boundary layer are shown in Fig. 20. It is noted that, in contrast to the VGJs in ZPG-BLs discussed before, the jet diameter dj, relative to the boundary-layer thickness δ or momentum loss thickness θ was approximately twice as large. Note that the scaling with boundary-layer parameters is unsharp for such cases, because δ and θ vary along the chord and with angle-of-attack. The BL shown in Fig. 20 is at an angle just before separation starts. For this case, initial separation occurred approximately at s = 40 mm (which equals x/c ≈ 0.05), but this is not clearly defined, since the leading-edge separation is a rather dynamic process.
Reference conditions for the study of vortices in twisted boundary layers at the leading edge of a 30° swept two-element aerofoil; spanwise scaling artificially enlarged to highlight the twisted BL profiles; data from Reference Mahmood and RadespielRef. 25.

We assessed the ‘control effect’ of the VGJs applied to the aerofoil configuration. That is, the increase of CL for one fixed angle-of-attack, just beyond stall of the baseline configuration. In Fig. 21 some results from Reference Mahmood, Scholz and RadespielRef. 29 are highlighted. At first, in Fig. 21(a), favourably co-rotating arrays, non-favourably co-rotating arrays, and a counter-rotating array (D cfd and D cfu as in Section 3.2) are compared. It can be clearly seen that indeed the boundary-layer twist supports the vortices when the arrays are oriented favourably. In Section 3.2, the spacings in a counter-rotating array were discussed. In Fig. 21(b) a similar variation is shown for (equidistantly spaced) co-rotating arrays. For such arrays in a 2D APG-BL a rather small spanwise spacing around 6·d was found(Reference Godard and Stanislas27) to be effective. In our study in a swept BL slightly larger spacing seemed more advantageous.
Control effect for various orientation, spacing, and skew of VGJs in a twisted boundary layer; data from Reference Mahmood, Scholz and RadespielRef. 29; unless varied: Corotating, favourable, αj = 30°, βj = 90°, spacing 10·dj, λ = 5.7.
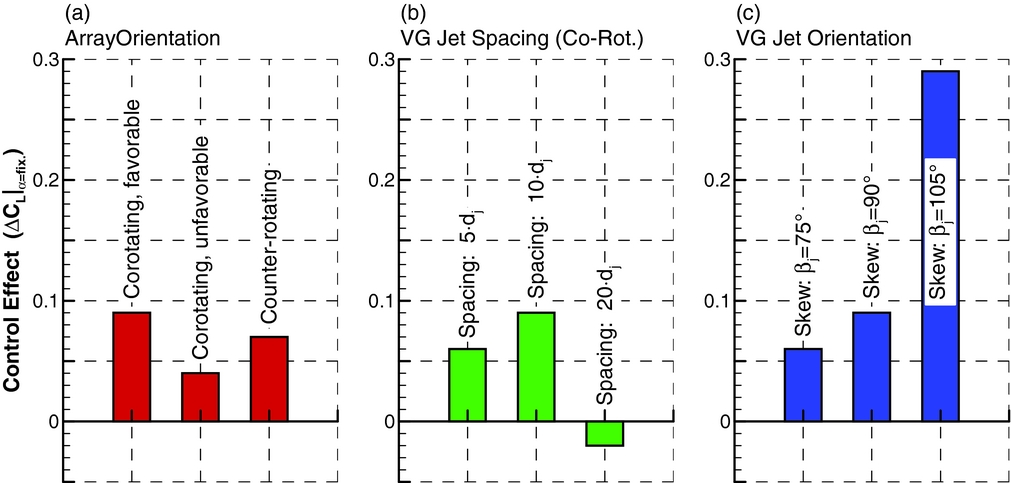
The most influential parameter in this comparison was the skew angle, as shown in Fig. 21(c). Here, skew is defined relative to the leading edge of the aerofoil, being swept back by 30°. Skew βj = 90° means that the VG-jet is oriented parallel to the leading edge. Consequently, the skew βj = 105° means that the VG-jet axis is more orthogonal to the main flow (i.e. line of flight). As can be seen, the skew should be orthogonal to the streamlines at the boundary-layer edge.
3.4 Scaling of VGJ amplitude and size
The amplitude of blowing for a VGJ is the velocity ratio, Equation (2). For the fundamental studies in the ZPG-BL, va ≡ v ∞. Some references report successful creation of strong vortices with as low as λ ≈ 1,(Reference Johnston and Nishi26,Reference Compton and Johnston30) , more commonly λ = 3⋅⋅⋅6 refer to the review of Table 1 in Reference Godard and StanislasRef. 27 and to Reference OrtmannsRefs 23-Reference Mahmood and Radespiel25 and Reference Mahmood, Scholz and Radespiel29. For application cases, also the integral ‘effort,’ in terms of the mass-flow coefficient  ${C_{\dot m}}$ and/or the momentum coefficient C μ is used. The latter one is particularly meaningful, because, like CL, it is a force coefficient and, thus, allows direct comparison.
Flow cases used to assess lift augmentation and lift gain factors shown in Fig. 25

For a deeper analysis we follow the approach of parameterisation, which was originally published in a series of contributions(Reference von Stillfried, Wallin and Johansson31-Reference von Stillfried, Wallin, Johansson, Casper and Ortmanns33). They develop a statistical model for VGJs, based on the idea that the vortex is similar to a Lamb-Oseen vortex. The three parameters uniquely describing such a vortex are the initial, maximum circulation Γmax, the radius of the viscous core r vis, and the height of the vortex core hc above the wall.
 $$\begin{equation}
{\Gamma}_{\rm max}& = &{C}_{\Gamma } sin {\beta }_{j} \cdot \frac{{d_{j}^{2}} \cdot {{\lambda}^2} \cdot {v}_{\infty}}{{r}_{\rm vis}},\\
\end{equation}$$
$$\begin{equation}
{\Gamma}_{\rm max}& = &{C}_{\Gamma } sin {\beta }_{j} \cdot \frac{{d_{j}^{2}} \cdot {{\lambda}^2} \cdot {v}_{\infty}}{{r}_{\rm vis}},\\
\end{equation}$$
 $$\begin{equation}
{r}_{\rm vis}& =& {C}_{r} \cdot {d}_{j} \cdot \sqrt {\lambda } ,\\
\end{equation}$$
$$\begin{equation}
{r}_{\rm vis}& =& {C}_{r} \cdot {d}_{j} \cdot \sqrt {\lambda } ,\\
\end{equation}$$
 $$\begin{equation}
{h}_{c} & =& {C}_{h} \cdot {d}_{j} \cdot {\lambda }.
\end{equation}$$
$$\begin{equation}
{h}_{c} & =& {C}_{h} \cdot {d}_{j} \cdot {\lambda }.
\end{equation}$$
CΓ, Cr, and Ch are empirical model constants(Reference von Stillfried, Wallin and Johansson31) describing a specific configuration. These laws are argued by mass conservation and momentum balance; if the model constants are calibrated by suitable means, the flow behaviour in a certain parameter interval around the calibration case can be modelled. Equations (6)-(8) are not an exhaustive description, however, they may serve as a guideline herein to deduce scaling laws for the blowing amplitude. The viscous core radius is not very important in this case. Integrating Equation (7) into Equation (6) and reducing to a proportionality for given v ∞, βj and model constants yields:
 $$\begin{equation}
{{\rm{\Gamma }}_{{\rm{max}}}} \propto {d_j} \cdot {\lambda ^{ {\frac{3}{2}}}},\quad {h_c} \propto {d_j} \cdot \lambda .
\end{equation}$$
$$\begin{equation}
{{\rm{\Gamma }}_{{\rm{max}}}} \propto {d_j} \cdot {\lambda ^{ {\frac{3}{2}}}},\quad {h_c} \propto {d_j} \cdot \lambda .
\end{equation}$$
If the size of the VGJs, namely, jet diameter dj, is to be changed, a similarly strong vortex (same Γmax) can be created by scaling λ. With Equation (9) this results in
 $$\begin{equation}
{\lambda \propto d_j^{ - \frac{2}{3}}}\ {\rm{and}}\ {{h_c} \propto {d_j} \cdot \lambda \propto d_j^{\frac{1}{3}}}\ \ {\rm{and}}{\ \mathop {{\dot{m}_j}} \propto d_j^2 \cdot \lambda \propto d_j^{\frac{4}{3}}}.
\end{equation}$$
$$\begin{equation}
{\lambda \propto d_j^{ - \frac{2}{3}}}\ {\rm{and}}\ {{h_c} \propto {d_j} \cdot \lambda \propto d_j^{\frac{1}{3}}}\ \ {\rm{and}}{\ \mathop {{\dot{m}_j}} \propto d_j^2 \cdot \lambda \propto d_j^{\frac{4}{3}}}.
\end{equation}$$
A graphical representation of the scaling laws is given in Fig. 22(a) for one single VGJ: If the hole size dj is increased, uj or λ, respectively, can be reduced to keep the vortex strength constant. Increasing dj will, however, increase the mass flow < tex − math/ >, despite the reduced λ, since the cross-sectional area of the hole increases. Also, from the scaling of hc it can be seen that the vortex, although having the same strength Γmax, will reside further away from the wall. This increased hc might be beneficial or detrimental, which is dependent on the application case (e.g., the boundary-layer profile and thickness), but in most cases it should be rather detrimental if the vortex is further away from the wall.
Scaling laws for various measures of blowing amplitude with varying hole diameter dj.
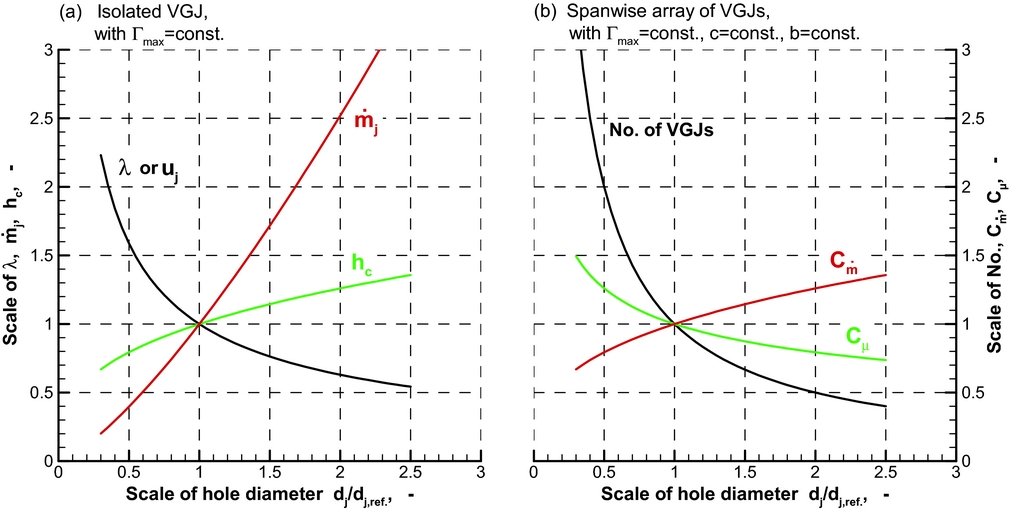
To derive similar laws for a spanwise array of VGJs, we furthermore assume they are applied to an otherwise plain flow with fixed chord c and span b. Again, the vortex strength Γmax is held constant while the diameter of the jet exit dj is varied. In contrast to a single VGJ, the increased diameter will also affect the number of VGJs needed to cover a certain span, since the distances in spanwise arrays, may that be co-rotating or counter-rotating arrays, scales linear with the diameter. If dj increases, the number of VGJs to control a fixed span b decreases. For an array, total  $\dot{m}_j$ can be expressed as ${C_{\dot m}}$, and $\dot{m}_j$ and λ together will scale C μ, such that from Equations (9) and (10) we can deduct
 $$\begin{equation}
{\rm No.\ of\ VGJs} \propto \frac{1}{d_j}\ {\rm and}\ {{C_{\dot m}} \propto \frac{{\dot m}_{j}}{d_{j}} \propto {d_{j}^{\frac{1}{3}}}}\ {\rm and}\ {{C_{\mu}} \propto {C_{\dot m}} \cdot {\lambda} \propto {d_{j}^{-\frac{1}{3}}}}.
\end{equation}$$
$$\begin{equation}
{\rm No.\ of\ VGJs} \propto \frac{1}{d_j}\ {\rm and}\ {{C_{\dot m}} \propto \frac{{\dot m}_{j}}{d_{j}} \propto {d_{j}^{\frac{1}{3}}}}\ {\rm and}\ {{C_{\mu}} \propto {C_{\dot m}} \cdot {\lambda} \propto {d_{j}^{-\frac{1}{3}}}}.
\end{equation}$$
Figure 22(b) shows the respective scaling. It can be seen that increasing dj is beneficial for C μ, but detrimental for  ${C_{\dot m}}$. As based on the discussion in Section 1.2, Equation (4), and the laws given above in Equation (11), the lift-gain-factor, LGF, will have a tendency to increase with increasing dj.
This scaling approach is not valid for large variations of the scale: Even if the vortex strength is held constant, the viscous core radius r vis and the variation of the vortex distance hc in a highly sheared flow will affect the ability of the vortex to transfer longitudinal momentum and, thus, flow control effectiveness e.g., ΔC L, max. Therefore, even when larger holes with less amplitude will create similarly strong vortices, at some point the vortices will be too far away from the wall and become inefficient.
In conclusion, an optimum size of VGJs must exist. However, the optimum is sensitive to the application and to the cost function, which might vary from application to application. Therefore, no general rule can be given. It is recommended, if testing time allows, to vary the size and amplitude of the VGJs in the application and find the most efficient and effective combination. From all geometrical variations that could be done, it seems the VGJ size is most sensitive to the application case and the cost function for assessment. Equations (9)-(11) are helpful as a guideline during such studies.
3.5 Design and optimisation including VGJs
One crucial problem for application of VGJs is the design and optimisation of macroscopic flows (e.g., aerofoils, wings) including the effect of VGJs. During design simulations, a short turnaround time is necessary for assessing the major sensitivities. In contrast, the VGJs are small structures in the boundary layer, which would require excessive grid resolution(Reference Mahmood and Radespiel25,Reference Mahmood, Scholz and Radespiel29) . An approach to circumvent this problem was devised by the Stockholm research group, using the parameterisation(Reference von Stillfried, Wallin, Johansson, Casper and Ortmanns33) already discussed in Section 3.4, and formulating a model(Reference von Stillfried, Wallin and Johansson31) that respects the integral features of the vortices (the Reynolds stresses and/or turbulent kinetic energy) in a spanwisely averaged sense. This model was calibrated by simulations with fully resolved VGJ structures(Reference Scholz, Casper, Mahmood, Wallin, Skoogh and Adden32). Once calibrated, the computational effort reduces to that of the reference case.
In Reference Scholz, Casper, Mahmood, Wallin, Skoogh and AddenRef. 32 the approach was applied to the two-element DLR-F15 aerofoil(Reference Wild18). The benefit of using VGJs upstream of a drooped spoiler was assessed, which is a complex optimisation problem, because optimum spoiler droop angle and the setting of the trailing-edge flap depend on the development of the boundary layer being influenced by the VGJs.
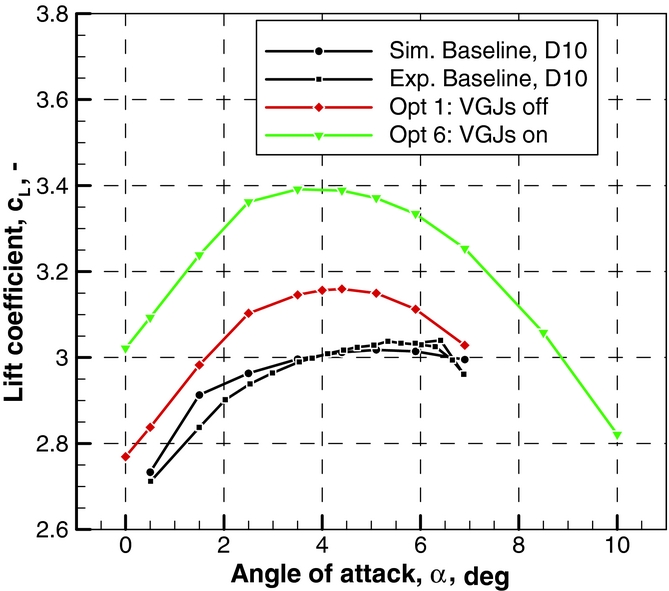
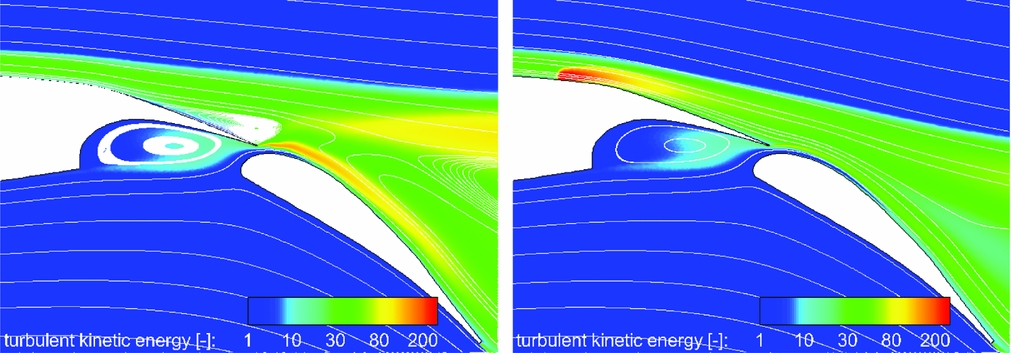
Figure 23 highlights results of this study as an example. In the case ‘D10’ the spoiler is drooped by 10° downward, but the flap setting is not adjusted and equals the so-called 2e-opt (refer to Reference WildRef. 18). This case can be regarded as the baseline case for comparison. The case ‘Opt 1’ is the result of an optimisation involving four parameters (spoiler droop angle, flap angle, gap, and overlap). The cost function is chosen, such that maximum lift occurs at around 5° AoA. As can be seen, optimising the spoiler droop in combination with the flap setting is beneficial and maximum lift increases. ‘Opt 6’ is an optimisation with the same parameters and the same cost function, but VGJs are applied just upstream of the spoiler hinge line by means of the aforementioned design model. In this configuration, the flow benefits from the active VGJs and maximum lift is increased. This is due to the ability to increase spoiler droop angle, because the VGJs prevent a separation at the main element trailing edge. This is shown in Fig. 24, where the left subfigure is the flow without the VGJs active. The flow does not follow the surface curvature generated by spoiler droop and separates. In the right subfigure, the input of turbulent kinetic energy upstream of the spoiler is clearly visible. This is the model representation of the existence of the longitudinal vortices. Due to this input, the flow now follows the drooped spoiler. Moreover, the turbulent shear flow over the flap and in the wake of the main element is significantly influenced by the VGJ.
Lift curves of two-element aerofoil with drooped spoiler; setting optimisation without (Opt 1) and with (Opt 6) VGJs represented by statistical model; data from Reference Scholz, Casper, Mahmood, Wallin, Skoogh and AddenRef. 32.
Streamlines and turbulent kinetic energy in the flow field without VGJs (left) and with (right) the statistical VGJ model applied; data from Reference Scholz, Casper, Mahmood, Wallin, Skoogh and AddenRef. 32.
4.0 CONCLUDING DISCUSSION
The previous sections reviewed current progress in the research on two prominent approaches of steady blowing, tailored to actively control the flow over high-lift devices. While the tangential blowing approach uses a slot along the whole wing span to generate largely scalable momentum overshoots close to the wall, the alternate method re-arranges momentum in strongly loaded boundary layers, by taking advantage of blowing from localised orifices, that can place longitudinal vorticity at desired locations. It appears very plausible that these very different approaches are also different in their potentials to provide extra lift.
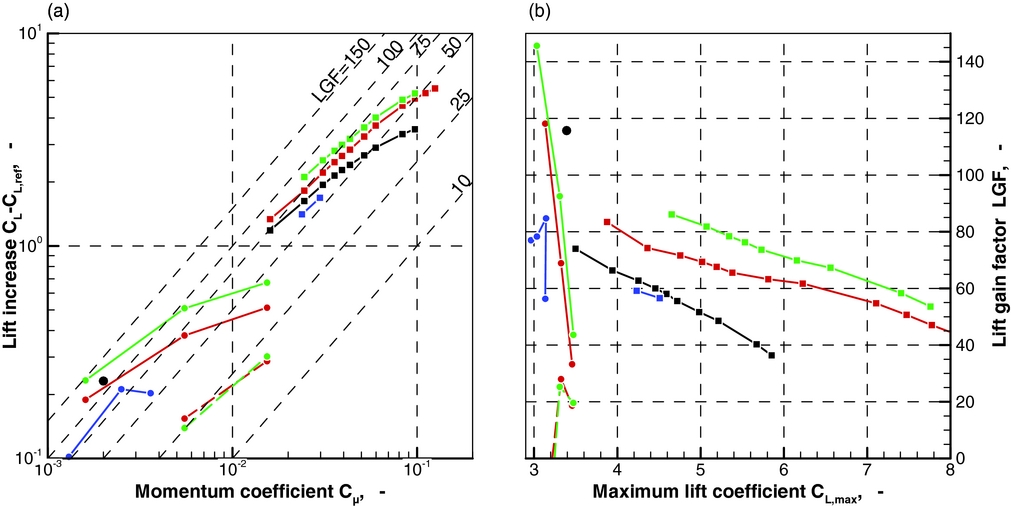
These potentials are compared and analysed with the help of Fig. 25, see legend in Table 1. The VGJs were used to delay flow separation and aerofoil stall on the DLR-F15 aerofoil with a slotted Fowler flap (two-element configuration). Cases 2(a)-(c) display applications to remove flow separation of a drooped spoiler, while Case 2(d) is a carefully designed application to delay leading-edge separation.
Comparison of lift increase and lift-gain-factor, LGF, for the different approaches of steady blowing: Coanda wall jet and vortex generator jets. Figure legend as defined in Table 1.

Significant scatter in the effectiveness of blowing is generally observed for our applications of VGJs. This may be attributed to the fact that Cases 2(b)-(d) represent VGJ applications without specific configuration modifications for flow control. In contrast, Case 2(a) is a configuration where the benefit of the VGJs was taken into account by numerical configuration optimisation. We believe that such approach can lead to both appreciable maximum lift coefficients with high lift gain factors. However, VGJs are limited in the maximum lift gains that can be generated. This is because VGJs are limited to rearrange momentum, which inherently requires momentum to exist at some place, where the vortices can have an influence. In other words, VGJs can only remove a flow separation of limited extent. While such local control can occasionally be very efficient, the maximum total effect is limited. It is also noted that the lift gain factors of our VGJs generally decrease as the maximum lift coefficient approaches the value of 3.5. This is attributed to the aerodynamic characteristics of well-designed two-element aerofoil, which feature highly loaded boundary layers at leading edge, main-wing trailing edge, and on the high-lift flap. These cannot be simultaneously controlled by a single set of VGJs. Nevertheless, our results indicate that VGJ devices are suited means for retrofit applications on existing high-lift devices, or they can be used to remove a local flow separation that would otherwise affect wing lift and drag.
The potentials of providing lift increases by tangential blowing are larger, as this technique can provide large flow turning on aerofoils and wings by exploiting the Coanda effect with the wall jet. Therefore, enhancements of lift coefficient in the range of 2-5 are possible, which makes the approach interesting for short take-off and landing (STOL) applications. Our results presented in Fig. 25 show that steady Coanda blowing can be tailored to achieve lift gain factors of around 80. Preliminary aircraft design computations of Reference Weiss, Heinze, Radespiel and RemaanRef. 36 indicate that these blowing efficiencies are essential in achieving acceptable direct operation cost for cruise-efficient STOL aircraft. We note that assessment on overall aircraft level is necessary to define some of the parameters associated with Coanda jet design, as outlined in Section 2.
We believe that further improvements of this technology are possible. A promising approach is to perform dynamical blowing, preferably with actuators that allow segmented operation along the span. Such actuation would offer the possibility to insert additional vorticity in traverse and longitudinal directions into the flow. We expect that this will further augment turbulent momentum exchange and affect vortex shedding observed for low blowing rates. Moreover, closed-loop control of Coanda blowing could further improve the technique, by adapting the overall blowing rate to the actual needs, by efficiently controlling vortex shedding and by further augmenting turbulent momentum exchange.
ACKNOWLEDGEMENTS
We acknowledge funding by the Deutsche Forschungsgemeinschaft DFG as part of the SFB 880 and for the grant KA 1808/1-1. Funding obtained within the programs IHK and M-Fly, ‘AeroNext,’ was provided by Federal Ministry of Economy, BMWi. Funding of the European Commission is also acknowledged, which was provided in the Smart Fixed Wing Aircraft program (SFWA), CfP projects ‘LEBox’ and ‘ATTESI.’