

Introduction
Public support for democracy was at a historic high when Peffley and Rohrschneider (Reference Peffley and Rohrschneider2003) wrote about political tolerance in 2003. One of the most noteworthy findings of their study is that while “most citizens across the world support democratic rights in the abstract … these same publics are usually considerably less likely to extend these rights to disliked groups” (Peffley & Rohrschneider, Reference Peffley and Rohrschneider2003, p. 243). They call this a “slippage” between support for democratic values and the application of political tolerance in a concrete situation.
The state of democracy is certainly less rosy today with populist leaders in European Union (EU) member states actively eroding democratic norms and freedoms (Norris & Inglehart, Reference Norris and Inglehart2019; Pappas, Reference Pappas2019). On the one hand, the discourse of far‐right populists and nativists shows little appreciation for the values of liberal democracy and often targets racial and religious minorities, which could fuel intolerance towards such groups. On the other hand, and given Europe's history, the resurgence of ultra‐nationalist, far‐right voices can feel threatening to those who value liberal democracy most dearly. As Popper (Reference Popper1971) warned us, a society that is tolerant of those who are intolerant risks its own destruction. This is likely to lead to higher levels of intolerance towards far‐right groups. Thus, it is essential to revisit the issue of political tolerance in light of major changes in the politics of advanced democracies in the last two decades.
The goal of this paper is to theorize new determinants of political tolerance and to empirically investigate the state of tolerance in Europe. Rather than measure support for the abstract principles of democracy or tolerance, we take a different route: we assess the state of democracy by measuring how tolerant citizens are towards the groups in society they dislike the most (e.g., Marcus et al., Reference Marcus, Theiss‐Morse, Sullivan and Wood1995; Sullivan et al., Reference Sullivan, Shamir, Walsh and Roberts1985). The main questions we ask are: What explains individual levels of tolerance in Europe? Which groups in society are the most likely targets of intolerance? The analysis employs original survey data collected as part of the EUENGAGE mass survey conducted in 2017 in 10 EU member states: Czech Republic, France, Germany, Greece, Italy, the Netherlands, Poland, Portugal, Spain and the United Kingdom.
Our analysis yields three main findings. First, we find that individuals who engage in conspiratorial thinking, which we define as the tendency to assign conspiratorial intent to various events, are less likely to tolerate disliked groups than those who are less prone to such a worldview. This suggests that conspiratorial thinking does not only instil distrust in scientific authorities and undermines the functioning of government, but it also erodes fundamental principles of liberal democracy such as political tolerance. Second, we find that there is a clear gap in tolerance between nationalists who hold exclusive national identities and cosmopolitans who have Europeanized identities with the latter being significantly more tolerant of groups they dislike than the former. Finally, our analysis shows that far‐right groups, such as neo‐Nazis/Fascists, are the least tolerated groups in society followed by Muslims.
We make several contributions to the literature. First, we assess the state of political tolerance in Europe with novel data. At a time when democratic norms are being questioned, we show whose political rights citizens are willing to curtail. Second, we theorize and identify new correlates of tolerance in Europe – conspiratorial thinking and cosmopolitanism – which are at least as important as traditional drivers of tolerance such as education and socialization into democratic norms.
We start by discussing the importance of political tolerance for democracy. We then review the literature on the determinants of tolerance among citizens. In the following section, we theorize the relationship between conspiratorial thinking and cosmopolitanism on one hand and political tolerance on the other. Then, in the results section, we provide a descriptive analysis of the least liked groups in the 10 countries in our sample followed by an empirical test of our theory. In the last section, we conclude the article.
Political tolerance: What is it and why does it matter?
We understand political tolerance as the willingness to allow the free articulation of interests and ideas in the political system of groups one opposes (Sullivan et al., Reference Sullivan, Piereson and Marcus1982). Like Sullivan et al. (Reference Sullivan, Shamir, Walsh and Roberts1985, p. 225), we define political intolerance as a “willingness to restrict a disliked group's democratic rights based on the content of their views.”
Political tolerance is crucial for liberal democratic theory, but there is a fundamental contradiction in liberal ideology regarding tolerance of the intolerant (Halikiopoulou et al., Reference Halikiopoulou, Mock and Vasilopoulou2013). In the Millian strand of liberalism, tolerance is unconditional and extends even to deeply unsavory ideas and unpopular groups. As Gibson (Reference Gibson and Goodin2011, p. 325) notes, “democracy is … a system in which institutionalized respect for the rights of political minorities to try to become a majority must exist. In particular, political minorities in a liberal democracy must be given the means of contestation—the right to try to convince others of the rightness of their positions”. This right extends to “deeply unpopular ideas, such as the need for a violent revolution or racism or Communism or radical Islam” (Gibson, Reference Gibson and Goodin2011, p. 326).
The Lockean strand of liberalism conditions tolerance on the tolerance of others (Halikiopoulou et al., Reference Halikiopoulou, Mock and Vasilopoulou2013). For example, one might question the wisdom of granting rights of contestation to groups with fascist or neo‐Nazi ideology which are racist and manifestly against liberal democracy. Popper's (Reference Popper1971) “paradox of tolerance” is a stern reminder of the dangers that such tolerance poses to liberal democracy. While it is beyond the scope of this paper to resolve the normative tensions inherent within liberal democratic theory, our empirical findings shed light onto the targets and purveyors of intolerance, thus helping us understand the state of intolerance in Europe today.
Generally speaking, political tolerance is usually regarded as essential for proper democratic functioning (Kirchner et al., Reference Kirchner, Freitag and Rapp2011; Peffley & Rohrschneider, Reference Peffley and Rohrschneider2003). It is a democratic principle without which “healthy and successful democracies” may not prosper (Marquart‐Pyatt & Paxton, Reference Marquart‐Pyatt and Paxton2007, p. 89). Gibson and Duch (Reference Gibson and Duch1993, p. 289) note that “without tolerance, widespread contestation is difficult, regime legitimacy is imperiled, and a numbing conformity can prevail”.
However, achieving political tolerance is challenging not least so because human beings are predisposed to not tolerate, that is, intolerance is the natural disposition of most people. This predisposition seems to run deep, too. In 1939, Dollard et al. (Reference Dollard, Miller, Doob, Mowrer and Sears1939) conceived of racial prejudice as operating outside conscious control. Stouffer (Reference Stouffer1955) and, more recently, Marcus et al. (Reference Marcus, Theiss‐Morse, Sullivan and Wood1995) conclude that intolerance is the more natural response to objectionable people or ideas, which could be due to the cognitive ease of developing prejudices against those who are not like us (Aboud, Reference Aboud1989).
It is important to note that not all patterns of intolerance are equally threatening to liberal democracy. The literature finds high levels of intolerance in all advanced democracies, but the systemic threat that it poses varies with how concentrated intolerance is on particular groups in society (Gibson, Reference Gibson and Goodin2011). If intolerance is high and if there is a great deal of agreement about the target of intolerance, the threat to liberal democracy is the greatest as there would be widespread agreement in the population for repressing the targeted group's rights. In contrast, if citizens are intolerant of different groups, which Sullivan et al. (Reference Sullivan, Piereson and Marcus1982) call “pluralistic intolerance,” the likelihood of scapegoating any particular group decreases.
Early studies on tolerance were mostly single‐country analyses of advanced industrial democracies (Sniderman et al., Reference Sniderman, Fletcher, Russell, Tetlock and Gaines1991; Sullivan et al., Reference Sullivan, Piereson and Marcus1979, Reference Sullivan, Piereson and Marcus1982; Weil, Reference Weil and Wasburn1991). Subsequent work has investigated tolerance in then‐newly democratized countries like Poland (Karpov, Reference Karpov1999), Estonia (Kaplan, Reference Kaplan and Tismaneanu1995) and Russia (Gibson, Reference Gibson1992, Reference Gibson1996; Gibson & Duch, Reference Gibson and Duch1993). Recent work takes a comparative perspective and includes analyses of tolerance across Western European countries (Weldon, Reference Weldon2006), Western and Eastern European countries (Marquart‐Pyatt & Paxton, Reference Marquart‐Pyatt and Paxton2007) and across established and new democracies from around the world (Peffley & Rohrschneider, Reference Peffley and Rohrschneider2003). Our study contributes to this comparative body of work on tolerance by focusing on 10 EU member states from both Western and Eastern Europe. Before we expound on our theoretical and empirical contribution, we first review the existing literature on the determinants of tolerance.
Determinants of tolerance
The existing literature on the determinants of tolerance can be grouped into three groups: sociodemographic, attitudinal and political/ideological.
Sociodemographic determinants
Tolerance does not come naturally to people; it is a learned reaction to social diversity and the role of education for tolerance has received much attention. Tolerance can be learned “either through increased contact with diverse groups” in society (Marquart‐Pyatt & Paxton, Reference Marquart‐Pyatt and Paxton2007, p. 93) or through socialization into democratic norms and values (Allport, Reference Allport1979). Education has consistently been found to be one of the strongest predictors of an individual's willingness to tolerate disliked groups (Stouffer, Reference Stouffer1955). While the precise mechanism is disputed, there is agreement that “[i]ndividual education increases familiarity with diverse ideas and with diverse people” which then increases tolerance (Marquart‐Pyatt & Paxton, Reference Marquart‐Pyatt and Paxton2007, p. 93). The role of education is further substantiated by the fact that the length of exposure to democratic norms and institutions shapes the levels of tolerance. Citizens from established democracies exhibit greater political tolerance because civil rights are more embedded and individuals have had more opportunities to apply these rights (Weil, Reference Weil and Wasburn1991). For instance, levels of tolerance have been found to be lower in Eastern Europe than in Western Europe or the United States, but the youngest cohorts who were socialized after the breakdown of Communism exhibit more tolerance than older cohorts (Marquart‐Pyatt & Paxton, Reference Marquart‐Pyatt and Paxton2007).
Previous studies have found other sociodemographic factors to be related to tolerance, but the findings are not consistent across countries and time. Earlier studies found tolerance to decrease with age (Karpov, Reference Karpov1999; Nunn et al., Reference Nunn, Crockett and Williams1978; Stouffer, Reference Stouffer1955; Sullivan et al., Reference Sullivan, Piereson and Marcus1982). Recently, only Peffley and Rohrschneider (Reference Peffley and Rohrschneider2003) find this effect; Marquart‐Pyatt and Paxton (Reference Marquart‐Pyatt and Paxton2007) and Weldon (Reference Weldon2006) do not. Women are found to exhibit lower levels of tolerance than men (Duch & Gibson, Reference Duch and Gibson1992; Nunn et al., Reference Nunn, Crockett and Williams1978) but not in all regions (Marquart‐Pyatt & Paxton, Reference Marquart‐Pyatt and Paxton2007). Weldon (Reference Weldon2006) examines if the working class is related to less tolerance, but does not find an effect. Furthermore, urban dwellers have more opportunities for contact with diverse people and ideas than those living in rural areas, which should increase their tolerance (Wilson, Reference Wilson1991). Religiosity is a potential driver of tolerance as hardened religious beliefs could lead to intolerance (Marquart‐Pyatt & Paxton, Reference Marquart‐Pyatt and Paxton2007).
Attitudinal determinants
Among attitudinal factors, threat perceptions are seen as a major driver of intolerance (Gibson & Gouws, Reference Gibson and Gouws2002; Huddy et al., Reference Huddy, Feldman, Taber and Lahav2005). Individuals can perceive a disliked group as posing a threat to the values of their in‐group, their status in society, or the legal order more generally (Marquart‐Pyatt & Paxton, Reference Marquart‐Pyatt and Paxton2007, p. 94). Although citizens who feel threatened by a specific group could prioritize upholding abstract democratic principles, it is more likely for threat perceptions to override democratic norms (McClosky & Brill, Reference McClosky and Brill1983; Stouffer, Reference Stouffer1955; Sullivan et al., Reference Sullivan, Shamir, Walsh and Roberts1985). And the more threatened people feel, the more likely they are to be intolerant.
Furthermore, disliked groups can vary in the extent to which they are a threat to liberal democracy, real or perceived. Petersen et al. (Reference Petersen, Slothuus, Stubager and Togeby2011) argue that citizens are intolerant towards groups that – from their perspective – pose a greater threat to democracy, for instance because they violate democratic norms. In contract, norms of reciprocity lead citizens to be more tolerant of groups they dislike but which abide by democratic norms themselves. For example, Petersen et al. (Reference Petersen, Slothuus, Stubager and Togeby2011) find that Danish citizens are most intolerant of groups that are indeed perceived as a greater threat to democracy.
Previous research also relates citizens’ attitudes towards democracy to their level of tolerance. Support for democracy (Marquart‐Pyatt & Paxton, Reference Marquart‐Pyatt and Paxton2007), democratic norms (Peffley & Rohrschneider, Reference Peffley and Rohrschneider2003) and satisfaction with democracy (Weldon, Reference Weldon2006) have been found to correlate positively with tolerance.
Political/ideological determinants
While socialization in democratic norms leads to a better understanding of others and, in turn, more tolerance, civic engagement is important because people can learn to apply tolerance by practicing the freedoms of democracy. For instance, Peffley and Rohrschneider (Reference Peffley and Rohrschneider2003, p. 244) have found that individuals who display “democratic activism” by engaging in political activities such as petitions, boycotts or who partake in movements display greater tolerance than individuals who eschew democratic engagement. Obviously, this is unlikely to hold if political activism is driven by resentment of another group in society as is oftentimes the case with supporters of populist far‐right causes.
Moreover, it is important to note that tolerance is not just contingent on citizens’ actual political involvement but also on political efficacy – the extent to which they believe that they could influence political processes – irrespective of whether they practice activism (Duch & Gibson, Reference Duch and Gibson1992). This is important for the perception of threat that a disliked group might pose. Having confidence in one's capability of influencing policy is likely to reduce the potentially negative effects of the presence of disliked groups in the policy process. In contrast, the prospect of giving political power to disliked groups would be more threatening to those who already believe that they have little control over what happens in the political arena. By allowing members of a disliked group to influence policy, they become even more vulnerable to adverse outcomes from a policy‐making process over which they have little control to begin with.
Tolerance is also shaped by ideological orientations. They play a central role when it comes to which groups are disliked, appear threatening and are not tolerated. This is an important reason why content controlled measures of tolerance are key; such measures are sensitive to the fact that left leaning and right leaning citizens are intolerant of different groups (Crawford & Pilanski, Reference Crawford and Pilanski2014; Marcus et al., Reference Marcus, Theiss‐Morse, Sullivan and Wood1995; Sullivan et al., Reference Sullivan, Piereson and Marcus1982). For instance, Lindner and Nosek (Reference Lindner and Nosek2009) find right leaning voters in the United States to be more intolerant than left leaning voters, but they use fixed target groups (e.g., Muslims) to test tolerance among left and right leaning voters. Crawford and Pilanski (Reference Crawford and Pilanski2014), using a content‐controlled measure, find US voters to be intolerant towards groups in opposition to their own ideological orientation. Beyond the target of intolerance, people on the extremes of the ideological spectrum tend to be more intolerant than political moderates (van Prooijen & Krouwel, Reference van Prooijen and Krouwel2019)
Other orientations towards politics also matter for tolerance. Marquart‐Pyatt and Paxton (Reference Marquart‐Pyatt and Paxton2007) argue that interest in politics enhances someone's desire to engage in a complex issue such as tolerance. In turn, a better understanding of abstract democratic norms such as tolerance should equip people with a willingness to apply them in concrete situations. Marquart‐Pyatt and Paxton (Reference Marquart‐Pyatt and Paxton2007) find that interest in politics increases tolerance in the United States and in Western Europe, but not in Eastern Europe.
Theory
The main theoretical contribution of this paper is to postulate and then test a relationship between political tolerance on one hand and attitudes towards the political system on the other. Specifically, we argue that conspiratorial thinking and cosmopolitanism are important determinants of tolerance.
Conspiratorial thinking
Conspiracy theories seem to be spreading like wildfire as of late and have found sympathetic ears even in highest echelons of power in the United States and Europe (Uscinski, Reference Uscinski2019; Uscinski & Parent, Reference Uscinski and Parent2014). Prior research has shown that conspiratorial thinking among citizens leads to a host of adverse social and political consequences, including reduced intention to engage in politics (Jolley & Douglas, Reference Jolley and Douglas2014), increased prejudice (Swami, Reference Swami2012) and political extremism (van Prooijen et al., Reference van Prooijen, Krouwel and Pollet2015). We argue that conspiratorial thinking is also a central part of the political tolerance story. To understand why, we first need to discuss what conspiracy theories are and what psychological role conspiratorial thinking plays.
A conspiracy theory, according to Uscinski and Parent's (Reference Uscinski and Parent2014, p. 32) standard definition, is an “explanation of historical, ongoing, or future events that cites as a main causal factor a small group of powerful persons, the conspirators, acting in secret for their own benefit against the common good.” Conspiratorial thinking, in turn, can be described as a worldview, ideological orientation or belief system that is distinct from the extent to which an individual believes a specific conspiracy theory. While people with pronounced conspiratorial thinking are more likely to believe specific conspiracy theories, they do not necessarily believe all conspiracy theories. The key point for our purposes is that conspiratorial thinking – rather than belief in a specific conspiracy – is a dimension that shapes how people view and interpret the political world more generally (Douglas et al., Reference Douglas, Uscinski, Sutton, Cichocka, Nefes, Ang and Deravi2019; Wood et al., Reference Wood, Douglas and Sutton2012). Conspiratorial thinking leads individuals to interpret politics in a distinctly biased way, namely one that makes them more susceptible to conspiracy theories as well as more likely to attach conspiratorial intent and explanations to various actors and events.
Why should conspiratorial thinking affect the political tolerance of disliked groups? In order to answer this question, we need to discuss why people believe in conspiracy theories in the first place.
One of the main psychological functions of conspiratorial thinking is to make sense of social realities that are threatening or distressing (Douglas et al., Reference Douglas, Uscinski, Sutton, Cichocka, Nefes, Ang and Deravi2019; Uscinski & Parent, Reference Uscinski and Parent2014). When faced with chaotic and hazardous events such as natural disasters, epidemics, financial crises or even with social change that threaten people's sense of control over their own environment, some people respond by turning to conspiracy theories (van Prooijen & Acker, Reference van Prooijen and Acker2015). The reason for this, as Sullivan et al. (Reference Sullivan, Landau and Rothschild2010, p. 438) have argued, is that “conspiracy theories enable individuals to focalize diffuse threats to their perceived control by linking together apparently random negative events in a direct causal chain tracing back to a clearly identifiable enemy.” The focalization of the threat serves to restore some measure of control in people's lives, thus providing a psychological relief.
However, and this is crucial for our theory, the need to control their environment leads those high in conspiratorial thinking to inflate the political threat that the most disliked groups pose. The reason for the threat exaggeration is foundational to the psychological role that conspiracy theories play; they provide a sense of control precisely because, as Sullivan et al. (Reference Sullivan, Landau and Rothschild2010, p. 435) argue, “seeing an enemy as highly influential in one's life reduces the perceived total hazard in one's environment and thus sustains a sense of personal control.” Moreover, the need for control also leads to scapegoating and the focalizing of responsibility for distressing events, because, according to Rothschild et al. (Reference Rothschild, Landau, Sullivan and Keefer2012, p. 1149), “scapegoats, in contrast to chaotic and impersonal forces, can be clearly identified, counteracted, and (at least) understood.”
The implications of these insights from psychological studies for the link between conspiratorial thinking and political tolerance are far‐reaching. The antecedent cause of conspiratorial thinking might be the need to gain some control over one's environment, but the upshot is an identifiable enemy or scapegoat whose threat is exaggerated and, thus, needs to be counteracted. Such enemies are likely to be found in social groups that are deeply disliked by conspiratorially minded individuals and, in a democratic system, such enemies can be counteracted by limiting their representation in democratic institutions. In more extreme cases, conspiratorial thinking can result in radicalized and extremist behaviour against the target group (Douglas et al., Reference Douglas, Uscinski, Sutton, Cichocka, Nefes, Ang and Deravi2019).
It is important to note that the key actors in various conspiracy theories need not necessarily come from or be coterminous with the disliked group. For example, Swami (Reference Swami2012) has shown that belief in Jewish conspiracy theories among Malays in Malaysia is linked to increased racism against ethnic Chinese in the country, suggesting that conspiratorial thinking can lead to intolerance of disliked groups in society independent of the alleged conspirators in any given theory.
In sum, conspiratorial thinking leads to exaggerated threat perceptions and scapegoating of disliked groups. From this perspective and for those with pronounced conspiratorial thinking, denying disliked groups political representation is a way to regain control and deal with a perceived threat. This leads to our first hypothesis.
H1: In a comparison of individuals, those who are prone to conspiratorial thinking are less likely to tolerate disliked groups in society than those who are not.
Nationalist versus cosmopolitan identity
We argue that whether individuals identify solely with their nation or whether they have cosmopolitan identities has significant implications for their levels of political tolerance (see also Weldon, Reference Weldon2006). The biggest issues of the day, ranging from Brexit to the perceived threat from migrants to the future of European integration, revolve around the desire to maintain national distinctiveness in a globalizing world. As a result, a major “cosmopolitan–nationalist” cleavage has emerged in contemporary European societies in the last two decades that structures much of the political contestation (Grande & Kriesi, Reference Grande, Kriesi and Risse2014). At the heart of this new cleavage is a cultural clash between universalistic and particularistic principles (Hooghe & Marks, Reference Hooghe and Marks2018).Footnote 2 Nationalists, who emphasize the particularism of their nation, are threatened by European integration – and the consequent loss in national sovereignty – and by the increased cultural diversity of European societies while the cosmopolitans welcome both. As such, cosmopolitanism in Europe is intrinsically tied to the project of European integration (Archibugi, Reference Archibugi, Archibugi, Held and Köhler1998; Kuhn et al., Reference Kuhn, Solaz and van Elsas2018; Risse, Reference Risse2010), and identities that are inclusive of European identification are markers of contemporary European cosmopolitanism (Pichler, Reference Pichler2009).
But why should cosmopolitan values lead to more political tolerance than nationalism? The primary reason for this is that cosmopolitan values are innately linked to tolerance of disliked groups. As Appiah (Reference Appiah2019, p. 23) has argued, “in respecting the rights of others to be different from themselves, cosmopolitans extend that right to the uncosmopolitan. The thought that every human being matters—the universalism at the heart of cosmopolitanism—is not optional.” The principle that Appiah exhorts implies tolerance of even deeply disagreeable ideas and groups. This same principle simply does not apply to nationalists. One objection to this rather abstract and rosy portrait of cosmopolitans is that it is overly normative and imbued with positive values that have little resemblance to how cosmopolitans treat those they dislike. Indeed, some scholars have suggested that cosmopolitanism is an elite concept embraced by those who seek to stand separate from society (Calhoun, Reference Calhoun2002) and whose lifestyles are a marker of social class (Delhey et al., Reference Delhey, Deutschmann and Cirlanaru2015).
However, there is evidence that cosmopolitans “practice what they preach” – for example, they are more likely to support international redistribution (Bechtel et al., Reference Bechtel, Hainmueller and Margalit2014; Kleider & Stoeckel, Reference Kleider and Stoeckel2019; Kuhn et al., Reference Kuhn, Solaz and van Elsas2018). More generally, to the extent that cosmopolitans adhere to the norms of tolerance implicit in the universalism of cosmopolitanism, we should see a marked difference in political tolerance between nationalists and cosmopolitans with the latter being more tolerant of groups they dislike. This leads to our second hypothesis:
H2: In a comparison of individuals, those who have a cosmopolitan identity are more likely to tolerate disliked groups in society than those who have an exclusive national identity.
Data and measurement
Data
In order to explore the determinants of political tolerance in Europe, we rely on survey data collected by Kantar Public as part of the EUENGAGE project. Respondents were sampled from Kantar Public's panel and completed the survey online.Footnote 3 The mass survey was conducted in 2017 in 10 EU member states: Czech Republic, France, Germany, Greece, Italy, the Netherlands, Poland, Portugal, Spain and the United Kingdom. While this survey does not include all EU member states, it includes the most sizable countries and has two Eastern European EU member states. The limited number of countries, however, precludes an investigation of country‐level determinants of tolerance.
Dependent variable
The dependent variable of interest is political tolerance, which we define as “a willingness to permit the expression of ideas or interests one opposes” (Sullivan et al., Reference Sullivan, Piereson and Marcus1982, p. 2). Our operationalization of this concept follows Sullivan et al.’s (Reference Sullivan, Shamir, Walsh and Roberts1985) influential measurement strategy of using content‐controlled measures of tolerance with the least‐liked group approach. Specifically, respondents are first asked to indicate which groups in society they dislike the most and then are asked whether the rights and privileges of members of such groups should be curtailed. We consider respondents as politically tolerant when they oppose curtailing the democratic rights of their most disliked group.
Prior to Sullivan et al. (Reference Sullivan, Shamir, Walsh and Roberts1985), the common empirical strategy for studying tolerance was to measure tolerance for a predefined group of respondents (e.g., atheists or Communists) (Stouffer, Reference Stouffer1955). Such an approach had an obvious limitation: members of predefined groups would be unlikely to exhibit any intolerance toward their group even if they were otherwise intolerant of other societal groups (Gibson, Reference Gibson and Goodin2011).
The specific question we rely on for our content‐controlled measure of political tolerance is the following:
-
• Which of the groups listed below do you like the least, or is there some other group you like even less?
The options include Fascists, Neonazis, Communists, Homosexuals, Jews, Anti‐globalisation activists, Muslims, Blacks, Roma, Others (Please Specify).Footnote 4
Then, in a separate question, the respondents were asked:
-
• Please indicate to what extent you agree or disagree with the following statements.
[Least liked group] should be banned from electing representatives in parliament.
The answer options ranged from strongly agree, somewhat agree, somewhat disagree, strongly disagree. We recoded the variable so higher values indicate more tolerance.Footnote 5
Independent variables of interest
The main independent variables of interest are conspiratorial thinking and cosmopolitanism. To measure conspiratorial thinking, we follow common practice in the literature and use three survey responses adapted from McClosky and Chong (Reference McClosky and Chong1985) to construct a single scale (Edelson et al., Reference Edelson, Alduncin, Krewson, Sieja and Uscinski2017; Uscinski & Parent, Reference Uscinski and Parent2014). Specifically, we rely on the following questions: To what extent do you agree or disagree with each of the following statements?
-
(1) Actually, it is not the government that runs the country: we don't know who pulls the strings.
-
(2) The people think they govern themselves, but they really don't.
-
(3) I often feel that the really important matters are decided behind the scenes, by people we never even hear about.
The answer options ranged from strongly agree, somewhat agree, somewhat disagree, strongly disagree, so higher values indicate higher propensity to believe in conspiracy theories. The conspiratorial thinking scale is the average of the three items (Cronbach's alpha = 0.73). We address the concern that this measure might tap into populism rather than conspiratorial thinking in two ways. In a first robustness check we measure conspiratorial thinking with an alternative item, namely agreement with the following statement: A secretive power elite with a globalist agenda is conspiring to eventually rule the world through an authoritarian world government, or New World Order. In a second robustness check, we additionally control for respondents who support populist parties (following the coding of Rooduijn et al., Reference Rooduijn, Van Kessel, Froio, Pirro, De Lange, Halikiopoulou, Lewis, Mudde and Taggart2019).
Cosmopolitanism is operationalized through European identification in line with Pichler (Reference Pichler2009) and Kuhn et al. (Reference Kuhn, Solaz and van Elsas2018). Although a variety of measures are used to operationalize cosmopolitanism in the literature, cosmopolitanism in Europe is tightly coupled with openness towards European integration (Pichler, Reference Pichler2009; Risse, Reference Risse2010, p. 47), among other things.Footnote 6 Using European identity (rather than, for instance, support for the EU), is advisable because this is a more stable measure over time and is less likely to be influenced by short‐term variation in EU performance (Kuhn et al., Reference Kuhn, Solaz and van Elsas2018, pp. 1765−66). When it comes to people's political identities, we follow Hooghe and Marks (Reference Hooghe and Marks2004) and distinguish between those who conceive of their collective identity in exclusively national terms and those who have a Europeanized identity. The former only think of themselves as citizens of their country while the latter have a more cosmopolitan self‐conception which allows them to identify with their nation and with Europe simultaneously. Empirically, the decisive consideration is whether citizens see the two identities – national and European – as compatible or as mutually exclusive, hence the dichotomous coding approach (Hooghe & Marks, Reference Hooghe and Marks2004; Risse, Reference Risse2010). Thus, to measure cosmopolitan identity, we rely on the following question:
Do you consider yourself…
-
• [Nationality] and not European
-
• More [Nationality] than European
-
• Equally [Nationality] and European
-
• More European than [Nationality]
-
• European and not [Nationality]
We created a dummy variable such that those individuals who selected “[Nationality] and not European” were coded as having an exclusive national identity (0) while all the rest were coded as having a cosmopolitan identity (1). In our sample, almost 20 percent of respondents identify exclusively with their nationality. We also conducted a robustness check with a measure for cosmopolitanism that asks respondents whether they believe that globalization has a positive or negative effect rather than referring to Europe.
Control variables
In this section we operationalize the control variables that the literature has found to be correlated with tolerance. To account for the role of education in increasing tolerance, we rely on a variable that indicates the highest degree or level of education ranging from elementary school or below to post‐graduate degree. An individual's level of tolerance might also differ depending on the political context in which formative education years took place. Marquart‐Pyatt and Paxton (Reference Marquart‐Pyatt and Paxton2007, p. 90) hypothesize that “individuals who were educated under democracy should be more tolerant than those who were educated under less democratic time periods.” We replicate their analysis and differentiate between individuals who had no education in either the communist “thawed” period of Soviet history or the free period, those who had education in the ‘thawed’ period of Communism, and those who were either fully or partially educated in the democratic period (see Supporting Information Appendix for full coding scheme).
Similarly, activism and interest in politics have been found to bolster tolerance. We control for activism with a variable that counts the number of political organizations that respondents are active in (0–3). To measure political efficacy, we use a survey item that asks respondents if they believe that people like them ‘have no influence on what the government does’. There are four response categories; we recode the variable so that higher values indicate a higher sense of political efficacy. We measure interest in politics by averaging the frequency of news consumption about politics in newspapers, on television, and on social media.
Threat perceptions are an important variable in the extant literature on tolerance. We face a similar limitation as previous researchers and cannot control for threat perceptions directly (Marquart‐Pyatt & Paxton, Reference Marquart‐Pyatt and Paxton2007; Peffley & Rohrschneider, Reference Peffley and Rohrschneider2003). We follow Marquart‐Pyatt and Paxton's (Reference Marquart‐Pyatt and Paxton2007, p. 97) approach and use interpersonal trust as a proxy. This variable is a good proxy because, as Sullivan and Transue (Reference Sullivan and Transue1999, p. 641) argue, “When people do not trust their fellow citizens, elections and transitions of power appear to be far more dangerous. Citizens may fear that losing an election will mean losing all access to political power”. We use a standard question that asks respondents the following: Generally speaking, would you say that most people can be trusted, or that you can't be too careful in dealing with others? The options were ‘Most people can be trusted’ (0) and ‘You can't be too careful’ (1).
Our survey also includes a question about the extent to which respondents feel threatened by immigrants, which we use as an alternative measure of threat. The specific survey question asks the following:
To what extent do you agree or disagree with the following statements about the general impact of immigration on (our country) and (nationality) people? Immigrants increase the likelihood of a terrorist attack in (our country).
We recoded this variable so higher values indicate greater threat (1: strongly disagree to 4: strongly agree). We use this measure in an additional analysis because it captures perceived threat more directly (but because of the narrow focus, we do not employ it in our main analysis).
Ideological left‐right self‐placement is measured using a standard item that runs from 0 (very left leaning) to 10 (very right leaning). We control for citizens’ attitudes toward democracy with an item that taps into satisfaction with democracy.
We also control for sex (0: male; 1: female), age and religiosity. The Supporting Information Appendix provides more details on the question wording and coding of all variables.
Results
Before we discuss the regression results, we present a descriptive analysis of political tolerance at the aggregate level by showing levels of tolerance across countries. All the figures presented below were constructed using country weights.
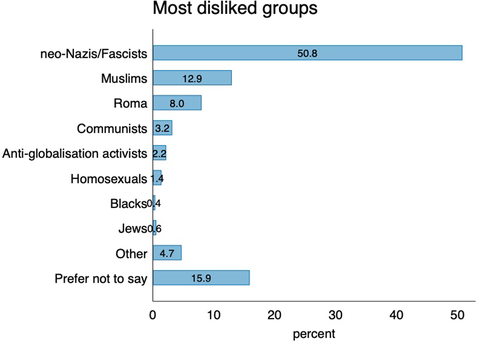
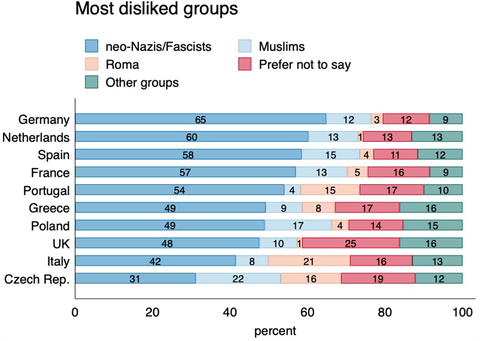
Figure 1 presents the most disliked groups and the corresponding percentages pooled for all the ten countries surveyed. For half of all respondents, neo‐Nazis/Fascists are the most disliked group of people, followed by Muslims (12.9 per cent), the Roma (8 per cent) and other groups. For easier interpretation, Figure 2 collapses the smaller categories and shows the most disliked groups for each of the ten countries in our sample. While there is considerable variation across Europe, in each country neo‐Nazis/Fascists are the most disliked group, followed by Muslims. Portugal and Italy are exceptions to this in the sense that the Roma are even more disliked than Muslims. Germany is home to the largest percentage of respondents who dislike neo‐Nazis/Fascists the most, with two‐thirds selecting this group.Footnote 7
Distribution of the most disliked groups pooled for all countries. [Colour figure can be viewed at wileyonlinelibrary.com]

Distribution of the most disliked groups for each country. [Colour figure can be viewed at wileyonlinelibrary.com]

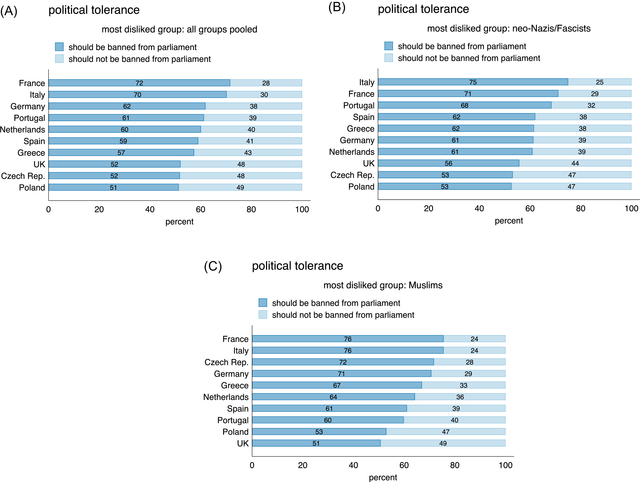
How tolerant are people of their most disliked group? Figure 3 depicts the cross‐national levels of political toleranceFootnote 8 separately for (a) all disliked groups, (b) for neo‐Nazis/Fascists and (c) for Muslims. In every country surveyed, more than half of the respondents are willing to deny the basic democratic right of representation in parliament to those they dislike the most (Figure 3A). On average, three‐fifths of respondents are willing to deny their most disliked group parliamentary representation.
Cross‐national levels of political tolerance for various disliked groups. [Colour figure can be viewed at wileyonlinelibrary.com]

However, political intolerance seems to be somewhat more widespread against Muslims (Figure 3C). Specifically, on average, 62 percent of those who dislike neo‐Nazis/Fascists would deny representation to them, while this number is 66 percent for those who dislike Muslims the most. Moreover, in every country the majority of respondents who identified Muslims as the most disliked group were also ready to deny representation to this group in parliament. What explains individual levels of tolerance across Europe? To answer this question, we now turn to regression analysis.
Regression analysis
Method
We rely primarily on multilevel models with random intercepts to account for the clustering of respondents within countries. Given the ordinal nature of our dependent variable, we employ ordered logit models. For robustness checks, we also run our models with fixed‐effects to account for any country‐specific factors, and with clustered standard errors. The statistical and substantive significance of our main results remains identical regardless of model specification. Supporting Information Appendix Table A2 (online) includes all alternative model specifications and robustness checks. To probe further whether the data support the mechanisms that we outlined in the theory section, we use structural equation models and discuss the results after the multilevel regression analysis.
In order to simplify the substantive interpretation of the regression results, we follow Gelman's (Reference Gelman2008) approach for standardizing independent variables. All the continuous variables are rescaled by subtracting their means and then dividing them by two standard deviations (rather than just one). Dummy variables are simply centred by subtracting their means. The standardized regression coefficients, as Gelman (Reference Gelman2008, p. 2868) indicates, “correspond to two‐standard‐deviation changes (roughly, from the low to the high end) of each numeric input, or the difference between the two conditions for binary inputs.” As a result, the sizes of the coefficients are directly comparable, which is the major advantage of this approach.
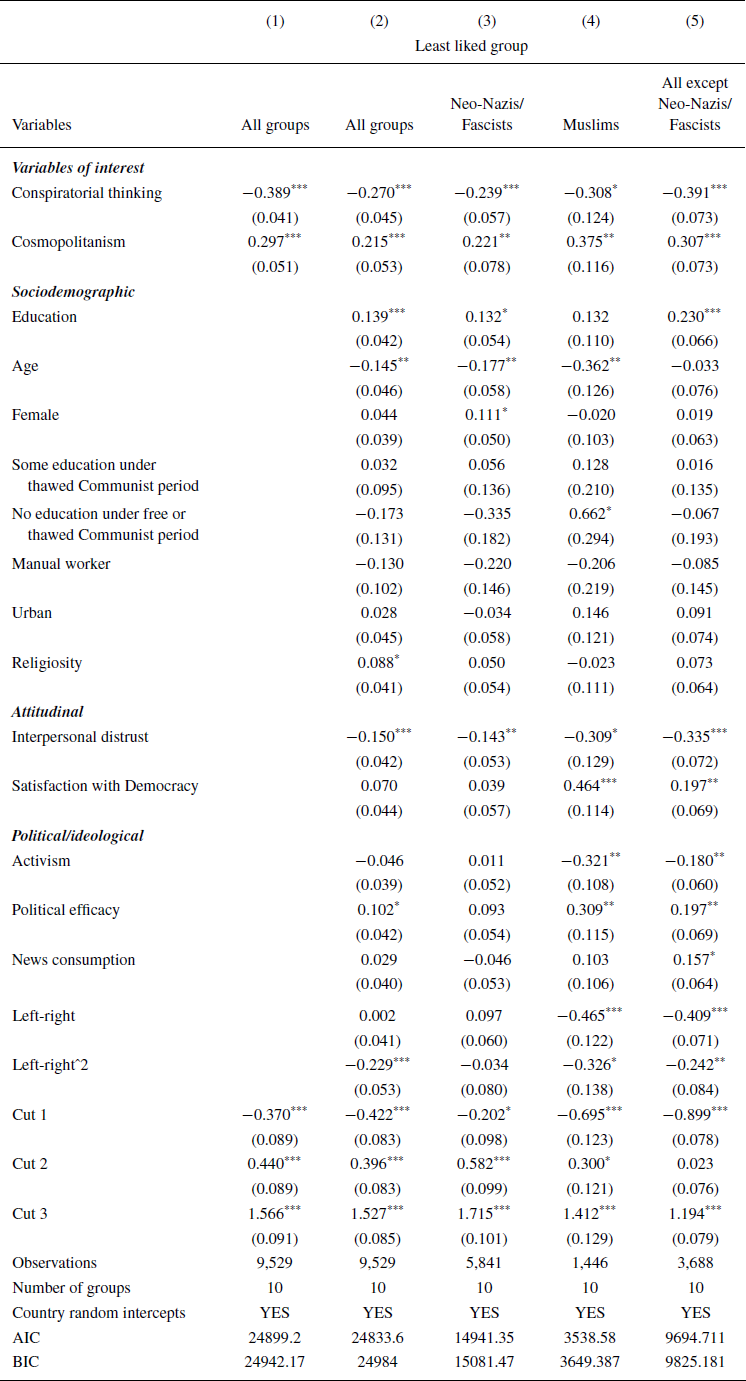
Table 1 presents the standardized coefficients from the multilevel ordered logit models. Specifically, model 1 includes only the key variables of interest while model 2 controls for various factors that the extant literature has found to be important determinants of political tolerance. To test whether the target group of intolerance alters how our key independent variables affect tolerance, models 3–5 present regression results separately for neo‐Nazis/Fascists (model 3), Muslims (model 4) and all groups except neo‐Nazis/Fascists (model 5).
Determinants of tolerance – Multilevel ordered logit regression results

Note: Coefficients show log‐odds. Standard errors in parentheses, *p < 0.05; **p < 0.01; ***p < 0.001. Reference categories: exclusive national identity, male, fully or partially educated under democracy, non‐manual worker, rural, interpersonal trust. Standardized independent variables.
The results paint a rather clear picture. The most consistent correlates of tolerance are conspiratorial thinking and cosmopolitanism. These two variables not only remain statistically significant across different model specifications, but they also have a large substantive importance as can be seen by the size of the coefficients in Table 1. In line with Hypothesis 1, those who score higher on the conspiratorial thinking scale are less tolerant. Individuals who have a cosmopolitan identity inclusive of European identification are significantly more tolerant than those who only identify with their nation, which supports our second hypothesis.
In terms of the substantive importance, moving from a low to a high value of Conspiratorial thinking decreases the log‐odds of being tolerant by 0.270, while Cosmopolitanism increases the log‐odds by 0.215 (model 2). The effects can also be expressed in terms of odds ratios. An odds ratio above one means that an increase in an independent variable increases the odds of a tolerant position. An odds ratio below one implies that it is less likely for a respondent to express a tolerant response. An increase in conspiratorial thinking decreases the odds of a tolerant response (odds ratio = 0.764). Cosmopolitanism increases the odds of a tolerant response (odds ratio = 1.240). These effects are at least as substantively important as those of traditional drivers of tolerance such as Education, Interpersonal distrust and Political efficacy.
What is the role of the traditional determinants of political tolerance? Consistent with the literature (Marquart‐Pyatt & Paxton, Reference Marquart‐Pyatt and Paxton2007; Peffley & Rohrschneider, Reference Peffley and Rohrschneider2003), we find that more education is related to substantively higher levels of tolerance. However, this effect is statistically insignificant for Muslims as the target of intolerance, suggesting that more educated and less educated Europeans have similar levels of tolerance for this group. Older people tend to be less tolerant than younger people, although the effect of age is statistically insignificant for model 5 which excludes neo‐Nazis/Fascists. Our analysis also takes into account that some respondents in Eastern Europe were socialized under Communism. We replicate Marquart‐Pyatt and Paxton's (Reference Marquart‐Pyatt and Paxton2007) cohort analysis to account for the impact that contact with democratic institutions might have on tolerance. Our reference category are respondents who were either fully or partially educated under democracy (i.e., all respondents in Western Europe and the youngest cohort in Eastern Europe). There is little evidence to suggest that older cohorts in Poland and in the Czech Republic who had little education under democracy are less tolerant than cohorts socialized into democratic norms across Europe. If anything, older cohorts of Eastern Europeans who dislike Muslims seem to be more tolerant of them (model 4).Footnote 9
The dichotomous variable for females is statistically insignificant for most models, suggesting that there are no consistent differences in tolerance between men and women across all disliked groups. Higher levels of religiosity are related to more political tolerance in our main model (model 2), but there is no statistically significant relationship between Religiosity and tolerance in the disaggregated analysis (models 3–5). Urban location and Manual worker do not reach statistical significance in any of our models.
From the attitudinal variables, Interpersonal distrust, which we use as a proxy for threat perceptions, is statistically significant and has a substantively important effect on political tolerance. Satisfaction with democracy is not related to more tolerance when all disliked groups are analyzed (model 2), but this variable exerts a substantively and statistically significant effect in models 4 and 5.
As for political/ideological determinants, we find that political efficacy is positively related to tolerance in most models, which is in line with previous research (Duch & Gibson, Reference Duch and Gibson1992). Activism, however, is not positively related to tolerance. In fact, for those who dislike Muslims or any other group except neo‐Nazis/Fascists, the relationship between activism and tolerance is negative and statistically significant. This is consistent with studies that show that civic engagement can generate not only social capital and generalized trust but also particularized trust which depresses tolerance (Iglič, Reference Iglič2010). News consumption is not consistently related to tolerance when neo‐Nazis/Fascists are included in the analysis, indicating that interest in politics does not necessarily translate into more tolerance. However, more news consumption is positively related to tolerance for those who dislike any other group except neo‐Nazis/Fascists. The effect of ideology on tolerance is curvilinear as indicated by the statistically significant effect of the squared term for left‐right orientations. Individuals on the extreme ends of the ideological spectrum are less tolerant than those in the middle, except for respondents whose least liked group is neo‐Nazis/Fascists. This is unsurprising because those who are further to the right ideologically are more tolerant of far‐right groups (model 3).
Further robustness checks and mediation analysis
In this section, we discuss the results of a number of additional robustness tests including alternative measures for the key variables of interest and of structural equation models with mediation analysis.
While we use a common conspiratorial thinking measure, one of the items used to construct this variable might be tapping into populist attitudes (i.e., The people think they govern themselves, but they really don't). To disentangle the effect of conspiratorial thinking from populist attitudes, we employ a two‐pronged approach. First, we use a more targeted measure of conspiratorial thinking which asks respondents if they believe that a ‘secretive power elite’ is conspiring to rule the world (see Supporting Information Appendix for details).
Second, we created a dummy variable for those who either voted for or feel close to a populist party.Footnote 10 Models 1 and 3 in the appendix (Table A2) present the regression output. Our results are robust to using the alternative measure of conspiratorial thinking and to controlling for populism – conspiratorial thinking is negatively related to tolerance and this effect is highly statistically significant.
Next, our main measure of cosmopolitanism relies on Europeanized identity. While other scholars have taken a similar approach (e.g., Kuhn et al., Reference Kuhn, Solaz and van Elsas2018; Pichler, Reference Pichler2009), it is conceivable that those with a strong European identity might favour a closed off Europe. Thus, we employ an alternative measure of cosmopolitanism which asks respondents on a scale from zero to ten whether they believe that globalization has a positive or a negative effect. We recode this variable so higher values indicate more cosmopolitanism. Our main finding is robust to this alternative measure of cosmopolitanism (see Supporting Information Appendix, Table A2, model 1).
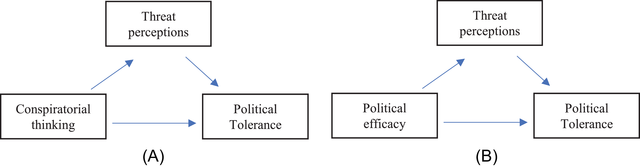
We next turn to structural equation models (SEM) to directly test one of the key implications of our theory, namely that conspiratorial thinking leads people to inflate the threat that the most disliked groups pose, which in turn leads to intolerance. This implies a mediation effect such that at least some of the effect of conspiratorial thinking is channelled through threat perceptions. Similarly, the existing literature predicts that political efficacy will affect tolerance by reducing threat perceptions. Figure 4 presents these mediated effects schematically.
Schematic representation of the mediated effects. [Colour figure can be viewed at wileyonlinelibrary.com]

To conduct a mediation analysis, we run multilevel SEM with random intercepts for countries to account for the clustering of respondents by country. The link functions take into account that political tolerance is a non‐continuous (ordered) outcome as well as that interpersonal distrust is a binary outcome.
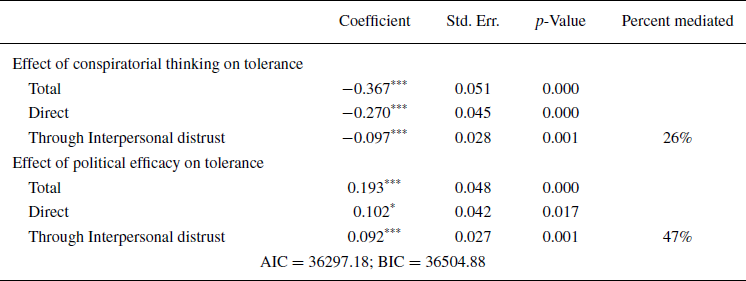
Table 2 presents the results. As expected, there is evidence of mediated effects for both Conspiratorial thinking and Political efficacy. This supports our argument. More specifically, 26 per cent of the effect of Conspiratorial thinking on tolerance goes through Interpersonal distrust, and this is highly statistically significant. Although most of the effect is direct, the regression results from the SEM analysis show that a significant part of the effect of conspiratorial thinking is indeed channelled through our measure of threat perception. In line with the existing literature, the effect of Political efficacy is also mediated by threat perceptions with 47 per cent of it going through Interpersonal distrust.
Direct and indirect effects of conspiratorial thinking and political efficacy through threat perceptions

*p < 0.05; **p < 0.01; ***p < 0.001; n = 9529; N = 10 countries.
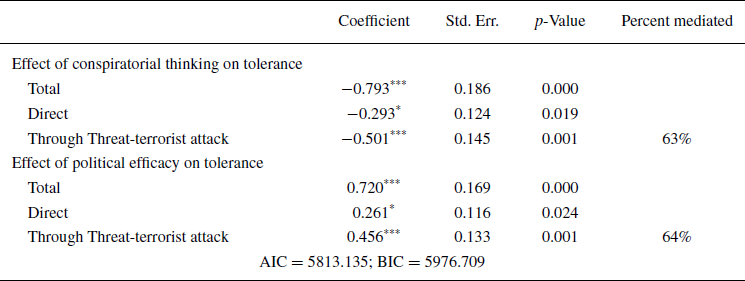
Threat perceptions are notoriously difficult to operationalize, and our analysis thus far has relied on interpersonal distrust as a proxy for threat perceptions. Although this follows common practice (e.g., Marquart‐Pyatt & Paxton, Reference Marquart‐Pyatt and Paxton2007), one could argue that it does not fully capture threat perceptions. As a robustness check, we conduct an additional SEM analysis with a more direct measure of threat perception for the subgroup of respondents who identified Muslims as their least liked group. This measure taps into perceived threats of terrorist attacks from immigrants. The reason why we employ this measure only for those who dislike Muslims is because security fears surrounding terrorism drive negative sentiments toward Muslim immigrants but not so much toward other immigrants (Hellwig & Sinno, Reference Hellwig and Sinno2017).
Table 3 shows that our findings are robust to using threat perceptions from terrorist attacks as an alternative measure of threat. In fact, when using this more direct measure of threat perceptions a much larger per cent of the effect of conspiratorial thinking on tolerance is mediated by the measure for threat perceptions. Specifically, 63 per cent of the total effect is mediated through terror threat perceptions for those who identify Muslims as their least liked group. Similarly, 64 per cent of the effect of political efficacy is also mediated through the terror threat variable. In sum, the SEM analysis supports our theory that conspiratorial thinking affects threat perceptions which in turn affects tolerance levels.
Direct and indirect effects of conspiratorial thinking and political efficacy through threat perceptions (Muslims as the target)

*p < 0.05; **p < 0.01; ***p < 0.001; n = 1446; N = 10 countries.
Conclusion
In this paper we examine the state of European democracies by focusing on political tolerance. The questions that motivate our study are: What explains individual levels of tolerance in Europe? Which groups in society are the most likely targets of intolerance and why? We rely on a novel cross‐national survey with a content‐controlled measure of tolerance to examine these questions.
This paper makes theoretical and empirical contributions. While previous research emphasizes learning theories and threat perceptions as important determinants of tolerance (Marquart‐Pyatt & Paxton, Reference Marquart‐Pyatt and Paxton2007), we redirect the debate to conspiratorial thinking and cosmopolitanism. Individuals high in conspiratorial thinking are significantly less tolerant than those who are not conspiratorially minded. Similarly, cosmopolitanism is positively correlated with tolerance and this effect is substantively large, too. Future research could use experiments and panel data to shed more light on the causal processes that we laid out and include additional countries.
Our findings have several implications for ongoing debates on the quality of democracy in general and the determinants of political tolerance in particular. First, by unearthing the role that conspiratorial thinking plays in the tolerance story, our paper suggests that the recent explosion in conspiracy theories related to the COVID‐19 pandemic, and to far‐right groups, is likely to have far‐reaching implications for tolerance as well. Second, our findings provide empirical support for the claim that cosmopolitans are more tolerant of diversity than non‐cosmopolitans (Appiah, Reference Appiah2019), adding to the growing body of work which shows that cosmopolitan norms are not merely abstract constructs but that cosmopolitans practice what they preach (Kuhn et al., Reference Kuhn, Solaz and van Elsas2018).
Our analysis uncovers several important descriptive findings, as well. Far‐right groups (neo‐Nazis/Fascists) and Muslims are the most disliked groups in Europe. When it comes to the level of tolerance towards these groups, we find that more than half of the respondents in each country are willing to deny their most disliked group parliamentary representation. This is noteworthy because of the very different nature of these groups: one is based on a major world religion while the other on an extreme ideology that threatens the principles of liberal democracy.
We believe that it is important to discuss the role of tolerance not just in abstract terms but based on empirical data and in relation to groups that are disliked by many citizens in Europe. On the one hand, liberal democracy requires citizens to be tolerant of those they disagree with, for pluralism cannot flourish if different ideas cannot compete on a level playing field. On the other hand, tolerance towards groups that seek to overthrow the democratic order is dangerous, as Popper (Reference Popper1971) already pointed out when writing about the “paradox of tolerance”. Hence, tolerance requires ongoing public debates: what ideas, groups and people must be tolerated and what are the limits of tolerance? It is this debate that we seek to enrich.
Acknowledgements
We thank Paola Lopez Gonzales for excellent research assistance. We also thank Mathias Kruse, Dragana Svraka and Joe Kendall for helpful comments. Finally, we thank three anonymous reviewers for their valuable feedback. The EUENGAGE survey was funded by Horizon 2020 grant 649281. All remaining errors are our own.
Online Appendix
Additional supporting information may be found in the Online Appendix section at the end of the article:
Table A1: Descriptive statistics
Table A2: Robustness checks with various alternative model specifications
Table A3: Robustness checks with additional analysis of cohort effects
Figure A1: Distribution of cosmopolitanism by country (weighted data)
Figure A2: Distribution of most disliked groups by ideology (weighted data).
Supplementary Information
Supplementary Information


 Open access