

Key messages
Chapter 3.1 draws out insights into the way primary care is paid. Primary care delivers first-contact access to health services and seeks to coordinate care. It is paid for in different ways in different settings: through salary, capitation (a fixed payment per enlisted patient), fee-for-service (FFS), pay for performance (P4P) or through blended payments that combine two or more of these methods. Key learning includes that:
The way health systems pay for primary care can incentivize treatment that supports wider health systems’ goals, such as:
○ reducing avoidable referrals to secondary care, improving efficiency and reducing waste; and
○ encouraging adherence to evidence-based clinical guidelines, enhancing quality.
P4P is often used to improve quality but the evidence on how effective it is, is mixed. If performance measures are not carefully designed to be context specific and adjusted for risk appropriately, they can create unintended barriers to and inequalities in access.
The design of primary care payment models needs to be “holistic”, to consider the goals of the health system and to underpin quality, access and efficiency.
Introduction
Payment models are increasingly being used by governments and health insurers to support and help drive efficient and equitable health care systems. This chapter examines the evidence on how payment methods in primary care can help solve global policy challenges faced by the primary health care sector.
The primary health care sector is usually the first point of contact for patients in need of health services. The sector is usually, though not exclusively, organized around primary care physicians (PCPs) (also referred to as general practitioners (GPs)), who can be supported by nurses, allied health professionals and other community health workers. However, there are also examples of other health professionals providing some primary care services, such as community pharmacists. Given the need for easily accessible health care by the population, primary care is usually geographically dispersed and organized into small community-based medical groups or health centres – primary care organizations (PCOs). In some countries, the population enrols with a PCP, PCO or health insurer, where continuity of care reflects a key defining element of primary care.
The organization of primary care across countries is varied. PCOs can be owned and run by local or national governments, or by vertically integrated health insurers, or can be privately owned by PCPs or private companies. In most health care systems with some form of health insurance, providers or their patients will receive payments and/or subsidies from insurers (including governments) for the care provided. Payments can be made to an individual PCP and/or to the PCO, who then distributes the payments to health professionals within that group. For example, the PCO could be paid on the basis of capitation, while the PCP is paid a fixed salary.
The aim of this chapter is to describe how different primary care payment models can be used to help solve two common global policy challenges relevant to the primary health care sector: (i) how to reduce avoidable secondary care; and (ii) how to improve the quality of primary care. These two policy challenges were selected because they contribute to achieving the overall goals of payers (defined as third-party insurers, such as health insurers and governments, as well as patients), they are relevant to primary care, and they are common issues faced by many health care systems. Primary care payment models provide financial incentives that can be used to solve these policy challenges. Different payment models may help solve different challenges, which explains why payment models are often blended.
Using payment models to help solve policy challenges assumes that income plays a role in motivating the clinical and labour market behaviour of PCPs. This assumption generally holds, but nonfinancial motives may also influence their behaviour, presumably to a greater extent if their target income is reached. To understand PCPs’ behaviour, the literature often uses the principal–agent framework (Scott, Reference Scott, Culyer and Newhouse2000). This framework assumes that PCPs (agents) seek to maximize their own utility, which depends on their income but also their altruistic concerns towards the patient (principal) and own leisure time (Ellis & McGuire, Reference Ellis and McGuire1986; Dionne & Contandriopoulos, Reference Dionne and Contandriopoulos1985). Some studies also include altruistic concerns towards a third-party insurer or society at large to capture PCPs’ double-agency role (e.g. Allen et al., Reference Allen2022; Blomqvist, Reference Blomqvist1991; Oxholm et al., Reference Oxholm2024). PCPs may also be motivated by other nonfinancial drivers such as their reputation among colleagues and patients and intrinsic motivation (enjoyment of tasks) (Pedersen et al., Reference Pedersen2018; Sicsic, Le Vaillant & Franc, Reference Sicsic, Le Vaillant and Franc2012; Pedersen et al., Reference Pedersen2021; Godager, Hennig-Schmidt & Iverson, Reference Godager, Hennig-Schmidt and Iversen2016; Bénabou & Tirole, Reference Bénabou and Tirole2006; Yordanov et al., Reference Yordanov2023). As PCPs may be motivated to different degrees by these factors, responses to payment models are thus often heterogeneous across providers (Hennig-Schmidt, Selten & Wiesen, Reference Hennig-Schmidt, Selten and Wiesen2011; Godager & Wiesen, Reference Godager and Wiesen2013).
PCPs may also respond differently to the same payment models depending on their context and setting. For example, any payment model can be accompanied by global budget mechanisms that provide overall caps to spending. PCPs could also receive income from many different payers (e.g. insurers) each with a different method of payment, such that the expected behavioural effects when one payer changes its payment model are muted. Availability of resources (Di Guida et al., Reference Di Guida, Gyrd‐Hansen and Oxholm2019; Oxholm et al., Reference Oxholm2019; Oxholm, Guida & Gyrd-Hansen, Reference Oxholm and Gyrd-Hansen2021) and the degree of competition among providers (Brosig‐Koch, Hehenkamp & Kokot, Reference Brosig‐Koch, Hehenkamp and Kokot2017; Iversen, Reference Iversen and Scheffler2016; Scott & Sivey, Reference Scott and Sivey2022) could also affect providers’ responses to changes in the level or type of payments. Payment methods could also influence the mix and characteristics of PCPs and PCOs through selection. This includes the entry and exit decisions of PCPs and PCOs, PCP hours of work, as well as the location decisions of PCPs and PCOs, such as practising in a rural or urban area or in an area with a high-need population (Li et al., Reference Li2014; Günther et al., Reference Günther2010; Pedersen & Gyrd-Hansen, Reference Pedersen and Gyrd-Hansen2014; Anell, Dackehag & Dietrichson, Reference Anell, Dackehag and Dietrichson2018).
The next section outlines how the basic types of primary care payment models affect PCPs’ behaviour and their ability to reach payers’ different goals. Afterwards, for each of the two policy challenges introduced above, we examine its context and then the extent to which primary care payment models could help solve the challenge.
Overview of primary care payment models and their effects
First, we summarize, from the payers’ perspective, the advantages and disadvantages of using the most common payment methods for PCPs. Any payment model involves an explicit or implicit contract between a payer and a provider. These contracts specify the unit of payment. The unit of payment has behavioural consequences as it defines the behaviour the payer is expecting in exchange for the payment. For example, salary payment is based on working a specified number of hours; capitation payment is paid per enrolled patient and so is related to the list size; FFS is related to the volume of services provided, usually defined in terms of consultations/visits, treatments or diagnostic tests; and P4P is based on a range of different quality measures that could be related to clinical guidelines or health outcomes (Quinn, Reference Quinn2015; Jia et al., Reference Jia2021; Stokes et al., Reference Stokes2018). These different payment models can also be blended together.
Even though it may be the patient and/or insurer that pays for the care, the financial risk of treating patients may be shared between the payers and the providers. Who bears this risk depends on the unit of payment. For salary and capitation payments, payers can relatively easily predict total expenditures and so face little financial risk themselves. Instead, this risk is borne by the providers who are not compensated for changes in demand and workload, for example, increases in the numbers of patients with complex conditions. Capitation payment can partly account for financial risk through risk adjustment of payments that take into account the additional costs of treating more complex patients. For FFS and P4P, payers typically bear a higher financial risk as providers are compensated for additional workload. Providers’ financial risk can significantly influence the strength of their incentive to provide care themselves rather than refer to other health professionals. More specifically, a lower financial risk, such as under FFS and P4P, increases providers’ financial incentives to provide care themselves. These types of payments may also be used to incentivize providers to deliver different types of care through different price signals (Hsiao et al., Reference Hsiao1992).
PCPs and PCOs may often receive remuneration from a blend of different payment methods to achieve the different goals of the payer. Table 3.1.1 shows whether these payment methods provide financial incentives to help achieve common high-priority payer goals. The following discussion of each payment method goes through the table in more detail. Box 3.1.2 briefly describes payment methods that are increasingly being used for community pharmacists as their role in the provision of first-level care expands to some primary care services in certain settings.

Table 3.1.1 Long description
The table has 2 main columns (with further subcolumns): Payers’ objectives and Payment models (Salary, Capitation, F F S, and P 4 P). It reads as follows. Under Better access. Increase number of patients seen (list size): cross; tick; tick; tick. Treat patients most in need (no cream skimming): cross; cross a; tick b; cross a.
Under Higher quality of care. Maximize provision of effective care c: cross; cross; cross; tick. Increase preventive care: tick d; tick d; cross e; cross e, f.
Under Lower expenditures. Fewer referrals to specialists: cross; cross; tick; tick g. Minimize physician effort and treatment costs: tick; tick; cross; cross. Higher budget security: tick; tick; cross h; cross h. Lower administrative costs: tick; tick; cross; cross.
FFS: fee-for-service; P4P: pay for performance.
a If payment is risk adjusted there will be a financial incentive to enlist high-need patients which also provides a signal from the payer to prioritize these patients’ treatment.
b Unless fees are paid to PCPs by patients (in whole or in part), which may reduce demand among those in most need, compared to fees being paid to PCPs directly by third-party insurers. It also assumes that fees are sufficiently differentiated to reflect the costs of treating different types of patients.
c Depends on adherence to clinical guidelines.
d Depends on the difference between PCPs’ costs of prevention and otherwise expected increase in PCPs’ future workload and costs of care.
e Unless payments are made for preventive activities such as immunization.
f Depends on whether prevention impacts reported performance.
g Depends on whether performance links to PCPs providing the services themselves or rewards “appropriate” referrals.
h Budget security may be higher if there is a cap on total payments and fees are set (regulated) by the payer.
Payment method 1: salary
Salaried providers receive a fixed revenue for working over a given time period. This payment method is typically used to pay providers who are employees of a PCO. Payers may find the fixed salary payment scheme attractive for several reasons. One is that a fixed salary ensures budget security for the payer because it shifts financial risk to providers. Another reason is that the payment method is easy to administer as it only requires information about the employed providers. A fixed salary, however, also has some unattractive features. As providers are not paid for their activities, they are (in the short run) not financially incentivized to exert more than the minimum required effort to avert being laid off. Generally, PCPs may provide less effort by, for example, avoiding costly patients, reducing the frequency of services, or referring patients to other providers. In the longer run, the prospect of receiving a promotion and pay rise as well as the fear of being laid off may financially incentivize them to increase effort beyond the minimum required level. The focus for the provider then becomes the criteria used by employers to enable progression up the career ladder. These criteria can create career incentives that are related to objectively or subjectively assessed performance (Prendergast, Reference Prendergast1999).
Payment method 2: capitation
Providers paid by capitation receive a fixed payment per enlisted patient for a given time period. The payment is independent of the amount of provided care. However, it may be risk adjusted such that patients with characteristics that indicate they are more costly to treat are linked to a higher payment. As the size of the served patient population is typically stable due to patient enrolment with a PCO, this payment method gives payers budget security by shifting financial risk to providers. Capitation payments financially incentivize providers to attract and keep patients on their lists when facing competition, thereby potentially increasing access to care and also improving those aspects of quality that patients can observe. However, if competition for patients is low, providers have less of a financial incentive to exert effort above the minimum requirement. An exception to this lack of financial incentive may be preventive care that reduces providers’ required effort in the longer run.
As with any fixed payment, capitation payments incentivize the providers to minimize their costs of providing care, which may lead them to provide less care than is necessary when quality is difficult to observe (Hennig-Schmidt, Selten & Wiesen, Reference Hennig-Schmidt, Selten and Wiesen2011; Brosig-Koch et al., Reference Brosig-Koch2016; Oxholm et al., Reference Oxholm2019). Capitation may also lead providers to only enlist patients whom they expect to be less costly to treat compared to the capitation payment itself (“cream-skimming” behaviour). This behaviour may increase inequality in patients’ access to care. Such selection issues may be alleviated by regulating patients’ access to providers’ lists or by risk-adjusting the payments based on patients’ expected treatment costs. Risk adjustment shifts some of the financial risk away from the provider to the payer and thereby weakens the providers’ incentives to reduce costs by exerting cream-skimming behaviour. The risk adjustment may also send a signal to providers about patient prioritization (Oxholm et al., Reference Oxholm2019), but there is no direct financial incentive to prioritize already enlisted high-need patients.
Payment method 3: FFS
PCPs can receive a fee for each service they provide. This payment method requires providers to report and bill for the number of activities (e.g. consultations, visits, procedures, episodes). The advantage of FFS over salary and capitation is that providers have a financial incentive to deliver care themselves rather than referring patients to other providers (Hennig-Schmidt, Selten & Wiesen, Reference Hennig-Schmidt, Selten and Wiesen2011; Krasnik et al., Reference Krasnik1990; Brosig-Koch et al., Reference Brosig-Koch2016). A disadvantage of FFS is that providers may be reluctant to provide services that are not covered by the fee schedule, unless some services are bundled together. Another concern for the payer is that they bear most of the financial risks, especially when fees are unregulated. Consequently, FFS increases the risk of overtreatment and supplier-induced demand (Di Guida, Gyrd-Hansen & Oxholm, Reference Oxholm2019; Longden, Hall & Van Gool, Reference Longden, Hall and Van Gool2018), gaming of the system and budget deficits for payers. To minimize these risks some payers may choose to closely monitor service patterns through utilization reviews or to set caps on the payments to providers through controls on fees that can be charged (Wickizer & Lessler, Reference Wickizer and Lessler2002). The fees may be set by either the payers or the PCPs themselves or through negotiations. In cases where PCPs set the fees, they may choose to price discriminate, i.e. charge payers different fees based on patient characteristics. In cases where the payers are the patients themselves, the fee is an out-of-pocket (OOP) cost, and higher fees may reduce demand and thereby have implications for equity in access to care.
Payment method 4: P4P
P4P has become a popular way of remunerating PCPs (Cashin et al., Reference Cashin2014). This payment method links payments directly to performance measures. The performance measures may be based either on completion of processes (e.g. recording blood sugar levels) or on achieving specific intermediate health outcomes for patients (e.g. whether blood sugar levels are in accordance with clinical guidelines). The schemes require an administrative system that measures providers’ performance (which may rely on digital health infrastructure (see Box 3.1.1)). Depending on the performance measures in question, such administrative requirements may be costly. An advantage of P4P is, however, that providers receive feedback on their performance, which may improve the quality of care over and above the effect of the financial incentives (Kolstad, Reference Kolstad2013; Godager, Hennig-Schmidt & Iverson, Reference Godager, Hennig-Schmidt and Iversen2016).
P4P may be designed in different ways, which creates different incentives for the provider (as discussed later in the chapter). These design differences may explain why evidence on the impact of P4P on the provision of care is mixed. The mixed evidence, however, may also be a result of weak evaluation designs of existing studies (see, for example, reviews by Van Herck et al., Reference Van Herck2010; Jia et al., Reference Jia2021; Eijkenaar et al., Reference Eijkenaar2013; Diaconu et al., Reference Diaconu2021; Zaresani & Scott, Reference Zaresani2021; Scott, Liu & Yong, Reference Scott, Liu and Yong2018). Despite the different designs of P4P schemes, they also share several common features that make them attractive to payers. P4P schemes (as opposed to FFS schemes) incentivize providers to only deliver care defined as high quality. For example, by rewarding providers for only one blood sugar level measurement per diabetes patient per time period, as opposed to a FFS scheme rewarding providers for all such measurements independently of the number of previous measurements and the recipient. This focus on what constitutes high-quality care may also reduce heterogeneity in care across providers.
A disadvantage of P4P is that payers may find it difficult to predict providers’ performance and thereby risk facing overrun budgets. Payers may also end up paying for performance that is only weakly related to the individual provider’s efforts. Providers may also have financial incentives to treat patients who are close to meeting or have already met the performance requirements (cream-skimming behaviour), thus minimizing provider effort (Gravelle, Sutton & Ma, Reference Gravelle, Sutton and Ma2010). P4P may thereby increase inequality in patients’ access to care in some cases (Oxholm, Di Guida & Gyrd-Hansen, Reference Oxholm and Gyrd-Hansen2021). By risk-adjusting the performance requirements, payers could potentially alleviate such issues. Similar to the case of FFS, multitasking issues may also arise under P4P if focus is diverted towards more profitable care (Doran et al., Reference Doran2011). Under P4P, providers also have an incentive to game the system to secure higher payments (Gravelle, Sutton & Ma, Reference Gravelle, Sutton and Ma2010; Kalk, Paul & Grabosch, Reference Kalk, Paul and Grabosch2010; Wilding et al., Reference Wilding2022). There may also be spillovers of P4P to other non-incentivized areas of care. For example, resource-constrained providers may choose to focus on incentivized treatments at the expense of non-incentivized treatments (Singh et al., Reference Singh2020), whereas non-incentivized care which is complementary to incentivized care may be positively affected by P4P.
The choice and sophistication of payment models depend on the availability of information technology and digital health infrastructure. Electronic medical records can often support new payment models that require either extensive risk adjustment of payments or the automation of the collection of data on quality and activity to support P4P and other quality improvement policies. Small private PCOs may find it difficult to transition to digital technology without outside investment. In high-income countries (HICs) there has therefore been a trend towards larger sizes of PCOs that benefit from economies of scale to spread out the fixed costs of new infrastructure. Often payers provide separate payments or block grants to support information technology and digital health infrastructure, but such funding may be unavailable in some low- and middle-income countries (LMICs) with more severe resource constraints. In settings where PCOs are in the private sector or in vertically integrated insurance systems, it can also be difficult to coordinate a single information technology health platform that can be used to support system-wide payment models and the sharing of electronic health records.
Payment method 5: blended payments
To balance the incentives of the pure payment methods, payments are often blended in primary care (Robinson, Reference Robinson2001). Blended payments are attractive because they enable payers to both incentivize providers to deliver care (e.g. using FFS and P4P) while limiting their spending (e.g. using salary and capitation). Theoretically, it has been shown that mixed payment methods are superior to pure payment methods (Ellis & McGuire, Reference Ellis and McGuire1986). However, in practice, the complexity of these methods may impose high transaction costs and difficulties in predicting behaviour. Empirical evidence on providers’ response to blended payment methods is limited. The results of a laboratory experiment with medical students show that the introduction of a mix of FFS and capitation leads to greater health benefits from care compared to the pure payment methods (Brosig‐Koch et al., Reference Brosig‐Koch, Hehenkamp and Kokot2017). Other studies, using real-world data, show that a change in provider payments from pure capitation to a mix of capitation and FFS increases PCPs’ activity levels and reduces their referral rates (e.g. Krasnik et al., Reference Krasnik1990; Flierman & Groenewegen, Reference Flierman and Groenewegen1992). P4P schemes are also often blended onto other payment models, which accounts for the majority of funding. The blend that best achieves payers’ different goals is, however, difficult to determine in a real-world setting and is likely context dependent.
After nurses and physicians, pharmacists are the third largest group of professionals in the global health workforce. In many places, the role of pharmacists is expanding and patients are seeking their first point of contact with the health care system in community pharmacies rather than medical offices. For example, a study in the USA demonstrated that patients visit community pharmacists almost twice as often as their physicians and other qualified health care professionals (Cheema, Sutcliffe & Singer, Reference Cheema, Sutcliffe and Singer2014; Santschi et al., Reference Santschi2011; Newman et al., Reference Newman2020). Having roles in prescription counselling, medication therapy management, health screening and immunizations (generally referred to as either extended pharmacy services or cognitive pharmaceutical services), pharmacists actively provide education, including smoking cessation services and distributing health education leaflets that cover the issues related to contraception and the prevention of cardiovascular diseases (Urick & Meggs, Reference Urick and Meggs2019; Anderson, Reference Anderson2007). As countries face physician shortages and ageing populations, the evolving model of pharmacy care may offer additional routes to enhance access to some primary care services, improve disease-related health outcomes and reduce health care costs.
In most places, pharmacy remuneration is concentrated on dispensing (a margin, maximum reimbursement price, or dispensing fee) (WHO Regional Office for Europe, 2020). However, some countries have started transitioning towards payment models (primarily FFS, capitation and blended payments of the two) to align funding with the expansion of cognitive pharmaceutical services; and some are opting for different modes of reimbursement for different pharmaceutical services. For example, Australia, Belgium, Canada, Germany, Japan, the Republic of Korea, Switzerland and some USA states are employing FFS schemes; Denmark, England, Ghana, Indonesia, the Netherlands, Portugal, Thailand, and some places in the USA (including Medicare and Medicaid) are using capitation; and Canada, China, and New Zealand are utilizing blended payments (mostly FFS integrated into capitation models).
These payment models for community pharmacists can have similar effects as they do in the primary care setting. FFS can encourage pharmacists to actively provide services (Jackson & Urick, Reference Jackson and Urick2019), but the fee does not account for the quality of the service provided and risks encouraging overprescription and overcounselling (Standridge, Fisher & Tsai, Reference Standridge, Fisher and Tsai1983). In capitation systems, pharmacists are reimbursed based on the number of patients on their lists, which can incentivize improved service quality and reductions in the costs of prescriptions (Yesalis et al., Reference Yesalis1980). This type of payment system can also allow for better financial planning, as pharmacies can better predict their revenue flows. However, this system gives less financial incentive for pharmacists to provide extended pharmacy services or cognitive pharmaceutical services because it does not change the individual payment received for services. Blended payments are often used to address the shortcomings of the two models when they are used alone (Jackson & Urick, Reference Jackson and Urick2019; Freeman et al., Reference Freeman2016).
As the role of community pharmacists continues to evolve, information sharing across the health care system (e.g. primary care, hospitals, long-term care) is becoming increasingly important to not only ensure the provision of safe, efficient and coordinated care delivery, but also to develop appropriate remuneration models for different health care providers. After all, there is an opportunity for community pharmacists to fill growing gaps in other parts of the health workforce, and appropriate payment models will be important to fully scale up the services provided in the community pharmacist setting.
Policy challenge 1: Can primary care payment models reduce avoidable secondary care?
Background to policy challenge
Many policy-makers believe that a strong primary care system can help reduce the growth or level of health care expenditures of more specialized hospital care. There exists a large literature showing strong associations between the strength (e.g. number of PCPs) of primary care and patients’ health outcomes (Starfield, Shi & Macinko, Reference Starfield, Shi and Macinko2005). Some of this literature also finds associations between a strong primary care system and lower total health expenditures (Baicker & Chandra, Reference Baicker and Chandra2004; Starfield & Shi, Reference Starfield and Shi2002) and fewer inpatient and emergency hospitalizations (Chen et al., Reference Chen2010; Jacobs et al., Reference Jacobs2020; Fortney et al., Reference Fortney2005; Lippi Bruni, Mammi & Ugolini, Reference Lippi Bruni, Mammi and Ugolini2016; Whittaker et al., Reference Whittaker2016; Morciano et al., Reference Morciano2020; Dolton & Pathania, Reference Dolton and Pathania2016). However, if primary care is expanding and the number of specialists and hospitals remain the same, then total health care expenditures will increase overall at the system level (Lau et al., Reference Lau2021; Miller et al., Reference Miller1999).
PCPs can potentially play an important role in improving efficiency by acting as gatekeepers to more expensive specialized care and by providing preventive care. Primary care can also be a substitute for or complement to more specialized care (Lau et al., Reference Lau2021). Primary care can act as a direct substitute when the same tasks can be provided with equal effectiveness by PCPs and specialists (Van Hoof et al., Reference Van Hoof2019). This substitution can, for example, include general health checks, skin checks, minor surgical procedures, antenatal care, care for less severe mental health conditions, child health (in the USA paediatricians act as PCPs for children whereas GPs take on this role in other countries), and monitoring patients with chronic diseases. In cases of substitution, the policy challenge is to ensure that the same quality of care is provided by the least costly health professional, which often is the PCP.
PCPs are usually paid less (Cheng et al., 2012; Leigh et al., Reference Leigh2010) and face lower fixed costs of providing care than specialists. From the patient’s perspective, it may also be less costly to access primary care in terms of travel time and time off work to visit a PCP (or a community pharmacist (see Box 3.1.2)) closer to home than to receive more specialized care in a more distant hospital. Lower costs of accessing care are especially relevant in rural areas where the distance to health care providers is a key issue. However, lower unit costs in primary care do not always translate into lower overall health care expenditure. As expenditure is a function of both unit costs as well as the volume of care, effects on expenditure also depend on the volume of care provided, which could increase in primary care if PCPs, for example, spend more time with patients or see more patients. A systematic review comparing consultations by PCPs to other specialists found that though outcomes were similar and waiting times were lower, costs were generally higher when treating patients in primary care compared to secondary care (Van Hoof et al., Reference Van Hoof2019). Despite the possibility of higher costs of treating patients in primary care, these may be partly offset by lower volume of referrals if the number of patients treated in primary care increases. The most cost-effective setting will, however, differ depending on the health condition and context.
In cases where primary care acts as a complement to specialized care, the policy challenge is to ensure the optimal mix of and collaboration between PCPs and other specialists for each patient. This challenge is related to integrated care for patients with multimorbidities and complex conditions (see Chapter 3.5) and is also related to referrals between PCPs and specialists. More generally, complementarity is about how PCPs and other health professionals with different skill sets can work to achieve the most cost-effective care for each patient. There will be much variation in the most cost-effective mix of PCPs and other specialists across different health conditions, with patients with multimorbidities and chronic diseases more likely to require care from providers across a range of specialties. In these cases, the impact of primary care on reducing the costs of specialized care is much less obvious, though it is believed that generalists, such as PCPs, will have a more holistic view of the patient’s health and circumstances.
The role of primary care payment models in reducing avoidable secondary care
Primary care payment models influence avoidable secondary care through their effects on PCP referrals to secondary, more specialized care (Forrest, Reference Forrest2003). Gatekeeping is a system where a referral from a PCP is required before a patient can visit a specialist. If gatekeeping does not exist then patients can access specialists directly, thereby reducing the impact of primary care payment models. Patients’ direct access could result in specialists seeing patients who do not “need” specialized care, such that specialists are not using their more costly time and training to its maximum benefit. In the longer term there would then be a higher demand for specialists and a misallocation of resources between primary and secondary care, which may also lead to higher health care expenditures overall. If gatekeeping does exist, then different primary care payment models can be used to influence the probability of a referral. More specifically, payment models can provide financial incentives to provide additional care (such as under FFS and P4P) and so reduce referrals, or share the financial risk of care with secondary care providers in vertically integrated systems which have pooled primary and secondary care budgets.
Capitation payment is one payment method which may influence referrals to more specialized care. However, its effect on referrals depends crucially on whether the capitated budget is pooled (also known as a “global” budget) across primary and secondary care, or only covers primary care (“single” budget). Single budget capitation may be paid to the PCO or directly to the PCP based on the number of enrolled patients and covers only the care provided by the PCPs themselves. In this situation, PCPs have an incentive to minimize their own treatment costs, which can be achieved by increasing referrals (Iversen & Lurås, Reference Iversen and Lurås2000). They may also minimize their own costs by choosing to spend less time with each patient and be less focused on coordination of care compared to under FFS and P4P payments. These financial incentives are similar to those present under salaried payment (see Table 3.1.1).
Empirical studies comparing single budget capitation payment to other payment models such as FFS and P4P have confirmed these hypotheses. With FFS payments, PCPs are paid on the basis of volume. PCPs therefore have a financial incentive to do more themselves, such as more follow-up visits. Referrals to specialists may therefore be delayed and be less likely under FFS compared to under (single budget) capitation or salary. Krasnik and colleagues (Reference Krasnik1990) found in Denmark that introducing FFS on top of single budget capitation substantially reduced GPs’ referrals to specialists and hospitals, while these GPs increased the number of face-to-face consultations and the number of diagnostic services undertaken themselves. The net effect on costs and health outcomes was not examined. Flierman and Groenewegen (Reference Flierman and Groenewegen1992) also reported increased activity under FFS mixed with capitation compared to capitation alone. The introduction of capitation in addition to FFS in Norway resulted in more referrals (Iversen & Lurås, Reference Iversen and Lurås2000), but in Canada there was no impact on hospital utilization when physicians switched from FFS to capitation payments plus an incentive to reduce hospitalization (Hutchison et al., Reference Hutchison1996).
Similar to FFS, P4P may encourage PCPs to provide more care themselves than under a fixed payment scheme such as capitation and salary. This increased activity may reduce referrals to hospital. Several studies have examined the spillover effects of P4P on secondary care in the context of the Quality and Outcomes Framework (QOF) (see Box 3.1.3), which is a large-scale P4P scheme added to an existing capitation payment model for PCPs in the United Kingdom (Doran et al., Reference Doran2006). Grigoroglou and colleagues (Reference Grigoroglou2020) found a very small reduction in avoidable hospitalizations for incentivized health conditions, while Harrison and colleagues (Reference Harrison2014) found a larger reduction in avoidable hospitalizations. Gunn et al. (Reference Gunn2021) found a substantial reduction in all-cause, diabetes and cardiovascular disease hospital admissions and emergency admissions for patients with diabetes if QOF targets were attained.
For some treatments, however, the Framework led to an increase in referrals. Gutacker and colleagues (Reference Gutacker2015) found that it led to an increase in psychiatric hospital admissions for people with serious mental illness. This finding suggests that in some circumstances P4P may lead to the identification of unmet need or incentivize more appropriate care. P4P can also directly reward more referrals if this is thought to improve health outcomes (Mcmanus et al., Reference McManus2021). A local P4P scheme in the United Kingdom found that emergency hospital admissions fell when GPs were directly rewarded for reducing them, but health outcomes were not examined (Khedmati Morasae et al., Reference Khedmati Morasae2021).
Even though there may be exceptions as described above, capitation under a single budget is generally found to increase the referral rate compared to FFS and P4P schemes. This financial incentive to refer patients under a single budget capitation-based system may be strengthened further if there is competition for patients. Iversen and Ma (Reference Iversen and Ma2011) show that incentives to refer under capitation payments are higher for PCPs facing more competition, because they may be more likely to respond to patients’ requests to be referred to prevent the patient from moving to another PCP.
The second main form of capitation is global capitation payment, which is where there is a “global” or “pooled” budget that includes total spending on primary and secondary care (and potentially other services). This budget may be held by a practice or a medical group or within a vertically integrated insurance system. Global capitation payments thereby provide a total health care budget based on the number of patients in the population or enrolled with an insurer, which is typically risk adjusted to account for patient complexity. An example is GP Fundholding in the United Kingdom or the use of capitated budgets in Health Maintenance Organizations and Accountable Care Organizations (ACOs) in the USA. In these cases, as under the first type of capitation payment (single budget), there is a financial incentive to minimize costs as providers can keep the savings. But in cases of a global (pooled) budget, this cost minimization includes keeping the savings that would have otherwise been used to pay for hospital care, which is why this payment method is also known as a shared-savings model. Several studies have shown that referrals by PCPs are lower with this type of global capitation payment (Davidson et al., Reference Davidson1992; Lurie et al., Reference Lurie1992; Dusheiko et al., Reference Dusheiko2006).
In ACOs, the global budget has also been combined with P4P. In these models, medical groups can share in any savings made from the global budget as long as they meet a minimum quality threshold (Chernew et al., Reference Chernew2011). Systematic reviews find positive evidence including reductions in spending and no deterioration of outcomes (Cattel & Eijkenaar, Reference Cattel and Eijkenaar2020; Kaufman et al., Reference Kaufman2017). Global budgets may also involve pooling of budgets across different sectors of care. For example, this approach has been tried for health and social care budgets in the United Kingdom, though it was found to have no impact on the utilization of hospitals, but there was some evidence of increased utilization for the most complex patients (Stokes et al., Reference Stokes2019). In this way global budgets that merge primary, secondary care, and social care budgets aim to help support integrated care across different settings (see Chapter 3.5).
A derivative of capitation payments are bundled payments. Bundled payments have been discussed as a way to incentivize integrated care across different sectors and settings for specific groups of patients defined by disease or diagnosis (Tsiachristas et al., Reference Tsiachristas2013; Stokes et al., Reference Stokes2018). Instead of the fixed capitation payment covering all care for each enrolled patient, fixed bundled payments are disease specific. They are designed as a single payment for all care required by a patient in the same episode or multiple services provided across different providers or sectors. Often, multiple FFS payments across a hospital episode may be “bundled” into a single payment (e.g. a diagnosis-related group). Alternatively, a single payment may be used to cover the care of patients in hospital and after they are discharged if they have a chronic disease. Similar to capitation payment, bundled payments provide incentives to reduce costs through providers being able to retain savings.
In the USA’s Medicare, bundled payments have been aimed at hospitals which become responsible for the care of patients up to 90 days after discharge. Though the role of primary care in these schemes is unclear, these schemes have some effects on reducing Medicare spending (Joynt Maddox et al., Reference Joynt Maddox2018; Barnett et al., Reference Barnett2019). In the Netherlands, bundled payments in primary care increased total health care expenditures, especially for those with multimorbidities. Medication and spending on medical specialists increased, while spending on primary care did not. The Dutch PCPs may have increased referrals because they were unable to keep savings from the reduction in use of specialists or because unmet needs were identified. In this context the “bundle” may have been too narrow by only including primary care, such that PCPs were incentivized to reduce only their own costs (Karimi et al., Reference Karimi2021; Stokes et al., Reference Stokes2018).
Until now, our focus has been on whether capitation (single or pooled budgets) may reduce avoidable hospitalizations, also in comparison to other payment models such as P4P and FFS. Adding P4P to FFS may also impact patients’ use of the secondary care sector. The effect on referrals depends on the precise performance measure used in P4P. If for a specific condition referral is a part of improving health outcomes, then PCPs’ referrals to specialists may increase. Several studies have examined the impact of adding other types of P4P to FFS. For example, Chen and colleagues (Reference Chen2017) found no impact of P4P on hospitalizations for hepatitis in Taiwan, where this payment was added onto FFS payment. In Canada, Lavergne and colleagues (Reference Lavergne2018) examined the introduction of an annual payment for guideline-based care plans on top of existing FFS for patients with diabetes, hypertension or chronic obstructive pulmonary disease (COPD). There were no changes in total hospitalizations, though for hypertension hospitalizations for stroke and acute myocardial infarction fell. The addition of P4P to existing FFS payment was also examined in the USA by Rosenthal et al. (Reference Rosenthal2016). They found that inpatient admissions fell in two out of the three examined states. Chen and colleagues (Reference Chen2010) found that after three years of P4P added to FFS payment, patients with diabetes were less likely to be hospitalized. There also exists a specific form of P4P directly incentivizing better coordination of care, called pay for coordination (P4C) (Stokes et al., Reference Stokes2018; Tsiachristas et al., Reference Tsiachristas2013). Under P4C additional payments are made to improve integration with other providers through information sharing. Less evidence exists on the effect of these types of payments on referrals and the use of secondary care.
In summary, there is evidence that primary care payment models can provide financial incentives that influence referrals to more specialized care depending on payment design. Single budget capitation models that only cover PCPs’ care can increase referrals. Generally, FFS and P4P encourage PCPs to undertake more care themselves and so are likely to reduce the use of secondary care compared to other forms of payment, though for P4P this depends on whether referrals are appropriate and lead to improved health outcomes. Global budget capitation payments that pool primary and secondary care funding can also reduce hospitalizations and encourage integration of care across settings. Though we have not examined the quality of the above evidence, many studies across a range of settings and countries had consistent findings. We could find little evidence, however, on how increases or reductions in referrals influence health outcomes and so this question remains an important avenue for further research.
Policy challenge 2: Can primary care payment models improve the quality of primary care?
Background to the policy challenge
A recent focus on quality of care and avoiding low-value care has increased the interest in ensuring that primary care payment models support the provision of high-value health care. In most health care systems, there is a difference between the actual care delivered by PCPs and the care recommended in evidence-based clinical guidelines. This difference is particularly present in LMICs (Das & Hammer, Reference Das2014). If patients do not receive high-quality primary care, it may reduce their quality of life and increase their need for more acute and specialized treatment, which is expensive for payers. As many PCPs face an ageing patient population with more complex care needs, following clinical guidelines is becoming even more important. A key policy challenge is therefore to improve the quality of primary care. This challenge is a part of a larger policy agenda on creating value-based health care systems (Smith et al., Reference Smith2021; Porter, Reference Porter2010). Policy-makers may use different interventions to try to improve the quality of primary care. One of these interventions is paying PCPs for their performance.
How can primary care payment models be used to improve quality?
The key payment method used to improve quality of care is P4P. Such schemes are characterized by linking PCPs’ payments directly to their attainment of quality standards. Even though P4P schemes are based on a quite simple concept, they can be designed and implemented in many different ways and settings and can become complex. These design and implementation choices require careful consideration as they may affect PCPs’ provision of care (Mehrotra, Sorbero & Damberg, Reference Mehrotra, Sorbero and Damberg2010; Eijkenaar, Reference Eijkenaar2013). In the following text, we highlight some of the key features to consider for P4P schemes that aim to improve the quality of primary care.
One key feature is the chosen performance indicators. The indicators should ideally reflect patients’ outcomes from care. However, patients’ outcomes may be difficult to measure and depend on factors unrelated to PCPs’ care. Consequently, the schemes instead often include structure and process indicators (Donabedian, Reference Donabedian1988). An example of a structure indicator could be “whether PCPs have a register of their patients’ smoking status”, whereas an example of a process indicator could be “whether patients with COPD were given a spirometry test”. The schemes may also include indicators related to changes in clinical measures that are more closely related to health outcomes, such as the reduction of blood pressure or blood sugar for diabetes. The different types of indicators to a different degree affect PCPs’ ability to control their own performance, potentially affecting their response to the payment scheme (Oxholm, Kristensen & Sutton, Reference Oxholm, Kristensen and Sutton2018).
As all aspects of quality of care cannot be captured by a single performance indicator, payers therefore need to consider the number of indicators to incentivize. On one hand, incentivizing only a few indicators could introduce multitasking issues and myopia because providers may choose to focus only on certain aspects of care (Eggleston, Reference Eggleston2005; Holmstrom & Milgrom, Reference Holmstrom and Milgrom1991). On the other hand, an increase in the number of incentivized indicators may increase the administrative burden and the complexity of the scheme (e.g. the United Kingdom QOF initially listed 146 performance indicators (see Box 3.1.3)). PCPs who operate in small PCOs may find the administrative burden of P4P schemes, including information technology infrastructure, particularly challenging (see Box 3.1.1). Therefore, P4P schemes should strike a balance between these two conflicting concerns.
Providers’ responses to P4P may depend on the basis for their reward – more specifically, the performance measure and the payment function that trigger the payment (Eijkenaar, Reference Eijkenaar2013). The performance measure may be based on their absolute performance (one time point), their improved performance (two time points), or their relative performance (comparison to other providers at one point in time or over two time points). An example of an absolute performance measure could be “the share of patients with COPD who received a spirometry test in a given year”, whereas an improvement in performance could be “the change in the share of patients with COPD who received a spirometry test in a given year compared to one year ago”. An example of a relative performance could be “the share of patients with COPD who received a spirometry test in a given year compared to the share provided across all PCPs”.
Each of the different types of performance measure comes with both advantages and disadvantages from the payer’s perspective. While rewards based on absolute performance may be perceived as transparent, this approach rewards previously achieved performance. In contrast, payments based on improvements reward only performance that has not previously been achieved. The issue with the measure of improvement is that it gives PCPs a financial incentive to lower performance in one year to be able to improve performance in the subsequent year. Paying based on relative performance (such as tournament-based payments) ensures that the reward adapts to general time trends in performance across PCPs. PCPs may, however, then be rewarded without having changed their behaviour, simply by performing better than others. The relative reward may therefore discourage collaborations between PCPs, unless it is paid at a “team” level such as a medical group.
The payment function determines the level of performance that triggers a reward. The function is often linear (flat rate) or non-linear based on thresholds. Flat-rate payments reward PCPs the same amount for each unit increase in their performance measure. For example, PCPs are rewarded for “each COPD patient that has received a spirometry test in a given year”. This payment function is simple and incentivizes continuous increases in the performance measure. However, it does not provide a clear overall performance target for the PCPs to reach. An alternative is to use threshold-based payment functions, which are characterized by lower or upper limits on the performance payments. One example is target-based payments, where a payment is made only if a certain performance target is met. For example, PCPs are only rewarded if “90% of patients with COPD receive a spirometry test in a given year”. Target-based payment schemes set a clear goal for the PCPs to reach, but only focus on the top end of the performance distribution and may thereby fail to incentivize PCPs who either cannot reach the target or have already reached it. Setting multiple targets may solve this issue by setting obtainable goals for those at the lower end of the performance distribution (Eijkenaar, Reference Eijkenaar2013; Mehrotra, Sorbero & Damberg, Reference Mehrotra, Sorbero and Damberg2010).
The basis of reward may also affect patients’ access to care. Providers may choose to prioritize patients where the costs of triggering a performance payment is low, to the detriment of patients where the cost of improving performance are higher, such as those with more complex conditions (Oxholm, Di Guida & Gyrd-Hansen, Reference Oxholm and Gyrd-Hansen2021). A solution to this unintended consequence of P4P could be to risk-adjust the performance requirements, similar to capitation payment. Another factor that may affect patients’ access to care is whether P4P affects patients’ OOP spending. In many LMICs patients pay OOP for their care. P4P may influence these payments if, for example, providers are incentivized to stimulate patients’ service use to improve their performance (Anselmi, Binyaruka & Borghi, Reference Anselmi, Binyaruka and Borghi2017). In such cases, P4P may make care more accessible to lower socioeconomic patient groups.
The size of the payments may also affect PCPs’ responses to the scheme (Eijkenaar, Reference Eijkenaar2013; Mehrotra, Sorbero & Damberg, Reference Mehrotra, Sorbero and Damberg2010; Zaresani & Scott, Reference Zaresani2021). The payment should be sufficient to cover the costs of changing behaviour, but not of a magnitude that creates budget deficits or removes focus from non-incentivized tasks. The costs of achieving a certain level of performance differ across indicators, PCOs and populations, which must be taken into account when setting payment rates.
The salience of the payment also influences the effectiveness of the scheme. A separate bonus may have more of an impact than if the same payment were delivered as part of usual revenues. The time lag between PCPs’ effort and payment may also affect their response to the scheme, with long lags being demotivating for PCPs (e.g. McMahon, Muula & De Allegri, Reference McMahon, Muula and De Allegri2018). Such delays may in some cases be due to auditing of the performance data. Auditing is an important task for reducing the risk of gaming under P4P, which has been found to be present in both HICs and LMICs (e.g. Gravelle, Sutton & Ma, Reference Gravelle, Sutton and Ma2010; Kalk, Paul & Grabosch, Reference Kalk, Paul and Grabosch2010; Wilding et al., Reference Wilding2022). The payers should therefore try to strike a balance between reducing payment delays and ensuring data accuracy.
Payments made to the medical group rather than the individual PCP may decrease the saliency of the scheme as the medical group may decide not to use the payment to increase the personal income of PCPs but for some other purpose. Earmarking the reward for specific quality-enhancing initiatives instead of to PCPs’ personal income could, however, also put focus on continuous quality improvement. In cases where the reward is given as personal income to the PCPs, the payers may choose to allocate payments in a way that reduces the strength of the incentives, such as sharing the payments equally rather than according to relative performance. This approach incentivizes collaboration among PCPs, but may also create so-called free-riding problems (Prendergast, Reference Prendergast1999), where some PCPs receiving the bonus do not contribute their fair share to the joint achievement.
The saliency of the scheme is also affected by feedback to PCPs on their performance. Some electronic health record systems allow for real-time feedback to PCPs or may automatically prompt PCPs to undertake certain actions based on clinical guidelines, which may improve the quality of their care beyond the financial incentives. The feedback on performance may also be made publicly available. As reputation among colleagues and patients may be important to the PCPs, public access to this information could potentially incentivize PCPs to improve their performance further (Prang et al., Reference Prang2021).
The United Kingdom’s QOF is one of the most comprehensive P4P schemes within a primary care setting. The scheme was introduced in 2004 with the aim of improving GPs’ job satisfaction, pay and quality of care (Doran & Roland, Reference Doran and Roland2010). Participation in the scheme was voluntary, but almost all general practices signed up (Campbell et al., Reference Campbell2009). General practices in the United Kingdom were also remunerated based on capitation, which gave them a financial incentive to keep costs down. The performance payment was added to this remuneration, thereby incentivizing general practices to improve quality of care. GPs’ personal income increased around 30% the first year of the QOF (Allen, Mason & Whittaker, Reference Allen and Whittaker2014).
Initially the scheme included 146 performance indicators, which were linked to clinical care, patient experience, organizational standards and additional services. A barrier for implementation of the QOF was the continuous measurement of practices’ performances on these indicators, which required automatic extraction of data from electronic records. A large investment in health information technology systems was therefore made prior to the introduction of the scheme. The practices were fully reimbursed for these information technology-related costs (Doran & Roland, Reference Doran and Roland2010).
For most performance indicators practices received payments determined by a threshold-based payment function, by which additional absolute performance below a lower (25%) and above an upper (50–90%) threshold was not financially rewarded. The payments were adjusted for disease prevalence and list size of practices. Practices could also exclude patients from the performance measurement if they were untreatable or not willing to be treated. Practices’ performance on each quality indicator was made publicly available (Doran & Roland, Reference Doran and Roland2010). Since the introduction of the scheme, many changes have been made both in terms of the basis for reward and the incentivized indicators.
Evidence of the consequences of P4P for primary care
The majority of the many literature reviews on the effectiveness of P4P schemes in health care conclude that the effect of P4P on quality of care is mixed and limited (see, for example, the reviews by Van Herck et al., Reference Van Herck2010; Eijkenaar et al., Reference Eijkenaar2013; Scott et al., Reference Scott2011). This conclusion also holds when only considering schemes implemented in LMICs (Diaconu et al., Reference Diaconu2021; Singh et al., Reference Singh2020). Whether care is provided in the primary or secondary health care sector may, however, affect the effectiveness of P4P. Some reviews state that the effect of P4P on the quality of care tend to be more positive when targeted at primary care rather than hospitals (Eijkenaar et al., Reference Eijkenaar2013). A recent systematic review of studies based only on outpatient health care finds that P4P slightly improves the quality of incentivized care (Jia et al., Reference Jia2021).
When assessing the consequences of P4P for primary care, most evidence has come from one of the most comprehensive schemes, the United Kingdom’s QOF (see Box 3.1.3). Studies conclude that in the first years of the QOF the performance on several incentivized indicators; for example, related to diabetes and asthma, improved at a faster rate than before the scheme (Gillam, Siriwardena & Steel, Reference Gillam and Siriwardena2012; Roland & Guthrie, Reference Roland and Guthrie2016; Campbell et al., Reference Campbell2009). In fact, many practices received maximum performance payment in the first year of the scheme (Roland & Guthrie, Reference Roland and Guthrie2016). In the longer run the GPs’ performance on the incentivized indicators generally remained at a high level but without further improvements (Guthrie & Tang, Reference Guthrie and Tang2016). Studies also find indications of the scheme leading to relative reductions in some emergency hospital admissions (Harrison et al., Reference Harrison2014), but no effects on mortality rates (Ryan et al., Reference Ryan2016; Kontopantelis et al., Reference Kontopantelis2015).
P4P’s moderate impact on quality of care could be explained by poor evaluation designs, but also by the schemes being designed and implemented in many different ways and settings. For example, small sizes of payments have been highlighted as an explanation for providers’ lack of response. However, a recent meta-regression analysis finds only weak evidence of a positive association between payment size and the effectiveness of P4P schemes (Zaresani & Scott, Reference Zaresani2021). In fact, the analysis finds only a few design features to be associated with the effectiveness of P4P. This conclusion should, however, be interpreted with caution as P4P studies often lack a detailed description of the design features of the interventions. More evidence is therefore needed on the impact of different designs of P4P on the quality of primary care.
P4P may not only impact quality of care but also access to care. The evidence on how P4P affects access to care is limited. Access issues are especially present in LMICs (Diaconu et al., Reference Diaconu2021). Some studies based on LMICs suggest that P4P may improve access to care (Singh et al., Reference Singh2020). This finding may partly be explained by providers doing more outreach work under P4P. For example, a study evaluating a P4P scheme in Rwanda suggests that community outreach may play a role in improving quality of child and maternal care services under P4P (Basinga et al., Reference Basinga2011). Several studies based on LMICs also mention the importance of availability of skilled personnel, drugs and equipment to improve patients’ access to care under P4P (Singh et al., Reference Singh2020). P4P may, however, in itself also have a positive effect on the availability of these resources and thereby improve patients’ access to care. Another factor that may affect patients’ access to care is OOP payments. A recent review of P4P based on LMICs, however, finds no clear changes in user fees under P4P (Diaconu et al., Reference Diaconu2021).
Conclusions
Payment models for primary care can influence broader health system objectives. This chapter, after summarizing the basic methods of payment, explored the extent to which two global policy challenges can be met through primary care payment methods. The evidence suggests primary care payment methods can be used to reduce avoidable secondary care and can influence the quality of primary health care. Though we have not provided a critical review of the quality of the evidence, previous studies suggest that these effects are context dependent and their measurement may vary with the quality of study designs. Furthermore, most studies focus on a subset of outcomes and rarely fully examine cost–effectiveness or effects on health outcomes of patients.
Strengthening primary care to keep patients out of hospital is an important solution to keep health care costs down, but it might not keep costs down if primary care is expanded while secondary care is not reduced. This solution therefore ignores the much more relevant policy question of the optimal mix between primary and secondary care. Existing empirical evidence suggests that payment models can help achieve an appropriate balance between primary and secondary care. This is possible with FFS which encourages PCPs to provide more care themselves, or with pooled capitation budgets, which can exist in vertically integrated health systems. However, expenditures may increase for single budget capitation, where the capitated budget covers only primary care. There also exists some evidence that P4P can encourage more appropriate referrals if performance is measured in terms of health outcomes or following evidence-based guidelines.
Evidence on whether payment models, in the form of P4P, can improve quality of care has mixed results. However, studies based on the primary care setting generally suggest that P4P slightly improves quality of care. The moderate response to P4P could be due to poor evaluation designs, but also due to the schemes being implemented in different contexts and with different payment designs. These design- and context-specific elements therefore require careful consideration. For example, if performance measures are not appropriately risk adjusted, P4P could lead to inequalities in access to primary care. Context-specific factors, such as availability of health care resources and OOP payments, could also impact the effectiveness of P4P. This might especially be the case in LMICs where many patients pay OOP for their care and access to skilled staff, equipment and medicine may be limited. Meanwhile, P4P may in some cases also be used as an instrument to improve the availability of these resources in such settings.
Payment methods in primary care are often blended to create a balanced mix of incentives. For example, salary and capitation payments provide an incentive to minimize costs, whereas P4P and FFS incentivize the PCP to increase activity. The precise blend of these different payment schemes required for payers to reach their goals is difficult to determine as it may depend on the health care setting and context, such as availability of resources or competition among providers. More knowledge is therefore needed on how to blend payments to achieve payers’ goals.
Primary care payment models are of course only one way to help meet health care payers’ goals. These payment models need to be carefully considered within the context of each health care system and its level of development and funding. For example, there are clear differences between HICs and LMICs, where in the latter primary care is usually publicly funded and the last part of the health care system to develop after more specialized hospital care in metropolitan areas. In addition, LMICs generally have fewer resources and so are less likely to have the digital infrastructure that is needed to underpin some payment models such as P4P and the extensive risk adjustment necessary in capitation models (see Box 3.1.1). Payers therefore often face a trade-off between complexity and effectiveness when designing a primary care payment model.
We have examined two important global policy challenges that primary care payment models may impact, i.e. reducing avoidable secondary care and increasing quality of care. There are also many other aspects of health care that primary care payment models can potentially influence, including access to health care such as PCPs’ labour supply, geographical distribution and specialty choice. Reforms to primary care payment models therefore need to be considered holistically in terms of their effects on payers’ goals.Footnote 1
Key messages
Chapter 3.2 covers the way hospitals are paid. Methods for paying hospitals vary across countries and include fee-for-service (FFS), block contracts, line-item budgeting (where purchasers specify exactly what funds are used for) and activity-based funding (with a fixed rate for each episode of care independent of the hospital’s costs of care). Increasingly, pay for performance (P4P) elements are also used. Key learning includes that:
Third-party purchasers: government agencies, social health insurance (SHI) funds or insurance companies provide the bulk of hospital revenue giving them levers to shape provision.
Purchasers and hospitals have distinct objectives that are not always aligned – purchasers will pursue the best quality of care at the lowest price for their covered population while hospitals seek stable revenue streams to cover their costs.
Information asymmetries give hospitals advantages over purchasers.
Purchasers use payment methods and financial rewards to incentivize the volume and quality of care, patient-mix and management effort they want. There are complex challenges around:
○ specifying the details;
○ negotiating effective contracts; and
○ managing payment systems.
Monitoring outputs and safeguarding quality requires structures and systems which are costly.
Reforming funding or transitioning from one payment model to another is often a long process that demands sophisticated design and careful implementation.
Introduction
In most countries the greater proportion of hospital income does not come from patients themselves paying for the care they received. Instead, as detailed in section 1 of this volume, it comes from third-party payers: in tax-based health systems, these payers are government agencies; in social and private insurance-based systems, the payers are sickness funds and insurance companies (see chapters 1.1 and 1.3). Whatever their form, payers share a common set of general funding objectives when it comes to how they pay hospitals, but they may prioritize these objectives differently, and their priorities may change over time.
In this chapter, we discuss the dynamics of the payer–hospital relationship: how payers can use the financial rewards or incentives built into contracts to try and reach their goals and how hospitals use informational advantages about the provision of care to pursue their objectives.
We begin by discussing the relationship between the payer and the hospital and key considerations in any funding policy. Next, we outline the respective funding objectives of payers and hospitals and set out four distinct payment models: line-item budgeting, FFS, block contracts and activity-based funding. We then go on to examine the factors influencing design choice, namely the number of payers and hospitals in the system, what weight payers attach to each objective, and the effort involved in designing and managing the payment mechanism. We consider the issues involved in transitioning from one payment mechanism to another and discuss how to incorporate quality in payment design. Finally, we review the practical issues involved in paying hospitals, by way of a case study of changes in England’s National Health Service (NHS) hospital payment methods between 2002 and 2021. We conclude that there is no “best” payment model, the choice being critically dependent on system characteristics and capacity and related to which objectives the payer wishes to prioritize.
The payer–hospital relationship
Health systems differ widely in their number of payers and hospitals. At one extreme, in a health system in which everybody pays the full cost of care themselves, there are as many payers as there are patients. At the other extreme, patients pay nothing out of pocket (OOP) but instead a single payer, usually a government body, takes responsibility for paying for care. Between these extremes, other health systems feature multiple payers, such as insurance companies, sickness funds or regional health authorities. On the hospital side, some small countries have only a single hospital; in other countries there are many hospitals, sometimes located quite close to each other and, perhaps, in competition with one another. In due course, we shall argue that the number of payers, in particular, and, to a lesser extent, the number of hospitals, are key factors in the choice of payment method.
The choice of payment method is also determined by what payers and hospitals wish to achieve and the system context. To help shape the discussion that follows, we start with a stylized health system with a representative payer and a representative hospital, each with their own set of interests and objectives. We use a principal–agent set-up to describe their relationship, in which the principal (here, the payer) uses a contract (the payment method) to encourage the agent (the hospital) to work in the principal’s interest.
This principal–agent relationship is likely to be imperfect, for two main reasons. First, even if the payer and hospital share some common objectives, they will not coincide exactly. The payer and hospital may attach different weights to those objectives that they have in common, and there might be some objectives that they do not share. The payer uses the contract to better align the interests of the hospital with its own objectives, offering the hospital some form of reward (usually financial) if the hospital does what the payer wants.
Second, the hospital will enjoy informational advantages over the payer: the skills of the payer (priority-setting, pricing, benchmarking) are normally quite different from those of the hospital (operational management and service delivery). As such, the hospital will normally be better placed than the payer to know which combination of inputs (skills, technology) is most likely to lead to the best outcome for an individual patient, and the average and marginal cost to the hospital of treating the patient in this way. But the hospital might exploit informational advantages to further its own interests, both during contract negotiation and in contract delivery (Mühlbacher, Amelung & Juhnke, Reference Mühlbacher, Amelung and Juhnke2018; Jiang, Pang & Savin, Reference Jiang, Pang and Savin2020). During negotiations, the hospital might be able to secure a more generous contract by quoting a higher price than if both parties were equally informed about precisely what work was involved and the marginal cost of that work. If the hospital exploits this advantage, it would mean the payer ends up paying more than it needs to get the job done. Alternatively, or additionally, the hospital might fail to fulfil its contractual obligations in full, perhaps by not delivering contracted services to a professional standard, or perhaps, discharging patients before they have recovered sufficiently to be able to cope at home. To guard against such possibilities, the payer might include specific incentives in payment method design, notably to safeguard quality, as we shall discuss later, and may need to monitor delivery and threaten sanctions if delivery is not to the desired standard.
Key elements of hospital funding policy
In an ideal world hospital funding policy would ensure that the right member of the health care team enables the right care to be delivered, in the right setting, on time, every time, at the right cost (see e.g. Nowak et al., Reference Nowak2012). Hospital funding design should also anticipate and address potentially perverse incentives which militate against achieving the broad overall policy; for example, by encouraging hospital admissions rather than care in the community when the latter might be more cost-effective.
Funding policy has two key elements: the design of payment flows, and the conditions or rules associated with the payment flow. These need to reinforce each other, reduce the risk of gaming and perverse incentives (Steinbusch et al., Reference Steinbusch2007) and capture the nuances required in a comprehensive funding policy. Policy-makers in different jurisdictions undertaking funding reform will face different challenges – including availability of information, industrial relations constraints, providers’ management skills – and, consequently, the choice of payment model will partly reflect these local issues.
Different funding designs can emphasize one objective over another, and the priorities for different objectives will change over time, but we can consider the main objectives typically seen in hospital funding policy (Geissler et al., Reference Geissler and Busse2011).
Payer objectives: how they affect payment model design
From the payer´s perspective, there are four key issues to consider when designing how to pay hospitals: the number and type of patients to pay for, the quality of care, how much to pay hospitals, and how much effort the payer has to put into managing the payment method(s).
Issue 1: number and type of patients
Payers want the payment model to provide incentives for hospitals to treat patients, but specifying this incentive is challenging, again for two main reasons. First, while it is straightforward to quantify patient numbers, it is more difficult to take account of differences between patients: some are admitted for fairly routine operations, many are admitted without warning in need of immediate emergency care, some require ongoing care for multiple long-term conditions. As we shall see, one of the key distinguishing features of alternative hospital payment models is in how different types of patients are described.
The second difficulty in designing a payment model to incentivize treatment is that it might be better for some people to receive their care in settings other than the hospital. Payers want to ensure that unnecessary admissions are minimized, these being potentially preventable hospitalizations and those offering no or low-value care. However, there is information asymmetry between the payer and hospital on the need for admission, as hospitals will have more information about the patient’s health status at the point of admission than the payer. Measurement tools for no and low-value care and potentially preventable admissions are not sufficiently refined to make case-by-case determination of the potential benefit of admissions but may be able to be used for retrospective monitoring.
Issue 2: quality of care
Defining quality of care is also tricky. Its definition needs to capture concepts associated with how hospitals are organized (structure), how patients are managed (process), and how health problems are addressed (outcome). Typically, quality has been poorly defined in the design of hospital payment arrangements, though that is beginning to change.
The simplest funding design includes an implicit assumption about the quality of service provision, the hope being that payers and hospitals attach equal weight to quality, such that it will not be compromised. However, because it might be costly to provide higher-quality services and quality is difficult to measure, hospitals might reduce quality in order to treat more patients, especially if this generates higher revenue. This might be manifested as poorer process quality, such as patients having to wait a long time before their hospital appointment. Delayed access may then exacerbate their health problem, thereby proving more costly than quicker access, and long waits for access could cause reputational damage to payers and their political overseers; and/or health outcomes might be compromised. Alternatively, hospitals might discharge patients from hospital too early, transferring responsibility for care and shifting costs onto the family and primary or community care providers, a phenomenon dubbed “quicker and sicker discharge”, which has been the subject of many studies (Kosecoff et al., Reference Kosecoff1990; Qian et al., Reference Qian2011). Other adverse quality consequences are harder to assess, but recently funding policies have elaborated on the quality dimensions of funding design so as to explicitly incorporate factors related to clinical quality, patient experience, patient-reported outcomes, timeliness, appropriateness and other aspects of care valued by patients and payers. We discuss incentives for high-quality care below (sometimes called P4P).
Issue 3: size of payment
The payer’s utility is decreasing in the amount it pays to the hospital: given the choice, the payer would prefer to make lower payments to the hospital and this might motivate the payer to design a payment system that encourages efficient practice by the hospital. These payments will be related to the amount of money that the payer has available to meet its objectives. Ensuring that the payer pays the “right” amount to hospitals is an important overall policy goal. But there are two quite distinct ways in which the “right amount” can be expressed: the total amount to be paid for all patients to be treated, or the amount for each patient individually. If the payer is a government agency, the total amount may take the form of a budget constraint imposed by the government, and might reflect the size and composition of the population served. If the payer is a sickness fund or insurance company, the amount will depend on the insurance premiums made by its enrollees but also other contributions such as co-payments. If there is no third-party funding, with patients having to pay for everything themselves, the constraint reflects the financial resources each individual patient has available.
In any system – whether tax-based, insurance-based or privately funded – there are trade-offs in how money is spent. More spending on hospital care means individuals or societies have less to spend on other types of health care or on other individual or social goals. The ideal is that the marginal benefit of any increment in spending on hospitals yields the same marginal benefit as an investment in public health, primary care, education, defence, transport or anything else. In a publicly funded system, governments make decisions about total spending on health, and within health portfolios, on hospitals, given the budget constraints of the payer. The calculus behind these decisions might involve sophisticated analysis of marginal benefits and marginal costs using techniques such as programme budgeting and marginal analysis (Tsourapas & Frew, Reference Tsourapas and Frew2011; Kapiriri & Razavi, Reference Kapiriri and Razavi2017), but are more likely to be shaped by path dependency, history and politics in assessing what marginal changes can be implemented in the current budget.
Recognizing that resources are scarce and choices have to be made, an objective of hospital funding policy might be to control total hospital spending, to keep within the resources available to the payer. A related funding objective would be to give hospitals incentives via the payment system to pursue technical efficiency, namely to treat patients at lowest cost, subject to there being no adverse quality consequences. Objectives about promoting efficiency can only be pursued with reasonable amounts of effort by the payer if there are robust ways of measuring the quantity and quality of care that hospitals provide. These two funding ambitions – about controlling total expenditure or ensuring optimal efficiency – can be met simultaneously. However, it is much more common for one objective to be emphasized over another, or for efficiency objectives to be seen as part of the strategy to achieve expenditure control.
Issue 4: amount of management effort needed
In designing a payment model, the payer will also consider how much effort they – and hospitals – have to put into negotiating and managing the contract, making the payer averse to implementing a payment system with overly complex design features or contract monitoring requirements, especially in places where the capabilities to implement and manage a complex payment system are in short supply. We discuss this issue in more detail below.
Hospital objectives
We turn now to what hospitals wish to achieve. Like the payer, the hospital also cares about the number and type of patients treated and the quality of care they receive. If the payer and hospital attach exactly the same weight to these concerns and provision of care is costless, there would be no need for a contract: the hospital would do what the payer wants, without needing to be asked. This situation is referred to as perfect agency. But, in practice, the interests of the payer and hospital are likely to differ. They might disagree about how many and which type of patients should be admitted to hospital; they might also have different views about the appropriate quality of care. In addition, hospitals are concerned that their income covers their costs and enables them to function; and that the payment system can be managed to serve their interests.
Sufficient income to cover costs
The main reason that the interests of payer and hospital differ is that provision of health care is not costless. The hospital has to employ a variety of labour and capital resources in order to deliver care, incurring various costs in the process. Consequently, the hospital requires a stream of revenue to ensure that it can function. The hospital will be concerned that the money received from the payer is at least sufficient to cover these costs. The more that the hospital is driven to make its income from the payer exceed its costs – be that by increasing the former or by reducing the latter – the greater the weight it will place on this element in its objective function.
A manageable model
It also takes effort to manage the contract with the payer – directly (in terms of the hospital’s administrative burden) and indirectly (in terms of how stretching the contract’s terms are on the hospital’s staff). Like the payer, the hospital might prefer a simpler payment model, with minimal reporting requirements. This preference will be driven partly by a desire to reduce its administrative burden, but a simpler model might also provide greater scope for the hospital to increase the surplus of its revenue over its costs, by exploiting its information advantages. For this reason, the payer might not choose to adopt the simplest payment model.
Hospitals as “multi-product” firms
Hospitals may be characterized as multi-product firms, and so payment policy must recognize and pay fairly for all appropriate services, with “appropriate” here being from the perspective of the payer. If paying for activity, payers will need to ensure that activity is appropriately described. Diagnosis-related groups (DRGs) are the most common classification for inpatient activity but cannot be used for outpatient activity, and have poor explanatory power for mental health activity and other activity, such as rehabilitation, so service-specific classifications have been proposed in these areas (Jackson & Sevil, Reference Jackson and Sevil1997; Mason et al., Reference Mason2011; Sutherland & Walker, Reference Sutherland2007). As well as caring for patients, some teaching hospitals engage in the education and training of future generations of health professionals and undertake research, which also need to be paid for in some way.
Better payment models minimize the extent to which the characteristics of providers are used in funding design, emphasizing payment for what is provided rather than who provides it. The one exception to this rule is for smaller hospitals – typically located in rural areas – where a key role of the hospital is ensuring access in these areas. Here, alternatives to standard payment methods will be required to protect viability and ensure an appropriate service response to community need (Holmes, Pink & Friedman, Reference Holmes, Pink and Friedman2013; Murphy, Hughes & Conway, Reference Murphy, Hughes and Conway2018).
Payment methods for hospitals: four key types
Hospital payment methods can be categorized into four archetypal groups. In this section we set out the key features of each, summarized in Table 3.2.1, allowing us then to discuss the factors influencing which model payers are likely to adopt.

Table 3.2.1a Long description
The table has 5 columns: Criterion, Line-item budgeting, Fee-for-service (F F S), Block contracts, and Activity-based funding (A B F). It reads as follows. Row 1: Description of patients. Line-item budgeting: Not applicable. F F S: Individual patients. Block contracts: By cohort, such as department, hospital, locality, region or demographic (e.g. frail and elderly patients with multiple chronic conditions). A B F: D R G for inpatients and other classifications for outpatients, mental health care, community health care.
Row 2: Price setting. Line-item budgeting: Expected cost of resource type. F F S: Price list for each service or payment per day. Block contracts: Price is out-turn of negotiated total contract value divided by cohort covered. A B F: Prospective price set by payer so as to incentivize hospitals (for example, by yardstick or actual competition).
Row 3: Volume of activity. Line-item budgeting: Not specified. F F S: Hospitals face no restrictions on volume. Block contracts: Expectations on hospital - normally including activity levels per cohort - set out in contract. A B F: In the simplest form of unit pricing, no restrictions of volume. In more complex forms of bundled pricing, implicit constraints on volume.

Table 3.2.1b Long description
The table has 5 columns: Criterion, Line-item budgeting, Fee-for-service (F F S), Block contracts, and Activity-based funding (A B F). It reads as follows. Row 4: Quality. Line-item budgeting: Not specified. F F S: Not specified, but implied that more services indicate higher quality. Block contracts: May be set out in contract. A B F: May be included in payment function.
Row 5: Administrative complexity or effort. Line-item budgeting: Low complexity: need method to link costs to be funded (staff, medicines, machines, etc.) to hospital role. F F S: High complexity: need for itemized bills, may involve fee schedule to reflect costs of different items, and monitoring systems to avoid overservicing and ensure payment integrity. Block contracts: Moderate complexity: need to develop systems to ensure adequate services are provided to meet needs of patient cohorts and to ensure efficiency. A B F: Highest complexity: need to implement D R G classification, develop tariff or prices (unit and/or more complex) and monitor systems for payment integrity (for example, code, count and cost units of activity).
DRG: diagnosis-related group.
Line-item budgeting
Under line-item budgeting hospitals are funded according to the type and amount of resource inputs used in delivering care. Budget lines tend to be itemized in fairly crude terms as inputs, such as medical and nursing staff, medicines, meals, laundry, materials, equipment, energy, estate and management costs. The payer, usually a government agency, sets the budget in advance, often built up by categories of inputs (e.g. approval to employ a specific number of nurses for a given amount of money) so that the hospital has clarity about the money it will receive to pay for these items.
This was the form of funding across the former Soviet Union in which central government determined the quantity of resources available to each hospital and fixed wages and prices (Mikesell & Mullins, Reference Mikesell and Mullins2001; Street & Haycock, Reference Street and Haycock1999; Moreno-Serra & Wagstaff, Reference Moreno-Serra and Wagstaff2010).
Advantages
The principal attraction of line-item budgeting is that it provides certainty to both the payer and hospital about the amount of revenue to be made available over the coming budgetary period, with tight expenditure control being the guiding principle. It also comes with a low administrative burden, the budget being based on readily measurable inputs and with monitoring usually limited to ensuring that the budget was spent on the inputs as specified.
Disadvantages
This funding arrangement has several drawbacks (Langenbrunner & Wiley, Reference Langenbrunner, Wiley, Mckee and Healy2002). First, hospitals have no incentive to reduce the use of inputs – indeed the reverse, because any input reductions would probably be met with subsequent budget reductions. Second, just as the overall budget is tightly controlled, so is each line item, thereby ruling out substitution of one type of input for another. Third, the budget says nothing about how the money should be spent on those requiring care: the budget is unrelated to the number and type of people treated at the hospital. Overall, viewed in these terms, line-item budgeting provides little or no incentive for innovation, is unresponsive to the needs of patients and can be viewed as a simple, static payment system.
FFS
FFS is particularly common in health systems in which patients (or their insurers) pay for care themselves, with hospitals issuing bills for the care and treatment provided. Under FFS, hospitals receive a fee for each medical service provided to each patient, these being itemized on the bill. The services will include diagnostic tests, operative procedures, medications and a daily “hotel” charge to cover such costs as laundry, cleaning, meals, energy and general overheads. Hospitals in some health systems use a simple billing arrangement, loading everything onto the daily charge, with hospitals receiving daily payments rather than a price for each itemized service.
Advantages/disadvantages
Under FFS, the more medical services provided and the longer the length of stay, the more a hospital earns in revenue. Hence, as long as it believes that patients are able to settle their bills, the hospital may be incentivized to treat every patient seeking care and to do as much as possible for them. For those able to pay, FFS might provide access to better amenities and more services (Ikegami, Reference Ikegami2015). If so, and if “more is better”, FFS provides greater incentives to provide higher-quality care than the alternative payment models. But it could also lead to overtreatment and the provision of low-value services (Zhao et al., Reference Zhao2018; Chalmers et al., Reference Chalmers2019).
The hospital issues its bills retrospectively, after services have been rendered, either to the patient or the patient’s insurer. Whoever the payer is, there is little choice but to settle the bill, putting the payer at high financial risk. In countries without universal health insurance, this can lead to catastrophic health expenditures for patients, whereby patients may receive bills amounting to anything between 10–40% of family income, or bankruptcies due to health care costs (Himmelstein et al., Reference Himmelstein2019; Dobkin et al., Reference Dobkin2018; Xu et al., Reference Xu2003a; Reference Xu, Murray and Evans2003b; Reference Xu, Murray and Evans2003c; Wagstaff, Eozenu & Smitz, Reference Wagstaff, Eozenou and Smitz2020).
Sometimes insurers question whether particular services given were necessary. Utilization reviews are the most common way to do this, but these are expensive and have little effect on the volume of services provided (Rosenberg et al., Reference Rosenberg1995). In practice, then, the quantity of services is largely determined by the hospital. Most usually, insurers try to limit financial risk by imposing a fee or price schedule, detailing the price per service that they are prepared to pay. This would mean that the price for each service is determined by the payer. In the absence of insurance, patients have no ability to influence these prices.
Block contracts
The key idea of the block contract funding model is that the amount to be paid is determined in advance. As a minimum, block contracts stipulate the delivery timescale, the total amount of money to be paid, and the cohort (that is, type and number) of patients to be treated. There might also be some specification of quality. Sometimes the block contract will take the form of a capitation payment model covering a particular patient population, with the amount reflecting expectations about utilization among that cohort. The capitation payment (or price per patient) is simply the total amount of money specified in the contract divided by the number of patients in the cohort. The payer and hospital are likely to enter into several contracts, differentiated according to how cohorts are described. The cohort might reflect the hospital department with primary responsibility for delivering the particular type of care, the hospital’s catchment area, the wider geographical region the hospital serves, or some indication of the type of patient in the cohort (e.g. frail and elderly patients with multiple chronic conditions). Sometimes a hospital might enter into a single contract for an especially large patient cohort, this special case being referred to as a “global budget”. Where capitation payments rely on the clinical characteristics of enrollees, the payer has to be wary of gaming risks where the funded entity artificially inflates diagnoses (Geruso & Layton, Reference Geruso and Layton2020; Porter & Kaplan, Reference Porter and Kaplan2016; Chernew et al., Reference Chernew2021).
A block contract can be used in a variety of different circumstances, with different effects. For instance, block contracts might be the historical form of the payer–hospital relationship, with contracts determined by history or past negotiations. Here payers put a high value on their effort in determining and monitoring contracts, with less emphasis on quantity or quality. Negotiation-based block contracts might involve an expected quantity to set the value of the contract, but with little scope for variation from the total spend if volume exceeds expectations. If so, activity-related cost risk sits with the hospital, not the payer. So this form of block contract might be preferred by payers with tight budget constraints. Because of their relative simplicity, block contracts are often used for services which cannot be described particularly well, such as where an activity measure has not yet been developed (e.g. mental health services); it is a unique service (e.g. highly specialized care); or the service would be unviable under other methods of payment, but the payer wants to ensure the service continues (e.g. small rural hospitals necessary for access). With this form of block contract, the activity-related cost risk sits with the payer.
Advantages/disadvantages
Block contracts provide financial certainty for both the payer and the hospital, as the total contractual value is decided in advance, particularly if the payer imposes a “hard” cap where activity beyond the contracted amount is not reimbursed. The danger of a hard cap is that the hospital risks being unable to cover its costs if demand exceeds the contracted volume, because they will not receive extra funding. This might encourage hospitals to do just enough to fulfil their contractual obligations and refuse to treat more patients than the contracted volume. This would result in either denied or delayed care. Indeed, hospital waiting lists are often evident where block contracts are the dominant form of hospital funding (Iversen, Reference Iversen1993; Street & Duckett, Reference Street and Duckett1996). This problem might be mitigated if the contract allows for a “soft” cap, permitting partial reimbursement of extra activity (Chen & Fan, Reference Chen and Fan2016).
Although contracts provide certainty, payers may still make excessive payments. This is because the values for both the target volume of patients and the price are a matter of negotiation between payer and hospital. As the hospital enjoys an informational advantage on both counts, it may be able to secure a higher contract value than if both parties were equally informed.
Activity-based funding
The fourth payment type is activity-based funding, which is sometimes referred to as case mix funding, DRG funding or the prospective payment system.
In terms of how patients are described, activity-based funding can be considered a half-way house between FFS and block contracts. Under FFS, a personalized bill is drawn up for each individual patient. Under block contracts, the contract is usually specified at cohort – often departmental – level, implying that patients are described in fairly large and heterogeneous groups in the contract. Under activity-based funding, patients admitted to hospital are usually described using DRGs for patients, though other DRG-like classifications might be used for activity conducted in emergency departments, outpatient or other (e.g. mental health, community) settings. DRGs were first developed by Fetter et al. (Reference Fetter1980) as a means to identify groups of admitted patients with similar diagnoses who were expected to have similar resource requirements during their hospital stay. This design principle has guided the development of DRG systems around the world (e.g. Busse et al., Reference Busse2011; Kimberly & de Pouvourville, Reference Kimberly1993). The design of the DRG classification aims to maximize within-group homogeneity but, because there is a limited number of groups in the DRG classification, inevitably each group is still somewhat heterogeneous. Consequently, activity-based funding entails a less precise description of patient specificity than under FFS (where effectively each patient is their own group) but a more precise description than under block contracts.
Importance of clinical accounting skills: coding, counting and costing
Activity-based funding cannot be adopted without some form of system for classifying activity – known as coding, counting and costing – and countries have to decide whether to adopt or adapt systems developed elsewhere or create their own (Mathauer & Wittenbecher, Reference Mathauer and Wittenbecher2013). Usually there is quite a protracted transitional period between introducing a coding-counting-costing classification system to describe hospital activity to its being used for payment purposes (Bredenkamp, Bales & Kahur, Reference Bredenkamp, Bales and Kahur2020). The choice of classification system is dependent on the underlying information infrastructure for coding, counting and costing activity, which influences how electronic data are collated from each patient’s medical record, how data are shared between hospitals and payers, and how these data are verified. Developing and maintaining coding-counting-costing classifications across the range of hospital activities – including acute inpatients, outpatients, mental health patients, activity in emergency departments, ambulatory patients and others – requires good information systems and technical clinical recording, i.e. clinical documentation and coding skills.
All classification systems begin with good clinical recording. This is not a minor issue, even in high-income countries (HICs) with a long tradition of clinical coding and using patient records for research (e.g. the English NHS), but in low- and middle-income countries (LMICs) a patient’s complexity may not be fully reflected in diagnoses recorded in routine data sets, which may especially miss out on comorbidities (Dyers et al., Reference Dyers2016). Preparing for activity-based funding in these countries should include strategies to improve clinical accounting skills (Moghaddasi, Rabiei & Sadeghi, Reference Moghaddasi, Rabiei and Sadeghi2014).
Mis-recording of comorbidities will weaken the discriminatory power of a classification system but will not necessarily preclude the use of activity-based funding. Kyrgyzstan, for example, started its transition from line-item budgeting to activity-based funding in 1997 with a home-grown classification system comprising just 28 DRGs (known there as clinical costing groups), expanding to 144 DRGs in 1998 and to 284 in 2019 as information systems better recorded diagnoses and procedures (Bredenkamp, Bales & Kahur, Reference Bredenkamp, Bales and Kahur2020).
Price setting
As with block contracts, activity-based funding prices are set in advance and are not related to the costs of any specific hospital but rather are set by the payer, usually following its review of the totality of costs for each DRG reported by all or a large selection of hospitals in the payer’s jurisdiction. This form of price setting is known as “yardstick competition”, a term coined by Shleifer (Reference Shleifer1985). Crucially this means that each hospital is a “price-taker”, unable to influence the price it faces, mirroring what would be the case in a perfectly competitive market. By translating the cost information into prices, the payer effectively is making hospitals benchmark themselves against each other to reduce their costs, the price acting as a yardstick to which higher-cost hospitals should aspire. This should encourage hospitals to improve efficiency and minimize overprovision of services to the patient (Vladeck & Kramer, Reference Vladeck and Kramer1988). The payment system is also perceived as fair, offering “equal pay for equal work”, with hospitals receiving the same price for each patient allocated to the same DRG. To function, this arrangement requires cost information from a sufficient number of hospitals for the benchmark to bite, the more the better. Of course, some health systems have very few hospitals, in which case the payer might need to seek benchmark information from elsewhere, perhaps from other health systems. For example, when activity-based funding was introduced to fund the main Landspítali University Hospital in Iceland, benchmarking information about hospitals in Sweden was used to inform prices (Hafsteinsdóttir & Siciliani, Reference Hafsteinsdóttir and Siciliani2012).
Advantages/disadvantages
As hospitals receive a predetermined DRG price for each patient assigned to that DRG, regardless of the actual cost, some of the financial risk is shifted from the payer to the hospital. This happens because, although patient volume remains a risk for the payer, the hospital assumes risk for its case mix. The more complex (and therefore costly) that the hospital’s patients are in a given DRG, the less likely it is that the predetermined DRG price will cover its cost of treating them.
Activity-based funding could stimulate undesirable behaviour; for example, hospitals might engage in coding-creep, “cream-skimming” or skimping. Coding-creep arises when a hospital classifies “a patient in a DRG that produces a higher reimbursement” (Herwartz & Strumann, Reference Herwartz and Strumann2014; Simborg, Reference Simborg1981; Steinbusch et al., Reference Steinbusch2007; Carter, Newhouse & Relles, Reference Carter, Newhouse and Relles1990; Steinwald & Dummit, Reference Steinwald and Dummit1989), evidence suggesting such practices do occur (Jürges & Köberlein, Reference Jürges and Köberlein2015). With cream-skimming, hospitals actively select patients that are cheaper to treat. Hospitals might be able to do this because they have better information about the patient´s condition and prospects than those designing the DRG categories. Cream-skimming allows a hospital to identify more profitable patients, i.e. those with expected costs lower than the prospective price. Skimping involves underproviding services, perhaps by discharging a patient too early (Ellis, Reference Ellis1998). These undesirable responses can occur with other funding models too. However, because the link between clinical accounting and income is more pronounced under activity-based funding and FFS than block contracts or line-item budgeting, these responses are more of a risk under activity-based funding and FFS than for the other funding models.
In combination with other methods
Activity-based funding is often coupled with one of the other types of payment system, as not every type of hospital activity can be described using activity measures. For example, Kwon and Shon (Reference Kwon, Shon, Annear and Huntington2015) report that hospital income in Australia, Japan, Korea, New Zealand and Singapore is a mixture of activity-based funding and FFS, with hospital income in Thailand a mixture of activity-based funding, FFS and block contract. Especially in early phases of activity-based funding implementation, it may be coupled with FFS or block contract to pay for services to describe teaching and research activity, or services which may span inpatient and community care boundaries.
Influences on choice of payment model
There are four key factors influencing the choice of payment model: the number of payers, the number of hospitals, the relative importance the payer attaches to their objectives, and payer (and to a lesser extent, hospital) effort in managing the system.
Key factor 1: number of payers
The first and most important factor is the number of payers in the health system. The fewer payers there are, the more power they are able to exercise in negotiations with hospitals. In health systems with no third-party payers, each patient is a payer, with minimal bargaining power. In such circumstances, patients are price-takers, having to pay what hospitals ask, with FFS being the typical payment model. If the health system features third-party payers in the form of insurance companies or sickness funds, FFS is also common, but these payers may be able to exert collective influence on hospitals in the form of a fee schedule in order to contain overall payments. But, even so, hospitals enjoy considerable power in deciding what volume of services to provide to each insured individual.
In other health systems, notably where health care is funded via taxation, third-party payers often take the form of government agencies with responsibility for specific populations, perhaps defined on the basis of geography, income or age. These payers receive a share of national tax funds to fulfil these responsibilities, this share usually calculated using a capitation formula reflecting the size and composition of the population. If there are only a few hospitals in their area, agencies may prefer to negotiate block contracts with hospitals (because of their lower administrative burden) which will likely reflect the volume (number) and type (composition) of hospital patients covered by the contract. As there are just two parties to each contract, the hospital may be able to exploit its information advantage to secure favourable terms.
Some health systems feature just a single payer. This shifts the balance of bargaining power from hospitals to the single payer, who is able to exploit its monopsony purchasing power and force hospitals into being “price-takers” rather than “price-makers” by imposing either line-item budgeting or activity-based funding payment models.
Key factor 2: number of hospitals
The second factor influencing the choice of payment model is the number of hospitals to which payments are to be made. If there were a very large number of hospitals, all providing similar services and competing with one another to attract fully informed patients, FFS would be an efficient choice. This competitive environment would ensure that high-quality services were provided and fees were kept low. But this is not the customary environment that prevails in the hospital sector because of the asymmetry in information between hospitals and their patients. Rather, it is much more common for hospitals to face little competition, instead enjoying a degree of local monopoly power. A hospital might even have national monopoly power, in smaller countries or if they are the only providers of specialized care. The greater its monopoly power, the more ability a hospital has to set its own fees, thus making the FFS model less attractive to payers.
The other three payment models impose more financial control over hospitals than the FFS model, and line-item budgeting and block contract can be applied irrespective of the number of hospitals in the health system. However, under activity-based funding prices are set by comparing costs across hospitals, so there needs to be a sufficient number of hospitals from which the payer collects comparative data. As with FFS, the fewer the hospitals, the greater the scope for a hospital to influence prices advantageously, because its own data will have greater influence on the price it faces. To limit this influence, payers implementing activity-based funding may set prices using comparative cost or pricing information from hospitals in other jurisdictions.
Key factor 3: relative importance of payer objectives
The third determinant of the choice of payment model is the relative weight that payers attach to their different objectives, in particular: controlling hospital costs, volume of activity and quality of service.
Budget constraint
The greater the weight attached to controlling hospital costs (especially for payers subject to a hard budget constraint), the more likely that line-item budgeting and the less likely FFS and activity-based funding will be adopted. This is because FFS and activity-based funding both encourage additional activity, unless explicit activity capping mechanisms are introduced. Block contracts make management of the budget constraint easier for the payer than FFS and activity-based funding, but not as easy as line-item budgeting.
Volume of activity
FFS exercises no restriction on the volume of activity. Neither does activity-based funding, at least in its simplest form (i.e. with unit prices). Because line-item budgeting is concerned with resources more than quantity and quality, it neither specifies activity levels nor places restrictions on them. Again, block contracts lie somewhere in the middle from the payers’ perspective, depending on how the contract is specified. At its crudest, the block contract could be whatever was agreed financially between payer and hospital for the last contracting period, increased for anticipated inflation (in activity and/or costs) over the current contracting period and decreased for expected efficiency (in activity and/or costs) over the current period. Here, the payer’s target level of activity is included only in an aggregate sense, through the interaction of the last contracting period’s activity and the uplift and reduction for the current period. In other cases, however, the block contract may be built bottom-up and not top-down. In this case, the payer’s target level of activity is explicitly included at a disaggregated level (e.g. by hospital department or point of delivery).
Quality
From the payer’s perspective neither line-item budgeting nor FFS inherently specify quality. That said, under FFS, hospitals earn more revenue by providing more care so, provided more care is better care, then FFS incentivizes quality. The same argument applies to activity-based funding, which incentivizes hospital activity, if more activity equates to better quality. In practice, however, more care may not equal better care. That said, if there is head-to-head competition between hospitals, by setting prices prospectively both activity-based funding and block contracts ensure that competition drives quality up rather than driving prices down. In addition to this inherent quality assurance mechanism, both block contracts and activity-based funding can incorporate specific payment for quality.
Key factor 4: administrative effort
The final relevant factor is the effort involved in managing the payment methods (Baxter et al., Reference Baxter2015). Payers and hospitals need to optimize the amount of effort involved. Payment arrangements are not frictionless: both payers and hospitals need to exert effort in agreeing and managing the contractual relationship between the two parties. For hospitals, this will require ensuring that internal structures of the hospital make it easy to address the exogenous incentives – control of the mix of services used in treating a patient typically rests in the hands of the medical staff and so the job of hospital senior management includes ensuring that hospital doctors recognize the hospital’s funding constraints (Young & Saltman, Reference Young and Saltman1985).
Payers also need to exert effort to ensure that the funding design delivers on the objectives that they have prioritized. The more complex the funding model, the more effort is expended by both hospitals and payers in managing and monitoring it. Payers, especially, have to be wary of making the funding model overly complex. The more complex the model, the more difficult it will be for hospitals to understand the nature of the incentives at play and the more likely they are to ignore the incentives or respond to what they perceive the incentives to be (Abeler & Jäger, Reference Abeler and Jäger2015). Moreover, if the incentives are unstable – for example if prices vary widely from year to year – hospitals may decide that the effort in responding to a given year’s incentives is not worth the benefit, and so they might ignore the incentive.
Line-item budgeting involves minimal administrative complexity, both in terms of how the budget is specified and in how spending is monitored. As such, this payment method is likely to be preferred in places where information systems are poorly developed. Activity-based funding is the most complex of the payment methods, requiring implementation and maintenance of a classification system to describe patients, a pricing schedule and a monitoring system to verify the integrity of payments made by payers to hospitals. FFS and block contracts lie between these extremes.
The importance of management and policy skills can be seen in the results of the implementation of activity-based funding in central and eastern Europe, and central Asia. In their study of the system-wide impacts of hospital payment reform, Moreno-Serra and Wagstaff (Reference Moreno-Serra and Wagstaff2010) found that, contrary to theory, total health expenditure increased following implementation of activity-based funding. Moreno-Serra and Wagstaff hypothesized that this may have been due to DRG coding-creep. The potential for coding-creep should have been foreseen and its effect mitigated through a variety of strategies such as assuming a DRG effect of a particular size and factoring that into the price in advance, or through rigorous auditing of coding. The impact of coding-creep could also be ameliorated by imposing lagged soft expenditure caps (Hahn, Reference Hahn2014; Holahan & Zukerman, Reference Holahan and Zukerman1993).
Transitioning from one payment method to another
The choice of payment method and its specific design features is context dependent and that context may change (D’Aunno, Kimberly & De Pouvourville, Reference D’Aunno, Kimberly, De Pouvourville, Kimberly, De Pouvourville and D’Aunno2008; Mathauer & Wittenbecher, Reference Mathauer and Wittenbecher2013). Funding reform often adopts the twin system objectives of transparency of processes and outcomes, and fairness between hospitals, to facilitate support for implementation of the system change. In these circumstances, the key design elements of the payment method need to be clear and understood, and there needs to be a clear line of sight between the work performed by the hospital and the payment flow.
We have set out the key drivers of the choice of model in the previous sections, but other factors also play a part, perhaps relating to management, policy, information system readiness or path dependence. The payer’s objectives, however, are the dominant driver, and these might change over time, triggering a move away from one type of payment method to another.
The process of transition: what is involved?
The transition process is often a long one, as the preconditions are developed (Annear et al., Reference Annear2018), or the right policy window appears. Improved provision of comparative information to providers – to allow them to see where they stand on efficiency and other variables – is often part of a capacity-building phase.
A common next step is that this comparative information is used to inform budget setting – benchmarking here is an input into the budget negotiating process or used to inform the block contract. For example, in their review of the development of activity-based funding in 12 countries in Europe, Busse and Quentin (Reference Busse, Quentin and Busse2011) showed that in half the countries the original use of the DRG classification system was simply descriptive or to inform budget allocation. Bredenkamp, Bales and Kahur (Reference Bredenkamp, Bales and Kahur2020) drew a similar conclusion in their review of the transition to activity-based funding in nine countries. Indeed, the possibility for such benchmarking was one of the drivers of the initial development of DRGs (Fetter, Brand & Gamache, Reference Fetter and Brand1991).
Transitioning: key questions and trends
Payers normally will have objectives about how the health system transitions from the old funding system to the new. These objectives might be about the pace of the transition. Over how many years is the phase-in? What proportion of funding is on the old versus new basis? And what should be the ordering of the transition – for example, starting with patients having elective procedures, or particular classes of patients or particular types of costs (Duckett, Reference Duckett, Annear and Huntington2015)? Because there will be winners and losers from any transition between funding systems, the payer’s objectives about the pace and phasing will often also factor in how to manage these gains and losses (Short & Goldfarb, Reference Short and Goldfarb1987).
The introduction of new funding systems also often provides the opportunity to revisit the nature of the relationship between the payer and the hospital–- what types of controls might be kept or changed? How much autonomy will hospitals have in the new environment? What constraints might there be on hospital innovation? Introducing new funding systems may even be driven by a desire to change that relationship.
Payers might try to pursue multiple objectives simultaneously, although this will require a more sophisticated design pursuant to the Tinbergen Rule, that multiple objectives require multiple instruments (Tinbergen, Reference Tinbergen1952). For example, one of the early implementations in 1993 of activity-based funding, in Victoria, Australia, had three objectives: to reduce total hospital expenditure; to improve the efficiency of hospitals; and to increase the number of patients treated and reduce elective procedure waiting lists (Duckett, Reference Duckett1995). Activity-based funding in Victoria replaced a system of negotiated block contracts. The stimulus for the introduction was a significant budget cut (15% over three years), effectively a tightening of the budget constraint, and a recognition that a reduction in the budget of that magnitude would, under a block contract system, probably result in a significant reduction in the quantity of services provided (and hence access). An activity-based funding model for acute inpatient activity was implemented – with hospital-specific activity caps but a potential to share in a capped allocation of extra funds for extra activity (Street & Duckett, Reference Street and Duckett1996) – with all other hospital services paid on a block contract in the absence of robust activity measures for those services.
Preconditions for transitioning from simpler to more complex methods
In view of the considerations set out in this section, it is common in practice to see a mix of funding methods used within any given health system, thereby moderating the extreme effects of any single method. “Transition” then means altering the mix of methods, rather than shifting wholesale from one to another. Yet regardless of whether transition is from one method to another or is a shift in the mix of methods from one to another, there are four preconditions for shifting from simpler funding methods (line-item budgeting, block contracts) to more complex ones (FFS, activity-based funding):
1. The development of robust risk-adjustment measures, generally based on an already established version of the DRG classification; but the larger the jurisdiction, the more likely an internationally imported version will be adapted to reflect local clinical practice.
2. The implementation of information systems – notably coding systems and grouping software. This is required to ensure that hospital managers have the appropriate information to identify where there is scope for performance improvements.
3. The development of administrative skills in the payer to design and manage the new system. This is a nontrivial task as poorly designed payment systems may not be seen as legitimate and are unlikely to gain acceptance; or may fail to anticipate the full range of perverse provider responses, including gaming. Poor ongoing management of a new funding system may not incorporate appropriate monitoring and interventions to sanction poor performance and again undermine confidence in the system, or may not incorporate adaptation for new technology.
4. The development of management skills in hospitals. A change of budget processes will also require a different set of skills – perhaps from managing negotiations with the payer to managing efficiencies within the organization more tightly.
The scarcer that administrative and management skills are, and the more challenging the development of risk-adjustment measures and information systems is, the more likely it is that the funding model or mix of models will gravitate towards simpler forms (Baxter et al., Reference Baxter2015).
Ensuring quality: P4P
Increasingly, hospital payment models incorporate elements of P4P, either to address additional adjunct goals – most commonly quality or timeliness of care – or to mitigate design risks inherent in the payment system (Duckett, Reference Duckett2008). P4P comes in many different forms with different objectives, including paying for additional information provision, paying for adherence to standards, or paying for meeting a particular quality threshold or quality improvement (Milstein & Schreyoegg, Reference Milstein and Schreyoegg2016). A P4P approach has been proposed as a way of paying for better outcomes (Siciliani et al., Reference Siciliani2021).
P4P: what it is
Health care funding contracts are often “incomplete” in the sense that they are not able to specify fully what is to be provided, especially in terms of quality, and this carries an inherent risk that providers might skimp on quality to reduce costs. In addition to evidence-based governance strategies to encourage quality improvement (Donabedian, Reference Donabedian2002; Langley et al., Reference Langley2009; Tello, Barbazza & Waddell, Reference Tello and Waddell2020), payers mitigate this risk by incorporating into payment design additional payments against additional metrics. Importantly, P4P is described here as a supplement: the basic stream of revenue needs to be adequate for all hospitals and the P4P supplement is an add-on, to reward superior performance on the relevant dimension (Cattel, Eijkenaar & Schut, Reference Cattel, Eijkenaar and Schut2020; Cattel & Eijkenaar, Reference Cattel and Eijkenaar2020). There is now an extensive literature about P4P, and an array of potential P4P designs (Cromwell et al., Reference Cromwell2011; Conrad, Reference Conrad2015), with the net impact of a specific implementation the result of the interplay of several factors including gaming, target and reward setting, and health increasing and health decreasing substitutions (Friedman & Scheffler, Reference Friedman, Scheffler and Scheffler2016). Perverse responses – including gaming (Carter, Newhouse & Relles, Reference Carter, Newhouse and Relles1990; Rosenberg, Fryback & Katz, Reference Rosenberg, Fryback and Katz2000; Bevan & Hood, Reference Bevan and Hood2006; Steinbusch et al., Reference Steinbusch2007; Mannion & Braithwaite, Reference Mannion and Braithwaite2012; Georgescu & Hartmann, Reference Georgescu and Hartmann2013) – can be mitigated with regulatory strategies including monitoring, and penalties.
Difficulties with P4P
Although intuitively and theoretically sound, in practice P4P implementations – especially those which focus on changing a single provider type (hospital or primary care) or specialty – have generally not lived up to the expectations and rhetoric (Mendelson et al., Reference Mendelson2017; Scott, Liu & Yong, Reference Scott, Liu and Yong2018; Cattel, Eijkenaar & Schut, Reference Cattel, Eijkenaar and Schut2020; Cattel & Eijkenaar, Reference Cattel and Eijkenaar2020; Singh et al., Reference Singh2021). Song’s summary of the state of evidence about “accountable care” in the USA can equally apply to P4P:
Today, a verdict on payment reform resembles less the fork in the road between success or failure and more a work-in-progress that has improved the value of care in some situations but needs refinement
Unfortunately, P4P, especially when poorly designed, may crowd out intrinsic professional motivation and can create perverse incentives as evidenced in both the mid-Staffordshire scandal in England (Francis, Reference Francis2013; Powell, Reference Powell2019; Smith & Chambers, Reference Smith and Chambers2019; Entwistle & Doering, Reference Entwistle and Doering2024) and the Bundaberg Hospital scandal in Queensland, Australia (van der Weyden, Reference van der Weyden2005; Thomas, Reference Thomas2007; Casali & Day, Reference Casali and Day2010; Edwards, Lawrence & Ashkanasy, Reference Edwards, Lawrence, Ashkanasy, Ashkanasy, Härtel and Zerbe2016), where organizational targets and incentives for budget control or additional activity created environments where safety concerns were ignored. However, well-designed performance monitoring and P4P incentives can help to ensure that organizations pay appropriate attention to their processes and outcomes (Conrad & Perry, Reference Conrad and Perry2009; Conrad, Reference Conrad2015; Young & Conrad, Reference Young and Conrad2007; Smith et al., Reference Smith2009), particularly as they impact on the most vulnerable.
The evidence suggests, therefore, that careful consideration has to be given to how to incorporate P4P arrangements within the hospital payment model. The cost of including a P4P component may be modest, especially where the cost of the ostensible reward is transferred from other streams of the hospital revenue. In these circumstances, P4P simply leads to a slightly different distribution of a capped budget. P4P incentives serve a political and rhetorical purpose signalling that the payer values the metric rewarded and directing hospitals – who could be expected to respond to incentives at the margin – to pay attention to this metric too.
Evidence in practice: paying hospitals in the English NHS
In this section we consider how the discussion thus far has played out in practice, by considering how payments to hospitals in the English NHS have changed since 2002.
The NHS is taxpayer funded and universal. Fig. 3.2.1 below gives a simple schematic of how NHS care is paid for in England since 2021. The accountable government department (currently the Department of Health and Social Care) allocates funding agreed by Parliament to a government agency, NHS England. NHS England distributes funding to several hundred local buyers of health care, known as commissioners. In addition, NHS England distributes funding to primary care and buys specialized health care itself. Commissioners pay for health care from acute care providers (hospitals) as well as providers of NHS mental health services, community services and ambulance services. The NHS payment system in this schematic is represented by the shaded box. To give an idea of scale, in 2019/20 NHS England allocated nearly £79 billion to commissioners, £18 billion to specialized services and £8 billion to primary care (Bell, Charlesworth & Lewis, Reference Bell, Charlesworth and Lewis2021).
Schema of payment flows in England

Figure 3.2.1 Long description
The first step is Department of Health and Social Care, from where the flow moves to N H S England. From the N H S, the flow can move to Primary Care, which is received by Patients. The flow can also move to Commissioners, from where it can go to Acute, Mental Health, Community, or Ambulance, all of which are then received by Patients. Additionally, from the N H S, the flow can also move to Specialized commissioning, from where it flows to Acute.
There have been four major changes since 2002 in how hospitals are paid: the move from block contracts to activity-based funding for hospitals; changes in the number of payers; increasing complexity in activity-based funding for hospitals; and replacing competition between hospitals with collaboration as the main driver of improvement. Each is discussed below.
From block contracts to activity-based funding
Until 2002, acute-care services and mental health, community and ambulance services were paid for with block contracts. From 2003, activity-based funding began to be phased in to gradually replace block contracts for acute hospital care. It began on a small scale, with just 15 prices for elective surgery (and just 0.2% of commissioners’ budgets) during a time of increases in NHS funding. It did so to address growing waiting lists and a so-called postcode lottery in access to care (Martin et al., Reference Martin2003). Activity-based funding expanded steadily until by 2012 it had grown to 3000 prices for 1400 DRGs, covering 34% of payers’ budgets. It grew further from 2013 following an expansion in the scope for payment to follow patients’ choices; to 9000 prices for 2800 DRGs and 40% of commissioners’ budgets. It included P4P elements linked to quality.
As it expanded, activity-based funding for acute care promoted productivity in hospitals (Farrar et al., Reference Farrar2009). Its P4P schemes improved quality (Meacock, Kristensen & Sutton, Reference Meacock, Kristensen and Sutton2014). It also helped amass rigorous data on activity, costs and outcomes. Set against this, it rewarded unilateral interest and not collaboration (Cooper et al., Reference Cooper2011; Bevan & Skellern, Reference Bevan and Skellern2011). It hampered management of expenditure and of unwarranted variation in activity (Mannion & Street, Reference Mannion and Street2009) and it was burdensome to administer (Marini & Street, Reference Street2007). In addition, the mix of activity-based funding for hospitals with block contracts for community, mental health and ambulance services frustrated better integration of health care (Bevan & Janus, Reference Bevan and Janus2011).
Changes in the number of payers
Until 2005 each hospital entered into contracts with around two dozen payers, then termed district health authorities. Tax funding was allocated to authorities according to estimates of the health needs for the population of each district. From 2006 the landscape for payers changed from district health authorities to over 300 local, primary care-led clinical commissioning groups. Hospitals then entered into thousands of contracts with these payers. As these contracts moved from block contract to activity-based funding, the system’s demands on management skills and information systems increased.
At its peak in 2015, 88% by value of contracts between hospitals and payers used activity-based funding. By 2018 that had reduced to 58%. There were two drivers for this reduction: administrative burden and budget. In a typical year in this period, hospitals issued some 600 000 monthly invoices to payers. Almost 200 000 of these were for less than £1000 as hospitals and payers argued about month-end bills. A shared desire by some local hospitals and payers to reduce this administrative effort saw many move reimbursement away from activity-based funding.
A sustained period of austerity in United Kingdom government spending followed the 2008 global financial crisis (Ford, Reference Ford2013). This reduced the rate of annual funding growth to the NHS to less than half its long-run average (Walshe & Smith, Reference Walshe and Smith2015; Charlesworth & Bloor, Reference Charlesworth and Bloor2018). By 2015 this manifested itself in a lack of hospital capacity and in large and growing hospital deficits, as prices for DRGs were scaled down by more than 10% below average unit costs. As a consequence, the incentives for head-to-head competition between hospitals declined, as did the desire of payers and hospitals to contract using activity-based funding.
Increasing complexity in activity-based funding
Initially, as activity-based funding was expanded to support patient choice and head-to-head competition between hospitals, it became more complex (Marshall, Charlesworth & Hurst, Reference Marshall, Charlesworth and Hurst2014). As well as the number of DRGs attracting activity-based prices expanding greatly, four types of financial incentives for quality were added to the payment system. The first enabled hospitals to reclaim funding held back by payers (of a few percentage points of their budgets) when they achieved improvements in process quality (e.g. ensuring hospital staff had winter flu vaccinations) and patterns of care, especially preventive care (e.g. screening infants for malnutrition). The second rewarded outcome quality, with hospitals paid a higher price for “best practice” (meaning high-quality and cost-effective) care, with the goal of reducing unexplained variation in hospitals’ clinical quality in areas such as adult stroke care and children’s diabetes care. The third enabled payers to claw back activity-based funding (of a few percentage points of their budgets) if hospitals did not meet standards for quality on metrics such as hospital-acquired infections, waiting times for elective care or emergency admissions for non-elective care. And the fourth gave hospitals top-up payments, either for extra cost incurred (e.g. on long staying or very complex patients) or for exceeding activity thresholds in certain areas (e.g. faster emergency care, more elective care). Later versions of these top-up payments included risk-sharing mechanisms, to help ensure spending did not exceed payers’ funding allocations.
Even where head-to-head competition between hospitals was not possible (or became less desirable), activity-based funding was used to underpin comparative competition. This is because prices were based on reported costs. Each year hospitals submitted to NHS England data on the cost of each unit of activity for each DRG. Subject to adjustments, the average unit cost for each DRG was the activity-based price for that DRG (Street & Maynard, Reference Street2007). A hospital whose cost lay below the activity-based price it received earned a surplus on each unit of that activity; one whose cost lay above was incentivized to reduce its unit costs.
Replacing competition with collaboration as the main driver of improvement
To incentivize increased activity, activity-based funding introduced unit prices for individual DRGs. As activity-based funding expanded to support patient choice, prices continued to be unitary to ensure the right type of head-to-head competition between hospitals. Because in reality English hospitals faced little competition, they had influence over the prices they faced. Competition between hospitals then had two countervailing effects on quality. On the one hand, it encouraged hospitals to improve quality for a given price in order to attract patients and funding. On the other hand, higher quality may be costly to provide and is hard for patients and payers to judge. So by reducing profitability, competition discouraged hospitals from spending on (hard-to-judge) quality, in order to keep costs and (easy-to-judge) prices down. The overall impact of competition on quality is the net of these two effects. To ensure patient choice drove quality up rather than prices down, activity-based funding prevented price competition by fixing unit prices above average unit costs.
As the impact of government austerity on NHS funding was felt, hospitals lacked capacity and financial deficits grew. With little incentive for hospitals to compete, there was little head-to-head competition between them. Collaboration and not competition became the principal driver of improvement in hospital performance (Allen et al., Reference Allen2017; Alderwick & Ham, Reference Alderwick and Ham2016). The 2019 NHS Long Term Plan cemented this, foreshadowing multilateral, integrated local care systems to replace bilateral commissioner-provider relationships, the better to promote integrated care (NHS England, 2019). To support this multilateralism, the Long Term Plan ushered in population-based funding and a return to block contracts to replace activity-based funding.
Policy relevance and conclusions
In this chapter we have set out a stylized description of the relationship between those who pay and those who provide hospital care. This recognizes that both parties have an interest in the quantity and quality of care provided, and the costs incurred in providing it, but are likely to attach different weights to these interests. Payers use payment arrangements to align the hospitals’ interests with their own, and we described four archetypal methods: line-item budgeting, FFS, block contracts and activity-based funding. We then set out the reasons why one of these methods may be adopted rather than another, and considered issues involved in transitioning from one to another and how each might evolve to capture more complex elements in the payment model, notably quality.
We draw three conclusions from this assessment. First, there is no “best” payment model. Rather, the choice is service and context specific, depending on the number of payers and providers in the health system, the objectives that they wish to achieve, and the relative weights attached to these objectives.
Second, the payment model is not a static set of immutable rules. Rather, the details of how the model operates are regularly updated, with payers and hospitals agreeing specific arrangements, usually for the year ahead. This evolution will be driven by various factors, particularly during the transition phase from one payment model to another. Payment adaptations will also be required to reflect new technologies and innovations in the ways that care is delivered, particularly if it becomes possible to provide care in alternative settings. But a key driver of this evolution is changes in the relative weights that payers attach to their objectives. Even small changes in emphasis can have a large impact on payment design, to the extent that previous preference for one method might shift to another, as evidenced by the English case study. A change of government might also lead to tectonic shifts in weights.
The third conclusion is that, even though we have described these payment methods in stylized, simplified forms, in practice paying hospitals is a complex process and difficult to get right. This is not surprising because providing hospital care is complicated, tailored to the specific needs and characteristics of each patient. A simple payment method will be easy to implement and monitor but comes at the risk that patients will not receive the right care, at the right time, in the right setting. More complex payment models aim to protect against this risk, but at the cost of extra effort that needs to be exerted by payers and hospitals in understanding and abiding by the contractual arrangements.Footnote 1
Key messages
Chapter 3.3 examines informal payments. Informal payments are unsanctioned, unregulated payments made out-of-pocket (OOP) by patients directly to their health care provider for services that are covered by third-party purchasers. They are not recorded in routine administrative databases but can be captured in surveys, although they are usually underreported. Key learning includes that:
Informal payments reduce access to health care and financial protection. They can undermine population health and reduce trust in providers and governments in the long run.
Informal payments often stem from unmet desire for safe, timely or high-quality care and imply a mismatch between supply, demand and pricing in the formal health care payment system. When formal system payments are felt to be inadequate, informal payments may also be used to express gratitude to providers.
Settings with low physician density, and/or where the share of gross domestic product (GDP) spent on health care is low, tend to have higher levels of informal payments.
Informal payments are also associated with settings with high reliance on formal OOP payments (user charges).
Reducing or ending informal payments is difficult and requires a combination of specific, targeted measures and broad health systems reforms that address underlying causes.
The policy measures that may reduce informal payments include:
Introduction
Payments made directly by patients or users of the health system to their health care provider are known as OOP payments and comprise three types. Two are formal: (i) direct payments for services or goods that fall outside the remit of the official third-party payer such as government-funded health coverage programmes, private health insurance, or social health insurance (SHI); and (ii) cost-sharing, which refers to the contractual requirement by these third-party payers for individuals to pay a portion of the cost of goods and services that the third parties cover (Rechel, Maresso & van Ginneken, Reference Rechel, Maresso and van Ginneken2019). The third type of OOP payment is informal and outside the system – and it is these payments that form the focus of this chapter.
There is a lack of clarity about both the overall incidence of informal payments worldwide and the reasons for them. Informal payments are often not recorded in any accounting systems and may be illegal, depending on the type of exchange. These features make it difficult to measure their prevalence and frequency within a country, let alone make comparisons between countries. Also, informal payments can vary widely across key dimensions, such as: who initiates the payment (patient, provider); who pays (patients, families); who are the recipients (often physicians, but also other health care providers or administrative staff, or even hospitals or other health care organizations); what form they take (cash, in-kind medical supplies or equipment, or in-kind, unrelated to health care); and when they are made (before, during and/or after accessing health care) (Gaal et al., 2006). Additionally, whereas cost-sharing may be introduced into a health system to either raise revenue or to reduce/redirect health system utilization, the motivations or purposes of informal payments vary within and between countries. On the one hand, informal payments may be a form of gift-giving or expression of gratitude that is unrelated to the receipt of care or its quality. On the other hand, informal payments are commonly used to facilitate access or to secure higher quality health care.
The chapter presents our exploration of the phenomenon of informal payments as follows. We look briefly at how they are defined in the literature, the descriptions given of their motivation, and the detrimental effects they have on health system performance. We then discuss both the theoretical drivers of informal payments and empirical evidence that helps explain why they emerge. The next section then provides estimates of the global prevalence of informal payments before we zoom in on the Greek health system in a case study outlining their use there. The chapter concludes with suggestions of mechanisms to reduce/end informal payments and thus improve health system performance.
Informal payments in the literature: definitions and motivation
Three definitions of informal payments
A comprehensive review of the literature in 2013 identified 61 studies that defined informal payments in health care, and suggested that there were three distinct and original definitions (Cherecheş et al., Reference Cherecheş2013). The first was proposed by Lewis (Reference Lewis1999) who defined informal payments as:
payments to individual and institutional providers in-kind or cash that are outside the official payment channels, or are purchases that are meant to be covered by the health care system.
The second definition was introduced by Belli, Gotsadze and Shahriari (Reference Belli, Gotsadze and Shahriari2004) who explicitly positioned informal payments within the broader category of OOP payments. Specifically, they noted that informal payments are:
all payments that patients report to pay directly to their health care individual or institutional provider above the legally set co-payments for basic benefits package (BBP) services and above (or below) the regulated fee-for-service (FFS) fees for non-BBP services, plus all in-kind contributions and gifts. Thus, we consider informal payments as a subset of the OPPs (OOP payments). According to this definition, it is not really important whether or not transactions between patients and providers are registered for tax purposes, but whether such payments are or aren’t different from the legally set co-payments or regulated fees. We assume that all transactions where the patient reports he/she was not given any information about official co-payment rates or fees are to be considered as informal.
Finally, a now widely used definition of informal payments was developed by Gaal and colleagues (Reference Gaal2006) which captures the full spectrum of informal payments globally and underscores the importance of entitlements as the defining feature of informal payments that distinguishes them from other payments in the health sector. Thus, according to this definition, an informal payment is:
a direct contribution, which is made in addition to any contribution determined by the terms of entitlement, in cash or in-kind, by patients or others acting on their behalf, to health care providers for services that the patients are entitled to.
Therefore, in order to define and measure informal payments in the health sector, we need to understand the services that individuals are entitled to within the publicly funded, statutory health programmes.
Motivation: donation, FFS, tax avoidance
The question of motivation for the payment is an important consideration because, at one end of the spectrum, gift-giving that is common cultural practice may be a nuisance for some but may not in fact represent a policy problem in a jurisdiction. However, at the other end of the spectrum, an informal payment that is motivated by pressure on patients may have adverse impacts on intermediate and final health system objectives including efficiency, quality, equity in access, equity in finance, financial protection and health outcomes (see Box 3.3.1). Gaal and colleagues (Reference Gaal2006) delineate the two dominant motivations of informal payments as donation and FFS. The former is a “benign informal payment”, often called a “gratitude payment” because it is given voluntarily, is considered a form of appreciation, and is not given with the intention of directly impacting the services being provided. The latter is an “under-the-table” payment motivated by either an individual’s desire to receive safe, timely or good quality care, or to ensure or facilitate access to care, thereby potentially impacting health outcomes. Due to the lack of transparency, an under-the-table payment also limits the health system’s ability to protect individuals financially (e.g. by means of exemption mechanisms) and to ensure funds are reinvested into health systems in a way that is aligned with health system goals (Gaal et al., Reference Gaal2006).
1. Informal payments distort the allocation of resources for health care. In the presence of informal payments, resource allocation decisions do not incorporate elements related to clinical value and patient benefit, efficiency and cost–effectiveness. Instead, such decisions are largely based on market forces rather than evidence-based planning and public policy goals (Lewis, Reference Lewis and Mossialos2002). Resource allocation is thus driven by patients’ willingness to pay and providers’ coercion factors, with payments being independent of the value of care they provide or medical needs; the government has no role in setting these payments or prioritizing decisions and expenditure.
2. Informal payments impose substantial barriers to accessing health care and therefore undermine equity in access. Low-income patients might delay or forgo treatment or seek less specialized care due to limited affordability (Belli, Gotsadze & Shahriari, Reference Belli, Gotsadze and Shahriari2004; Habibov & Cheung, Reference Habibov and Cheung2017). This also has significant implications for patient outcomes and population health.
3. Informal payments undermine equity in financial protection. Given that informal payments are regressive, individuals often need to cut down expenses for other goods or services to finance their health care or even face the risk of financial catastrophe and poverty.
4. Informal payments tend to worsen quality of care, with patients often following suboptimal models of care due to lack of affordability or doctors recommending clinical processes driven by income generation rather than maximization of therapeutic value (Mæstad & Mwisongo, Reference Mæstad and Mwisongo2011; Vian et al., Reference Vian2006).
5. Informal payments lead to lower patient satisfaction with health services and undermine transparency, accountability, and trust in the health system and health workers (Kabia et al., Reference Kabia2021; Stepurko, Pavlova & Groot, Reference Stepurko, Pavlova and Groot2016).
Beyond these two major categories of motivation for informal payments – donation and FFS – there is a third which falls in between: a form of patient–doctor collusion with the primary aim of tax avoidance. All three of these exchanges have negative impacts on the health system, notwithstanding the benign intentions of straightforward gift-giving. For example, all can lead to reduced levels of trust in the doctor–patient relationship which may in turn lead to underutilization of health services. If patients anticipate additional fees for care that they are entitled to, they might be disincentivized to seek physician services. Also, there may be spillover effects on other parts of the health system (Currie, Lin & Meng, Reference Currie, Lin and Meng2013), such as incentivizing physicians to provide more care, including potentially unnecessary care, to patients who pay informally.
There is limited, and often contradictory, evidence to support one motivation or the other (Gaal et al., Reference Gaal2006). A systematic review of 31 studies (globally) found the same number of studies that reported the purpose of an informal payment as an expression of gratitude (10 studies) as those that reported the purpose as consistent with the FFS or fee-for-commodity hypothesis (10 studies) (Stepurko et al., Reference Stepurko2010). Others reported that the reasons for informal payments were to gain: better quality of care (10 studies); access to care (four studies); faster access (six studies); and psychological comfort (four studies). That same review found that nine studies reported the patients as initiating the payment (as an expression of thanks) and a further nine studies found the providers initiated it (as a required payment for service). Empirical literature on the motivation behind informal payments is sparse, and we look first at the theoretical drivers of informal payments.
Theoretical drivers of informal payments
The presence of rigidity in prices generates a mismatch between supply and demand for health care and can result in a lack of market equilibrium. Such an argument would suggest a need to increase the payments to providers (e.g. salaries, or formal OOP payments). Apart from the classical economic argument, health policy literature provides additional insights towards a better understanding of the drivers of informal payments, considering the motivation at individual level (cognitive behaviour theory), as well as from the broader institutional perspective (institutional theory).
Cognitive behaviour theory
Gaal and McKee (Reference Gaal and McKee2004) developed a theoretical framework drawing on cognitive behaviour theory to explains the causes of informal payments. They posit that informal payments are a “reaction by dissatisfied patients and physicians to shortage – a manifestation of deteriorating organization/system performance”. They extend Hirschman’s (Reference Hirschman1970) theory of “exit, voice and loyalty” as reactions to failures in organizations or states, by adding a new option/reaction which they call “inxit” (or a “informal/internal exit”) whereby dissatisfied patients and providers do not leave the system (exit), nor express their disappointment by complaining to bring about change in the system (voice), but rather they “seek to change its activities, not through open complaints, but using informal methods, such as payment or connections”.
The Gaal and McKee (Reference Gaal and McKee2004) cognitive behavioural model helps to explain why informal payments may arise under economic conditions of shortage. Specifically, when there is no option to leave the system (exit), as in Semashko systems with no private options, and there are no mechanisms for complaints to be heard (voice), then “inxit” as manifested by informal payments is the only possible reaction by patients to deteriorating health system performance. Thus, the policy solutions to address informal payments must simultaneously address the problem of shortage (e.g. by increasing investment in the system and health worker salaries) and expanding the formal options available to patients and providers to express their concerns with poor quality care; for example, through performance measurement and (enhanced) complaints procedures, or possibly with additional options to exit the public system (though this may exacerbate inequities).
Institutional theory
Additional explanations of the drivers of informal payments draw on institutional theory, considering both formal institutional shortcomings as well as informal institutions such as unwritten conventions and practices. Some of these institutional shortcomings include corruption in political systems and public programmes, lack of trust in government, and lack of government oversight over public programmes (Allin, Davaki & Mossialos, Reference Allin, Davaki and Mossialos2006; Pourtaleb et al., Reference Pourtaleb2020). Moreover, informal payments are expected to arise when “norms, practices and values of the informal institutions are not in symmetry with the formal rules of the game (i.e. laws and regulations)” (Williams & Horodnic, Reference Horodnic and Polese2017).
Recently, Binyaruka and colleagues (Reference Binyaruka2021) developed a supply-side theoretical framework which conceptualizes informal payments by placing the notion of concentrated power (which is similar to the issues arising from information asymmetry that affords more power to physicians than to both payers and patients) as a means to extract rent from various institutions and relationships. In Binyaruka et al.’s (Reference Binyaruka2021) model, individuals who have more power are more likely to obtain informal payments. Moreover, these individuals are more likely to bypass any transparency and anticorruption mechanisms because they have the power to game the system without consequences (Binyaruka et al., Reference Binyaruka2021). Thus, informal payments can arise in contexts where there is inadequate oversight in place to prevent abuse, suggesting a need for anticorruption measures and supervision along with awareness campaigns to address information asymmetry. The level of informal payments in a jurisdiction will relate to the health system and broader institutional context, including the extent of resource shortages and trust in government to address aspects of deteriorating health system performance, as well as the level of power held by medical professionals and health organizations.
Empirical evidence on the drivers of informal payments
A wide range of factors emerge in the empirical literature to help to explain the emergence and persistence of informal payments. Drawing in part on the theories above, these factors can be grouped into four broad categories: (i) economic; (ii) sociocultural; (iii) those related to governance and institutions; and (iv) those related to the health system. Existing evidence mainly reveals associations, and the findings should not be therefore interpreted as causal relationships.
Economic factors
Economic factors broadly concern shortages, or a scarcity of resources in the publicly financed health system. Shortages – or a mismatch between the health care needs and expectations of the population and the supply and accessibility of care – are seen to be a necessary but not sufficient condition for informal payments to arise (Gaal & McKee, Reference Gaal and McKee2004). Data from Transparency International’s Global Corruption Barometer (Fig. 3.3.1) show that informal payments are present mostly in LMICs and that there is a correlation between health spending as a share of national income and prevalence of informal payments. (This correlation is also depicted in Fig. 3.3.4.)
Several studies have demonstrated the link between economic conditions and informal payments. For example, Tambor and colleagues (Reference Tambor2013) grouped 35 European countries into three categories drawing on a Health Consumer Powerhouse survey: no informal payments reported; some incidence of informal payments reported; and widespread informal payments reported. They found that countries with widespread informal payments had significantly lower public health expenditure as a share of total health spending.Footnote 1 Also, a cross-sectional analysis of Eurobarometer data from 28 European countries found a higher likelihood of patients reporting having made an informal payment in health care for countries with lower levels of health expenditure, either as a percentage of GDP or per capita (Williams & Horodnic, Reference Williams and Horodnic2018).
Sociocultural factors
Sociocultural reasons generally refer to a nationally embedded culture of tipping or custom of expressing gratitude through payments or gifts. Though there is probably a role played by cultural norms in explaining the origin and persistence of informal payments in many countries, and this appears as a theme in recent systematic reviews (Pourtaleb et al., Reference Pourtaleb2020), such explanations are insufficient to explain the majority of informal payments. For instance, the inability to identify a clear beginning and end to many clinical encounters, such as with chronic diseases management and primary care, make it difficult to separate gifts as an expression of gratitude from gifts/payments with a different motivation (e.g. to gain higher quality care/better access) (Gaal, Jakab & Shishkin, Reference Gaal, Jakab, Shishkin, Kutzin, Cashin and Jakab2010). Also, the fact that informal payments often take the form of in-kind contributions to the health care intervention itself, such as medical supplies or medicines, suggests that informal payments may not be a simple expression of gratitude in these contexts.
Factors related to governance and institutions
Institutional asymmetry
Williams and Horodnic (Reference Williams and Horodnic2018) tested the theory of “institutional asymmetry” as a driver of informal payments with a multi-level regression analysis of Eurobarometer data from 35 countries. They developed an index of institutional asymmetry based on answers to survey questions about the acceptability of three behaviours: to give money, to give a gift or to do a favour in order to get something from a public administration or public service. The index aims to capture the extent to which individuals believe that they should follow the legal and regulatory rules in society, though arguably it also reflects the country’s social norms and cultures, and therefore overlaps with the sociocultural explanation. The regression models revealed a strong association between higher levels of institutional asymmetry and the likelihood of making an informal payment in health care, even after adjusting statistically for individual level characteristics (e.g. demographics, rurality, socioeconomic status) and country-level economic and health system factors. The authors suggest that this finding supports their institutional theory-based explanation of informal payments. They further tested this theory during the COVID-19 pandemic and found significant associations between the prevalence of informal payments and both public acceptance of corruption and perceptions of the transparency of governments in their responses to the pandemic (Horodnic et al., Reference Horodnic2021). Also, a study in China found that informal payments were associated with lower levels of trust as well as poor communication with physicians (Li, Li & Yip, Reference Li and Yip2022).
Quality of governance
Some empirical support for the link between quality of governance and the incidence of informal payments can also be found in multi-country studies. For example, Tambor and colleagues (Reference Tambor2013) found that countries where informal payments are widespread also had the lowest perceived level of government effectiveness (average of 0.3 on a scale of −2.5 weak to 2.5 strong compared to 1.2 in countries with some informal payments, and 1.6 in countries with no informal payments). Also, Williams and Horodnic (Reference Williams and Horodnic2018) used the European Quality of Government Index (which combines perceptions with experiences of public sector services) and found strong evidence that informal payments are higher among countries with a lower quality of government (in their study of 27 European countries).
Role and size of the private sector
A further strand of the literature discusses how the role and size of the private sector relates to the incidence and intensity of informal health payments. In some settings, physicians have the option to exit the public system and provide care in the private sector either on a full- or part-time basis, thus allowing them to potentially earn higher income. The private sector also allows patients who are able to pay to opt out of the publicly financed system. The empirical support for a link between informal payments and the size of the private sector is mixed. Most studies rely on crude measures of the size and role of the private sector such as OOP payments as a share of total health expenditures. For example, Incaltarau and colleagues (Reference Incaltarau2021) used several years of pooled survey data across 117 countries and found higher shares of private finance (OOP and domestic private health expenditure) were correlated with a lower prevalence of informal payments. Also, Liu, Bau and He (Reference Liu, Bao and He2020) analysed panel data using the China Health and Retirement Longitudinal Survey and found that an increase in private health insurance coverage in China was associated with a reduction in informal payments. However, studies have also reported a positive association between the level of OOP payments and informal payments; for example, in some eastern European countries (Tambor et al., Reference Tambor2013) (Fig. 3.3.2). Further evidence is needed to uncover the actual impact of private sector development (in terms of financing and delivery of care) on the incidence and intensity of informal health payments.
Health system-specific factors
There are also numerous other health system reasons that help explain informal payments. Some of these relate to the broader economic context but are specific to health care; for example, low expenditures on health care, shortages of both human resources and medical supplies, low salaries for workers (Allin, Davaki & Mossialos, Reference Allin, Davaki and Mossialos2006; Gaal, Jakab & Shishkin, Reference Gaal, Jakab, Shishkin, Kutzin, Cashin and Jakab2010). Other health system factors relate to system governance and stewardship; for example: the lack of transparency and accountability in the health system; and inadequate public information and awareness about the benefits packages and what individuals’ entitlements and rights are in the publicly funded health systems (Pourtaleb et al., Reference Pourtaleb2020). Inefficiency in resource allocation and care delivery also appear as common explanations in the literature on informal payments, including the maldistribution of health workers and an overemphasis on curative over preventive care (Pourtaleb et al., Reference Pourtaleb2020; Williams & Horodnic, Reference Horodnic and Polese2017). Shortcomings in access to and quality of care are also frequently cited contributors to informal payments (Pourtaleb et al., Reference Pourtaleb2020). In some contexts, informal payments are a reaction to the problem of shortages and insufficient supply of health care, seeking to augment providers’ incomes, which may allow care to be provided, in particular in periods of economic difficulty.
How pervasive are informal payments?
The measurement of how pervasive informal health payments are is more challenging than with other mechanisms of health financing. Given the lack of data and records for pricing, utilization rates and transactions, estimates on the prevalence of informal payments are generally derived from surveys of patients or the public, which often use different sampling techniques and survey methods (Lewis, Reference Lewis2000).
View from the literature
A systematic review of 38 studies (globally) reported the variation in prevalence of informal payments (the percentage of patient encounters that had any type of informal payment) ranged from 2% to 80%, with higher prevalence in the inpatient sector than the outpatient (Khodamoradi et al., Reference Khodamoradi2018). Another systematic review of 33 studies (globally) also found informal payments were more common in inpatient services, surgery/delivery services (Amiri et al., Reference Amiri2019). A scoping review of the Western Balkans included 24 studies and found the highest prevalence of informal payments in the region was in Albania (19–91%), compared to 7–70% in KosovoFootnote 2, 7–23% in Serbia, and 5–22% in Bosnia and Herzegovina (Buch Mejsner & Eklund Karlsson, Reference Buch Mejsner and Eklund Karlsson2017). Another systematic review and meta-analysis of 15 studies in Iran estimated that the prevalence of informal payments was approximately 35%, with the main reasons provided as appreciating the staff, and in response to requests made by hospital staff (Mirabedini et al., Reference Mirabedini2017).
Measuring informal payments using cross-sectional survey data
As there is (most often) a lack of recording of informal payments in any state accounting or information system, national and international surveys are the main source of data on informal payments. Nevertheless, due to the often illicit nature of the practice and subsequent underreporting, these surveys might also underestimate the true prevalence. Another challenge of measurement relates to the methods followed, as different studies may adopt different definitions and approaches that make international comparisons challenging and not easily interpretable (Cohen, Reference Cohen2012).
In response to this, we compiled a list of cross-sectional surveys that measure informal payments. The list in Table 3.3.1 describes how the question of experience concerning the practice has been approached by various organizations in different regional settings. Further, we draw on the Global Corruption Barometer by Transparency International in this section because it utilizes a uniform survey design to compare the prevalence of informal payments across regions. The surveys measure patients’ experience of paying physicians informally for care they are otherwise entitled to. This includes information on the public health sector in Latin America and the Caribbean, the Middle East and north Africa, Africa, Asia and the Pacific, and the EU. We used the most recent data available for each region, which meant that the time of collection varied across the global sample – EU (2021), Asia and the Pacific (2020), Latin America and the Caribbean (2019), Middle East and north Africa (2019), Africa (2019). Globally, 11% of patients made an informal payment in the 12 months prior to the survey. Fig. 3.3.1 illustrates the variation in prevalence of informal payments across regions.

Table 3.3.1a Long description
The table has 7 columns: Survey and round, Question on incidence rate, Type of service or service provider specified, Possible responses, Regions included in the sample, Countries covered, and Source. It reads as follows. Row 1: Special Eurobarometer (245, 291, 325, 374, 397). Question: Thinking about these contacts in the past 12 months, has anyone in (YOUR COUNTRY) asked you, or expected you, to pay a bribe for his or her services? Type of service: The health care sector. Possible responses: Binary response (Yes; No). Regions: European Union. Countries: Austria, Belgium, Bulgaria, Croatia, Cyprus, Czechia, Denmark, Estonia, Finland, France, Germany, Greece, Hungary, Ireland, Italy, Latvia, Lithuania, Luxembourg, Malta, Netherlands, Poland, Portugal, Romania, Slovakia, Slovenia, Spain, Sweden Source: European Commission (2005; 2007; 2009; 2011; 2014).
Row 2: Special Eurobarometer (397, 470, 502, 523, 534). Question: Apart from official fees did you have to give an extra payment or a valuable gift to a nurse or a doctor, or make a donation to the hospital? Type of service: Public health care practitioner such as a G P (general practitioner) or a public health care institution such as a public hospital in the past 12 months. Possible responses: Binary response (Yes; No). Regions: European Union. Countries: Austria, Belgium, Bulgaria, Croatia, Cyprus, Czechia, Denmark, Estonia, Finland, France, Germany, Greece, Hungary, Ireland, Italy, Latvia, Lithuania, Luxembourg, Malta, Netherlands, Poland, Portugal, Romania, Slovakia, Slovenia, Spain, Sweden. Source: European Commission (2014; 2017; 2020; 2022; 2023).

Table 3.3.1b Long description
The table has 7 columns: Survey and round, Question on incidence rate, Type of service or service provider specified, Possible responses, Regions included in the sample, Countries covered, and Source. It reads as follows. Row 3: Special Eurobarometer (470, 502, 523, 534). Question: Thinking about these contacts in the past 12 months has anyone in (YOUR COUNTRY) asked you or expected you to give a gift, favour or extra money for his or her services? Type of service: The health care sector. Possible responses: Binary response (Yes; No). Regions: European Union. Countries: Austria, Belgium, Bulgaria, Croatia, Cyprus, Czechia, Denmark, Estonia, Finland, France, Germany, Greece, Hungary, Ireland, Italy, Latvia, Lithuania, Luxembourg, Malta, Netherlands, Poland, Portugal, Romania, Slovakia, Slovenia, Spain, Sweden. Source: European Commission (2017; 2020; 2022; 2023).
Row 4: Afrobarometer (Rounds 5, 6, 7, 8). Question: And how often, if ever, did you have to pay a bribe, give a gift, or do a favour for a health worker or clinic or hospital staff in order to get the medical care you needed? Type of service: Public clinic or hospital. Possible responses: Categorical response (Never; Once or twice; A few times; Often). Regions: Africa. Countries: Algeria, Benin, Botswana, Burkina Faso, Burundi, Cameroon, Cape Verde, Côte d’Ivoire, Egypt, Ethiopia, Gabon, Ghana, Guinea, Kenya, Lesotho, Liberia, Madagascar, Malawi, Mali, Mauritius, Morocco, Mozambique, Namibia, Niger, Nigeria, Sao Tome and Principe, Senegal, Sierra Leone, South Africa, South Sudan, Sudan, Swaziland, Tanzania, Togo, Tunisia, Uganda, Zambia, Zimbabwe. Source: Afrobarometer (2015; 2016; 2019; 2022).

Table 3.3.1c Long description
The table has 7 columns: Survey and round, Question on incidence rate, Type of service or service provider specified, Possible responses, Regions included in the sample, Countries covered, and Source. It reads as follows. Row 5: L I T S (Round 1). Question: In your opinion, how often is it necessary for people like you to have to make unofficial payments or gifts in these situations? Type of service: Receive medical treatment in the public health system? Possible responses: 5-item Likert scale (Never; Always). Regions: Eastern Europe, central Asia. Countries: Albania, Armenia, Azerbaijan, Belarus, Bosnia and Herzegovina, Bulgaria, Croatia, Czechia, Estonia, Georgia, Hungary, Kazakhstan, Kyrgyzstan, Latvia, Lithuania, Moldova, Mongolia, Montenegro, North Macedonia, Poland, Romania, the Russian Federation, Serbia, Slovak Republic, Slovenia, Tajikistan, Türkiye, Turkmenistan, Ukraine, Uzbekistan. Source: E B R D (2006).
Row 6: L I T S (Round 2 and 3). Question: Did you or any member of your household make an unofficial payment or gift when using these services over the past 12 months? Type of service: Medical treatment in the public health system. Possible responses: Binary response (Yes; No). Regions: Eastern Europe, central Asia. Countries: Albania, Armenia, Azerbaijan, Belarus, Bosnia and Herzegovina, Bulgaria, Croatia, Cyprus, Czechia, Egypt, Estonia, Georgia, Greece, Hungary, Jordan, Kazakhstan, Kosovo3, Kyrgyzstan, Latvia, Lithuania, Moldova, Mongolia, Montenegro, Morocco, North Macedonia, Poland, Romania, the Russian Federation, Serbia, Slovakia, Slovenia, Tajikistan, Tunisia, Türkiye Turkmenistan, Ukraine, Uzbekistan. Source: E B R D (2011; 2016).

Table 3.3.1d Long description
The table has 7 columns: Survey and round, Question on incidence rate, Type of service or service provider specified, Possible responses, Regions included in the sample, Countries covered, and Source. It reads as follows. Row 7: L I T S (Round 3). Question: Have you encountered any [payments required for services that should be free] with your local public health clinic or hospital during the past 12 months? Type of service: Public health clinic or hospital. Possible responses: Binary response (Yes; No) Regions: Eastern Europe, central Asia, western Europe. Countries: Albania, Armenia, Azerbaijan, Belarus, Bosnia and Herzegovina, Bulgaria, Croatia, Cyprus, Czechia, Egypt, Estonia, Georgia, Germany, Greece, Hungary, Italy, Jordan, Kazakhstan, Kosovo4, Kyrgyzstan, Latvia, Lithuania, Moldova, Mongolia, Montenegro, Morocco, North Macedonia, Poland, Romania, the Russian Federation, Serbia, Slovakia, Slovenia, Tajikistan, Tunisia, Türkiye, Turkmenistan, Ukraine, Uzbekistan. Source: E B R D (2016).
Row 8: Global Corruption Barometer: Africa (2019). Question: In the past 12 months have you had contact with a public clinic or hospital? How often did you have to pay a bribe, give a gift, or do a favour for a health worker, clinic or hospital staff in order to get the medical care you needed? Type of service: Public clinic or hospital. Possible responses: Categorical response (Never; Once or twice; A few times; Often). Regions: Africa. Countries: Benin, Botswana, Burkina Faso, Cabo Verde, Cameroon, Côte d’Ivoire, Democratic Republic of the Congo, Eswatini, Gabon, Gambia, Ghana, Guinea, Kenya, Lesotho, Liberia, Madagascar, Malawi, Mali, Mauritius, Mozambique, Namibia, Niger, Nigeria, Sao Tome and Principe, Senegal, Sierra Leone, South Africa, Tanzania, Togo, Uganda, Zambia, Zimbabwe. Source: Transparency International (2019a).

Table 3.3.1e Long description
The table has 7 columns: Survey and round, Question on incidence rate, Type of service or service provider specified, Possible responses, Regions included in the sample, Countries covered, and Source. It reads as follows. Row 9: Global Corruption Barometer: Latin America (2019). Type of service: In the past 12 months have you had contact with a public clinic or hospital? How often did you have to pay a bribe, give a gift, or do a favour for a health worker or clinic or hospital staff in order to get the medical care you needed? Type of service: Public clinic or hospital. Possible responses: Categorical response (Never; Once or twice; A few times; Often). Regions: Latin America, Caribbean. Countries: Argentina, Bahamas, Barbados, Brazil, Chile, Colombia, Costa Rica, Dominican Republic, El Salvador, Guatemala, Guyana, Honduras, Jamaica, Mexico, Panama, Peru, Trinidad and Tobago, Venezuela. Source: Transparency International (2019b).
Row 10: Global Corruption Barometer: MENA (2019). Question: In the past 12 months have you had contact with a public clinic or hospital? How often did you have to pay a bribe, give a gift, or do a favour for a health worker or clinic or hospital staff in order to get the medical care you needed? Type of service: Public clinic or hospital. Possible responses: Categorical response (Never; Once or twice; A few times; Often). Regions: Middle East, north Africa. Countries: Jordan, Lebanon, Morocco, Palestine, Sudan, Tunisia. Source: Transparency International (2019c).
Row 11: Global Corruption Barometer: MENA (2019). Question: In the past 12 months have you used wasta in order to get the medical care you needed? Type of service: Public clinic or hospital. Possible responses: Categorical response (Never; Once or twice; A few times; Often). Regions: Middle East, north Africa. Countries: Jordan, Lebanon, Palestine. Source: Transparency International (2019c).

Table 3.3.1f Long description
The table has 7 columns: Survey and round, Question on incidence rate, Type of service or service provider specified, Possible responses, Regions included in the sample, Countries covered, and Source. It reads as follows. Row 12: Global Corruption Barometer: Asia (2020). Question: And how often, if ever, did you have to pay a bribe, give a gift, or do a favour for a health worker or clinic or hospital staff in order to get the medical care you needed? Type of service: Public clinic or hospital. Possible responses: Categorical response (Never; Once or twice; A few times; Often). Regions: Asia. Countries: Bangladesh, Cambodia, China, India, Indonesia, Japan, Malaysia, Maldives, Mongolia, Myanmar, Nepal, Philippines, Republic of Korea, Sri Lanka, Taiwan, Thailand, Vietnam. Source: Transparency International (2020).
Row 13: Global Corruption Barometer: European Union (2021). Question: And how often, if ever, did you have to pay a bribe, give a gift, or do a favour for a health worker or clinic or hospital staff in order to get the medical care you needed? Regions: European Union. Countries: Austria, Belgium, Bulgaria, Croatia, Cyprus, Czechia, Denmark, Estonia, France, Finland, Germany, Greece, Ireland, Italy, Latvia, Lithuania, Luxembourg, Malta, Netherlands, Poland, Portugal, Romania, Slovakia, Slovenia, Spain, Hungary, Sweden. Source: Transparency International (2021).
Note: The datasets listed in the table above are all publicly available and were screened to identify the relevant questions.
Prevalence of informal payments in selected countries, 2019–2021

There is significant variation between regions globally. In the EU 6.9% of patients paid informally, compared to 10.9% in Latin America and the Caribbean, 11.6% in the Asia–Pacific region, 14.2% in sub-Saharan Africa and 16.6% in the Middle East and north Africa.
Importantly, informal payments also vary within regions. Fig. 3.3.2 illustrates the share of patients in the EU who paid in 2019. While the EU scores the lowest on this indicator across the globe, in parts of eastern Europe over 22% of patients have had to pay informally when using the publicly financed health care system (Table 3.3.2).
Prevalence of informal payments in the EU, 2021

| Country | Prevalence (%) |
|---|---|
| Romania | 22 |
| Bulgaria | 21 |
| Lithuania | 19 |
| Europe average | 7 |
| Luxembourg, Netherlands, Finland, Denmark | 1 |
| Sweden | 0 |
A similar trend is observed in other geographical contexts. For example, Fig. 3.3.3 shows that in the Asia–Pacific region, the prevalence varies between 1% of patients in the Maldives to 26% in China (Table 3.3.3).
Prevalence of informal payments in the Asia–Pacific region, 2020

| Country | Prevalence (%) |
|---|---|
| China | 26 |
| India, Cambodia | 24 |
| Asia–Pacific average | 11 |
| Nepal | 3 |
| Japan | 2 |
| Maldives | 1 |
Cross-sectional survey data: associations between informal payments and levels of health finance, OOP payments and physician density
Below, we explore the association between the share of patients who have made an informal health payment and health financing levels, OOP payments and physician density. These reflect the financial sustainability and resourcefulness of the health care institutions and allow us to compare settings which have different types of health system organization. Public spending on health care affects scarcity of resources in the system, potentially leading to increased competition between patients for access to treatments. On the supply side, low expenditures are associated with low physician pay which could increase the demand for informal payments as a subsidy.
Fig. 3.3.4 visualizes a modest negative association between GDP spending on health and informal payments across the world. As countries spend a larger share of their GDP on health care, the prevalence of informal payments goes down. The relationships differ by region, with countries in the Latin America and Caribbean region and Europe displaying more statistically and economically negative associations when compared with other regions.
Share of GDP spent on health care versus percentage of patients who paid informally in the past 12 months, 2019–2021
Note: A simple linear regression between the share of GDP spent on health care and percentage of patients offering informal payments shows a negative relationship (y = −1.47x + 0.207) with an R-squared value of 0.12, suggesting minimal association between these two variables.

Figure 3.3.4 Long description
The y-axis represents Respondents who paid a bribe in percentage, from 0 to 50, while the x-axis represents Health spending as a percentage of G D P, from 2.5 percent to 10.0 percent. The plots are categorised into W H O regions: Africa, Americas, Eastern Mediterranean Europe, South East Asia, and Western Pacific. The best-fit line runs from about (2.0, 18) to (12, 3). The equation for the line is given as y equals 0.207 minus 1.47 times x, where R-squared equals 0.12.
Next, we consider the relationship between formal OOP payments and informal payments. Unfortunately, it is not possible to distinguish between the two types of formal OOP payments – direct payments for costs incurred outside of the publicly financed or other third-party insurance coverage programme, and cost-sharing, or user charges to cover part of the costs of care within the public or private insurance coverage programme. There may be theoretical arguments for a negative association, for example if private options allow health care providers to supplement their income in formal, legitimate ways, and allow patients to express their dissatisfaction with the publicly financed health system by opting out and paying privately. However, Fig. 3.3.5, which illustrates this relationship between the two payment types on a global level, shows an overall positive association between the two: higher levels of OOP payments are associated with a higher prevalence of informal payments.
OOP payments as share of total health spending versus percentage of patients who have paid informally in the past 12 months, 2019–2021
Note: A simple linear regression between household OOP spending and percentage of patients offering informal payments shows a positive relationship (y = 0.00263x + 0.0295) with an R-squared value of 0.21, suggesting modest positive association between these two variables.

Figure 3.3.5 Long description
The y-axis represents Respondents who paid a bribe in percentage, from 0 to 50, while the x-axis represents Household out-of-pocket spending as a percentage of current health spending, from 0 to 60. The plots are categorised into W H O regions: Africa, Americas, Eastern Mediterranean Europe, South East Asia, and Western Pacific. The best-fit line runs from about (4, 5) to (75, 22). The equation for the line is given as y equals 0.0295 plus 0.00263 times x, where R-squared equals 0.21.
Absolute health system constraints or resource shortages may also contribute to informal payments. A commonly used measure of the extent of resource shortages in a health system is the density of physicians per 1000 people. Our measure here includes both primary and specialized physicians. The fitted regression line in Fig. 3.3.6 illustrates the negative association between physician density and prevalence of informal payments. In accordance with theories of market supply and demand, patients in systems with better availability of physicians would on average be less likely to experience informal payments. Where physician density is high, shortages of doctor appointments/visits are less likely, and so informal payments are not needed to bridge the gap between the current market price and equilibrium price. Greece, which we discuss in more detail in our case study, is one of the outliers. Although physician density in the country is relatively high at around 5.5 doctors per 1000 people, the corresponding prevalence of informal payments is around 13%.
Physician density versus percentage of patients who have paid informally in the past 12 months, 2014–2021
Note: A simple linear regression between physician density care and percentage of patients offering informal payments shows a negative relationship (y = −0.00182x + 0.15) with an R-squared value of 0.11, suggesting minimal association between these two variables.

Figure 3.3.6 Long description
The y-axis represents Respondents who paid a bribe in percentage, from 0 to 50, while the x-axis represents Physicians per 10,000 people, from 0 to 60. The plots are categorised into W H O regions: Africa, Americas, Eastern Mediterranean Europe, South East Asia, and Western Pacific. The best-fit line runs from about (0, 15) to (70, 2). The equation for the line is given as y equals 0.149 minus 0.0018 times x, where R-squared equals 0.11.
Prevalence of informal payments: summary
The global prevalence of informal payments is characterized by wide variation, notably in terms of both within-region and across-region variation. In addition, we explored three health systems indicators that have been shown to be significantly associated with informal payments: level of spend on health care, level of OOP payments and physician supply – and we provide some support for these associations on a global scale. Importantly, there are major data gaps in the comparable data on both the prevalence and frequency of informal payments but also the institutional and health system factors that may contribute to these payments. The continued use of comparable national surveys and reporting by organizations such as Transparency International is vital to support scholarly research and routine monitoring and tracking of the trends in informal payments over time.
A case study of informal payments in Greece
Financing arrangements in the Greek health system: a brief overview
Health financing in Greece is mixed, funded by both public and private expenditure. Public funding accounts for almost 60% of total health expenditure and consists of resources from taxation and social insurance, with each of them having almost equal contribution. Formal OOP payments make up more than a third of total health expenditure, a much higher share than the EU average of 22% (OECD & EU, 2020). In terms of funding, the Greek health system is historically considered as one of the most privatized among EU countries, with OOP payments being the main source of private funding and a major health financing mechanism (Abel-Smith et al., Reference Abel-Smith1994; Kyriopoulos, Nikolosi & Mossialos, Reference Kyriopoulos, Nikoloski and Mossialos2019; Mossialos, Allin & Davaki, Reference Mossialos, Allin and Davaki2005). At the same time, private health insurance is underdeveloped due to several economic, social, cultural and market-related aspects (Davaki & Mossialos, Reference Davaki and Mossialos2005; Economou, Reference Economou, Sagan and Thomson2016). Greece’s funding mix can be mainly attributed to the chronic weaknesses of the public sector, such as long waiting lists, low levels of satisfaction and responsiveness, weak primary care and undersupply of some types of services (Kanavos & Souliotis, Reference Kanavos, Souliotis and Meghir2017; Mossialos, Allin & Davaki, Reference Mossialos, Allin and Davaki2005).
The scale of informal payments in Greece
A significant proportion of household health expenditure arises from informal payments, which are traditionally regarded as one the main idiosyncrasies and policy challenges in Greece’s health financing system. Informal transactions are generally widespread in both hospital and outpatient care and across public and private services (Economou et al., Reference Economou2017). Using data from 2012 and some extrapolation assumptions, Souliotis and colleagues (Reference Souliotis2016) estimated that informal health payments amount to €1.5 billion, accounting for 28% of household health expenditure in Greece. Findings for inpatient services demonstrate that informal payments accounted for 20% of household payments for inpatient care in 2005 (Siskou et al., Reference Siskou2008), while a more recent survey revealed that the respective figure was 13% (Grigorakis et al., Reference Grigorakis2016).
Evidence from survey data reveals that informal payments were incurred in almost one third of admissions to public hospitals and in 36% of visits to private practitioners (Souliotis et al., Reference Souliotis2016). In addition, they were made in 13.5% of visits to private hospitals and 19% of appointments to private diagnostic centres. These findings are generally in line with those of an earlier study, which showed that 36% of patients admitted to public hospitals reported informal payments. In addition, patients who underwent a surgical procedure were more than twice as likely to incur informal payments (Liaropoulos et al., Reference Liaropoulos2008). Another study, of a sample of women who received obstetric care in public hospitals, revealed that more than seven out of 10 women faced informal payments (Kaitelidou et al., Reference Kaitelidou2013). Using data from a convenience sample, a more recent study showed that informal transactions were undertaken in 63% of health care incidents, the rate being greater for the utilization of oncology and surgical and emergency care (Giannouchos et al., Reference Giannouchos2020). Informal payments were reported in more than 43% of a sample of 217 admissions to private hospitals for surgical care (Grigorakis et al., Reference Grigorakis2016). Evidence from patients who visited contracted physicians also reveals that 47% of them made informal payments to get prescriptions (Kyriklidis et al., Reference Kyriklidis2016).
Explaining informal payments in Greece
Informal payments have traditionally served as a complement to inadequate public funding and can be largely attributed to the fragmented and patchy design of health coverage (Mossialos & Allin, Reference Mossialos and Allin2005) and the inefficient pricing and doctor reimbursement systems, while also reflecting the lack of effective control mechanisms (Economou et al., Reference Economou2017).
In a recent qualitative report, key informants identified both direct and indirect motives for the incidence of informal payments in Greece (WHO Regional Office for Europe, 2018). Doctors’ demand for additional payment, better access to high-quality care, provider choice, fear of getting inadequate care and adherence to the common practice were considered as the key reasons for the extensive informal transactions within the Greek health system. However, earlier studies report mixed findings. A strand of the evidence shows that patients tend to incur informal payments in order to skip the long waiting lists in Greek health system and facilitate access to care (Economou & Giorno, Reference Economou2009). This is also confirmed by quantitative evidence. According to survey data, more than 70% of patients who incurred informal payments did so to facilitate access and reduce waiting times. The corresponding figure was greater among respondents who visited public hospitals, private practitioners and private diagnostic centres, exceeding 80% (Souliotis et al., Reference Souliotis2016). The findings on the importance of access to health care as the key explanation for the incidence of informal payments contradict earlier evidence, which reveal that fear of receiving suboptimal care was the most common reason for paying informally in Greek public hospitals (Liaropoulos et al., Reference Liaropoulos2008). Almost nine out of 10 Greek patients who incurred under-the-table payments in public services did so following a doctor’s request, rather than offering them as a gratuity (Souliotis et al., Reference Souliotis2016). This is consistent with some earlier findings, showing that the primary reason for making such payments was doctor demands, with a smaller share of patients offering them as an expression of gratitude to health providers (Davaki & Mossialos, Reference Davaki and Mossialos2005; Kaitelidou et al., Reference Kaitelidou2013; Liaropoulos et al., Reference Liaropoulos2008).
Impact of informal payments on the Greek health system
Informal payments have detrimental effects on Greece’s health system performance, with their prevalence partly explaining the high rates of dissatisfaction with the public health services (Kyriopoulos & Mossialos, Reference Kyriopoulos, Mossialos and Immergut2021). Their high frequency does not merely reflect luxury preferences or cultural idiosyncrasies. Rather, informal transactions are an established practice and widespread behaviour, with a large share of doctors demanding such payments to facilitate access to care (Souliotis et al., Reference Souliotis2016). This practice directly compromises access to care, with those who cannot afford such payments facing additional barriers reflected in different quality of care or longer waiting lists (Mossialos, Allin & Davaki, Reference Mossialos, Allin and Davaki2005).
There is conflicting evidence on the link between financial status and the probability of informal payments in Greece. A strand of the literature has shown that socioeconomic characteristics are not associated with the incidence and intensity of informal payments (Horodnic et al., Reference Horodnic and Polese2017; Liaropoulos et al., Reference Liaropoulos2008), whereas a more recent study found that the better-off tend to make larger informal payments (Giannouchos et al., Reference Giannouchos2020). This discrepancy is potentially explained by the decreasing capacity to pay during the Greek economic crisis, especially among poorer households. But even if the worse-off pay less than their richer counterparts, their payments correspond to a higher share of their household income (Economou & Giorno, Reference Economou2009). In this context, informal payments further exacerbate the regressivity of an already regressive funding mix, disproportionately burden poorer households and compromise equity in financing and financial protection (Economou et al., Reference Economou2017; Kyriopoulos, Nikolosi & Mossialos, Reference Kyriopoulos, Nikoloski and Mossialos2021). For example, recent qualitative findings shows that Greek households may even cover their informal expenses for health care through credit (WHO Regional Office for Europe, 2018). Evidence from self-reported data demonstrates that informal payments had a large impact on living standards for 56% of people with poor financial status and for almost a third of their better-off counterparts (Souliotis et al., Reference Souliotis2016).
Patient pathways are currently guided by an informal referral process, given the lack of a well-functioning referral system and explicit official clinical guidelines. This system is largely driven and reinforced by informal payments, exacerbating inefficiency as a result of provider incentives for supplier-induced demand and suboptimal use of existing resources (WHO Regional Office for Europe, 2018).
Policy responses to informal payments
In Greece, there have been efforts to address the persistence of informal payments and minimize their adverse impacts. There have been multiple measures proposed for short-term implementation and impact: (i) focusing on the legal prohibition along with active enforcement of preventive regulations; (ii) increasing doctors’ salaries; (iii) providing information to raise awareness and increase transparency; (iv) introducing channels of voice and public opinion; and (v) formalizing informal payments. Apart from the short-term measures, there are several long-term policies for reducing fragmentation, inefficiencies and structural weaknesses in financing and delivery of care, which can help reduce the incidence and intensity of informal payments (Kyriopoulos & Mossialos, Reference Kyriopoulos, Mossialos and Immergut2021). For example, a list of such measures includes changes in provider payment and pay for performance schemes, reduced fragmentation of pooling, reform of primary care and the referral system, better care coordination, and expansion of the benefits package. To date these have had limited effects, due in part to the external environment: the financial crisis of 2008 and subsequent austerity measures, and the global COVID-19 pandemic have further challenged efforts to reform and strengthen the health system in Greece and to make a dent in informal payments. In addition, there are endemic and deep-rooted vested interests that often block the required reforms (Mossialos, Allin & Davaki, Reference Mossialos, Allin and Davaki2005; Kyriopoulos & Mossialos, Reference Kyriopoulos, Mossialos and Immergut2021). Some of the doctors’ associations are powerful interest groups with strong incentives to maintain the status quo, which allows them to secure higher income and autonomy. In addition, although politicians rhetorically emphasize the importance of addressing informal payments, they have not yet devised a comprehensive strategy for doing so. The reason for this possibly relates to the additional fiscal space needed for increasing public spending for health care and the political commitment required for the introduction of comprehensive auditing mechanisms.
Policy relevance and conclusions
Globally, informal payments play a role in financing health care in a diverse set of jurisdictions; they arise in the context of resource constraints, institutional deficiencies such as government corruption, and have multiple impacts on health and health systems. Within the literature on informal payments, there is strong evidence concerning the impacts on access to care and financial protection, as well as potentially on trust in providers and governments. Poorer patients may be forced to make significant sacrifices (e.g. borrowing money, selling produce, valuables or livestock), to pay for essential health services (Allin, Davaki & Mossialos, Reference Allin, Davaki and Mossialos2006). For example, studies have found both that vulnerable groups paid more often than other groups (Buch Mejsner & Eklund Karlsson, Reference Buch Mejsner and Eklund Karlsson2017) and that informal payments were more common for rich/wealthy individuals (Amiri et al., Reference Amiri2019).
The policy responses to reduce the prevalence of informal payments in a country will invariably depend on the national context, including the economic, social and political systems within which the health system is situated. Broadly the policy solutions will need to address the economic, institutional and health system factors that have been found to drive informal payments in the first place. Some theoretical drivers of informal payments may lend support to increasing private payments to both: (i) supplement provider salaries; and (ii) provide patients with an option to exit the public system and pay privately. However, the potential for new revenues and possible declines in informal payments need to be balanced against risks to equitable access and financial protection that come with increasing OOP payments. Where possible, collective or public financing could be used to increase wages, address workforce shortages and to reduce the need for informal payments. To address the lack of viable options for patients to express disappointment or concerns with quality of care in the publicly funded systems, potential policy responses include the establishment of formal options to address grievances, such as with a patient ombudsman, or patient complaints processes, while ensuring these are monitored and result in action. The institutional challenges such as government corruption, lack of oversight of the health system, informational asymmetry, and lack of trust among the population suggest a need to increase transparency and public communications about decision-making, including about the benefits package in the public system, and broader anticorruption measures could all help to address informal payments.
Overall, the policy actions should be informed by an understanding of the specific drivers of informal payments in a particular country, which may relate to some but not all of the factors described above. Moreover, since the existence of informal payments may not be the policy problem itself but rather a symptom or manifestation of broader health system and institutional challenges, the policy solutions may not directly target informal payments per se (e.g. tightening enforcement mechanisms) but they may require much broader health system reforms. Policy options that target the problem of informal payments include: formalizing informal payments to ensure that exemptions can be introduced to protect vulnerable populations and that revenues can be invested in health system improvement; and clarifying the definition of and communication about a benefits package that is reasonable given the economic context of the country. The broader system-level policy options that address broader challenges that are driving informal payments include: increasing spending on health systems; supporting better monitoring and enforcement of the rules and any penalties for informal payments; and maintaining and expanding the scope, breadth and depth of insurance coverage.
On a final note, we leveraged internationally comparable data from the Global Corruption Barometer in this chapter to describe the prevalence of informal payments and the association with a selection of institutional factors. Our analysis highlights that informal payments are reported in most world regions and there is considerable within-region variability, which relate in part to health system expenditures, the role of OOP payments, and physician supply. Though analyses such as these have a number of limitations, Transparency International conducts these surveys with representative samples. Due to data limitations, we were only able to focus on systemic factors rather than the relationship between individual level characteristics and likelihood of paying informally. Furthermore, due to potential underreporting of informal payments by patients, we can presume that our results are conservative estimates of the actual prevalence. As with other illicit or stigmatized behaviours, respondents might be unlikely to share their true experiences. This issue could be mitigated through a more diverse set of methodologies. In addition to standard surveys, which are the primary method of data collection on the topic, the academic and policy literature would benefit from alternative approaches to information elicitation.
Reducing informal payments in health systems requires targeted responses specific to informal payments, as well as broader health systems reforms to address their underlying drivers. Importantly, the policy solutions proposed to address the specific problem of informal payments have the potential to not only reduce the prevalence of informal payments but also to yield positive impacts on health system performance and health outcomes. The COVID-19 pandemic has further underscored the need to prioritize health workers and their adequate remuneration, and to ensure equitable access to essential services. However, the economic and health shocks of the pandemic, combined with high levels of distrust in governments in many jurisdictions, constitute a major obstacle both to prioritizing informal payments as a policy problem and implementing the needed health system reforms to address them.Footnote 5
Key messages
Chapter 3.4 explores how pharmaceutical care is financed. Paying for medicines includes how the end-purchase of existing medicines is managed but also the way investment in R&D is handled. Key learning includes that:
Pharmaceutical innovation draws on substantial public and private resources.
The public sector primarily supports early-stage research, regulates the industry and incentivizes development.
The private sector is typically central to development, commercialization, manufacture and marketing. It seeks high profit margins and is not always transparent or responsive to public policy priorities.
Novel and specialized therapeutics as well as population ageing are likely to accelerate medicines expenditures. This requires careful management of pricing and reimbursement.
Policy-makers can leverage a mix of push and pull strategies to align industry efforts with societal need.
To optimize pharmaceutical policy policy-makers must consider:
○ clear communication of health system priorities;
○ transparent incentive and pricing systems and measures to enhance R&D efficiency;
○ payment mechanisms that foster equity and sustainability;
○ cross-country collaboration including on preparedness, procurement and pricing transparency.
Introduction
Pharmaceutical care is an important contributor to how health systems retain health gains and improve future outcomes. Pharmaceutical spending is one of the largest items in health expenditures for most health systems, while patient cost-sharing for pharmaceuticals is one of the main contributors to health care-related financial hardship. The rate of pharmaceutical spending growth seems to have slowed primarily due to cost containment measures implemented in response to the global financial crisis and the concurrent patent expiry of many popular outpatient medicines (OECD & EU, 2022; Belloni, Morgan & Paris, Reference Belloni, Morgan and Paris2016). However, the advent of specialized medicines and advanced therapy medicinal products (ATMPs) in conjunction with population ageing are likely accelerating spending again, a trend which is harder to track given that many of these newer therapies are used in inpatient settings, where data on pharmaceutical expenditure are harder to come by (Morgan & Xiang, Reference Morgan and Xiang2022). What is clear is that new medicines are entering the market at increasingly high price tags, a phenomenon which progressively hampers governments’ abilities to purchase the latest innovations for their citizens. Meanwhile, pharmaceutical companies are reaping significant financial benefits: 35 of the largest pharmaceutical companies generated a cumulative global revenue of US$ 11.5 trillion between 2000 and 2018, with greater profitability margins than other large Standard and Poor’s (S&P’s) 500 index companies (Cutler, Reference Cutler2020; Ledley et al., Reference Ledley2020). Thus, rethinking the balance between ensuring access and incentivizing innovation is becoming increasingly important.
In addition to paying for medicines which are already on the market, societies also spend on medicines in other ways. The high risk of failure in drug development, the controlled nature of clinical trials and the long interval between medicine discovery and market authorization mean that every stage in the medicine development pipeline comes at a substantial cost (Wong, Siah & Lo, Reference Wong, Siah and Lo2019). High prices for pharmaceuticals typically aim to offset pharmaceutical companies’ R&D investment and cover production and distribution costs. However, substantial amounts of public funding also flow into medicines’ discovery and development before consumer purchase (Galkina Cleary et al., Reference Galkina Cleary2018; Wizemann, Robinson & Giffin, Reference Wizemann, Robinson and Giffin2009). To fuel innovation and subsequently ensure equitable access to affordable medicines, governments adopt a range of policies to try and steer pharmaceutical R&D towards unmet health care needs and to influence the prices at which new medicines can be purchased after market authorization. As well as leveraging policy instruments to negotiate prices, governments must decide how best to allocate public funding and the level of co-payments, i.e. the extent to which they require their citizens to meet the cost of their own pharmaceutical care. These are decisions which may lead to considerable variation in pricing, coverage and access to medicines across different countries. Pricing and reimbursement decisions may be guided by evidence-based tools, including health technology assessment (HTA), to evaluate the clinical trial information submitted by manufacturers at the time of market authorization. Particularly for specialized medicines and biotechnology-based gene and cell therapies, repeated pricing and reimbursement assessments may be warranted over time, as further evidence on the cost–effectiveness of therapies becomes available.
This chapter explores how pharmaceutical care is financed, starting with investment in R&D for new medicines and then zooming in on the purchase of medicines by health systems, including the suitability of existing pricing and reimbursement models for novel types of therapeutics and the purchasing strategies adopted by different countries. Each of these two main sections follows a similar analytical structure and discusses the relative financial role of the public and private sectors (including patients), what the invested funds cover (particularly in terms of meeting patient needs), as well as the actual sums of money paid. Current pricing and reimbursement models and their suitability for novel types of therapeutics are also explored and we suggest potential ways the system could be improved.
Investing in R&D
R&D jointly make up the first stage in the pharmaceutical life-cycle and are concurrently the costliest and most failure prone. It can take several years for a new pharmaceutical target to become a real-world medicine and, on average, another eight years of clinical trials until marketing authorization and sales are underway (Wong, Siah & Lo, Reference Wong, Siah and Lo2019). It is estimated that only around 10–14% of novel medicine candidates are approved for launch, with considerably lower success rates in specific medical subfields such as oncology (Hay et al., Reference Hay2014; Thomas et al., Reference Thomas2016; Wong, Siah & Lo, Reference Wong, Siah and Lo2019).
Most medicine development starts with basic research (preclinical phase) into disease mechanisms with the objective of identifying potential therapeutic candidates for later development and commercialization. If a promising medicine candidate is selected for further advancement, its clinical efficacy and safety must be assessed under strictly controlled conditions in a sequence of clinical trials, which typically consist of three successive clinical trial phases (I–III) involving progressively larger participant groups (US FDA, 2018; Wong, Siah & Lo, Reference Wong, Siah and Lo2019). Phase III is the most expensive of the trial phases, but it is typically associated with a high rate of success (50–60%) (Hay et al., Reference Hay2014; Thomas et al., Reference Thomas2016; Wong, Siah & Lo, Reference Wong, Siah and Lo2019). Manufacturers apply for intellectual property protection during this process, which encompasses different types of incentives to drive pharmaceutical innovation (see Box 3.4.1). To be considered for marketing authorization, new medicines generally must yield positive results at the end of phase III trials. To obtain a marketing authorization, manufacturers are required to submit an application to the competent authorities in different countries or to the European Medicines Agency (EMA) for the centralized marketing authorization in the EU (the latter is currently the principal pathway for new medicines). Clinical trials also encompass a fourth phase termed pharmacovigilance, which unfolds after a medicine’s marketing authorization (phase IV) and serves to monitor its efficacy and safety under real-world conditions. Pharmacovigilance usually proceeds for several years after market entry and continues to inform policy processes on the pricing and reimbursement of medicines.
Intellectual property rights are one of the most widely established incentives used by governments to propel innovation in the pharmaceutical sector. They comprise a range of different advantages and rewards, which secure the financial viability of pharmaceutical companies in a system characterized by high rates of failure, while also protecting inventions from competition (for a set number of years) and so, potentially, steering research into areas of unmet clinical needs, which may ultimately benefit patients. The main types of intellectual property rights are as follows.
Patents
Patents are classified as a type of industrial property and are typically granted for 20 years. They provide a period of exclusivity for new inventions (including processes, technologies or active substances), during which time they may not be marketed and profited from by anyone other than the patent owner. Medicines can carry numerous different patents at any given time. Competition from other developers is only possible once all patents have expired.
Supplementary protection certificates
Manufacturers are required to file patents for new medicine candidates early in the R&D process. Since patent protection only starts when marketing authorization is obtained, in practice the time during which the medicine is protected from competition is shorter than the 20-year patent period, because of lengthy clinical trials required to prove the safety and efficacy of new medicines. The protection until market authorization is considered as “passive”. Supplementary protection certificates can restore part of the protection that has been lost, up to a maximum of five years.
Regulatory data protection
This form of intellectual property rights is separate from patent rights and protects data pertaining to a new medicine, including all data that are collected during the clinical trials leading up to market authorization, rather than the invention per se. After marketing authorization is granted, pharmaceutical companies generally have exclusive rights to this data for a certain number of years (eight years in the EU).
Market exclusivity/protection
This is another type of regulatory protection scheme which may apply in addition to patent rights. Market exclusivity/protection grants protection from other generics or biosimilars with the same therapeutic indication from being placed on the market for a defined amount of time after data exclusivity expires.
Efficiency gains made during the R&D process can shorten the passive patent protection period and bring forward the moment when manufacturers start to benefit from market exclusivity and can maximize investment returns through sales of the new medicine. For example, in a marketing authorization process, termed rolling review, medicines may be considered for authorization by regulatory agencies while evidence is still being generated during clinical trials, thereby accelerating market entry (as was seen with vaccine development during the COVID-19 pandemic) (EMA, n.d. a; Marinus et al., Reference Marinus2022).
In the EU, new pharmaceuticals are subject to both data and market exclusivities (EU, 2001; 2004). The former protects preclinical and clinical trial data for a duration of eight years and hinders generic competitors from applying for marketing authorization. Data exclusivity clauses foresee public disclosure of dossiers after expiry; however, generic competitors may not be marketed for another two years as part of the market exclusivity rights granted to reference products under European legislation (European Commission, 2019; EMA, n.d. b). At the time of writing, the EU’s pharmaceutical legislation is currently being reviewed as part of a broader strategy to strengthen crisis preparedness and access to affordable and innovative medicines in the Union, with new proposals for a Regulation and Directive published in April 2023 (European Commission, 2023a; 2023b). The proposed legislation envisions changes that may alter the conditions under which additional regulatory protection schemes (data and market protection) are granted to applicant manufacturers in upcoming years, including possible extensions to the duration of data protection. Among several planned changes, the introduction of transferable data exclusivity vouchers aims to incentivize the development of priority antimicrobials by prolonging the duration of data protection and enabling developers to either use or sell vouchers to other marketing authorization holders (European Commission, 2023b).
Who pays for R&D?
The pharmaceutical industry funds the development, commercialization and manufacture of medicines. The public sector regulates the industry and incentivizes the development and production of medicines it typically neglects. It also pays for most of the initial research, which is what we deal with first.
Early-stage research: predominantly public funding
Most early-stage (preclinical) research is funded by public means (usually pooled from taxpayers’ money) and is typically conducted in academic institutions and research centres (Wizemann, Robinson & Giffin, Reference Wizemann, Robinson and Giffin2009). Gaining an understanding of biological processes and uncovering disease pathways lay the foundation for pharmaceutical innovation and the discovery of new medicine candidates. Investment in basic research comprises a large share of overall R&D spending. In the USA, the National Institutes of Health dedicates 50% of its budget to this cause and, between 2010 and 2016, funded research underlying (both directly and indirectly) all 210 new medicines approved by the United States Food and Drug Administration during this period (Galkina Cleary et al., Reference Galkina Cleary2018). The EU is another crucial funder of fundamental research, having dedicated nearly €100 billion to its current research programme, Horizon Europe (European Commission Directorate-General for Research and Innovation, 2021). Under the previous research programme, Horizon 2020, one quarter of health-related projects were in the area of basic research (Gallo et al., Reference Gallo2021). Research that is publicly funded has been reported to generate a distinctive share of products with important clinical effects (see Box 3.4.2), particularly in areas of unmet medical need such as rare diseases (Stevens et al., Reference Stevens2011).
The COVID-19 pandemic saw governments step out of their traditional roles as early-stage funders, contributing significantly to late-stage development and propelling the manufacture of COVID-19 countermeasures. Agarwal and Gaule (Reference Agarwal and Gaule2022) estimate that close to 70% of COVID-19 trials were started by public institutions, including universities and hospitals. Governments worldwide invested in the expansion of infrastructure and facilities to scale up production capacities, even before the completion of clinical testing of the vaccine candidates in question (Wouters et al., Reference Wouters2021). In 2020, the United States government alone invested between US$ 11 to US$ 19.5 billion in late-stage vaccine research and supported vaccine manufacturing capacity-building to ensure production could be expanded adequately within the country (known as Operation Warp Speed). Most high-income countries (HICs) stipulated prepurchasing agreements with multiple vaccine developers to secure vaccine doses for their populations. Beyond vaccine procurement, monoclonal antibodies now approved for treatment were developed using therapeutic research platforms and technologies which benefited from public sector support prior to the pandemic. The adaptation of these technologies to commercialize and develop an effective COVID-19 treatment yielded substantial additional investment from governments globally (Robinson, Reference Robinson2021).
Development: predominantly private funding with public sector incentives
In contrast to early research, the brunt of the cost for medicines’ development, commercialization and manufacture is borne by the private sector (Kalindjian et al., Reference Kalindjian2022). Additionally, the pharmaceutical industry spends substantial amounts on buying back shares and on marketing to ensure successful market penetration by newly developed medicines. These activities can surpass expenditure on R&D itself (Mazzucato et al., Reference Mazzucato2018) (Box 3.4.3).
The industry engages heavily in lobbying activities to propel its interests at policy level to ensure outputs surpass the R&D stage and successfully enter the market (EMA, 2022; Wouters, Reference Wouters2020). It also funds patient advocacy organizations working on indications in which they have marketed products and provides financial incentives to health care professionals, whose prescribing decisions have shown to be directly influenced by such industry payments (Mitchell et al., Reference Mitchell2021). The fact that the work of regulatory agencies is also funded through user fees paid for by the industry has led to discussions around the potential for regulatory capture (Wouters, Reference Wouters2020).
Over time, the industry’s structure has evolved to rely strongly on the commercialization of scientific discoveries and the entrepreneurial potential of scientific research, resulting in closer partnerships with academic institutions and strategic mergers with biotechnology firms through the financial support of private equity and venture capital (Malerba & Orsenigo, Reference Malerba and Orsenigo2015). However, the increased dependency on shareholder expectations and a stable performance in stock markets has largely favoured R&D investments with short-term returns and high profit margins. With a vision to sustain and increase its revenues, the industry has grown to become a skilled political and economic player in the health care arena.
Governments can try to regulate and incentivize the medicine development process to some extent to steer development to areas of unmet need. This includes leveraging so-called push and pull mechanisms (see chapters 3.9 and 3.10). These approaches incentivize private R&D investment at the entry and exit points of the pipeline, respectively. Box 3.4.4 showcases examples of how these tools work using the case of antibiotic development.
Push financing consists of R&D subsidies in the form of direct funding (e.g. project grants, fellowships and scholarships for researchers, funding for small and medium-sized enterprises (SMEs)), which can be conditional on research in specific domains or aimed at stimulating translational research along the entire medicine supply chain and so lower the risks of loss for private investors (Panteli & Edwards, Reference Panteli and Edwards2018). Push financing can also take the shape of indirect support such as tax benefits to encourage the participation of SMEs in the R&D process. While this lowers the risk of failure for the private sector, it can be a burden to public funders and does not guarantee delivery of the required output at the end of the pipeline. Similarly, it is frequently implemented on a national scale, limiting the potential global level benefits.
Conversely, pull mechanisms provide financial incentives once specific development milestones have been achieved. These must sufficiently offset the risk for SMEs to partake in the development process, while also requiring a longstanding political commitment given the protracted timeline of R&D for a new medicine. Such output-based financing tools can comprise lump sum or milestone prizes, advanced purchasing agreements, which entail committing to the acquisition of a new medicine at a specified price and/or volume prior to the completion of the R&D process (advanced market commitment). Alternatively, rewards-based tools can rely on performance indicators (pay for performance) such as medicine consumption levels or be awarded in exchange for intellectual property rights (patent buyouts) and unlimited patient access (payer licenses) (Panteli & Edwards, Reference Panteli and Edwards2018). These mechanisms reward the achievement of specific goals but are also susceptible to shifting political agendas. At the same time, the risk is borne entirely by the developer, which can deter smaller enterprises from participating in the R&D process. Pull mechanisms may require the pooling of resources across multiple countries to offer meaningful financial rewards for the delivery of a specific output without compromising cost–effectiveness (Panteli & Edwards, Reference Panteli and Edwards2018).
Beyond push and pull mechanisms, there are also important examples of initiatives blurring the traditional public and private sector roles and transcending the barriers to establish fruitful collaborations across sectors, including public–private partnerships such as the Innovative Medicine Initiative (now Innovative Health Initiative) and the Drugs for Neglected Diseases initiative (DNDi).
Push mechanisms: Feeding the preclinical antibiotic pipeline
It has been estimated that over two thirds of the financial incentives to develop new antibiotics are provided in the form of push incentives (Simpkin et al., 2017). In recent years, many national and transnational programmes have been initiated across the USA and EU (Wasan et al., 2023). For example, the United States Biomedical Advanced Research and Development Authority (BARDA) launched a dedicated initiative in 2010 and established public–private partnerships aimed at developing new antibiotics and diagnostics. Between 2010–2019, nearly US$ 1 billion in grants, agreements and contracts were awarded by BARDA through these channels for the development of antibiotics (Wasan et al., 2023). At the EU level, the Innovative Medicines Initiative (predecessor of the Innovative Health Initiative), a public–private partnership co-funded by the EU and involving a range of stakeholders, including from academia and industry, established the New Drugs for Bad Bugs programme. With a budget of €650 million, the programme supported projects working towards solutions to overcome challenges impeding the development of new antibiotic treatments (Innovative Medicines Initiative, n.d.). For example, one of these projects (TRANSLOCATION) focused on finding new pathways for the delivery of antibiotics into bacteria (with a focus on Gram-negative pathogens such as Escherichia coli, which are subject to high rates of resistance and particularly challenging to penetrate for drugs) (Innovative Medicines Initiative, n.d.).
Pull mechanisms: The Longitude Prize
The Longitude Prize, a prize co-funded by Innovate United Kingdom (the United Kingdom’s national innovation agency) and a range of public and private entities including the BBC, Amazon and Glaxo Smith Kline, offers substantial financial rewards, up to several million pounds, to teams of innovators who develop novel solutions to address pressing societal problems. In the area of health, these so-called “challenge” prizes have addressed priority issues including dementia (i.e. how to help conserve the independence of affected individuals in their everyday lives) and antibiotics (i.e. how to halt the rise in resistance to antibiotics). For example, one prize, offered £8 million for the development of rapid diagnostic tests, which could be used by clinicians to identify the most suitable antibiotic therapies at the point-of-care and thereby promote better antibiotic stewardship in the clinical setting (Longitude Prize, https://amr.longitudeprize.org/).
For further information on the underlying issues of the antibiotics market and some of the initiatives operating to incentivize antibiotic R&D and tackle AMR, see Chapter 3.9.
Investment in R&D: does it produce the medicines we need?
As the primary proponent and cost carrier of medicines’ commercialization and manufacture, the pharmaceutical industry largely determines which medicine candidates enter the development pipeline. Private R&D investment choices have shown that expected profits and market growth are more important factors in pharmaceutical company decisions than unmet societal needs (Kalindjian et al., Reference Kalindjian2022). Risk of failure does not seem to be a prominent determinant of medicine development decisions, as particularly risky domains like oncology have experienced an important investment surge in recent years (Huang & Nambudiri, Reference Huang and Nambudiri2020).
As of late, the pharmaceutical sector has experienced a fall in numbers of new medicines brought to market, as medicine development has become increasingly specialized, complex and lengthy with the advent of biologicals and biotechnology-based gene and cell therapies (also known as ATMPs) (Hay et al., Reference Hay2014). R&D investment is increasingly concentrated in areas protected from competition, such as medicines for rare or neglected diseases and ATMPs. The area of oncology has seen a particular peak in authorizations over the last decade, with close to 50% of the global pipeline focused on oncology and immunology (Shimmings, Reference Shimmings2017). While cancer is a major public health issue, other chronic diseases such as cardiovascular conditions which cause millions of deaths each year have experienced a decline in investment and medicine development (Fordyce et al., Reference Fordyce2015). Moreover, evidence suggests at least one in five new cancer medicines do not bring any improvement to patients in terms of quality of life, overall survival, or safety benefits (Davis et al., Reference Davis2017; Salas-Vega, Iliopoulos & Mossialos, Reference Salas-Vega, Iliopoulos and Mossialos2017; Vokinger et al., Reference Vokinger2020; Reference Vokinger2022). Neglected and antimicrobial-resistant diseases are another area of public health concern, which is underrepresented in medicine development efforts, likely due to the limited scope for returns on investment (see chapters 3.9 and 3.10). Overall, R&D efforts do not appear to correlate with global disease burden (Cottingham, Kalbaugh & Fisher, Reference Cottingham, Kalbaugh and Fisher2014). Relatedly, incentives originally introduced to propel the development of medicines to cater for the unmet needs of rare disease patients have also had unexpected effects, oversteering investment in this area and contributing to the emergence of “niche” blockbuster products (Kumar Kakkar & Dahiya, Reference Kumar Kakkar and Dahiya2014). The Pharmaceutical Strategy for Europe and ongoing revisions of the EU’s general pharmaceutical legislation aim to address and correct some of these possible misincentives in the European context (European Commission, 2023a; 2023b).
Even in areas with substantial R&D investment like cancer, there is a disproportionate focus on projects of shorter duration, such as late-stage cancer, due to the immediacy of financial rewards and the limited profitability stemming from fixed patent duration (Budish, Roin & Williams, Reference Budish, Roin and Williams2015). The system’s reliance on patents as one of the primary incentives of innovation actively influences industry practices and hampers medicine innovation. In particular, it has created a market for new medicines which form part of the same therapeutic class as existing medicines (known as “me-too” medicines) and provide limited or no added clinical benefits due to their closely related molecular structures and modes of action. Me-too medicines build on existing knowledge and are hence faster to develop and commercialize. In addition, being subject to conventional intellectual property protection, they can represent profitable ventures for medicine developers once patents for other members of the same class expire (Gagne, Reference Gagne2011). These and similar approaches adopted by industry to extend the market protection and profitability of their products impede the introduction of generic alternatives which would improve the affordability of medicines for patients.
Research duplication and waste represent other important sources of costs, which can be challenging to fully ascertain. Evidence suggests that up to 80% of clinical trials produce redundant findings and approximately 50% never publish full reports of performed research and results (Glasziou & Chalmers, Reference Glasziou and Chalmers2016). The failure to disclose full records and clinical effectiveness information from clinical trials is accompanied by a reporting bias towards positive clinical outcomes (Mitra-Majumdar & Kesselheim, Reference Mitra-Majumdar and Kesselheim2022). As a result, a substantial proportion of medical research funding risks being misspent as research efforts are duplicated even when they have demonstrably yielded meaningless results. In addition, there are ethical implications of failing to report negative results of clinical trials. If these results were reported, it could prevent and protect future trial participants and patients from receiving therapies which are unlikely to generate clinical benefits (Nygaard, Reference Nygaard2017). Additionally, without full disclosure of all clinical trial results, public payers risk overpaying for medicines if they lack and cannot avail themselves of the full picture of clinical trial outcomes when entering pricing negotiations (Vogler, Reference Vogler2022a).
To enable fast access to medicines addressing unmet patient needs, the EMA provides manufacturers with the option of obtaining early scientific advice and accelerated assessments. This was systematized in its PRIME scheme, a voluntary scheme providing guidance on data and clinical trial requirements to participating medicines at early stages of development (EMA, n.d. c). Approaches such as this one are more permissive with regards to the standards of evidence required than traditional marketing authorization procedures and have shown to reduce average approval time by a few years (Panteli & Edwards, Reference Panteli and Edwards2018). This may result in efficiency gains in the R&D process leading up to authorization, although safety and efficacy should continuously be monitored as well as missing evidence substantiated to comply with post-marketing requirements. Concerns have been raised, however, that accelerated assessments may expose patients to safety risks and progressively lower evidentiary requirements if used inadequately, instead of effectively managing unmet needs (Panteli & Edwards, Reference Panteli and Edwards2018). Box 3.4.5 describes an additional way to accelerate the development of medicines to meet medical needs currently uncatered for, by repurposing existing medicines.
There are different ways in which a drug candidate or a marketed medicine can be repurposed to serve a new therapeutic use in addition to the one for which it was originally approved or developed. The development of repurposed medicines is associated with lower costs and shorter timelines for the developing entity than traditional clinical trials and can revive research on partially developed molecules which were never approved for use (Pushpakom et al., Reference Pushpakom2019); as a result, repurposing has been used as a commercial strategy for years (Botella, Reference Botella2022).
However, for conditions with unmet clinical needs and/or without viable treatment options, developing other clinical indications for administering and combining existing products can also present new effective treatment solutions and enhance patient access to them (Frail et al., Reference Frail2015). Numerous initiatives have been launched in this direction. For example, building on the work of the European Commission’s Expert Group on the Safe and Timely Access to Medicines for Patients, the EMA launched a repurposing pilot project to support academia and non-profit organizations in studying the use of existing medicines for new indications in 2021 (EMA, 2021a). Within the scope of the project, beneficiaries can obtain regulatory and scientific advice to support the development of an application for regulatory approval (EMA, 2021a).
How much money is spent on R&D?
Despite fewer new products being commercialized, the sector has experienced continued increases in investment with substantial incentives provided by public and private entities to spur innovation (Huang & Nambudiri, Reference Huang and Nambudiri2020). The pharmaceutical industry is characterized by elevated fixed R&D and marketing costs and a low marginal production cost. As explained above, it takes substantial investment to discover and launch a new medicine, while the cost of producing an extra unit is usually comparatively small (Cutler, Reference Cutler2020; Rennane, Baker & Mulcahy, Reference Rennane, Baker and Mulcahy2021). Several studies have deployed different methodologies and sources to attempt cost estimations of the R&D process, which range between US$ 314 million and US$ 2.8 billion for the development of new molecular entities (DiMasi, Grabowski & Hansen, Reference DiMasi, Grabowski and Hansen2016; Wouters, McKee & Lutyen, Reference Wouters, McKee and Luyten2020). Other publications report even broader ranges. Rennane and colleagues detected gaps of US$ 113 million to US$ 6 billion accounting for all new medicines, including those developed in specific cost-intensive therapeutic areas such as Alzheimer’s disease (Rennane, Baker & Mulcahy, Reference Rennane, Baker and Mulcahy2021). Similarly, a 2016 report by the United Nations Secretary-General’s High-Level Panel on Access to Medicines (2016) described estimates ranging between US$ 100 million to US$ 4.2 billion.
The costliest of the R&D stages are phase III clinical trials, with USA estimates suggesting that the cost of a pivotal trial alone lies somewhere between US$ 12 to US$ 53 million depending on therapeutic area studied. In the same study, cost estimates for phase II trials and phase I trials also varied importantly by therapeutic area being examined, with ranges of US$ 7 to US$ 20 million and US$ 1 to US$ 7 million, respectively (Sertkaya et al., Reference Sertkaya2016). Figures in a similar ballpark were reported by other USA-based investigations (Moore et al., Reference Moore2018; Reference Moore2020). The question remains whether pharmaceutical companies’ overall R&D investments are truly reflective of the high pharmaceutical prices charged at the end-users’ side. A few initiatives have been pressing for more transparency in this regard. For example, DNDi, the public–private partnership working towards treatment solutions for neglected diseases, has pledged to disclose the R&D costs of its products (DNDi, n.d. a; n.d. b; 2022), which as some evidence suggests, have been lower than those reported by pharmaceutical companies (Junod Moser et al., Reference Junod Moser2023; Moon, Reference Moon2017; Moon, Bermudez & ’t Hoen, Reference Moon, Bermudez and Hoen2012).
Pharmaceutical companies argue that the elevated failure rate and high costs incurred in the early stages of a medicine’s life-cycle necessitate the observed high prices of newly marketed products. However, the industry’s resistance to disclosing the full costs of medicine development undermines this argument and has prompted multiple investigations into the true costs of the R&D pipeline. Moreover, this argument fails to account for the substantial public investment in basic research as stated above. Going forward, enhancing the system’s transparency is key and could potentially support R&D priority-setting based primarily on societal needs rather than commercial viability (Panteli & Edwards, Reference Panteli and Edwards2018).
In this first half of the chapter, we have looked at the financing of medicines’ R&D. In the next half, we turn to look at how their purchase is funded and some of the processes involved.
Purchasing medicines
Once medicines have received marketing authorization and commercial production can begin, they are registered with relevant regulatory agencies who serve as intermediaries between pharmaceutical companies, prescribing health care professionals and patients, and ensure continued data collection and pharmacovigilance. Different payers are responsible for purchasing medicines depending on the organizational set-up of the health system. Against the backdrop of their budgetary constraints, payers face the challenge of providing comprehensive access to effective medicines while also providing appropriate incentives to continue fuelling the system with innovations. Health systems employ different mechanisms to determine reimbursement and pricing of medicines. At the early stage of marketing, evidence on the effectiveness and safety of medicines is usually limited, hampering payers’ abilities to robustly determine willingness to pay. Exclusivity rights and the resulting lack of competition (see Box 3.4.1) contribute to high pharmaceutical prices and expenditures (Kesselheim, Avorn & Sarpatwari, Reference Kesselheim, Avorn and Sarpatwari2016; Vincent Rajkumar, Reference Vincent Rajkumar2020). According to 2020 estimations, pharmaceutical spending was approaching 20% of net health expenditure in several European countries (OECD, 2020). Furthermore, official estimates of pharmaceutical expenditure commonly exclude the costs of medicines purchased and dispensed within hospitals and sometimes also those incurred by private households in the form of co-payments and out-of-pocket (OOP) payments. Since the majority of specialized and expensive medicines are used in hospital settings, current approximations of pharmaceutical expenditure are likely to gravely underestimate the true costs of medicines for health systems worldwide.
Who pays for the purchase of medicines?
Generally, pharmaceutical expenditure is covered by a mix of public and private funds. Solidarity-based health systems, which represent the most common model in Europe, leverage public funds to ensure access to essential health services, including essential medicines, for their populations. Primarily, this entails coverage via social health insurance models or a national health service, which rely on diverse revenue streams, including forms of taxation, employment and social security contributions (see Chapter 1.1). On average, 58% of pharmaceuticals are funded by government/compulsory schemes (39% are paid OOP and 3% through voluntary health insurance (VHI) schemes (see Chapter 1.3)) across Organisation for Economic Co-operation and Development countries, although there is considerable cross-country variation; at the two ends of the spectrum, over 80% of retail pharmaceuticals are funded publicly in France (83%), Ireland (82%), Germany (81%) and Croatia (80%) and fewer than 40% in Poland (35%), Bulgaria (24%) and Chile (20%) (OECD, 2023).
Although publicly funded and organized systems are designed to provide universal access, financial protection does not necessarily cover all pharmaceuticals, and patients are typically required to cover a part of the expenses for reimbursed (i.e. publicly funded) medicines in the community (i.e. outpatient sector). In countries with more limited progress towards universal health coverage, most medicines (in both outpatient and hospital sectors) are to be paid fully OOP by the patients. This may lead to a high financial burden for patients and their carers and can even result in catastrophic spending.
There are different types of co-payments (e.g. fixed prescription fee, percentage co-payments of the medicine price, and deductibles), with variable effects on the amount paid by the patients, and by the public payer (see Chapter 2.4). In solidarity-based health systems, vulnerable population groups may be fully or partially exempt from co-payments for outpatient reimbursable medicines (Panteli et al., Reference Panteli2016; Vogler, Zimmermann & Haasis, Reference Vogler, Zimmermann and Haasis2018; Vogler, Haasis & Zimmermann, Reference Vogler, Haasis and Zimmermann2021; WHO Regional Office for Europe, 2018). Evidence shows that patients in low- and middle-income countries (LMICs) are more frequently exposed to high OOP payments for pharmaceuticals with over 90% of the 150 million individuals incurring catastrophic health expenditure globally residing in these countries (WHO & IBRD, 2020). Even in the World Health Organization (WHO) European Region, estimates from 24 countriesFootnote 1comprising 18 HICs and six middle-income countries) suggest that up to 9% of households are impoverished and unable to pay for basic needs due to health spending, although large differences are observed among EU countries (estimates ranging between 0.3% to 5.9%) and non-EU countries (estimates ranging between 3.6% to 9.0%) (Thomson, Cylus & Evetovits, Reference Thomson, Cylus and Evetovits2019). Importantly, OOP payments for medicines are a key driver for this catastrophic and impoverishing health spending in Europe (Thomson, Cylus & Evetovits, Reference Thomson, Cylus and Evetovits2019; WHO & IBRD, 2020).
Purchasing medicines: what is covered?
Funding medicines implies compensating the actors in the supply chain for their services related to the product: the pharmaceutical manufacturer for the development, production and launch of the product; importers, wholesalers and other distributors for their logistics services; and pharmacies for services around dispensing the medicine. Usually, in price-regulated settings of solidarity-based systems, these services are remunerated through the different components of the medicine price: the ex-factory price to reward the manufacturer, the wholesale markup for the distributor, and the pharmacy markup for the pharmacy.Footnote 2 The costs attributable to medicines’ distribution can be considerable, but are beyond the scope of this chapter. The following paragraphs discuss which medicines are reimbursed by public payers, and how this is determined.
Which medicines are reimbursed by public payers?
In principle, all medicines that have been granted marketing authorization can be paid for by public payers. In practice, however, to ensure responsible use of public money and eventual sustainability for the health systems, not all medicines are included in public spending. Reimbursed medicines are mainly prescription medicines, but several countries also include at least some nonprescription medicines in their benefit baskets (see Chapter 2.2). In the EU, out of every €4 spent on outpatient medicines, €3 are used to pay for prescription medicines and the rest mainly cover nonprescription medicines (OECD & EU, 2022). In the next few paragraphs, we look at the differences in pharmaceutical benefits baskets across countries and outline the underlying decision-making processes, including those for high-cost novel therapeutics.
In the outpatient sector, selected medicines are included in reimbursement, following an evaluation process as described below. Most European countries apply the concept of a positive list, which compiles medicines that are considered eligible for public funding, whereas negative lists which explicitly specify medicines excluded from reimbursement are rare (WHO Regional Office for Europe, 2018; Vogler, Haasis & Zimmermann, Reference Vogler, Haasis and Zimmermann2019). HICs tend to have large benefit baskets since they usually have more resources they can spend on medicines. In general, medicines that are considered essential are included in public funding. While WHO’s model essential medicines list, which has grown from 208 medicines in 1977 to 460 medicines in 2021 (WHO, n.d.), aims to guide decision-makers in defining which medicines are considered essential, the essential medicines concept has deliberately been designed to be flexible so as to allow consideration of national particularities and priorities. Adjustments to specific situations (e.g. different needs resulting from the country’s geographical area, such as tropical versus Nordic zones) are encouraged. Policy-makers are urged to ensure that essential medicines are “available within the context of functioning health systems at all times, in adequate amounts, in the appropriate dosage forms, with assured quality, and at a price the individual and the community can afford” (Quick et al., Reference Quick2002).
The range of medicines included in reimbursement lists thus varies significantly across countries and regions. For instance, within the EU context, Spain included 21 703 medicines in its reimbursement list in 2020 (including different pharmaceutical forms and dosages) compared to 11 845 medicines in Italy (in 2020), 7399 medicines in Austria (in 2019) and 1733 medicines in Cyprus (in 2020) (Vogler, Reference Vogler2021b; Vogler, Haasis & Zimmermann, Reference Vogler, Haasis and Zimmermann2019; Reference Vogler2020; Zimmermann & Haasis, Reference Zimmermann and Haasis2021). Differences in reimbursement are even more striking in and compared to other central and eastern European countries outside the EU where the number of medicines included in reimbursement lists in 2018 (information provided for the outpatient sector and per active substance) ranged from 460 International Nonproprietary Names (INNs) in Belarus to 399 INNs in Kazakhstan, 148 INNs in Moldova, 50 INNs in Kyrgyzstan and 23 INNs in Ukraine (Vogler et al., Reference Vogler, Haasis and Zimmermann2020).
In addition, public funding may also be provided through additional programmes or funds, outside the regular reimbursement systems (e.g. alternative funding sources, alternative inclusion criteria and processes) to cover specific groups of medicines. In some countries, including some in central Asia, so-called vertical programmes fund medications for diseases such as cancer, diabetes, hepatitis C, HIV/AIDS, tuberculosis (TB) and multiple sclerosis (Vogler et al., Reference Vogler, Haasis and Zimmermann2020). In HICs, dedicated funds offer patients access to medicines with high price tags, such as ATMPs, other cancer medicines and/or medicines for rare/neglected diseases. A well-known example is the English Cancer Drug Fund which finances, for a maximum of two years, cancer medicines which have not yet been deemed as cost-effective. In 2021, the creation of another similar fund called Innovative Medicines Fund for potentially life-saving new treatments (for example, in the areas of spinal muscular atrophy and cystic fibrosis) was announced in the English National Health Service. Since 2017, Italy has been operating two innovation funds (one for innovative cancer medicines and one for innovative non-cancer medicines, each worth €500 million) which were merged into a single fund in 2022 (Vogler, Reference Vogler2022b).
How do public payers decide which medicines to pay for?
Policy-makers leverage a range of policies to ensure that medicines covered by statutory money will be carefully selected (reimbursement policies) and that publicly funded medicines are purchased at affordable prices (pricing and procurement policies) to reduce waste, curb pharmaceutical spending and enable equitable patient access. In practice, there is, to a large extent, interlinkage between reimbursement and pricing policies, since whether or not a medicine is included in public funding frequently also depends on its price.
Criteria that countries in the WHO European Region apply when they decide on the inclusion of medicines in reimbursement comprise the (added) therapeutic benefit of a medicine, medical necessity/priority, safety, cost–effectiveness and budget impact (WHO Regional Office for Europe, 2018). The main tool which supports policy-makers in taking more evidence-based decisions about which medicines to cover is HTA, which is defined as “a multidisciplinary process that uses explicit methods to determine the value of a health technology at different points in its life cycle” (O’Rourke et al., Reference O’Rourke2020) (see Chapter 2.2 for more information on health benefits packages and HTA).
The way in which assessment of pharmaceuticals is built into coverage decision-making varies across countries (Fontrier, Visintin & Kanavos, Reference Fontrier, Visintin and Kanavos2022; Panteli et al., Reference Panteli2016). While most European countries use HTA, or components of it, for reimbursement (and pricing) decisions (37 of 53 countries of the WHO European Region), only some countries (including Denmark, Germany, Norway, Sweden, United Kingdom) apply HTA systematically (Vogler, Reference Vogler2022b). In addition, different assessment methodologies can be applied (Panteli et al., Reference Panteli2016; Robinson, Panteli & Ex, Reference Robinson, Panteli and Ex2019; Emanual et al., Reference Emanuel2020; The Kings Fund, 2020). An outcome of HTA may be that a medicine shows only limited or no added (therapeutic) value. This does not automatically equate to exclusion from reimbursement, but the medicine is usually covered at a lower price. For instance, statutory health insurers in France reimburse new medicines which are deemed to offer no additional clinical benefits at 5–10% lower prices than comparator medicines on the market (Emanuel et al., Reference Emanuel2020). In Australia, both clinical effectiveness and cost–effectiveness considerations play a role. If therapeutic potential is deemed equivalent to standard treatment options, a new medicine is priced to match the least expensive medicine in the medicine comparison group (Emanuel et al., Reference Emanuel2020). When there are high degrees of uncertainty, HTA can result in a recommendation for a conditional reimbursement, or a managed-entry agreement can be put in place (see pricing mechanisms in the How are purchase prices determined? section).
Several European countries also apply such a policy to cluster therapeutically equivalent or similar medicines into a reference group, within which the same amount is reimbursed for all medicines. This can reflect the price of the least expensive medicine within the group or may be calculated based on more complicated processes. If patients wish to access a higher-priced medicine from the same reference group, they must usually cover the difference themselves; thus, this policy, called a reference price system, incentivizes the use of lower-priced alternatives (usually generics) whenever they are available. With such systems, often manufacturers price medicines below or just in line with the chosen reference price limit to ensure their product is covered by the insurance funds and is consequently chosen by health care providers and patients; the majority of these medicines are generics (Robinson, Panteli & Ex, Reference Robinson, Panteli and Ex2019). The underlying idea of including medicines of same or similar therapeutic value within the scope of reimbursement is to enhance competition and thus to offer medicines at affordable prices (for payers and patients). However, it is important that these lower-priced medicines are actually prescribed, dispensed and used; this can be supported by demand-side measures targeted at prescribers (e.g. prescribing by the INN), pharmacists (e.g. generic substitution), and consumers (e.g. financial incentives for requesting lower-priced equivalent in pharmacies, information campaigns to inform and build trust in generic and biosimilar medicines) (Vogler et al., Reference Vogler, Haasis and Zimmermann2021b).
Below, as with R&D, we set out the actual sums of money involved in the purchase of medicines, as well as the share of it paid by patients. We then go on to examine how the purchase prices for medicines are determined, and in particular how public payers decide what they are willing and able to pay, and the resultant national variations in purchase price.
How much money is spent on the purchase of medicines?
Pharmaceutical expenditure is the product of the volume of medicines consumed and their price (Fig. 3.4.1). For comparative purposes, pharmaceutical expenditure is usually expressed in one of three ways: per capita, as a share of national gross domestic product (GDP), or as a component of total health spending. Per capita annual spending for outpatient pharmaceuticals in the EU was estimated at €462 in 2020, with considerable variation detected across Member States (OECD & EU, 2022). At €660 per capita, Germany was the highest spender, while Denmark lay well below the EU average at €258 per capita (see Panteli et al. (Reference Panteli2016) on the relevant context for these figures). In the wider European Region, disparities in spending are even more extreme. Adjusted for purchasing power parity, current expenditure on medical goods ranged from €1281 per capita in Germany to €221 per capita in Moldova in 2020 (WHO, 2020). Lastly, if measured as a share of GDP, pharmaceutical expenditure usually corresponds to current health expenditure (as a share of GDP) times the share of health expenditure spent on outpatient pharmaceuticals, and in the EU ranged from 0.6% (of GDP) in Luxembourg to 2.87% (of GDP) in Greece in 2020 (OECD, n.d.; Panteli et al., Reference Panteli2016). As explained above, there is a lack of data on the costs incurred from hospital pharmaceuticals in health systems and sometimes also from private households, making it challenging to paint a comprehensive picture of total pharmaceutical expenditure. Generally, the share of pharmaceutical expenditure out of total health expenditure tends to correlate negatively with national income level. This is observed in many LMICs, where spending on pharmaceuticals can reach up to 60% of health care spending (Milne & Kaitin, Reference Milne and Kaitin2019). One reason for this is that HICs have a stronger price negotiating power.
At the EU level, 29% of outpatient medicines were financed by private households in 2020 (OECD, 2022), while public expenditure accounted for 70% and VHI for 1% of total expenditure on outpatient pharmaceuticals. The shares of public and private expenditure vary significantly across different Member States, with particularly high public shares observed in Cyprus (85%), Germany (82%) and France (82%) and low shares in Bulgaria (24%), Poland (35%), and Latvia (41%). About half of what is spent OOP by patients in the EU went towards medical goods (including outpatient pharmaceuticals and therapeutic appliances) in 2020 (OECD, n.d.). The comprehensiveness of the benefit basket, the level of prices as well as the type of co-payments impact actual patient expenditure.
Pharmaceutical expenditures are composed of the volume of medicines consumed times their prices
OTC: over the counter; VAT: value-added tax; VHI: voluntary health insurance.

Figure 3.4.1 Long description
The first graphic explains the costs when prescriptions are covered. The individual pharmaceuticals include Ex-factory, Wholesale, Retail, and VAT, which together form the Cost-sharing and Reimbursement price. Only the reimbursement price is multiplied by the Consumption volume, which results in the (Measured) public expenditure. This equals the Rebates (average X percent). The second graphic explains the costs when medications are O T C and not covered. The individual pharmaceuticals include Ex-factory, Wholesale, Retail, and VAT, which together form the Direct payment and V H I. This is multiplied by the Consumption volume to get the (Measured) private expenditure.
How are purchase prices determined?
Pharmaceutical manufacturers frequently argue that it is high R&D costs that render high medicine prices necessary to sustain future investment in innovation. However, evidence suggests that even larger proportion of pharmaceutical company budgets is spent on advertising and stakeholder awareness-raising activities to increase market share in the later stages of the pharmaceutical lifecycle (as mentioned above) and that manufacturer prices are determined based on what the market is willing or likely to bear.
In the US market, total annual spending on advertising and marketing was estimated at $29.9 billion in 2016. Marketing to medical professionals makes up the largest proportion, yet direct-to-consumer advertising has rapidly increased over the past 20 years, making up one third of the total marketing costs in 2016 (Schawartz & Woloshin, Reference Schwartz and Woloshin2019). While direct-to-consumer advertising of prescription medicines is not permitted in Europe, payments to health professionals and organizations advocating for patient rights are common practice and still poorly regulated across many European countries (Fabbri et al., Reference Fabbri2018). Several countries, including the UK, have opted for a self-regulatory mechanism in which pharmaceutical companies disclose financial support provided to health professionals in public databases (e.g. Disclosure UK). This is one of few means to estimate the extent of payments, which amounted to an annual £50 million in 2015 and 2016 in the UK alone (Mulinari & Ozieranski, Reference Mulinari and Ozieranski2018).
Payers employ a range of mechanisms to determine the prices they are willing and able to pay for pharmaceuticals, against the backdrop of balancing necessary considerations of cost containment with the need to retain a healthy R&D pipeline (Box 3.4.6). Approaches include value-based pricing, managed-entry agreements, external reference pricing, internal price referencing and centralized procurement. We explain each of these briefly below.
While most countries only regulate prices for reimbursed medicines, some (e.g. Lithuania, Türkiye) statutorily determine (or negotiate) the prices of all medicines (Vogler, Zimmermann & Haasis, Reference Vogler, Zimmermann and Haasis2018). The rationale for this scope of price regulation is to protect patients from excessive prices even if they pay for their medicines OOP.
Value-based pricing
Increasingly used to determine what health systems are prepared to pay, this approach entails setting medicine prices on the basis of evaluations of clinical and economic benefits. For instance, new medicines with additional benefit compared to available alternatives may be awarded with premium prices (Panteli et al., Reference Panteli2016). Pricing approaches that consider the comparative effectiveness of new medicines struggle with new therapeutics that offer curative options where only symptomatic treatment was available before. A well-known example is that of hepatitis C therapies based on direct-acting antivirals such as sofosbuvir (Sovaldi®), which started entering pharmaceutical markets in 2014. These medicines have evident clinical benefits and improved cost–effectiveness compared to interferon-based treatment, but given their high prices and sizeable target populations, providing access had important budgetary implications for health systems. Indeed, the total cost of treating every patient affected by hepatitis C was estimated to represent a potential threat to the sustainability of national pharmaceutical budgets in many countries (Iyengar et al., Reference Iyengar2016). In order to mitigate the effect on public expenditure, some countries initially restricted access to certain patient groups, but this obviously poses an ethical dilemma in the long run. For ATMPs with the potential to cure complex medical conditions that have so far been treated symptomatically, target populations are usually smaller, but prices for these too have the potential to be so high that the budget impact will be considerable (Gonçalves, Reference Gonçalves2022) (Box 3.4.7).
At a price of around €2 million per dose, Zolgensma® was the most expensive medicine on the market at the time of its launch (Nuijten, Reference Nuijten2022). It is a single-dose gene therapy medication used to treat spinal muscular atrophy in children, a disease which causes life-threatening muscle wasting and weakness leading to a very short life expectancy (EMA, 2021b). After being shown to improve survival and reduce the need for artificial ventilation, Zolgensma® received a conditional marketing authorization from the EMA in 2020 (EMA, 2021b). Due to the rarity of the condition and lack of comparator treatments, most of the studies conducted prior to authorization have been single-arm clinical trials comprising small patient groups, as is the case for many gene therapies. Additional evidence on the therapy’s benefits and risk profile is continuously collected and shared with marketing authorization agencies in an effort to fill remaining knowledge gaps, including on the long-term outcomes and curative potential of this treatment.
Governments worldwide are struggling to balance the potential benefit for these patients with the staggering costs for health systems and concerns for equity. Within Europe, countries have limited access to specific patient age groups and types of spinal muscular atrophy based on the quality of available clinical evidence, while also adopting differing price negotiation and reimbursement approaches to secure access to Zolgensma®. Italy has approved its reimbursement using a “payment at results” contract with payments due at checkpoints of 12, 24, 36 and 48 months of treatment and confidential discounts on the ex-factory price applied for public health facilities and facilities accredited by the Italian national health system (Agenzia Italiana del Farmaco, 2021). Belgium, Ireland and the Netherlands participated in a joint HTA process through the Beneluxa Initiative and subsequently joined forces to negotiate a mutual agreement on pricing in late 2021 (Beneluxa, n.d.; Besley et al., Reference Besley2022).
Managed-entry agreements
Related to value-based pricing are managed-entry agreements. These allow payers to mitigate the risks of purchasing new medicines whose benefits to patients remain highly uncertain by stipulating contractual agreements with manufacturers which set out specific conditions for their reimbursement. Commonly, managed-entry agreements constitute two types of agreement: performance-based (also called outcome-based), whose public funding is conditional on achieving specific health outcomes, or finance-based, which are not subject to these conditions. The scope of managed-entry agreements varies, but they always have confidential features, for instance negotiated discounted prices are always kept secret (Webb et al., Reference Webb2022). This type of agreement is commonly employed in specialties where new pharmaceuticals with limited evidence but high expected value are marketed at high prices, such as oncology, immunology or rheumatology. Performance-based pricing models have been successfully negotiated between payers from several countries and the manufacturers of the first two approved CAR-T cell therapies for treatment of cancer. Although the specific clinical indicators considered are not always disclosed, the reimbursement of CAR-T therapies is conditional on clinical outcomes in several European countries, including France, Germany, Italy, Spain and the United Kingdom; some are also subject to future reassessments based on longer-term follow-up data as part of managed-entry agreements (Jørgensen, Hanna & Kefalas, Reference Jørgensen, Hanna and Kefalas2020).
Although many countries use these agreements, the extent to which they deliver on their promise in different health care systems is still unclear. Evaluations are difficult to perform, given the confidential data that are required (Gerkens et al., Reference Gerkens2017). It is accepted that their administrational burden is considerable. Italy is one of the earliest adopters of performance-based agreements, investing millions of euros into an infrastructure to follow up on real-world outcomes in individual patients treated with expensive medicines, such as acetylcholinesterase inhibitors for Alzheimer’s disease. Despite substantial investment, the Italian system of managed-entry agreements has been shown to be expensive and slow at generating the evidence required to track meaningful clinical outcomes. It is burdensome in practical terms, as health care professionals are exposed to additional administrative tasks, such as filing the required forms on clinical outcomes. Evidence suggests that finance-based agreements have generated some savings in the Italian setting (Dabbous et al., Reference 441Dabbous2020).
External reference pricing
External reference pricing consists of setting the price of a new medicine according to a benchmark determined based on prices charged for the same medicine in other countries (WHO Collaborating Centre for Pharmaceutical Pricing and Reimbursement Policies, n.d.). This approach is commonly applied to new medicines, either as the sole method of determining the maximum price statutory systems will pay or serving as a starting point for negotiating pricing and reimbursement conditions with pharmaceutical companies. For instance, in Norway the maximum price for a new medicine is set by averaging the lowest three prices applied among nine other European countries (Austria, Belgium, Denmark, Finland, Germany, Ireland, Netherlands, Sweden, United Kingdom) (Emanuel et al., Reference Emanuel2020; Weise, Festoy & Hagen, Reference Weise, Festøy and Hagen2018). Several European countries use external reference pricing as the main mechanism for medicine pricing. Others, including Belgium, Finland, Germany, Italy, Poland and Spain, use it as a supportive mechanism (European Commission Directorate-General for Health and Food Safety, et al., 2015; Schneider & Vogler, Reference Schneider, Vogler and Vogler2019; Toumi et al., Reference Toumi2014). The widespread use of this method of pricing incentivizes pharmaceutical manufacturers to keep high the official list prices used for it and then offer confidential discounts on the list price to payers. This creates an overall lack of transparency and concerns that the actual prices paid for pharmaceuticals are not in line with what different health systems can afford (see Webb et al., Reference Webb2022).
Internal price referencing
For pharmaceuticals with one or more therapeutic alternatives already on the market, internal price referencing is applied by several countries (Panteli et al., Reference Panteli2016; WHO Regional Office for Europe, 2018), intended as both a cost containment and competition-stimulating measure. Internal price referencing has two variants: the first features the reference price system in which medicines are classified into a reference group, within which all medicines are reimbursed at the same price by public payers. This can be understood as a reimbursement policy (more than a pricing policy), as described previously. A second type of internal price referencing is exercised in the form of a so-called price link (generic price link or biosimilar price link), by which the price of a generic or a biosimilar medicine is set in relation to the price of the originator or biological originator medicine (WHO Collaborating Centre for Pharmaceutical Pricing and Reimbursement Policies, n.d.). In some countries, price link approaches also affect the price of the originator medicine. Generic and biosimilar price links are used in several European countries (Vogler et al., Reference Vogler, Haasis and Zimmermann2021b).
(Centralized) tendering
The procurement of medicines in the inpatient sector usually involves tendering for competitive offers. In European countries, hospital procurement is conducted by individual hospitals or through group purchasing. However, an increasing number of countries have started to introduce centralized procurement which can take place at national and regional levels (European Health and Digital Executive Agency et al., 2022). Different variants of centralized procurement through tendering can be found in countries such as Denmark, Norway, Portugal or Serbia (Bartels, Reference Bartels2016; Vogler, Bauer & Habimana, Reference Vogler, Bauer and Habimana2022). In 1990, Denmark established the public sector organization Amgros owned by the country’s five regional authorities. Amgros is tasked with procuring all medicines for public hospitals in Denmark. It conducts cost-effective purchasing using different types of tendering contracts to attract bids from diverse suppliers and identifies which expensive medicines to acquire with the support of treatment recommendations issued by another competent body, the Danish Council for the Use of Expensive Hospital Medicines (Bartels, Reference Bartels2016).
A study on public procurement of medicines has shown that countries with strategic approaches in medicines procurement were able to generate lower purchase prices. Their approaches involve applying a mix of policies and procedures such as pooling volumes and capacity (e.g. through centralized procurement and targeted procurement techniques (e.g. framework agreements)) which are aligned to their medicine procurement objectives; awarding the most economically advantageous tender and not the lowest-priced one; multiple-winner bids; and making use of supplementary tools such as HTA or horizon scanning. In addition, procurement can be used strategically to achieve other policy objectives such as security of supply, environmental protection, or crisis preparedness (European Health and Digital Executive Agency et al., 2022). There are also tendering-like procedures in the outpatient sector in a few European countries (e.g. Denmark, Germany, Netherlands) in which reimbursement is granted to the medicine out of a group of comparable medicines (e.g. the same active substances or therapeutic equivalents) for which the lowest price was offered; this is often supported by demand-side measures such as generic substitution. It has also been shown to effectively contain costs (Vogler, Gombocz & Zimmermann, Reference Vogler, Gombocz and Zimmermann2017).
National variations in purchase price
The mix of different mechanisms employed by countries along with factors such as purchasing power and market size contribute to a considerable price variation across health systems globally. For example, studies examining the costs of new hepatitis C medicines based on direct-acting antivirals sofosbuvir (Sovaldi®) and ledipasvir/sofosbuvir (see the Value-based pricing section) show considerable variation in originator prices across countries (e.g. the median list price for a 12-week treatment course was of US$ 40 502 in 2020 with a range from US$ 10 730 in Argentina to US$ 91 461 in Italy (Barber et al., Reference Barber2020).
Evidence suggests that national income levels correlate negatively with prices – at least with official list ones. Although evidence on medicine prices in LMICs remains limited, over the past few years higher prices in LMICs compared to HICs have been documented for the same treatments (Moye-Holz & Vogler, Reference Vogler2022). This pattern is not limited to territories outside Europe, as similar discrepancies have been demonstrated between EU Member States of different income levels (Moye-Holz & Vogler, Reference Vogler2022; Vogler, Vitry & Babar. Reference Vogler, Vitry and Babar2016). This appears to be linked to lower health care budgets and less power to negotiate discounts with manufacturers, who are attracted to markets in wealthy countries amenable to purchasing expensive specialty medicines, such as oncology medicines. Evidence from Latin American countries suggests ineffective or lack of pricing regulation in these countries may result in higher prices in comparison to prices paid in HICs for these products (Moye-Holz & Vogler, Reference Vogler2022).
International price comparisons face a number of methodological challenges (Panteli et al., Reference Panteli2016), not least in terms of meaningfulness of results due to the widespread use of confidential discounts. One of the few studies that has published confidential price data (for cancer medicines) highlighted differences of up to 58% in discounted prices across 15 European countries (van Harten et al., Reference van Harten2016). Countries with large markets such as Italy and Spain are more likely to be granted higher discounts for medicines than other countries, for instance in central and eastern Europe (Vogler, Reference Vogler2021a). Furthermore, there is no explicit and generally accepted definition of what constitutes an “affordable” or a “fair” price for a medicine; this means that while comparisons can highlight differences, they cannot automatically guide policy decisions.
Policy relevance and conclusions
The previous sections have described the financing of pharmaceutical care, focusing on the R&D investment required to create new products and the purchasing process that makes them available to patients. We have also highlighted the challenges budget-constrained health systems face when trying to provide sufficient financial means to stimulate innovation and make the resultant new products available to patients. An ideal pharmaceutical system building on the current model would simultaneously: allow industry to maintain a profit margin to cover the expenses and risks incurred when bringing a new medicine to the market; meet the expectations of shareholders and investors providing the necessary capital for R&D; continuously spur the development of novel medicine candidates attuned to unmet needs; and enable the marketing of effective products that are affordable to public purchasers and accessible to patients. This is easier said than done.
On the side of R&D funding, clear communication of priorities on behalf of health systems and transparent and aligned incentive systems combining push and pull elements as described earlier in the chapter are crucial for addressing the commercial unattractiveness of certain medicines and steering efforts in their direction (see Anderson, Panteli & Mossialos, Reference Anderson, Panteli and Mossialos2023). At the same time, measures to ensure efficiency in R&D practices should be strengthened (Panteli & Edwards, Reference Panteli and Edwards2018). For instance, a large proportion of research on new pharmaceutical candidates is discarded before it is ever published or shared with the scientific community (Glasziou & Chalmers, Reference Glasziou and Chalmers2016). This often causes inconclusive research or negative research findings to be excluded from public databases and official communication channels, and results in substantial duplication and consequent waste of research in the system. According to a Transparimed report from 2017, medical research that is wasted amounts to US$ 170 billion each year (Bruckner, Reference Bruckner2017). Research registration systems and the development of reporting guidelines have started to spur transparent research practices; however, this needs to be further sustained to ensure knowledge generated from research is openly disclosed and fewer resources are wasted in the early stages of the pharmaceutical pipeline. The EU Clinical Trials Regulation, which will be fully implemented after a transition period lasting until 2025, aims to increase transparency of trial information through a new portal and database (Vogler, Reference Vogler2022a). Nondisclosure of R&D costs complicates public payers’ understanding of how to best invest in supporting innovation and the extent to which high pharmaceutical prices are justified. There are many who argue for more explicit ways to account for public “return on investment” for medicines that have been developed with substantial support from public funds (Mazzucato et al., Reference Mazzucato2018; McKee et al., Reference McKee2021; Torreele, Mazzucato & Li, Reference Torreele, Mazzucato and Li2021).
On the spending side, we have shown the high variability across countries and the related impact on equity. Overall, countries with less advanced regulatory systems, lack of HTA capacities, and lower price negotiating power are susceptible to high pharmaceutical expenditure which frequently translates into higher OOP contributions and an elevated financial burden for the general population. However, even where there are well-established pricing and reimbursement systems, payers face acute sustainability concerns, particularly in the light of the increasing number of new medicines with extremely high price tags. Reviewing current payment mechanisms is essential. For example, managed-entry agreements where financial compensation is contingent on the provision of additional evidence on clinical outcomes over time can have direct influence on how the medicine’s price evolves. This can, in theory, relieve the initial costs of medicines, while also ensuring that public money is allocated to medicines with a genuine added value for the patient and the health system involved. However, the evidence on the impacts of managed-entry agreements in terms of actually boosting affordability and access to innovative medicines is still limited (Vogler, Reference Vogler2022b), and their administrative burden is high. External reference pricing, while prevalent, is limited by both the lack of transparency due to confidential discounts and the lack of consideration of the “appropriateness” of referenced prices.
To mitigate these limitations, newer approaches need to be considered and piloted further. A range of different approaches including those which aim to reduce the upfront costs of treatment have already been discussed or tested. For instance, payment models that delink manufacturer revenue from the price and volume of medicines used entail agreements between payers and manufacturers that foresee a regular pre-set payment for (a range of) medicines. This procurement approach is known as the subscription or Netflix model. Such models can be used for costly therapies which should be given to all patients who need them, as in the case of hepatitis C medicines (Dore, 2021; Vogler, Reference Vogler2022b). They can also be suitable for medicines with larger target populations, or where the goal is to retain alternatives but limit unnecessary use (such as in the case of antibiotics, Vogler, Reference Vogler2022b). In this sense, subscription models can also function as pull mechanisms to incentivize manufacturers to engage in R&D efforts for medicines that are needed but would otherwise be financially unattractive (see Anderson, Panteli & Mossialos, Reference Anderson, Panteli and Mossialos2023). Subscription models can be combined with other provisions (e.g. with managed-entry agreements in the case of the hepatitis C in Australia, or updated HTA methodology to assess novel antibiotics in England) to strengthen their effectiveness. However, due to their novelty, evidence on the effectiveness of these models is still limited. Other suggested options entail paying in instalments and reclassifying costs for the procurement of ATMPs as investments rather than current expenditure (Active Citizenship Network, 2022); while these options would potentially improve access, they would not necessarily contribute to the sustainability of health budgets.
Even though their health systems have both important budgetary constraints and less elaborate price regulation options, LMICs have more limited access to new medicines and are exposed to higher prices than HICs. Equity-based tiered pricing is a mechanism that has the potential to mitigate these disparities. Such approaches entail setting differential prices based on countries’ economic abilities to pay for medicines working off a benchmark determined by involved governments. While equity-based tiered pricing could substantially improve access to innovative medicines in LMICs, its effective adoption requires careful design and, most importantly, solidarity and political will from leaders in HICs (Nemeth et al., Reference Nemeth2022). A further prerequisite is the reconsideration of the current practice of confidential discounts: an equity-based official price for a HIC that gets an ex post discount to a level below the equity-based price for a lower-income country would defeat the purpose of the initiative.
Strengthening cross-country collaboration in general is another potential avenue for improving access to innovative medicines. Collaborative approaches and pooling scientific expertise and negotiation capacities can reduce the number of resources that individual countries must invest. At the same time, this can create economies of scale and strengthen smaller and/or lower-income countries’ abilities to access pharmaceutical products at affordable prices. In recent years, several voluntary collaborations between governments in different geographical constellations have emerged, such as the Beneluxa Initiative, the Nordic Pharmaceutical Forum or the Valletta Declaration. Within these initiatives, countries aim to collaborate on a range of activities, including joint horizon scanning activities, HTA, joint pricing negotiations with industry and, in some cases, joint procurement of medicines (WHO Regional Office for Europe, 2020). Due to differences in national legal and organizational policy frameworks and the need for new working structures and governance processes, such collaborations can be resource-intensive and challenging, particularly at the start. As such, the success of joint negotiations and procurements is not guaranteed (WHO Regional Office for Europe, 2020). Nevertheless, there are some first positive outcomes of joint tenders and negotiations (Vogler, Haasis & Zimmermann, Reference Vogler, Haasis and Zimmermann2021). The potential of joint purchasing initiatives at the EU level was demonstrated by the procurement of over 4 billion COVID-19 vaccines on behalf of all Member States (European Commission, 2022b) as well as COVID-19 therapeutics (European Commission, 2022a). This EU experience also demonstrated the importance of the design of such mechanisms, as the advance purchase agreements for vaccines were considered less constrained by unilateral priorities compared to tenders under the Joint Procurement Agreement. Furthermore, EU-level collaboration on HTA has been ongoing for many years and was cemented in the 2021 Health Technology Agreement Regulation which foresees joint assessments for new medicines starting in 2025. Next to the described benefits for payers, streamlining HTA, pricing negotiations and procurement can also benefit industry by simplifying the processes involved and accelerating the entry of novel therapies to markets.
Finally, strengthening the preparedness and improving the transparency of the pharmaceutical system can have important benefits for equitable and affordable access to medicines. Horizon scanning activities entail active collection of information on medicines (and other health technologies) in development to enable and facilitate priority-setting and long-term planning and shape pricing and reimbursement decisions. Few countries in the WHO European Region have introduced horizon scanning systems at the national level (Vogler, Reference Vogler2022c), though collaborative approaches like the International Horizon Scanning Initiative are starting to operate (Vogler, Reference Vogler2022b). The lack of transparency around pharmaceutical prices discussed in this chapter contributes to inequities and reduces accountability and trust; however, evidence on the potential effects of introducing measures to improve price transparency is very limited. Efforts to establish platforms for exchanging price information, such as the European Integrated Price Information Database (EURIPID), and clearing-house approaches demonstrate potential for further expansion and consideration, respectively. Similarly, clearing houses managed by trusted third-party actors may be best suited to collect pricing information anonymously from payers, including details on confidential discounts (Webb et al., Reference Webb2022).
The selection of policy actions described in this section is by no means exhaustive. No single one of the approaches is a magic remedy to the complex issues emerging in the pharmaceutical and innovation sector if implemented on its own. Payers at different levels need to consider these options according to their context, and cross-country collaboration can strengthen action to address these global issues with local specificities.Footnote 3
Key messages
Chapter 3.5 reflects on how to use payment mechanisms to support the integration of care. Integrated care is about better management of the care patients receive in different settings (primary, secondary) and from different specialists and teams. It is particularly important for patients with multimorbidity and chronic long-term needs, and as populations age. Key learning includes that:
Health systems’ payment models can play an important role in incentivizing integrated care.
Purchasers are now testing innovative payment models (e.g. pay for coordination (P4C)) which explore how to foster better coordination. These models include:
○ bundling payments to single providers so that the multiple services a patient uses are better linked; and
○ bundling payments for patients being treated by multiple providers, creating joint budget responsibility and a need to work together and avoid duplication.
Policy-makers would do well to focus on careful design of information systems to underpin payment schemes because:
○ information sharing supports clinical effectiveness;
○ quality indicators allow purchasers to tie bonuses or penalties to integration and guard against inappropriate cost-cutting;
○ monitoring activity and health outcomes helps assess value for money;
○ tracking the distributional consequences of incentive schemes is crucial in protecting equity;
○ robust evaluation alongside payment reform allow immediate lessons to be shared and will capture changes over time and across the health care system.
Health systems need to embed financial incentives as part of a broader system approach. Critical elements include:
○ committed leadership;
○ effective communication among providers;
○ structural integration, either through coordinating mechanisms that link provider roles or by the formation of new entities with single management teams.
Introduction
In this introduction, we set out the need for integrated care, and the role that payment models might play in delivering it. Across high-income countries (HICs), the increased burden of chronic disease associated with rising life expectancy has led to a call for health systems to extend their focus beyond the treatment of acute illnesses to the provision of long-term care (LTC) for patients who may require inputs from primary, secondary and social/community care providers (OECD, 2016; WHO, 2015). The growing prevalence of individuals with multiple chronic diseases (multimorbidity) increasingly requires models of care delivery that focus on the multiple care needs of the patient rather than separate treatment of single diseases. Indeed, without action, the increasing burden of multimorbidity poses a fundamental challenge to the sustainability of health systems worldwide (Bloom et al., Reference Bloom2012; European Commission, 2011; Nolte & Pitchforth, Reference Nolte and Pitchforth2014).
There is a broad consensus that this rising need for care inputs from multiple providers and the fundamental concerns for the long-term sustainability of health systems require the provision of care that is better coordinated and less fragmented – commonly referred to as integrated care.
Definition of integrated care
Using Struckmann and colleagues’ (Reference Struckmann2018) definition, integrated care can be understood as:
structured efforts to provide coordinated, proactive, person-centred, multidisciplinary care by two or more communicating and collaborating care providers. Providers may work at the same organization or different organizations, either within the health care sector or across the health care, social care, or community care sectors (including informal care).
This definition encompasses both a system and a patient perspective, where integrated services are those that are experienced by the patient as coordinated (Goodwin, Reference Goodwin2016).
The goal of care integration can be achieved through multiple means – of which payments, the focus of this chapter, are one. According to Poku, Kagan and Yehia (Reference Poku, Kagan and Yehia2019), there is an inverse relationship between care that is truly integrated and the need for care coordination: the more integrated care services are, the less need there is for coordination. The delivery of integrated care may, but need not, involve the formation of new vertically integrated organizations and it is important to note that organizational integration does not automatically solve the need for internal coordination (Williamson, Reference Williamson2002).
The role of payment models
In the same way that health systems may require reform to meet the changing needs of the population, there is a need for new payment methods that better align with current policy goals (Leijten et al., Reference Leijten2018; Struckmann et al., Reference Struckmann2017). This chapter discusses payment models that can support the delivery of integrated care by non-integrated organizations, as well as models intended to incentivize the delivery of integrated care by vertically integrated organizations. The current ways of paying for primary and secondary care (Box 3.5.1) do not fit well with the provision of integrated care. For example, fee-for-service (FFS) and prospective payments based on diagnosis-related groups (DRGs) are based on activity, and primarily incentivize a high throughput of discrete units of care, rather than a long-term, well-coordinated, holistic care effort that ensures quality and cost–effectiveness for the chronically ill and multimorbid across the spectrum of care (Busse & Mays, Reference Busse, Mays, Nolte and McKee2008).
There are three main payment mechanisms for physicians (i.e. general practitioners (GPs), ambulatory specialists):
1. FFS: each individual service (unit of care) provided is reimbursed.
2. Capitation payment: providers receive a fixed amount for providing services to a patient (e.g. per registered patient on a practice list) for a specified period of time, regardless of the volume of services consumed by individual patients.
3. Salary: a payment per time period that depends on the characteristics of the physician, e.g. their years of experience or position in the hierarchy. Salaries are administratively simple but provide limited incentives for productivity (Rechel, Maresso & van Ginneken, Reference Rechel, Maresso and van Ginneken2019).
There are also three main payment mechanisms in hospitals:
1. Global budgets: a type of broad capitation in which a provider, typically a hospital, is paid a fixed amount, based on hospital characteristics or expected activity.
2. DRG case payment systems: hospitals are paid a fixed amount of money per inpatient stay depending on the characteristics of the patient and the treatment provided.
3. Per diem fees: payments per day of an inpatient’s stay (Bell, Charlesworth & Lewis, Reference Bell, Charlesworth and Lewis2021; Rechel, Maresso & van Ginneken, Reference Rechel, Maresso and van Ginneken2019).
The payment mechanisms may be used in combination.
The redesign of payment models to enable more efficient care for patients with one or more chronic diseases requires providers to recognize the interdependency of care delivered across multiple sectors. Although this goal cannot be met by changes to the payment system alone, it is clear that most existing payment models are designed with a single sector in mind, and do not encourage providers to better coordinate their care or consider the implications of care in one sector on the expected cost and benefits of care in other sectors (Mason et al., Reference Mason2015). Although more than 100 integrated care programmes for people with multimorbidity have been implemented in Europe, these challenges are rarely addressed by new innovative payment methods (Struckmann et al., Reference Struckmann2017). However, such methods do exist and are worthy of consideration, as we shall show in what follows.
We begin by outlining a set of criteria by which we can benchmark payment models with respect to their ability to meet the policy goal of greater care integration across sectors; we provide a comparative example to illustrate the need for system change. We then use the criteria to examine traditional provider payment models and their failure to meet the health system challenges of today. Next, we consider the options available for policy-makers looking for new payment models that can encourage integrated care, and the models’ potential to incentivize integrated care, in theory and in practice, including three case studies, from Germany, the Netherlands and the USA, respectively. Finally, we draw policy lessons from the foregoing and highlight where the evidence base still needs further strengthening.
Setting performance objectives for incentives for integrated care
We begin by defining the challenges a payment model needs to address with respect to integration, and the criteria by which its performance should be measured. When providing integrated care, to achieve system-level efficiency from the perspective of a third-party payer, the interconnectivity of care and needs across sectors is a priority. Likewise, the definition of quality has evolved from a narrow focus on clinical processes and outcomes to incorporate patient-reported outcomes and health-related quality of life. At the same time, the increasing prevalence of an ageing and multimorbid patient population means that the care inputs needed from across the system have changed, and therefore the requirements for payment models also need reformulating.
The so-called triple aim of improving patients’ experience of care, improving population health and reducing per capita costs of care (Berwick, Nolan & Whittington, Reference Berwick, Nolan and Whittington2008) is often proposed as the target for efforts to integrate care. The implications from the perspective of payment model design are that provider payment methods should create incentives for health care providers to internalize the impact their care decisions have on (i) patients’ future care needs; and (ii) the expected costs and benefits incurred and delivered by other health care providers. The key requirements for payment mechanisms that are specific to integrated care are therefore:
internalization of the impact of current care on future care needs/costs in the same sector;
internalization of the impact of current care on current and future care needs/costs in other sectors;
delivering care in the most efficient setting and without duplication.
Payment models that meet these requirements will help achieve the stated triple aim of higher levels of patient satisfaction, better population health and lower per capita costs. In what follows, we use these three requirements as a measuring rod for both traditional payment methods and the emerging alternative payment models.
First, though, we underline the need for change with a comparative example. If a patient develops acute appendicitis, the key objectives from a health system perspective are that the patient is treated quickly, cost-effectively and receives good quality care with a minimum of complications and a minimum need for post-treatment care. There is no uncertainty about where the patient is best treated, whether the patient will need care from multiple sectors, or what the impact on future care needs may be. The traditional health system goals of appropriate activity, quality and efficiency are therefore adequate to set requirements for and evaluate the effectiveness of the payment model. Likewise, traditional activity-based payment methods, possibly with an adjustment to incentivize quality in the delivery, are adequate to support these goals.
In comparison, for a patient with one or more chronic diseases, such as diabetes or chronic obstructive pulmonary disease (COPD), the picture is less clear. There is likely expertise available in both primary and secondary care that could treat the patient, and depending on the severity of the condition, there might also be a need for inputs from social care. Considered in isolation, these care needs could potentially be supported by traditional payment methods. However, the chronic nature of the condition means that care for the patient will be needed throughout the patient’s remaining lifetime. Therefore, there is a need to incentivize the performance of each care activity with the impact on future care needs (and costs) in mind.
In addition, it is necessary for each sector to recognize that the care delivered in one sector affects the need for care in others. The typical example is “avoidable” emergency admissions. With the appropriate levels of ambulatory and social care, it is believed that acute emergency admissions can be avoided. Clarity about how emergency hospital visits might be avoided is critical, however, whether clinically unnecessary, clinically divertible or clinically preventable (Parkinson et al., Reference Parkinson2021). Nonetheless, the potential for improvements in primary care quality and scope to reduce emergency hospital visits should not be overestimated (Parkinson et al., Reference Parkinson2020).
Why traditional payment methods fail to support integration
Traditional payment methods such as cost-reimbursement, global budgets, capitation, FFS or activity-based payment based on DRGs do not encourage providers to take care interdependency into account (see Box 3.5.1).
FFS and DRG payments
FFS payments are mostly used in primary or ambulatory care and involve paying for each service unit provided. The fee level usually relates to the type and complexity of the provided service. This generally gives providers the financial incentive to provide as many reimbursable services as possible (Busse & Mays, Reference Busse, Mays, Nolte and McKee2008; Gosden et al., Reference Gosden2000). Therefore, FFS systems may stimulate inappropriate or unnecessary use of services and offer little or no incentive for (macro level) expenditure control (Ellis & Miller, Reference Ellis, Miller and Heggenhougen2008). Particularly for patients living with multiple chronic conditions, this may result in having to make more doctor visits with a greater number of doctors, which could also have repercussions on the quality of the care they receive (Rijken et al., 2017).
DRG-based case payments are frequently used in hospitals. If based on average costs, they provide strong incentives for efficiency (Shleifer, Reference Shleifer1985), but bring the same challenges as FFS payments and equally come with the risk of disregarding patient needs and appropriateness of care (Busse et al., Reference Busse2011).
With regard to care integration, neither FFS nor DRG-based payments offer providers incentives to coordinate care or consider in which setting care will be provided with greater efficiency as this could lower the number of reimbursable services/episodes (Struckmann et al., Reference Struckmann2017).
Global budgets and capitation payments
Global budgets and capitation payments involve paying providers a fixed amount to provide services to patients for a particular time, regardless of the volume of services provided to individual patients. Both payment methods are administratively simple and control macro level expenditure well but they create few financial incentives for providing care proactively and therefore do not incentivize figuring in the expected impact of care on future care needs. Providers may respond by providing as little care as possible to each patient (care-skimping) as the providers bear the financial risk. This in turn may create the potential for undersupply of services, lower quality of service provided, increased referrals and the adverse selection of low-risk patients (Busse & Mays, Reference Busse, Mays, Nolte and McKee2008; Ellis & Miller, Reference Ellis, Miller and Heggenhougen2008; Nolte & Knai, Reference Nolte and Knai2015). The latter particularly threatens access to appropriate care for people with multiple chronic diseases.
Traditional payment models’ inadequacy: summary
In practice, most countries have implemented combinations of these payment methods (blended payments) based on different types of information (about the service, the provider or the patient) in order to mitigate the adverse incentives of the methods individually and create a more balanced set of incentives.
Generally, these payment mechanisms do not sustain a LTC effort, are focused on a single specialty or sector, and do not recognize the interdependency of care delivered across the care spectrum. This particularly affects the appropriateness and quality of care for patients with multiple chronic diseases. In terms of factoring in the impact of care on future needs and therefore costs, only capitation and global budgets give some incentive for reducing future care needs, but only in the same sector and within the current budget period. Providers paid by FFS and DRG could even be seen to benefit financially from maintaining or increasing patients’ future care needs, although altruistic provider motives would be expected to limit the extent of perverse responses to these incentives.
In addition to incentivizing the goals for integrating care, payment models should also support, or at least not work against, other policy goals such as access to care, equality and transparency/accountability, and avoidance of unintended consequences. One of the important benefits of basing payments on provider activity has been that it gives purchasers and regulators access to clear information about activity in the health sectors. If new payment models move away from being activity based, it is important to ensure that information of similar richness and accuracy can still be obtained – a point to bear in mind, when considering new, alternative models.
Paying for integrated care: what are the alternative models?
As the focus on integrated care has increased, a range of new payment methods to support care integration are being considered. Below we present the options available to health systems wishing to deliver better integrated care. These range from simple add-on payments to support coordination and integration for individual providers of primary, secondary or social care that are not organizationally integrated, to models that require financial integration, whether via a new integrated care organization formed vertically or horizontally by care providers, or by individual care providers assuming joint financial responsibility.
Struckmann et al. (Reference Struckmann2017) provided a summary of various options for the adjustment of traditional payment models, illustrating that existing payment mechanisms can be adjusted to promote coordination and ultimately integration of care. That summary formed the starting point for the framework we present in Table 3.5.1 and the alternative payment models we set out below. We look briefly at P4C then in more detail at bundled payment schemes and the different means of financial integration when payments are bundled, in particular the shared-savings model. We also examine how the payment mechanisms can be adjusted to ensure quality of care.

DRG: diagnosis-related group; FFS: fee for service; P4 C: pay for coordination.
Table 3.5.1 Long description
The table has 4 columns: Basis of payment, Provider, Patient or population, and Service. It reads as follows. Traditional payment method: Provider: Global budgets or salary. Patient or population: Capitation. Service: F F S or D R Gs.
Next comes Incentivizing coordination through to incentivizing integration. First, near incentivizing coordination comes P 4 C. Provider: Budgets for multidisciplinary teams (for example, case manager). Patient or population: Higher capitations for providers with multidisciplinary teams. Service: P 4 C activities (for example, case review, documentation, participation in meetings).
Next is Bundled payments to one provider. Patient or population: Bundled payment per patient in target population for multiple providers. Service: Bundled payment for multiple services performed by one provider.
Next is Financial integration. Provider: Pooled budgets or shared savings for (joint budget responsibility between multiple providers). Patient or population: Bundled payment per patient in target population for multiple providers. Service: Bundled payment for multiple services performed by multiple providers. Next, near Incentivizing integration comes Organizational integration (horizontal or vertical mergers) and New organizational forms, for example accountable care organization.
Finally, Supplementary incentives: Providers: Bonus or penalty in relation to meeting structural quality indicators. Patient or population: Bonus or penalty in relation to risk-adjusted mortality, readmissions, complications or patient satisfaction. Service: Bonus or penalty for proportion of patients treated in line with guidelines. Finally, Monitoring structural, process or outcome quality.
P4C
At the most basic level, existing payment methods can be adjusted to promote better coordination of care with a payment type known as P4C (Tsiachristas et al., Reference Tsiachristas2013). The adjustment can be made by: (i) adjusting the care provider’s budget to cover; for example, the cost of employing a case manager tasked with ensuring coordinated care; (ii) increasing capitation payments for each registered patient with a provider that employs case managers or multidisciplinary teams; or (iii) providing additional fees for coordination activities such as case review and participation in meetings. Combinations of the three are also possible.
Bundled payments
Bundled payments is the term used for payments covering more than one episode of care for the same patient. As shown by Stokes and colleagues (Reference Stokes2018), what is included in the care bundle can vary greatly, from payments covering all episodes of care for a given condition from a single provider to payments covering all care for a patient from multiple providers.
The effect of a bundled payment on care integration depends on the exact scope of the payment in terms of the target population, time perspective, how many sectors are included, how many providers are covered, the number of diseases/activities covered for the population, supporting levers in the form of quality measurement, the proportion of income affected and whether there is additional financial integration or risk sharing in place (Stokes et al., Reference Stokes2018). Fig. 3.5.1 gives an example of how three existing bundled payment systems vary on these dimensions, two from the Netherlands (for diabetes and elderly care, respectively) and one from the USA (Medicare BCPI).
Three bundled payment schemes and how they vary on key dimensions

In general, the broader the scope of the payment, the greater the incentive for integration of care but also the greater the financial risk transferred to the provider (Struckmann et al., Reference Struckmann2017). Therefore, the introduction of a bundled payment model must always consider the existing provision structure and the availability of suitable contractors to accept the financial risks involved with the introduction of bundled payments.
When the payment bundle covers more than one provider, the contractual arrangement required increases in complexity as the mechanism necessitates financial integration between the two or more providers who become jointly responsible for the care of a patient. Such arrangements are much harder to implement than P4C because they require changes that go beyond simply modifying the payment system and imply a transfer of financial risk from the payer(s) to the provider(s). The multiple providers may be from within the same sector (e.g. primary care) or across sectors (e.g. primary and secondary care providers). They may choose to form a new integrated care provision organization, often referred to as an accountable care organization (ACO). But even without forming a new organization, multiple providers can assume joint financial responsibility.
A review by Mason and colleagues (Reference Mason2015) identified eight types of financial integration, including: (i) transfer payments and cross-charging, where one provider either makes contributions to or pays fees to compensate the other entity; (ii) pooled funds, where multiple providers contribute to a common fund that can be spent on shared patients; and (iii) structural integration, where a new entity is formed with a single management team.
The difference to the add-on payment methods previously discussed is that financial integration offers a greater incentive to providers to recognize their joint impact on patient outcomes, by creating a financial interdependency between providers across sectors and assuming a mutual financial risk.
Theoretically, the broadest bundled payment would cover all care provided to all patients living in an area over a defined period of time. However, this type of payment would be usually called a broad capitation payment or a population-based budget. This implies that the question of how to pay providers and how to assure coordination of care is simply transferred from the purchaser to another organization, which then becomes the payer for individual providers (Struckmann et al., Reference Struckmann2017). In this situation, purchasers arguably have less capacity to act as strategic purchasers and influence service provision without supporting collection of information about activity and quality, and care provision under such a payment bundle becomes opaque for the payer and the public.
Shared-savings model
One of the most common models of financial integration designed to promote integrated care is shared-savings. In this model, participating providers agree to cooperate in a network and to collaborate with the aim of achieving joint savings for the care provided to participating patients. If such savings are made, a share is distributed to providers. Of course, the providers, patients and services eligible for participation in the programme have to be explicitly defined before the start of the programme (Hayen et al., Reference Hayen2015). Within the model, each individual provider continues to be paid according to the established payment system, but all costs for patients participating in the integrated care programme are registered and retrospectively compared to previous figures or a benchmark set to ensure that random fluctuations are not rewarded or punished. The payer is thus able to determine if any savings have been made, a share of which can then be shared among the collaborating providers.
Usually, shared-savings models require a new organizational structure to coordinate the roles of the participating providers, (re)distribute savings between them, help with the coordination of care, and facilitate the development of joint clinical pathways or joint electronic medical records. The (re)distribution mechanism is very important as it may well determine the success of the programme and the extent to which all providers gain from the reorganization of care (Struckmann et al., Reference Struckmann2017). Payers will likely want to specify reporting requirements about activity and quality to ensure transparency.
Ensuring quality of care
Finally, payment systems can be adjusted to incorporate incentives for quality. This is often called pay for performance (P4P) or pay for quality (P4Q) and can be based on structures, processes and/or outcomes (Donabedian, Reference Donabedian1988; McManus et al., Reference McManus2021). P4P can be used to achieve agreed quality targets, for which payment to providers (professionals or institutions) is modified upwards or downwards. Within a provider network, target achievements can be recorded electronically and compared among participating providers, for example, with respect to patient experience (Struckmann et al., Reference Struckmann2017).
Measuring and incentivizing quality of care is particularly important when payments allow providers to interpret patients’ care needs broadly, as is the case with shared-savings models, bundled payments and capitation payments made to integrated care structures. This is because broader payments provide larger incentives and room for providers to reduce costs – and, in the absence of adequate mechanisms to monitor and reward quality, providers may attempt to cut costs by reducing the provision of services, disregarding patient needs and providing lower quality care.
Table 3.5.1 also provides examples of these monitoring and rewarding mechanisms. For example, providers could be given penalties or bonuses for having appropriate structures in place for the care of people with chronic diseases (e.g. employing personnel with special training in multimorbidity, case managers) calculated as a percentage of their usual income. Furthermore, bonuses could be given for achieved outcomes of care (e.g. lower than average rates of mortality or hospital admissions, high patient satisfaction). Lastly, providers could receive a bonus if care is delivered in line with recommended treatment pathways and guidelines (e.g. if they perform a biannual polypharmacy review) (Struckmann et al., Reference Struckmann2017).
Designing appropriate P4P programmes is a complicated task because of the many issues surrounding the measurement of quality (e.g. which indicators to use and how), the definition of targets (e.g. absolute targets or relative targets), the level of the payment adjustment (e.g. individuals, groups, institutions), the form of the incentive (bonus or penalty), the use of risk adjustment and so on (Eijkenaar, Reference Eijkenaar2013).
How the new payment models incentivize integrated care: in theory
P4C is the least likely to incentivize providers to figure in the temporal and cross-sectoral consequences of their care, and thus lead to cost-effective care across the pathway. This is because the coordination payment is simply an add-on payment intended to incentivize providers to engage in a coordinating process, but other than signalling the need to coordinate to the provider, it does not give the provider a financial incentive to do so. Moreover, coordination effort is difficult to make contractible because the details of what is needed will vary greatly from patient to patient. It is also difficult to monitor compliance (Kristensen, Bech & Lauridsen, Reference Kristensen, Bech and Lauridsen2016), and there is no incentive for providing cost-effective care across the pathway.
Bundled payments are in principle able to incentivize the figuring in of the impact of current care on future needs in the same sector and the impact of care needs in other sectors, but it is difficult to imagine a cross-sector blended payment without a joint organization or a collaboration between providers from different sectors. To deliver care in the most efficient setting would likely require some form of financial integration.
For example, cross-charging could be used to incentivize the figuring in of care in one sector on care need in other sectors. However, as financial integration moves towards organizational integration, there is a risk of recreating the coordination problems facing payers/purchasers. Joining up entities from across sectors does not guarantee that the coordination problem goes away (Williamson, Reference Williamson2002). In fact, by removing the explicit transaction from the equation, new internal coordination problems may arise (Struckmann et al., Reference Struckmann2017) and benefits from specialization may be lost (Baicker & Chandra, Reference Baicker and Chandra2004, cited in Mason et al., Reference Mason2015) and the payer has effectively transferred the question of how to ensure coordination of care to the providers. In addition, larger budgets across more complex organizations are less transparent and may be more difficult to monitor and control.
Thus, from a theoretical perspective, financial integration without organizational integration (for example, in the form of shared-savings) may be thought to have the greatest likelihood of achieving the goals of integrated care but require careful incentive design which in itself is a complex task.
How the new payment models incentivize integrated care: in practice
Overall, the empirical literature on payments for care integration does not provide very strong evidence that introducing financial incentives alone will incentivize integrated care. On a side note, the same can be said about integrated care interventions in general (Kumpunen et al., Reference Kumpunen2020). This raises a general point about the literature on the effectiveness of payments for care integration – that it is rare to have evidence on interventions that changed the payment system only. Most often, the changes to provider payments are part of a larger system change to stimulate care integration. It can therefore be difficult to separate out the impact of the changes to payment mechanisms from other changes to the organization of care occurring at the same time.
Because the specific payment mechanisms to support integrated care differ widely, the challenge for the literature in terms of condensing the empirical evidence is similar to that facing the literature on P4P (which is another example of an intervention that is not as uniform as the name would suggest). One study that does try to generate generalizable knowledge is Tsiachristas et al. (Reference Tsiachristas2015). The authors used longitudinal variation across 25 countries from 1996 to 2013 to examine the impact of national payment schemes to support integration classified as either P4P, P4C or bundled payments. Nine countries introduced at least one of the three payment schemes to incentivize care integration. The authors examined the impact on total health care expenditure, and outpatient care, hospital care, medication and administration expenses individually. They found that introducing P4C and bundled payments was associated with reductions in outpatient care expenditure, while P4P was associated with reductions in hospital and administration expenditure.
Hayes and colleagues (Reference Hayes, Stokes, Kristensen and Sutton2021) used a similar approach to examine the impact on health and health care utilization, analysing patient-reported data from 20 countries from 2011 to 2015; eight countries introduced payments for integration, with a particular focus on the impact of payment reform on patients with multiple chronic conditions. The health outcomes examined were self-assessed health, limitations to day-to-day living and quality of life. To measure health care utilization, the authors focused on the total number of times respondents had seen or talked to a medical doctor in the past 12 months, the total number of GP contacts (a subset of the previous variable) and the proportion of GP contacts in relation to overall doctor contacts. The authors found that in countries that introduced P4C, multimorbid patients had proportionately more contacts with a GP, suggesting a shift to the primary care level where this payment method was introduced. In countries that introduced bundled payments, there was a relative increase in the number of times multimorbid patients were in contact with a doctor in comparison to patients who were not multimorbid. For both payment schemes, there was no measurable differential impact on health outcomes for multimorbid patients associated with the change. In countries that introduced P4P, multimorbid patients experienced a relative decrease in quality of life and greater limitations to their day-to-day living than other patients, while no measurable changes were detected in their pattern of care seeking.
When interpreting the findings from the studies by Tsiachristas et al. (Reference Tsiachristas2015) and Hayes et al. (Reference Hayes, Stokes, Kristensen and Sutton2020), it should be kept in mind that they both group specific national payment schemes under broader headings, at the cost of reducing potentially important institutional differences across countries. On the other hand, this is a common issue in empirical work and, if nothing else, the results can point interested policy-makers and practitioners in the direction of payment changes that were effective in their respective settings, and dive into detail that might need translation to their own context.
A review of integration of funds for health and social care (Mason et al., Reference Mason2015) looked at 38 examples of financial integration from eight countries. Out of 34 studies that evaluated the impact of financial integration on health care costs and utilization, only three found a reduction in the cost or use of care, while the remaining 31 either found no, mixed or negative results (greater care use or costs after financial integration). Twenty-four studies examined the impact on patients’ health and, here, just five found an improvement, and half of the studies found no effect at all. The authors found that the primary barrier for integration was practical challenges in communicating and exchanging information across sectors. One lesson from this review is therefore that it often takes more than financial integration to integrate care.
Case study 1: Bundled payment scheme for chronic diseases, Netherlands
A pilot of this bundled payment scheme with a focus on diabetes care began in 2007 and the scheme was fully operational from 2010. The scheme is voluntary, and allows health care providers to form care groups consisting of multiple providers that take joint clinical and financial responsibility for the patients covered by the scheme; for example, patients with diabetes, COPD or vascular disease. Participating care groups receive a fixed payment to cover disease-specific care, while other care is still reimbursed separately. The amount is set through negotiation between the payer and the care group. The group participants can then either provide care for patients themselves or subcontract to other providers (Llano, Reference Llano2013). The aim of the scheme is to improve the quality of care, and the contracts specify the care process and outcome quality standards of care that providers must adhere to under the scheme.
An evaluation by the Dutch National Institute for Public Health and the Environment (Struijs et al., Reference Struijs2012) found modest improvements in most process indicators of quality, including foot examinations, kidney function testing and cholesterol testing, while numbers of eye examination declined. Nevertheless, the variation in the quality of care between care groups was considerable. It should be noted, however, that the analysis did not use a control group, and it is therefore possible that the improvements in process quality would have occurred in the absence of the payment change regardless. We have not been able to locate stronger or more recent empirical evidence on the impact of the Dutch bundled payments on the quality of care.
Early empirical evidence suggested that expenditure increased in the short run for patients covered by the scheme (Mohnen, Baan & Struijs, Reference Mohnen, Baan and Struijs2015) and a recent study (Karimi et al., Reference Karimi, Tsiachristas, Looman, Stokes, Galen and Mölken M2021) confirmed that this was also the result in the long run. According to a recent evidence scan (Struijs et al., Reference Struijs2020) the Dutch bundled payment scheme seems to be an outlier in this respect. Summarizing evidence on 11 bundled payment models, the authors found modest savings or modest reductions in spending growth reported in 20 of 32 studies; 18 of the studies reported quality improvements.
Case study 2: Medicare Shared Savings Program, USA
The Medicare Shared Savings Program is a voluntary scheme that enables health care providers (e.g. hospitals and/or primary care physicians (PCPs)) to form ACOs which take population responsibility for the quality, costs and care of their patient population (CMS, 2021). Launched in 2012, the scheme offers participating ACOs a menu of risk-sharing contracts between Medicare and the ACO. ACOs taking on larger financial risk may also receive greater shares of the savings. A one-sided option is the most popular, where only savings – not losses – are shared; this option was taken up by 99% of the participating ACOs in 2015 (McWilliams et al., Reference McWilliams2018). The participating providers are paid by FFS. A prerequisite for accessing the shared savings is that the quality of care meets agreed performance standards. In addition, only savings above a certain level, known as the minimum savings rate, qualify for sharing. As pointed out by Pope and Kautter (Reference Pope and Kautter2012), the minimum savings requirement can be seen as an attempt by Medicare to distinguish random variation in expenditure from expenditure reductions due to the ACO’s “true” cost-control effort.
An evaluation by McWilliams and colleagues (Reference McWilliams2016) after the first year of the programme found that in the 32 participating ACOs spending per beneficiary was about 1% lower for beneficiaries enrolled in an ACO participating in the Medicare Shared Savings Program. ACOs with higher baseline spending generated larger savings, but there was no difference in the savings generated by ACOs whose providers integrated financially, compared with those that did not. In a follow-up study, McWilliams et al. (Reference McWilliams2018) found that shared-savings contracts entered into by groups of PCPs were on average associated with greater savings, and that the savings were higher the longer the groups had been participating in the scheme. The spending reductions generated by physician ACOs in 2015 amounted to US$ 256 million in net savings to Medicare, the payer. Hospital-integrated ACOs, which have weaker incentives to generate savings due to the implications for other revenue streams not covered by the ACO contract, did not on average generate statistically significant spending reductions, and the reductions that were generated were offset by bonus payments. Subsequently, concern about whether savings had been generated by providers selecting patients with lower risk was not supported by empirical evidence (McWilliams et al., Reference McWilliams2020).
Case study 3: Gesundes Kinzigtal, Germany
An example of a European-type ACO is provided by the Gesundes Kinzigtal (“Healthy Kinzigtal”) programme in Germany (Hildebrandt, Schulte & Stunder, Reference Hildebrandt, Schulte and Stunder2012). The programme started in 2005 and targets the entire population of the city of Kinzigtal, regardless of disease or age. The guiding principle of the programme is the triple aim concept – improving patients’ experience of care, improving population health and reducing per capita costs of care – and the main elements of the programme comprise self-management support, prevention, patient-centred care and an electronic networking system (Struckmann, Boerma & van Ginneken, Reference Struckmann, Boerma and van Ginneken2015).
The Gesundes Kinzigtal programme also aims to improve the financial margin for the purchaser, which in the German context are sickness funds, and in this specific case two sickness funds: AOK and LKK. The programme aims to generate savings within the Kinzigtal region as compared to German “standardized” costs, which are average costs across all sickness funds, and a reference period prior to the intervention. These standardized costs are calculated in the German risk adjustment mechanism, which allocates money from a central allocation pool to purchasers. Since 2009, allocations for each individual are based on age, sex and marginal expenditures for one of 80 diseases as coded the previous year (Buchner, Goepffarth & Wasem, Reference Buchner, Goepffarth and Wasem2013). The contracts between Gesundes Kinzigtal GmbH (i.e. the company) and the two sickness funds are based on the virtual budget of each fund’s total allocation from the central allocation pool – the budget is “virtual” because the money is not actually passed through to providers, who continue to receive their reimbursements from the sickness funds as usual. The financial result is measured by the total expenditure for the insured Kinzigtal population both within and outside partner institutions compared to the allocation from the pool. If the sickness fund spends less than it receives, the gain is shared between the fund and Gesundes Kinzigtal (Busse & Stahl, Reference Busse and Stahl2014).
Over the years the programme has managed to achieve savings. By 2010 the per capita expenditures of an LKK policy holder in the Gesundes Kinzigtal programme relative to those in the control group had decreased about 16.9% since 2005 (Hildebrandt, Schulte & Stunder, Reference Hildebrandt, Schulte and Stunder2012). An internal evaluation of the AOK and Gesundes Kinzigtal over the period 2006 to 2013 found that the programme had led to a net annual saving for the sickness funds of close to 3% (after sharing the 6.5% surplus difference with Gesundes Kinzigtal). In 2012, the relative cost reduction that could be allocated to the activities of the programme amounted to around 7.9%.
Policy relevance and conclusions
This chapter has shown why existing arrangements may be seen as failing to deliver appropriate care and has outlined the options for payers wishing to use the payment model to incentivize improvements in care coordination and integration. We then reviewed the available evidence for the effectiveness of these payment methods.
Improving care coordination and integration is, however, a complex task, and payment reform is unlikely to solve all problems of coordination. Rather, changes to the payment system should be seen as one (key) element in supporting the transition to coordinated and integrated services, but as emphasized by the review by Mason and colleagues (Reference Mason2015), leadership and communication across providers remain crucial facilitators for care integration.
Despite the criticisms raised against traditional payment systems such as FFS or payments based on DRGs, one benefit is that they require data to be collected on the activities undertaken by health care providers, making care processes more transparent. If payers change to a system of payment bundles that include multiple services delivered over a longer time period and across settings, it is important to consider how information about providers’ activities will then be collected. Even if new payment systems are supported by the monitoring of health outcomes or other indicators of care quality (which matters), information about providers’ activities remains essential for payers to assess the content of the care bundle that is delivered, and to assess the efficiency of care. Beyond monitoring the impact on health outcomes and activity, it is also crucial for payers to be mindful that payment changes can have distributional consequences and ensure that the equity consequences of reform are either monitored or explicitly addressed by the payment change.
Likewise, payers would do well to consider how to evaluate the impact of payment changes. For example, changes could initially be introduced to just a few providers (ideally randomly chosen), or gradually rolled out (again in a random order) to facilitate a controlled or stepped-wedge design, so allowing a comparison of key outcomes before and after the change, between an intervention and a control group. Moreover, policy-makers should be open to the possibility that some changes will not work out as hoped for, and in that case be prepared to seek explanations for why the change did not generate the desired impact, with the aim of revising the scheme and trying again.
With a key aim for new payment methods being the consideration of the impact of care by one provider on the need for care from another, facilitating the availability and integration of information enables providers to review the changes experienced in care provision. Still, it should be acknowledged that demand for health care is fundamentally uncertain – both for patients and providers. In light of this, new payment methods should not excessively assign risk to providers for outcomes that are beyond their control.
Nevertheless, many new payment methods do include shifting risk from payer to provider. Consequently, payers must redefine their role as one of setting objectives and ensuring that payment systems facilitate the achievement of these objectives. There is also a question of how to deal with changes in patterns of care that ensue from payment reform, which may result in some providers required to undertake fewer activities than previously.
Finally, payers should be mindful that, although demographic changes have created a need to rethink the way care is delivered which may be particularly relevant for patients with one or more chronic conditions, there is still a need for health care providers to respond swiftly to acute illness.
While the combined theoretical and empirical evidence suggests that financial integration such as shared-savings arrangements with careful design of incentives and information collection is a promising policy option for achieving the goals of integrated care, more empirical evidence is required before conclusions can be confidently drawn. Policy-makers are advised to have the need for further research in this area in mind when experimenting with new payment models, and to introduce new policies in a way that allows robust evaluation.Footnote 1
Key messages
Chapter 3.6 addresses how payment mechanisms can foster value for money and quality in long-term care (LTC). As populations continue to age with multimorbidity and the supply of informal care declines, expenditures in LTC are expected to increase significantly. However, better value for money can be achieved in LTC. Resource allocation mechanisms for LTC and payments to providers are distinct from those for health care for a number of reasons. Key learning includes that:
LTC is particularly prone to poor quality or inadequate care, under provision, overmedicalization and to delivery in suboptimal settings.
The challenges for LTC reflect its differences from health care markets, including that:
○ In health care the focus is on improving health whereas, once an individual needs LTC, that need for care is permanent and the emphasis shifts to maintaining quality of life;
○ LTC is often provided by low-paid or informal (often unpaid) caregivers rather than highly-trained professionals;
○ LTC markets are generally fragmented, with a multitude of funding sources and payers involved;
○ Collecting data on LTC quality, defining indicators and setting targets are difficult and make value-based payments particularly challenging.
Payments for formal LTC provision should be adjusted based on risk and inevitable cost variation between patients, and then combined with other payment types that incentivize additional aspects, including quality of care and cost containment.
Informal caregivers may be compensated either with cash or nonmonetary benefits. Although these do not normally cover the full costs of providing care, they acknowledge carers’ contributions and to some extent address issues such as working hours lost.
Introduction
LTC is required by patients who are dependent on others on a daily basis because they are limited in the activities they can undertake for themselves. Since dependency on and demand for LTC are mainly associated with age and its concomitant comorbidities, the growing numbers of people living longer ensure that the demand for LTC will continue to increase. In 2018, about 25% of individuals aged more than 65 years in Organisation for Economic Co-operation and Development (OECD) countries had at least one limitation in instrumental activities of daily living (IADL), i.e. those activities that enable a person to live independently, such as shopping, laundry, cooking, the ability not to put oneself at risk by getting lost, and turning off electric appliances. Another 17% were limited in at least one of the activities of daily living (ADL), such as eating, washing and going to the toilet. An average of 11% of the OECD population aged more than 65 years received LTC in 2019, of whom 68% received LTC in the community, at home,Footnote 1 even though institutional care represented about 50% of LTC expenditures (OECD, 2021) (see Chapter 2.5).
Community care is provided by low skilled caregivers (meaning untrained or with lower level qualifications), predominantly informally by family members – most of them women. In formal LTC the gender of the caregiver often depends on that of the beneficiary. Since most beneficiaries are women, so too are their formal caregivers. Countries vary in scope of formal LTC, but it is estimated that just 10% to 30% of LTC caregivers in OECD countries are formal, i.e. paid workers (Colombo et al., Reference Colombo2011). Changes in family composition – for example, as a result of lower fertility rates – are projected to reduce the availability of informal caregivers (Brimblecombe et al., Reference Brimblecombe2018; Gragnolati et al., Reference Gragnolati and Gragnolati2011). Formal caregivers often work part time, are low-paid, low skilled (with lower level qualifications) and have a high turnover (see Chapter 2.5 for more on the differences between formal and informal LTC workers). Formal LTC is typically seen as a rather unattractive profession due to factors such as low pay or difficult working conditions, and supply has been constantly decreasing. Therefore, in many high-income countries (HICs), the LTC workforce relies particularly on immigrants. Even when wage increases are implemented in an attempt to retain the formal LTC workforce, results are modest (OECD, 2020b).
The limited supply of both formal and informal care, along with the growing demand for LTC, results in increases in total expenditures on LTC (Cravo Oliveira Hashiguchi & Llena-Nozal, Reference Cravo Oliveira Hashiguchi and Llena-Nozal2020). Per capita expenditures are projected to rise even further (Bakx, Reference Bakx2015). LTC financial pressures on families and the state require LTC systems to improve their efficiency by mitigating market failures. Payment mechanisms are one of the tools available to achieve this (Charlesworth, Or & Spencelayh, Reference Charlesworth, Or, Spencelayh, Cylus, Papanicolas and Smith2016), and this chapter presents our analysis of how best to deploy them.
First, we outline the conceptual framework for our analysis on the flow of LTC funds across the agencies. We then step outside it to argue caution: payment mechanisms cannot always be used in the same way in LTC markets as in those for health care, and we highlight the ways in which the LTC providers, markets and failures are different. Next, returning to our framework, we look first at the pooling and allocation of funds for LTC, and then at the payment methods used to purchase LTC services and the different incentives the various methods create. Finally, we draw conclusions and make suggestions for policy.
Our framework: conceptualizing LTC and financial flows
In this section we set out the terms and concepts on which our analysis relies and the framework within which we conduct it (Fig. 3.6.1). We define the services which make up LTC (personal and social, in kind or in cash), the settings in which the care takes place (community/at home, or institutional) and the workers who provide the care (formal or informal, skilled or unskilled).
Framework to analyse financial flows in LTC and payments for providers
LTC: long-term care.

Figure 3.6.1 Long description
At the centre is a triangle that reads: Regulator sets eligibility. At the top is Payer agency (single or multiple). This entity will be the Collector of funds (national or local) through Pooling and allocation. The Payer agency Transfers cash benefits to Beneficiaries, and Purchase services from Providers (at home or institution). Beneficiaries purchase services from Providers, who then provide (in-kind) benefits to the Beneficiaries. Beneficiaries also Raise funds: L T C contributions or general taxes, which go to the Collector of funds.
The arrows shown in Fig. 3.6.1 represent the flow of funds which is central to our analysis. Within the framework, public LTC systems collect funds either nationally or locally (grey arrow “Raise funds: LTC contributions or general taxes”; see also Chapter 2.5). In systems with multiple payer agencies, the collected funds may be pooled and allocated to the payer agencies (e.g. local governments, health plans, ministries or national insurance systems; see the vertical blue dotted arrow “Pooling and allocation”). In systems with a single payer, funds are not allocated, therefore the arrow is dotted. Ideally, funds are allocated based on predicted risks or costs of the beneficiaries under responsibility of the payers, through a risk-adjustment/allocation formula. Payer agencies subsequently purchase LTC services on behalf of their beneficiaries by paying LTC providers (yellow arrow on the right hand side “Purchase services”). Alternatively, agencies can also “pay” beneficiaries directly with cash benefits (blue arrow “Transfer cash benefits”), giving them the option to use this money as they wish; for example, to pay for formal home care. Private funding exists in all LTC systems, and users often pay for LTC either entirely through out-of-pocket payments or partially, via user charges (yellow arrow at the bottom of the triangle). Voluntary LTC insurance plays a modest role in funding LTC in most countries due to many market failures (Brown & Finkelstein, Reference Brown and Finkelstein2007), and thus we do not analyse this source of funding in this chapter.
LTC: its services
LTC comprises a range of services aimed at slowing down and managing the decline in functional capacity among beneficiaries with a high degree of long-term dependency (Colombo et al., Reference Colombo2011; OECD, 2018). LTC services are provided to dependent people, such as older adults (aged more than 65 years) or people with physical or mental disabilities suffering from chronic conditions with functional or cognitive limitations over an extended period.Footnote 2 LTC services cover various forms of care. In this chapter, we include: (i) personal care and help with ADL, such as eating, bathing and toileting; and (ii) social care, which deals with assistance services that enable a person to live independently and help them with IADL, such as shopping, laundry, cooking, not putting oneself at risk (e.g. getting lost), or forgetting to turn off an electric device (Gori, Fernandez & Wittenberg, Reference Gori, Fernandez and Wittenberg2016; OECD, 2018). We include cash benefits to buy the aforementioned services (i.e. monetary benefits for people needing ADL and/or IADL), as these payments are taken as a proxy for a paid transaction. However, we exclude medical or nursing LTC, such as wound dressing, administering medication, health counselling, palliative care, pain relief and medical diagnosis with relation to a long-term condition, as this type of service is usually funded by health systems.
LTC: its settings and caregivers
The severity of beneficiaries’ dependency determines not only the type and number of hours and services, but also the setting where LTC is provided.
Community care
LTC is predominantly provided at home – referred to as community or home care in this chapter – by low skilled caregivers, whether paid workers (formal care) or family members (informal care). While the number of care hours are determined by the level of dependency (Colombo et al., Reference Colombo2011).
Institutional care
If LTC beneficiaries’ functional capacity continues to deteriorate, they may be treated in institutions with permanent nursing staff and rehabilitation-allied health professionals, such as LTC nursing homes, geriatric wards in care homes, or separate geriatric institutions (Cafagna et al., Reference Cafagna2019; OECD, 2018). Our analysis takes account of two types of LTC institutions: day care centres and nursing/care homes.
Day care centres
In day care centres, beneficiaries receive several hours of care on a daily basis, particularly preventive care. The centres include nursing and rehabilitation services such as physiotherapy, occupational therapy and mental health support, provided by skilled and unskilled caregivers. These formal caregivers are part of community care although working in an institution (the day care centre), as beneficiaries live in their own homes.
Nursing/care homes
Recipients of care in nursing/care homes are those who require LTC due to physical or mental disability/dementia, but are not in need of complex medical care. Caregivers include skilled and unskilled caregivers (such as nurses and allied health professionals). Patients admitted to nursing homes for a short period following an acute-care hospitalization to recover before being able to return to their homes are excluded from this analysis. We also exclude geriatric/LTC wards in hospitals, because the care provided in these wards is medical and the costs are typically captured in health expenditure data. Sheltered housing is also absent in our analysis, as this type of institution is designed for independent residents. Residents of sheltered housing who receive help with ADL are considered community-based care beneficiaries and are mentioned under “community care”.
Such, then, are the conceptual underpinnings and context for our analysis of the use of payment mechanisms in LTC markets, but first we need to see why caution is needed, if thinking simply to replicate the way they function in health care markets.
How LTC markets differ from health care markets
In health care markets, policy-makers use payment mechanisms as a tool at their disposal to influence providers’ behaviour and decision-making through the economic incentives created. The ultimate objective of payment mechanisms is to compensate providers fairly for services rendered and promote efficiency: to achieve more with a given number of resources without undermining quality of care; or improve quality of care while controlling expenditures (Cylus, Papanicolas & Smith, Reference Cylus, Papanicolas and Smith2016a; Reference Cylus, Papanicolas and Smith2016b). Payment mechanisms can accomplish this by incentivizing the provision of the adequate number and types of services based on need, i.e. avoiding unnecessary treatment or selection of patients (Frank, Glazer & McGuire, Reference Frank, Glazer and McGuire2000; Geissler et al., Reference Geissler and Busse2011). Likewise, payment mechanisms could potentially be used in LTC markets to balance economic incentives related to provision of LTC in a way that promotes desired objectives such as equity in access and high-quality care. However, the payment mechanisms required for LTC are not necessarily the same as those for health care, given some crucial differences between the two markets in terms of the type of care needed and the workers providing it; levels of market fragmentation; questions concerning the quality of care; moral hazard and excess demands. Here, we outline these differences and, briefly, some of the payment mechanisms which relate to them. We go into more detail about the various mechanisms in the Payment methods and the incentives they create section.
LTC versus health care: type of care
While in health care the aim is to cure or improve a patient’s condition, in LTC it is about improving quality of life, where conditions are either longstanding or permanent (Bakx, Reference Bakx2015). There is also the question of the duration of an “episode of care” and the subsequent distributions of costs. Health costs are usually unpredicted and are very high for very few people, and the demand for care is usually not known in advance. For LTC, once an individual becomes disabled, costs are usually permanent and likely to increase gradually, though the duration of care varies. While only a small fraction of the population is responsible for most expenditures in health markets, funds in LTC are dispersed over a broader percentage of those aged more than 65 years (Berk & Monheit, Reference Berk and Monheit2001; Mitchell, Reference 512Mitchell2019; Zuvekas & Cohen, Reference Zuvekas and Cohen2007). In LTC it can be challenging to predict longer-term expenditures because it is difficult to foresee: (i) the probability of need (Costa-Font, Courbage & Swartz, Reference Costa-Font, Courbage and Swartz2015); (ii) the duration of care; and (iii) the future costs of the LTC services (Barr, Reference Barr2010). For LTC it is challenging to define a clear episode of care that can be costed and priced in advance. Thus, prospective, activity-based payments are difficult to apply, and diagnosis-related group (DRG) payments are rare in LTC (Cots et al., Reference Cots and Busse2011) (see Chapter 3.2 for more on DRGs).
LTC versus health care: type of provider
While health care is provided by highly skilled professionals, most LTC is provided by low-paid, low skilled (low or untrained) formal caregivers or informal (i.e. unpaid) caregivers (see Chapter 2.5). Informal caregivers typically face high opportunity costs in terms of time spent providing care and income lost due to reduced participation in the formal labour market, as well as a loss of personal time. To compensate informal caregivers, some countries offer incentives, such as tax exemptions, work leave days or other allowances. These have important impacts on caregivers’ well-being, income, willingness to provide LTC and the interplay between formal and informal care. However, the incentives given do not compensate for the full cost of care, and there is no formal contractual relation between provider/informal caregiver and the beneficiary. Implicit contracts are mainly based on altruism or exchange motivation that might be influenced by the level and availability of supply of formal care (Costa-Font, Jiménez-Martín & Vilaplana-Prieto, Reference 509Costa-Font, Jiménez-Martín and Vilaplana-Prieto2022). Controlling for or incentivizing quality of informal care remains a challenge (OECD, 2020b).
LTC versus health care: level of fragmentation
Compared to health care markets, LTC markets are highly fragmented, with various sources of funds coexisting, and many payer agencies responsible for the different settings and types of care (see Box 3.6.1). Inadequate (re)allocation of funds may create incentives for cost shifting by LTC payers, resulting in attempts to shift unattractive (i.e. labour-intensive or high-risk) beneficiaries and costs to other care settings or payers. Shifting beneficiaries to less optimal care settings is exacerbated when different payers are responsible for different types of care settings. In the Netherlands, for example, regional care offices pay for institutional and intensive home care (ADL), while community IADL care is paid for by local government. Since local government funds are not earmarked for LTC, those with greater budgetary pressures tend not to invest in preventive, less intensive care and instead have an incentive to shift beneficiaries to more intensive care settings paid for by the regional care offices (Alders & Schut, Reference Alders and Schut2021). Beneficiaries may not only forgo IADL care, which can result in increased dependency levels, but they might end up receiving unsuitable (more intensive) care. Shifting beneficiaries to more intensive care settings may thus increase expenditures without added benefit. The undertreatment of patients, and the accompanying increase in their levels of dependency, in order to move them to other care settings and payers, has also been reported in Italy, Spain (Arlotti & Aguilar-Hendrickson, Reference Arlotti2018) and Portugal (Lopes, Mateus & Hernández-Quevedo, Reference Lopes and Mateus2018).
Two payment mechanisms used to mitigate this type of cost shifting and to promote continuity of care are bundled payments and pay for performance (P4P) (see Chapter 3.1). In health care markets, their effects have been modest (Eckhardt et al., Reference Eckhardt and Busse2019). The experience with these payments for LTC is less extensive, and outcomes are even less pronounced. The ability to reduce excess demand or total expenditures in LTC is lower than in health care, when each care setting is funded by a different payer (Kattenberg & Bakx, Reference Kattenberg and Bakx2021). To mitigate cost shifting related to LTC’s fragmentation of payers, it would be more effective to combine policy tools such as merging budgets, integrating providers or integrating LTC within health payers, rather than rely on payments as a single solution (McClellan et al., Reference McClellan2017). Experiences from England and Sweden show that pooling budgets for health care and LTC for older adults reduced duplication and fragmentation of care, improved coordination of care and collaboration between the sectors. However, no clear evidence of an improvement of quality of care was found (Hultberg et al., Reference Hultberg2005). In addition, in the short term, there was no evidence of reduced costs. In the Pooling and allocation of funds section, we describe in more detail countries’ LTC payer agencies, and how pooled funds are redistributed among payers to improve equity in financing.
Due to historical development of LTC systems, countries often have multiple LTC programmes, correspondent to the care setting; for example, institutional versus community care, or type of benefit (in kind versus cash). The different settings or types of care may have different methods of collecting funds, different budgets, different payer agencies, different pooling and redistribution systems, and sometimes also provide care for different types of beneficiaries. For example, Austria has different systems for cash and in-kind benefits. For cash benefits, the central government is the single payer, while for in-kind benefits the local governments are the multiple payers. Funds for cash benefits are transferred directly from the payer agency (the central government) to the beneficiaries, while funds for in-kind benefits are pooled and redistributed to the payer agencies through an allocation formula, and subsequently provided to the beneficiaries (Schmidt, Waitzberg & Blümel, Reference Schmidt, Waitzberg and Blümel2021). Similarly, Czechia and Italy have different LTC systems for cash and in-kind benefits. Croatia, France, Poland and the Netherlands have different LTC systems for community and institutional care. The Netherlands also has different systems for community care based on type of care (one for ADL services, and another one for IADL) (Waitzberg et al., Reference Waitzberg2020b).
LTC versus health care: quality of care
Concerns about how to incentivize high-quality care is core to the design of payments for LTC providers (Barber et al., Reference Barber2021), while those paying for health care are balancing a greater range of payment objectives (see chapters 3.1 and 3.2). In the context of LTC, poor quality care by formal (paid) providers may exist in the form of neglect, overmedicalization or provision of services in the wrong setting; for example, not providing enough hours of care at home or treating a non-severely disabled person in a nursing home (National Academies of Sciences, Engineering, and Medicine, 2022). In addition to P4P and bundled payments, already mentioned, pay for coordination, pay for quality (P4Q) and shared-savings models have also been implemented to promote quality of care with mixed results, and without evidence for positive effects in the long run (Wieczorek et al., Reference Wieczorek2022). One of the main challenges of applying value-based payments is the difficulty in defining, measuring and collecting data on quality in LTC. It is also clear that payments and their impacts are context specific, and financial incentives should be developed and tailored to each local setting (Struckmann et al., Reference Struckmann2017).
Overmedicalization is more common in nursing homes than in home care, and is a further instance of service distortion, as institutionalized beneficiaries of LTC consume more or inappropriate medication, particularly opioids and psychiatric drugs, compared to those non-institutionalized (Fog et al., Reference 510Fog2017; García-Gollarte et al., 2014; Jensen-Dahm et al., Reference Jensen-Dahm2015). Keeping beneficiaries at home might reduce the phenomenon of overmedicalization, as it is less prevalent in this setting. One way to ensure more beneficiaries are cared for at home may be to set higher or more accessible benefits for home care than for institutional care.
LTC versus health care: moral hazard and excess demand
In health economics, moral hazard is a phenomenon where, in theory, patients consume more services or technologies because they are insured and do not see real prices (see Chapter 2.4) (Stone, Reference Stone2011; van de Ven & Ellis, Reference van de Ven, Ellis, Newhouse and Cuyler2000); but in LTC this is different since beneficiaries are not typically insured and much of their care is unremunerated. Yet, moral hazard can still occur in LTC when publicly paid-for beneficiaries create an excess demand for: (i) LTC at an earlier stage of disability; (ii) more hours of care than needed; or (iii) more costly services, such as nursing homes (without real need), or replacing informal care with formal care too soon, thus potentially increasing public expenditures (Bakx et al., Reference Bakx2015a; Konetzka, Reference Konetzka2006).
Countries typically reduce the risk of this market failure by imposing cost-sharing or limiting eligibility for benefits, but this raises risk of creating barriers to accessing basic LTC (Bakx et al., Reference Bakx2015a). A better strategy to mitigate excess demand is setting clear eligibility criteria at the national level, based on need (Bakx, Douven & Schut, Reference Bakx, Douven and Schut2021; Waitzberg et al., Reference Waitzberg2020b). For example, the Netherlands publicly funds both home care and nursing home care in similar scope. Beneficiaries are allocated to the setting (home or nursing home) and intensity of care (number of hours) with clear eligibility criteria based on level of need. There is little room for choice of care setting, and thus for preferring institutional care over home care (Bakx et al., Reference Bakx, Douven and Schut2020). In Spain too, needs tests based on severity of IADL and ADL limitation allocate beneficiaries into one of four tiers of care, leaving little room for excess demand (Costa-Font, Jiménez-Martín & Vilaplana-Prieto, Reference 509Costa-Font, Jiménez-Martín and Vilaplana-Prieto2022). Eligibility should be frequently reassessed with needs tests, to allocate patients to the proper care setting. Box 3.6.2 contains a summary of LTC market failures and policy options.
1. Difficulty in defining and costing a clear “episode of care”: once an individual becomes disabled, costs are permanent and likely to increase gradually, though the duration of care varies. DRG payments are infrequent.
2. Most care is provided by informal (unpaid) workers, who face high opportunity costs. Rather than formal contracts, there are implicit contracts based on altruism, which can pose difficulties in controlling or incentivizing quality of care.
3. LTC markets are highly fragmented, with multiple sources of funds coexisting and many payer agencies each responsible for the different settings and types of care. Risk selection by LTC payers can occur when they face incentives to shift unattractive (i.e. labour-intensive or high-risk) beneficiaries and costs to other care settings and payers. Beneficiaries may receive unsuitable care. By bundling sources of funds, payers and budgets may mitigate this inefficiency. In addition, funds should be pooled at the central level, and distributed among payers according to needs-based allocation formulae.
4. Quality of care and service distortion are key concerns. Over- and underprovision of care may exist in the form of neglect, overmedicalization or provision of services in the wrong setting. For formal (paid) providers, P4P payments may promote quality, yet evidence on their effectiveness remains limited and inconclusive.
5. Moral hazard (or excess demand) can occur when demand rises for LTC in an earlier disability stage, more hours of care than needed, or more costly services, such as nursing home care without real need. Cost-sharing is a suboptimal option to mitigate excess demand, but a better alternative is setting need-based eligibility criteria, frequently reassessed.
Pooling and allocation of LTC funds
Returning now to the framework set out in Fig. 3.6.1, in this section we look at the actions and processes represented by the horizontal arrow at the top of the triangle. First, we describe the “who” of pooling and allocation – the collectors and the payer agencies, and then move on to “how” – the process of and criteria for allocating LTC funds.
Collectors and payer agencies
Payer agencies receive public LTC funds from national or local collectors of funds and commission or purchase LTC services from providers on behalf of beneficiaries (Busse, Schreyögg & Stargadt, Reference Busse, Schreyögg and Stargardt2017). Alternatively, payer agencies provide cash benefits to beneficiaries (see Fig. 3.6.1). In countries with multiple payers, payer agencies can be either local governments or health/LTC insurance plans, while countries with a single payer task the central government itself or another agency (such as a national insurance institute) as the payer agency. As such, in single-payer systems, the agency that collects funds, usually the central government, is also the payer agency since it purchases services from providers and/or transfers cash benefits to beneficiaries directly. Such agencies thus have an important role in purchasing LTC services and ensuring their supply for those in need, according to eligibility, in an equal and efficient way (Thomson, Foubister & Mossialos, Reference Thomson, Foubister and Mossialos2009). Frequently, countries have different payers for the different LTC settings, i.e. a payer responsible for institutional care, and another payer for community care (as described in Box 3.6.1).
Collectors – mostly single, sometime multiple
In many countries, LTC funds are collected by the central government, or a combination of the central government with subnational (regional or local) governments. When funds are collected by multiple agencies, such as regional or local governments, they are usually pooled at the central level, and redistributed to the payer agencies. Canada and Germany are exceptions in the sense that most of the funds are collected in a decentralized manner and are not pooled and redistributed. In Germany, the LTC plans associated with the specific sickness funds collect contributions from their members, yet funds are pooled and redistributed ex post according to the de facto expenses of each sickness fund. In Canada, each province or territory has its own LTC system, and roughly 75% of the funds are collected by the provinces and territories, which are also the payer agencies. The other 25% comes from federal transfers to the provinces and territories to fund their health care systems. These funds are not earmarked and are not pooled or redistributed across provinces and territories (Waitzberg et al., Reference Waitzberg2020b).
How are allocation decisions made?
Similar to mechanisms for allocating pooled funds to health care payers, allocation mechanisms for LTC should be based on predicted need of LTC, through a risk-adjusted capitation formula to ensure equity in financing (van de Ven & Ellis, Reference van de Ven, Ellis, Newhouse and Cuyler2000). Yet, contrary to health care, in LTC, multiple payer agencies are each responsible for different care settings, and may receive funds from different sources, and through different allocation mechanisms. LTC funds can be allocated to multiple payer agencies based on government decisions, automatic updates of past budgets or past use, or the predicted needs of the population they serve calculated via a risk/needs-based allocation formula. The more the distribution of funds is done based on objective and transparent criteria that reflect LTC needs, the higher the equity of funding. However, it is important to note that distribution of funds according to a needs-based formula alone does not ensure equity of distribution to a certain population if each region or payer agency commissions a different set of services for populations with the same need, or does so according to different eligibility criteria. Therefore, eligibility criteria should be set at the national level (Waitzberg et.al, Reference Waitzberg2020b).
In systems with single-payer agencies, funds do not need to be pooled and allocated. This is the case in Israel, where the National Insurance Institute is a single collector of funds and is a single payer for home-based LTC public provision (Asiskovitch, Reference Asiskovitch2013).
In a study that analysed 25 LTC systems in 17 countries, only seven systems had a single payer, with the central government also functioning as the payer agency (Austria, Czechia and Italy for cash benefits; Croatia and Cyprus for institutional and community care; and Israel, as mentioned in the previous paragraph). Out of the remaining 18 systems, eight distributed funds according to past budgets, government decisions or a general needs formula for public services (Waitzberg et al., Reference Waitzberg2020b). The other 10 countries did so based on a specific risk/needs-based formula for LTC, including Austria (for in-kind benefits), Czechia (for 15% of its budget), England, France, Germany, Lithuania, the Netherlands (for institutional care and community intensive ADL care), Norway, Portugal and Sweden (Table 3.6.1). Norway and Sweden applied demographic risk adjusters such as marital status to consider the existence of alternative informal care. They also used information about spoken language and residence in sparsely populated areas to reflect special caregiver needs. A few countries considered further risk adjusters such as disability, dependency level or chronic diseases (England, the Netherlands) and/or previous years’ expenditures (Austria, France, Norway). France further considered socioeconomic risk adjusters such as the number of allowance claimants and income of older people in the area overseen by the respective local authority. In England up to 2020, needs-based allocation formulae accounted for differences in wages across areas and to recognize differences in costs driven by factors outside the control of payers (local authorities) and providers.

Table 3.6.1 Long description
The table has 4 main columns: Demographic (age, gender, marital status, household composition), Socioeconomic (income, education, allowance claimants), Health or disability condition (number of A D L limitations, chronic conditions, level of help needed), and L T C costs (previous year, and expected). A cross is marked against the countries under the columns where applicable. It reads as follows. Austria (in kind): L T C costs. Czechia (15 percent): Demographic; Health or disability condition. France: Demographic; Socioeconomic. Germany: L T C costs. Lithuania: Demographic. Netherlands (institutional): Health or disability condition. Netherlands (community): Demographic; Socioeconomic; Health or disability condition. Norway: Demographic; Socioeconomic; L T C costs. Sweden: Demographic. United Kingdom (England): Demographic; Socioeconomic; Health or disability condition; L T C costs.
ADL: activities of daily living; LTC: long-term care.
Compared to allocation formulae for health care, those used for LTC are simpler (Bryndová, Hroboň & Tulejová, Reference Bryndová, Hroboň and Tulejová2019; Cylus et al., Reference Cylus2018; van de Ven et al., Reference van de Ven2007). Maybe, due to the nature of LTC markets, where age and other demographic characteristics are strong predictors of need, these adjusters are good enough to allocate funds in an equitable manner. Future studies could test this hypothesis. LTC funds could also be adjusted retrospectively to account for unpredicted expenditures. That is even more important for LTC than for health care, because LTC is a social service and, as already discussed, can be challenging to insure.
With the funds now allocated to the payer agencies, we turn to the downward yellow arrow on the right hand side of the triangle in Fig. 3.6.1: the purchase of services from the providers of LTC – in particular, the payment methods used and their associated incentives.
Payment methods and the incentives they create
As already shown, different payment mechanisms can incentivize the provision of LTC in different ways. Broadly speaking, payments that vary according to activity and that are retrospective, fine and narrow, such as fee for service (FFS), create incentives to increase productivity (i.e. the number of services or patients) and reduce the costs per unit of care. Prospective payments that are coarse, broad and fixed, such as budgets, salaries and capitation, can also create incentives to reduce the cost per unit (Ellis, Martins & Miller, Reference Ellis, Martins, Miller and Quah2017; Ellis & McGuire, Reference Ellis and McGuire1996; Jegers et al., Reference Jegers2002; Newhouse, Reference Newhouse1996; OECD, 2016; Quinn, Reference Quinn2015). Per diem and activity-based payments such as DRGs may create different incentives depending on the context. The challenge for policy-makers is to balance trade-offs between incentives to increase productivity and control expenditures and manage the different risks of unintended consequences that these incentives pose (e.g. overprovision of care, risk selection of beneficiaries, underprovision of care, provision of unsuitable care) (Chaix-Couturier et al., Reference Chaix-Couturier2000; Geruso & Mcguire, Reference Geruso and Mcguire2014; van Barneveld et al., Reference van Barneveld2001). Selection may occur if LTC providers prefer less labour-intensive beneficiaries and attempt to shift unattractive beneficiaries to other providers or other care settings. As in health care markets, prospective payments that incentivize cost containment (such as budgets, salaries, capitations and sometimes per diem) may aggravate this inefficiency. Cost containment may also undermine the supply of LTC beds in institutions or supply of formal workers.
One strategy to achieve this balance in economic incentives is to apply risk-sharing mechanisms that combine types of payments to distribute the risks of unpredictable costs between payers and providers in different ways (Newhouse, Reference Newhouse1996; Quentin et al., Reference Quentin2018). This is done by combining payments with different characteristics, also called “add-on payments”. For example, in the health care market, providers are paid with a blend of prospective and retrospective payments, such as budgets or capitations combined with FFS, or salaries combined with FFS or P4P (Brammli-Greenberg, Glazer & Waitzberg, Reference Brammli-Greenberg, Glazer and Waitzberg2019; Quentin et al., Reference Quentin2018). Another strategy employed in health markets to balance incentives is to include other mechanisms of risk offset, such as the addition of risk adjusters into capitation formulae or including case mix in payment mechanisms (van de Ven & Ellis, Reference van de Ven, Ellis, Newhouse and Cuyler2000). For example, DRG-based payments adjust the tariff of episodes of care by accounting for case mix, comorbidity and severity of case (Street et al., Reference Street and Busse2011).
In LTC, adjusting payments based on risk is particularly necessary (and common) in countries where prices are set unilaterally or negotiated collectively, as providers do not set their own prices based on their own costs. Risk-adjusted prices avoid underpricing and mitigate incentives for providers to skimp or reduce quality of care (Barber et al., Reference Barber2021). Prices are commonly adjusted based on geographical location, the degree of dependency of beneficiaries and the type and setting of services. These adjustments recognize the legitimate and unavoidable cost differences among providers. For example, in Australia, the Netherlands and the USA, geographical price adjustments are made for facilities in rural areas, while Japan uses increased tariffs in the metropolitan Tokyo area to account for higher wages and higher costs of living. Adjustments for specific conditions that require more intense labour are done for beneficiaries with dementia (Australia) or Huntington’s disease (Netherlands). Finally, some adjustments are done to incentivize provision of care to specific populations, such as for indigenous communities in Australia (Barber et al., Reference Barber2021).
In what follows below we describe the most common methods to pay LTC providers and what is known about the economic incentives the different methods create. We consider institutional care separately from community care because of the differences in type and duration of care, caregivers and cost.
Payments to institutional care (nursing or care homes)
In nursing homes, beneficiaries may receive some specialized services, such as pain and psychiatric medications, rehabilitation and other allied health services (physiotherapy, speech and occupational therapy, diet and pharmacy counselling), and receive accommodation services for each overnight stay. Like hospitals (see chapter 3.2, for more on paying for hospitals), nursing homes have fixed costs such as infrastructure and personnel and, to a lesser extent, variable costs, such as consumables and payments to independent professionals. Variable costs in nursing homes, however, are proportionally small compared to hospitals, making it easier to work out a daily LTC tariff (per diem).
Payment method 1: per diem
Most care homes are paid by day of stay (per diem), complemented by FFS schemes (Table 3.6.2), with some countries setting global budgets (Barber et al., Reference Barber2021). Such payments are often negotiated prospectively or based on a prefixed share of high-need users (Colombo et al., Reference Colombo2011). Examples of public LTC systems that pay care homes on a per diem basis are France (Le Bihan, Reference Le Bihan2018), Greece and Estonia (European Commission, 2019), and Sweden and Spain (Barber et al., Reference Barber2021). Day care institutions are also commonly paid per diem (Box 3.6.3).
| Type of payment | Nursing/care homes |
|---|---|
| Fee for service | Australia, Bulgaria, China, Czechia, Germany, Japan, Lithuania |
| Per diem | Australia, Estonia, Germany, Greece, Netherlands, Korea, Portugal, Spain, Sweden |
| Case mix-adjusted per diem | Canada, Italy, Switzerland, USA (Medicare) |
| Flat capitation | Argentina, Uruguay |
| Risk-adjusted capitation | France, Chile |
| Budgets | Czechia, Netherlands |
| Pay for performance | Germany |
Although day care is considered to be community care, the framework to analyse payments to and incentives for day care facilities is similar to that used for nursing homes, because unskilled care is provided along with some skilled care – mainly by allied health professionals. Prices for such services are often freely set by providers. Day care is also paid predominantly via the per diem system, in many countries adjusted to the severity of cases; for example, in France and Spain (Barber et al., Reference Barber2021). In Italy, per diem payments are adjusted by diagnosis, and are higher for Alzheimer centres (Hohnerlein, Reference Hohnerlein, Becker and Reinhard2018).
The USA’s experience with Medicaid’s per diem rates showed that the system incentivized nursing homes to contain costs by decreasing levels of staffing and preferring less labour-intensive beneficiaries. Adjusting per diem rates to case mix reduced these perverse incentives both in the USA and Canada (Norton, Reference Norton, Pigott and Woodland2016; Wilkinson et al., Reference Wilkinson2019). Since 2019, Medicaid sorts LTC beneficiaries in nursing homes into a patient-driven payment model based on the type of services they need: physical therapy, occupational therapy, speech–language pathology, non-therapy ancillary and nursing. Each resident is classified into one group of services, and per diem rates are adjusted accordingly (Barber, Lorenzoni & Ong, Reference Barber and Ong2019). Early evidence shows that this patient-driven payment model may have resulted in a reduction in therapy staff levels and services (National Academies of Sciences, Engineering, and Medicine, 2022). Switzerland also has LTC needs-adjusted per diem payment structures for nursing homes (Bischofberger & Landolt, Reference Bischofberger, Landolt, Becker and Reinhard2018).
Per diem rates can also be adjusted based on the facility’s features or costs (up to a ceiling). However, this blurs the economic incentives of cost containment as rates can be adjusted for increased costs. For example, Portugal has four types of nursing homes to account for different care needs, and each type is paid with a different per diem tariff (Lopes, Mateus & Hernández-Quevedo, Reference Lopes and Mateus2018).
Alternatively, per diem payments can be combined with payments that create incentives to increase productivity (FFS) or quality (P4P/P4Q). Germany has chosen to balance the economic incentives of payments to nursing homes by combining per diem payments with FFS if additional services are provided, such as allied health care, and P4P for rehabilitation services (Blümel et al., Reference Blümel2020). These add-ons may promote prevention of deterioration of patients’ functioning. These add-on retrospective payments need to be accompanied by a proof of the service provided, to avoid fraud.
As in health markets, flat per diem payments create incentives for LTC providers to contain costs, which can result in underprovision of care, neglect or the selection of lower-need beneficiaries. To mitigate these perverse incentives and promote proper and high-quality care, countries commonly adjust per diem rates to account for the variable costs of beneficiaries. For example, per diem rates are adjusted by the risks of beneficiaries in the USA and Canada (Colombo et al., Reference Colombo2011) or, as in Portugal, according to the case mix of the institution, measured by the levels set by the eligibility criteria to qualify for public funding (Barber, Lorenzoni & Ong, Reference Barber and Ong2019). Adjusting per diem rates for case mix mitigates the incentives for care providers to select beneficiaries, without significantly negating incentives for cost containment. This, though, comes at the risk of reducing incentives to prevent health deterioration: the more severe the case, the higher the payment (Wunderlich & Kohler, Reference Wunderlich, Kohler, Wunderlich and Kohler2001).
Payment method 2: FFS
FFS payments create incentives to increase productivity, which creates a risk of overprovision. This type of payment is therefore usually capped and combined with other payment methods. For example, Czechia pays nursing homes primarily via budgets to cover the operational costs, combined with FFS for certain services; the FFS component is capped to mitigate incentives for overprovision of care (Koldinská & Štefko, Reference Koldinská, Štefko, Becker and Reinhard2018). Australia, Germany and Japan combine their per diem schemes with FFS to incentivize nursing homes to provide appropriate care (Barber, Lorenzoni & Ong, Reference Barber and Ong2019). Denmark’s main payment method for institutional care settings is FFS (WHO Regional Office for Europe, 2019), which may partially explain why Denmark spent almost twice the European Union average on LTC in 2016. Lithuania and Bulgaria pay FFS for additional medical services in nursing homes (Barber et al., Reference Barber2021; OECD, 2020a).
Payment method 3: capitation
Capitation bundles the payment for all services projected for each beneficiary during a period, usually one year. However, this payment is not very frequently applied, as it is challenging to cost and price an episode or a period of care. In Argentina and Uruguay, nursing homes are paid based on the number of beneficiaries they serve during a certain year (Cafagna et al., Reference Cafagna2019). As with per diem payments, capitation creates incentives to contain costs; for example, by improving preventive care or quality of care, but also by skimping on care or selecting low-cost beneficiaries. It is therefore usually adjusted for the beneficiary characteristics that influence variation of costs. For example, Chile adjusts capitation rates according to beneficiaries’ level of dependence, their age, medical status and socioeconomic status (Matus-Lopez & Cid Pedraza, Reference Matus-Lopez and Cid Pedraza2015). In the USA, Medicare nursing homes that participated in the Evercare project and started receiving capitation-based payments (instead of FFS) invested in primary care to avoid hospitalizations, which reduced (unnecessary) hospitalizations (Konetzka, Reference Konetzka2006).
Capitation payments can be used to promote integrated LTC (see Chapter 3.5 for more on integrated care). The Program for All-Inclusive Care for the Elderly (PACE), and the Institutional Special Needs Plan (I-SNP), are examples from the USA. In the PACE programme, day care was paid by capitation to provide all social and health services in one single space during the day so the patient could keep living in their home (Konetzka, Reference Konetzka2006). In the I-SNP programme, nursing homes were paid by capitation to provide onsite integrated care (McGarry & Grabowski, Reference Mcgarry and Grabowski2019). In both cases the integration of payments supported integrated care and reduced hospitalizations. This kind of incentive can be used only in a structure that enables the integration of social and medical LTC and primary and institutional care (see Chapter 3.5).
Payment method 4: P4P
Since most LTC is provided by low-paid, low skilled caregivers and some beneficiaries lack the cognitive capacity to complain, it is crucial to supervise and promote quality of care. Failures in LTC markets can result in low-quality or improper care, so maintaining quality is a key concern. Payments such as P4P can incentivize providers to improve quality, but it is not the only tool available to achieve this; Box 3.6.4 lists some of the others, both financial and nonfinancial.
Apart from payment mechanisms designed to promote quality of care, other financial incentives can be implemented:
Quality-related subsidies
In Austria, LTC providers must meet certain quality thresholds and adhere to quality management schemes to be eligible for public funding.
In England, quality-related subsidies are given to providers that invest in and increase their nursing homes’ workforce.
Quality-related public procurement
Australia and England give greater weight to predefined quality criteria (Malley, Trukeschitz & Trigg, Reference Malley, Trukeschitz, Trigg, Gori, Fernandez and Wittenberg2015).
In addition, nonfinancial tools may also promote quality of LTC such as publicly publishing information about prices and quality.
Regulation is justified in any market with failures or distortions that are not naturally resolved and especially in markets that have social importance (Selznick, Reference Selznick1985). In LTC, regulation plays a major role in promoting quality of care, and yet there is still room for improvement (Mor, Miller & Clark, Reference Mor, Miller and Clark2010). Ideally, payment mechanisms should be used as tools to enforce quality-promoting regulation (Ullmann, Reference Ullmann1987).
P4P has been widely implemented in health markets, but to a lesser extent in LTC (Li & Norton, Reference Li and Norton2019). Its use in LTC markets is different, for two main reasons. First, “performance” is defined differently, and quality measures frequently used for health are not suitable for LTC. For example, mortality rates are unsuitable to assess quality of LTC because mortality rates are high among all providers, even high-quality nursing homes and the objective of LTC is not good health, but rather managing well-being. Second, perceived quality measured by satisfaction of beneficiaries may also be unsuitable for LTC settings because some beneficiaries may not be responsive to quality of care, particularly those with cognitive impairment such as dementia (Norton, Reference Norton, Pigott and Woodland2016; 2018).
However, if P4P payments are effective, provision of higher quality of care potentially reduces the costs and burden on both the LTC and health care systems by reducing hospital (re)admissions and improving health outcomes. This is the reason why P4P is being increasingly implemented in nursing homes, despite the difficulty in measuring “performance” in LTC.
In 2010, about 14 states in the USA had P4P programmes for LTC through government-funded Medicaid. Programmes differed in how to measure and reward “quality”. Some used traditional measures, such as customer satisfaction with care provided, rates of staffing and regulatory deficiencies, while others used clinical outcomes, such as number of urinary infections or pressure ulcers.Footnote 3 The rates of bonuses for performance were modest and varied between 2% and 6% of the per diem rate (Dyer et al., Reference Dyer2020; Konetzka, Reference Konetzka2006). Germany applies P4P payment schemes for institutional LTC whenever rehabilitation interventions can lower the level of needed care (Blümel et al., Reference Blümel2020). Japan pays an add-on payment for nursing homes that exceed the minimum standards of staffing, a measure of quality of LTC (Malley, Trukeschitz & Trigg, Reference Malley, Trukeschitz, Trigg, Gori, Fernandez and Wittenberg2015). Korean nursing homes can receive 1–2% additional P4P bonuses if they score highly in five domains of quality of care, namely management of institutions, environment and safety, guarantee of rights of beneficiaries, process and outcome. Evaluation scores are disseminated through an official LTC insurance website (Barber et al., Reference Barber2021).
Evaluations of P4P schemes in Iowa and Minnesota showed improvements in resident satisfaction with care provided, employee retention rate and nursing hours to beneficiaries. However, these very same P4P schemes resulted in the selection of beneficiaries, as they created incentives to admit beneficiaries that increased the probability of performing well (Colombo et al., Reference Colombo2011). In addition, P4P schemes have raised concerns that institutions with fewer resources have less chance of scoring high in performance. This potentially leads to a vicious circle where worse-funded institutions receive fewer payments for performance and have even less opportunities to improve performance or quality (Konetzka, Reference Konetzka2006). Other recent evaluation studies from the USA found that P4P schemes had little effect on the quality of LTC and suggest that there is room for improvement in designing these payments (Grabowski et al., Reference Grabowski2017; Li & Norton, Reference Li and Norton2019).
Given the above, policy-makers should be cautious in their enthusiasm for P4P payments. There is little reliable evidence, much of which is inconclusive, on whether these types of payments improve the quality of care. P4P payments are often technically and politically difficult to implement, and their cost–effectiveness remains unclear (Eckhardt et.al, Reference Eckhardt and Busse2019). To improve quality of care in practice, P4P payments should be carefully designed and combined with other tools (see Box 3.6.4).
Payment method 5: budgets
Budgets may be combined with other activity-based payments to balance economic incentives. In LTC, budgets are often negotiated prospectively or based on a prefixed share of high-need users. This poses a financial risk for providers, as they may face budget overruns, since public budgets are rarely adjusted later to reflect the changing disability status of care beneficiaries in institutions (Colombo et al., Reference Colombo2011). Budgets are not commonly used to pay for nursing homes, but some countries combine budgets with other activity-based payments to balance the economic incentives. In Czechia, as mentioned above, nursing homes’ budgets cover the operational costs and fees for service for allied health services, which are capped (Koldinská & Štefko, Reference Koldinská, Štefko, Becker and Reinhard2018). The Netherlands combines a per diem system with overall budgets for residential care (Barber et al., Reference Barber2021).
Community care
The key cost in community care is the labour of its formal caregivers. As in institutional care, most are low-skilled (see Chapter 2.5). In many countries, they are paid based on the number of hours they work. Elsewhere, caregivers are paid a global monthly wage or a fraction, corresponding to the worked hours. Usually, salaries are accompanied by quality norms and constant measurements. Current wages for personal home care in many countries are the minimum wage per hour and sometimes even lower, primarily due to unpaid time (i.e. unpaid travel time and “on-call” hours) (OECD, 2020b; Cravo Oliveira Hashiguchi & Llena-Nozal, Reference Cravo Oliveira Hashiguchi and Llena-Nozal2020). Since the publicly financed hours are often not enough to cover the needs of the LTC beneficiary, the caregiver might receive payments from two payers: one being the public payer, and the other being the beneficiary or their family as private funding directly paid to the caregiver to ensure the beneficiary receives the number of hours of care they need.
The caregiver’s characteristics and the way a home care beneficiary receives the payment (in kind or in cash) can impact the level of expenditure, regardless of whether the care is formal or informal. In Germany, for example, LTC beneficiaries are free to choose between cash or in-kind benefits for home care. In-kind benefits are more than double the amount of cash benefits for the same care level assessed. Cash benefits are mostly chosen when the caregiver is an informal one, usually a relative, while in-kind benefits are the preferred choice for those contracting a formal caregiver (OECD, 2020b).
Informal caregivers can be rewarded by receiving allowances (cash benefits) or non-monetary benefits (extra care leave or paid leave from their regular work to care for relatives, tax benefits, respite care services and more, to incentivize informal caregiving). Both methods increase the willingness of informal carers to provide LTC and may promote home care instead of nursing home care (Brimblecombe et.al, Reference Brimblecombe2018). Notably, in countries where the employer is not reimbursed for the paid sick leave or paid leave that an employee uses to help care for a relative, the costs of such legislation shift to the private/commercial sector. In some countries, such as Germany, LTC beneficiaries receiving cash benefits can use this money to pay their informal caregivers (Blümel et al., Reference Blümel2020). The monetary and non-monetary benefits usually do not cover the full costs of care, such as foregone working hours, and are rather simply an acknowledgement that providing care involves costs (OECD, 2020b). For example, in Spain, caregiving allowances are unconditional (paid directly to the caregiver’s bank account) but are lower than the minimum wage (Costa-Font, Jiménez-Martín & Vilaplana-Prieto, Reference 509Costa-Font, Jiménez-Martín and Vilaplana-Prieto2022). High benefits may disincentivize carers to participate in the formal labour market, particularly for low-skilled workers and especially if they are means tested (Colombo et al., Reference Colombo2011). In Spain, caregiving allowances incentivized informal care, while the effects of public funding of home care on informal care was mixed, with no clear pattern of substitution or complementarity of informal and formal home care (Costa-Font, Jiménez-Martín & Vilaplana-Prieto, Reference 509Costa-Font, Jiménez-Martín and Vilaplana-Prieto2022).
Policy relevance and conclusions
Compared to health care, LTC has unique characteristics when it comes to the type of care provided (by low/untrained caregivers, in formal and informal care settings, for an unknown duration) and the beneficiaries it serves (older people and others with impaired abilities’ whose health situation is not expected to improve). Therefore, funding and payments for LTC should be regarded as social care rather than health care. Public and private expenditures in LTC are likely to keep increasing given population ageing, declining supply of informal (unpaid) care, and the introduction of new care technologies, but better value for money can be achieved. Public funds should be allocated efficiently to payer agencies, providers and beneficiaries. Payment methods are tools that can potentially be used to change provider behaviour to provide quality LTC according to need (not too much and not too little), in the most cost-effective setting. Payment types for LTC providers are largely the same as those for health care providers, and the incentives that each payment type generates are similar. The same two guiding principles to balance economic incentives apply: payments can be adjusted based on risk or on inevitable cost variations and then combined with other types of add-on payments to incentivize additional aspects such as quality and cost containment.
However, there are important differences between the health care and LTC markets.
First, the duration of LTC is unknown, which makes case-based payments such as DRGs difficult to price. Second, selection of less labour-intensive beneficiaries can occur when payments are not adjusted to variation of risks or costs. Negative selection by payer agencies can manifest as shifting unattractive (i.e. labour-intensive or high-risk) beneficiaries and costs to less optimal care settings. Improper costing of payment fees, or prospective payments such as budgets, capitations or per diem payments can create incentives to service distortion such as underprovision of care, which usually means fewer hours of care, but also poor quality, neglect and understaffing. In extreme cases, improper costing may result in closure of nursing homes if they are not financially sustainable. Nursing homes are paid primarily per diem, which incentivizes cost control, but also service distortion. To balance economic incentives, per diem tariffs are either adjusted for severity of dependency, high costs, geographical region, or beneficiary characteristics; or combined with other types of payment such as FFS, budgets and P4P. Capitations are used to pay for day centres and nursing homes and can be used to promote integrated care. Capitations, too, are adjusted to account for variable costs and reduce incentives for selection or service distortion.
Home care is mostly provided by informal (unpaid) caregivers, who have no formal contracts, and provide quality of care dependent on their altruism, free time and opportunity costs. Formal caregivers are typically paid prospectively, by the hour or via a monthly salary, as there are few specific services that can be paid for with a specific fee. Informal caregivers can go unpaid, be paid from the cash benefits received by the care beneficiary, or receive non-monetary allowances, such as additional paid leave to provide care from the state or their regular employer, and tax exemptions. Neither the cash benefits nor the allowances fully cover the costs of care or loss of alternative income, which represent an increasing burden on informal caregivers.
Third, since LTC beneficiaries are not always able to complain, and many of the market failures may undermine quality of care, assessing and promoting quality of care is crucial for all care settings. However, quality- or performance-related payments in LTC are not yet widespread and the existing experience shows inconclusive results, with no clear evidence of benefit in the long run. Multiple coexisting policies may promote quality of care, if applied in a coordinated manner: (i) regulation that sets standards of care, promotes transparency and publicly publishes information on quality indicators; (ii) financial mechanisms such as payments to balance economic incentives and subsidies to enforce regulation; and (iii) reducing the fragmentation of LTC payer agencies and providers.
Fourth, moral hazard problems are less common in LTC than in health care due to rigorous eligibility criteria and assessment of need for services. Moral hazard is reduced with clear and objective eligibility criteria set at the national level, and detached from payers. Eligibility assessment should be done on a regular basis to account for changes in level of disability. These are better tools than cost-sharing to mitigate moral hazard, as they do not exacerbate financial access barriers. In addition, overprovision of LTC does not necessarily mean more hours of care and can result in overmedicalization.
Fifth, due to the fragmentation of LTC markets by type of care, payers may face incentives to negatively select unattractive beneficiaries, by shifting them to other care settings (and payers). Earmarked budgets or integration of payers might mitigate these perverse incentives. Equity in funding payer agencies may also reduce/end this market distortion. Equity in funding can be improved if funds are allocated to payers according to the needs of the populations they serve; this can be achieved by means of allocation formulae with clear and objective risk adjusters.
Since health care and LTC are interconnected, the effects of payments to providers in each area should be better explored. Investments in health care can prevent or delay the need of LTC. High-quality LTC and rehabilitation can save the costs of unnecessary hospitalizations. However, the systems are often fragmented, which may result in inefficiencies, and these interplays should be better understood – in particular, the incentives of payers and providers to shift beneficiaries to other settings by underproviding preventive care, or by upcoding severity of dependency. From the literature we have reviewed, it is not yet clear whether providers of LTC are more or less sensitive than health providers to changes in economic incentives created by payments. This could also be explored in future research.
Finally, payments are an important tool that influence provider behaviour, but are not the only ones. Policy-makers should bear in mind that health care and LTC providers are not motivated solely by remuneration. Other considerations often outbalance or prevail over the economic ones, such as the needs of beneficiaries, empathy or altruism, particularly among informal caregivers, who are usually relatives or friends of the person they are caring for (Berenson & Rice, Reference Berenson and Rice2015; Busse & Mays, Reference Busse, Mays, Nolte and McKee2008; Waitzberg et al., Reference Waitzberg2020a). It is key to receive the full value of LTC payments, and there is still a need to scrutinize the effects of payment mechanisms on LTC market failures. Health economics provides a starting point to define frameworks to analyse the particularities of LTC.Footnote 4
Key messages
Chapter 3.7 reviews priority-setting. Priority-setting is about taking explicit decisions on where limited public resources should be allocated. Vertical priority-setting focuses on choices for particular sets of health conditions or population groups whereas horizontal priority-setting looks more broadly across types of care, such as primary or secondary care, and broader investments. Key learning includes that:
Defining a health benefits package (HBP) that is affordable and accessible by all implies a horizontal approach to priority-setting.
Countries cannot progress towards universal health coverage (UHC) without horizontal priority-setting and without some form of collective funding and procurement mechanisms.
Horizontal priority-setting is highly context specific. Countries may need to reorganize financing and procurement mechanisms to overcome barriers to progress.
Increasing the total resources for HBP can help with the introduction of more horizontal approaches.
Improving procurement can also support the move towards horizontal priority-setting whether through national efforts (such as better data gathering and use) or international initiatives (i.e. harmonizing regulation across countries or global investment in health security).
Local capacity is key in supporting the pooling mechanisms, HBP design and regulation which enable horizontal priority-setting. Donors can usefully support health systems strengthening by investing in capacity-building and information sharing.
Strong political will and cooperation between stakeholders is critical in progressing towards appropriate priority-setting for UHC and in designing, financing and implementing a comprehensive HBP.
Introduction
Following the 2012 United Nations resolution on UHC, in September 2015 all United Nations Member States reinforced their commitment to UHC by subscribing to Sustainable Development Goal 3.8 – achieving UHC. Moving towards UHC requires investment across three key dimensions identified by the World Health Organization (WHO): (i) extension of health coverage to populations not covered; (ii) improvement in quality and the number of services in the health package provided; and (iii) financial risk protection for poor and vulnerable populations. But, in most countries, scarce resources imply trade-offs between these dimensions, and not everyone in a country may have access to all beneficial health services at affordable prices. Trade-offs mean choices on what and how health care interventions are provided by a health system, for which population groups, in what quantity and at whose expense. Such choices must be made in health care systems in both high and low- and middle-income countries (LMICs) – i.e. some form of rationing of health services takes place in all health systems. A process of priority-setting is therefore essential to ensure that policy-makers align the HBP with both the goals and capacities of their country’s health system.
Priority-setting: definition and role in developing an HBP
Without an explicit priority-setting process, rationing may still happen within a health system at multiple levels. For example, prices faced by patients may limit demand; long travel distances and delays in accessing services (such as waiting lists) may also lead to a reduction in demand. Eligibility rules based on citizenship, population groups or packages of services covered are all forms of rationing within a health system. Priority-setting in health care is the process of making explicit the decisions about allocations of resources in a health system, given that resources are limited – i.e. rationing always takes place. In the context of UHC, priority-setting is required to develop a comprehensive package of health services – an HBP that is aligned with social goals to which all individuals have access (Chalkidou et al., Reference Chalkidou2016). Such HBPs include “the set of health services and products that can be feasibly financed and provided for everyone, given a particular country’s actual circumstances” (Glassman, Giedion & Smith, Reference Glassman, Giedion and Smith2017). Establishing an HBP requires difficult political choices and finding a balance between different suppliers of technologies and services, and claims from patient groups and regions (Savedoff et al., Reference Savedoff2012). Making the process of defining an HBP transparent and based on scientific evidence for the cost–effectiveness of different interventions and products can help mitigate some of the political challenges associated with priority-setting for UHC. However, priority-setting using cost–effectiveness alone focuses only on the maximization of health within a population. Other criteria beyond cost–effectiveness, such as equity and financial protection, can have significant implications for which products and services are included and who has access to the HBP (Norheim et al., Reference Norheim2014).
Many high-income countries (HICs) that have UHC also already have some form of priority-setting process in place (Ham, Reference Ham1997; Seixas et al., Reference Seixas2021). This chapter is primarily concerned with LMICs looking to make the transition to UHC. Decision-makers in LMICs often face severe resource limitations compared to decision-makers in HICs; the challenge is choosing affordable health care products and services to include in an HBP from a wide array of available options (see Chapter 2.2 for more on setting HBPs).
Vertical and horizontal priority-setting: definitions
In the priority-setting process, distinction can be made between vertical and horizontal priority-setting. In vertical priority-setting, the choice typically concerns which health care interventions and services to offer for the same or similar set of health conditions (Ham, Reference Ham1997) or to specific population groups. In contrast, horizontal priority-setting involves choices between health care interventions and services for different diseases, across types of care (primary or secondary care) and broader investments in health system strengthening. But the definitional boundaries between the two are hardly clear cut when it comes to actual implementation. If we take HIV/AIDS prevention and treatment, for example, these occur across different care settings, making a programme focused on treatment with antiretroviral therapies (ARTs) more vertical than one that deals with the whole spectrum of the disease. Disease-specific donors often cover prevention and treatment for multiple diseases and may practise horizontal priority-setting within their portfolio of services. For example, the Global Fund to Fight AIDS, Tuberculosis and Malaria covers three diseases and, recently, COVID-19. The Global Fund’s investment has also been shown in large part to support pandemic preparedness and health system strengthening (Boyce et al., Reference Boyce2021). The same applies for Gavi, the Vaccine Alliance, as investment in vaccines also helps strengthen national procurement systems. However, as we discuss later in this chapter, a recipient country may face significant challenges in incorporating these donor-funded services within a more integrated (horizontal) priority-setting exercise. On the other hand, a health insurance package which caters mostly to the wealthy or urban population or a health care fund which is predominantly noncommunicable disease-focused, such as a cancer treatment fund as proposed in Nigeria (Onyejia & Adebowale, Reference Onyejia and Adebowale2019) or the Indian dialysis programme (NHSRC, 2018), is more vertical, and in some cases may be less pro-poor than a broader HIV or malaria programme. Another form of verticalization can occur where federal states devolve financing and delivery of care to provinces/regions with inequity across states in terms of access and outcomes.
Horizontal priority-setting and UHC
Within the UHC framework, defining an HBP that is affordable and accessible to all implies a primarily horizontal approach to priority-setting. For countries which may already have several, often large, vertically set priority programmes, moving towards an HBP which takes a more integrated, horizontal approach will require reorganization of existing financing and procurement mechanisms.
Most countries that have horizontal priority-setting processes in place (regardless of explicitly stated or implicitly defined HBPs) have some form of collective funding and procurement mechanisms – for example, centralized tax financing as in Denmark, New Zealand, Sweden and the United Kingdom – while others, such as Germany or the Netherlands, rely on forms of compulsory health insurance (see Chapter 2.1). In contrast, countries looking to move to UHC through horizontal priority-setting have limited collective funding and are financed by a wide range of sources, including taxes (income or value-added tax (VAT)), international donors and a large share of out-of-pocket (OOP) payments (see Chapters 1.4 and 2.4). The two groups also differ in their health product procurement strategies. Those that have horizontal priority-setting processes in place typically have a national procurement strategy with well-established supply chain mechanisms, enabling market-shaping power due to volume of purchasing. Countries pursuing UHC through horizontal priority-setting tend to have highly decentralized and fragmented procurement and supply chain systems with poor demand forecasting and supply management abilities (Silverman et al., Reference Silverman2019).
The definition of procurement in this chapter encompasses product (not service) selection, regulation, price negotiation and purchasing. It begins with a discussion of prevalent funding and procurement arrangements that pose a challenge for countries looking to move towards horizontal priority-setting for UHC. It then discusses potential ways forward, highlighting successes from countries making this transition. Emphasis is also placed on limitations and unintended consequences that have occurred during the transition. The chapter concludes with policy recommendations for donors and countries working towards a transition from vertical to horizontal priority-setting.
Challenges in moving to horizonal priority-setting
The role of financing arrangements
As organization and funding arrangements within a health system are built up over time, the nature of the health financing system has practical implications for horizontal priority-setting. Horizontal priority-setting assumes that there is some form of collective financing mechanism (general taxation/social insurance/employer scheme) where utilization is independent of funding contribution. Moving towards a collective financing mechanism requires a health financing transition. The transition involves a rise in total health spending per person financed through pooled resources, accompanied by a gradual decrease in OOP spending (Fan & Savedoff, Reference Fan and Savedoff2014). However, this delineation does not always exist in practice and most systems use some mixture of funding mechanisms. These funding mechanisms often affect social goals and can pose challenges to ensuring that prioritized services are provided. For example, certain types of financing arrangements can influence provider or patient behaviour by stimulating or suppressing demand for specific health services (e.g. curative services) or for services that may be of priority to specific population groups (e.g. the wealthy). They may also impact the size of the revenue base. To illustrate these issues, we consider challenges to horizontal priority-setting with three types of internal funding mechanisms that coexist with collective financing: private insurance, complementary insurance and user charges.
In many countries that have collective health financing schemes, individuals can choose to also have voluntary (private) health insurance (see Chapter 1.3). For example, the United Kingdom has private health insurance alongside collectively financed health care; individuals can use private insurance to replace collective coverage with insurance premiums set by the private provider based on the individual’s risk. Individuals choose private insurance if the benefits/services covered under private insurance are perceived as greater than those from the collective HBP given the cost of the premium. In this case, the collective HBP may receive less political support from wealthy individuals who prefer and obtain private insurance. To garner political support for the collective HBP, policy-makers may be forced to design packages that are attractive to wealthy individuals, which can result in trading off equity and limiting coverage for interventions that are deemed to represent the best value for money.
The existence of a large(r) private insurance sector (such as in the USA) can also have profound consequences for the horizontal priority-setting process. The existence of an opt-out option from the public system can mean significantly lower revenues for the collective HBP, limiting the services that can be provided and the population who can be covered. Private insurance tends to attract wealthier individuals, who are generally healthier and whose needs may not be covered by the collective HBP. Thus, the budget available for a collective HBP through horizontal priority-setting is intrinsically linked to the benefits being offered.
Alternative arrangements to private insurance are supplementary and complementary health insurance alongside a collective HBP. For example, in many Latin American and Caribbean countries, private health insurance is a secondary source of coverage for some of the population. Its role is supplementary, i.e. covering health goods and services not covered in the basic HBP in Belize, Ecuador, Guyana, Peru, Suriname and Uruguay. However, in others, such as Argentina, Brazil, Chile, Honduras and Peru, its role is complementary, i.e. covering cost-sharing for health goods and services covered in the basic HBP (Lorenzoni et al., Reference Lorenzoni2019). In this scenario, establishing a comprehensive package of services that is affordable and accessible to all may be challenged by a need to offer services which are not covered by supplementary or complementary health insurance or a package that predominantly meets the needs of those who are unable to afford private health insurance. The sustainability of such an offering may also be in question if the services covered by the collective HBP are those that are likely to result in catastrophic health expenditure.
A third type of funding mechanism may influence the success of a comprehensive collective HBP: user charges (see Chapter 2.4). User charges are OOP payments for services or contributions towards the cost of a service. Within a collective HBP, they can be used to try to regulate demand for health care and generate revenue for the health system. If user charges are implemented within the HBP without exemptions in place, they result in catastrophic payments for individuals who cannot afford the charges, exacerbating inequity within the health system. On the other hand, the removal of user charges or widespread exemptions may result in decreased revenue for the health system, limiting the ability to provide a wider range of services or cover a large population.
In many countries, the provision of public health interventions, mental health services and diagnosis and treatment of communicable disease has been vertically arranged, with corresponding vertical allocations of funding for these specific areas. This arrangement offers little flexibility for allocations across areas and can present significant challenges in incorporating these services within a more integrated priority-setting exercise. In LMICs, the vertical arrangement of certain services, particularly those for communicable diseases, are due to their reliance on external funding. External funding from bilateral, multilateral and philanthropic organizations have typically been targeted to specific disease areas or priority groups. Examples include the Global Fund, Gavi, the United States President’s Emergency Plan for AIDS Relief (PEPFAR) and the Bill & Melinda Gates Foundation (Atun, Bennett & Duran, Reference Atun, Bennett and Duran2008).
Furthermore, the level and availability of external funding may dictate which health issues are placed high on national health agendas as well as the types of interventions that are selected to address them. Donors with disease-specific priorities may limit the extent to which health systems can leverage economies of scope in the delivery of services through a shared platform (horizontally). Such arrangements also pose a challenge for setting a cost–effectiveness threshold that reflects the budget constraint across horizontal interventions. Cost–effectiveness thresholds set by national policy-makers will reflect the limited domestic budget. Interventions selected according to these cost–effectiveness criteria must be highly cost-effective (reflecting the narrow domestic budget), but the limited budget may also narrow the scope of services covered.
The role of procurement arrangements
Low-income and lower-middle-income countries are estimated to spend around US$ 50 billion per year on global health products (Silverman et al., Reference Silverman2019, based on estimates from Rosen et al., Reference Rosen2017). Despite this, access to essential medicines and health products in these countries remains insufficient, leaving individuals and families to access them in the private sector from OOP payments (Ewen et al., Reference Ewen2017). Health product procurement in low-income countries is also highly dependent on donors or privately purchased in lower-middle-income countries. Moving towards a horizontally set HBP implies fundamental changes to how health products and medicines are financed, transitioning away from OOP payments towards pooled financing and procurement.
In implementing a package of services that will expand access and coverage, countries need to procure a wide range of products to meet the needs of horizontally set benefits plans. In doing so, countries must justify the selection of products that meet the goals of wider access to services and coverage within their budgets. Health technology assessments and cost–effectiveness analyses can play a useful role in product selection, but not all health-improving products will be locally cost-effective within highly constrained government budgets (Wirtz et al., Reference Wirtz2017). Furthermore, problems may be compounded by transition away from donor aid as income levels rise. Public sector spending in LMICs accounts for around 50% of expenditure on health products. Global health institutions and nongovernmental organizations, however, account for a large share of this public sector funding (Silverman et al., Reference Silverman2019). These funding mechanisms are not guaranteed to persist, and their support is usually based on countries becoming self-reliant over time (Wirtz et al., Reference Wirtz2017). As support from donors wanes, countries will not only have to make up for their share but raise additional resources to expand services and products covered under the benefits plan.
Some countries have come together to use pooled procurement systems to aggregate demand for pharmaceutical products. Pooled procurement, sometimes also called group purchasing or group contracting, combines decentralized decision processes on required volumes with centrally negotiated prices (Dubois, Lefouili & Straub, Reference Dubois, Lefouili and Straub2021; Nemzoff, Chalkidou & Over, Reference Nemzoff, Chalkidou and Over2019). For example, the Organization of Eastern Caribbean States Pharmaceutical Procurement Scheme, established in the 1980s, aggregates demand for products on the essential medicines list of 10 Caribbean states. Similarly, the Pan American Health Organization Revolving Fund (for vaccines, syringes and related supplies) and the Strategic Fund (for vector control medicines, diagnostic kits and related equipment) aggregate demand across several Latin American and Caribbean countries. This approach has also been adopted by global health institutions such as the Global Fund, UNITAID and Gavi, who in some shape or form have adopted product “market-shaping” strategies aimed at lowering prices through volume guarantees, combining demand across countries or ensuring continuous supply by contracting multiple suppliers. Countries no longer eligible for or reliant on such organizations and arrangements for health products may be faced with higher prices for these products due to their limited negotiating power and smaller-scale purchases. Apart from facing higher transaction costs due to lower volumes, unorganized demand may also deter suppliers from low-volume markets and/or from offering preferential pricing arrangements. This lack of organization from the demand side may also discourage investment in development of new products or manufacturing capacity (Silverman et al., Reference Silverman2019). To be fit for purpose, procurement processes in a horizontally set plan will need to optimize for quality, price, supply security and efficiency. Many LMICs have fragmented supply chains with purchasing, distribution and delivery processes vertically arranged across funders or programme/disease areas. Silverman and colleagues (Reference Silverman2019) provide the example of Nigeria, which has parallel funding, purchasing and distribution systems by commodity area, for example essential medicines, maternal and child health and HIV, tuberculosis (TB) and malaria. These duplications prevent the organization of demand and obstruct planning and delivery of a unified HBP. Further inefficiencies in procurement processes due to institutional and administrative challenges such as difficult tendering procedures or delayed payments to suppliers may result in increased prices due to the higher transaction cost associated with operating in such markets.
Existing financing and procurement arrangements can pose challenges to successfully moving from vertical to horizontal priority-setting. In the next section, we discuss potential ways of addressing these challenges and highlight efforts already being made by international donors to assist countries transitioning from donor funds or those never eligible for funding for; for example, the Global Fund’s Wambo platform for COVID-19 products, or Gavi’s purchasing agreements for transitioning countries.
Moving towards horizontal priority-setting
Reducing fragmentation by integrating financing schemes
In countries with multiple financing streams, fragmentation of financing streams can be reduced by merging existing ones where possible, thus reducing overlaps and generating a wider risk pool, so improving equity (see Chapter 2.1 for more on pooling). Amalgamation of existing schemes requires strong political will and there is potential for resistance from existing beneficiaries of the different schemes. Such resistance may arise if a unified benefits package implies fewer services covered than any of the separate schemes or higher levels of contributions for the same or fewer services. To overcome resistance to the consolidation, sometimes new legislation may be required. Such legislation may place the management of financing of different schemes with a single institution while paving the way for eventual consolidation (Towse, Mills & Tangcharoensathien, Reference Towse and Tangcharoensathien2004). Such an approach was implemented by Thailand when trying to consolidate four existing schemes in a move towards UHC (Box 3.7.1). However, full consolidation has not been achieved and three separate schemes still exist. Despite the extended coverage of Thailand’s UHC scheme, its benefits package is still less generous than those offered by two of the existing schemes – civil servants and social security schemes – making consolidation unlikely to take place soon.
Prior to the introduction of UHC in 2001, Thailand had four separate health coverage schemes:
1. a tax-financed scheme providing medical benefits for civil servants;
2. a tax-financed medical welfare card scheme for those with low incomes;
3. a voluntary health card scheme for households predominantly in rural areas; and
4. a contributory social security scheme, mandatory for all private employees.
Prior to UHC, these schemes benefited 43.5 million of Thailand’s population of 62 million. In its attempt to merge the four schemes, the government met strong resistance from members of the civil servants’ and social security scheme, who feared a reduction in their entitlements. To proceed with UHC, the government amalgamated the voluntary health card scheme and medical welfare schemes to give coverage to 47.8 million people (roughly 72% of the population). The UHC scheme established a unified benefits package covering essential services in preventive, curative and palliative care for all age groups. More recently, it has extended coverage to high-cost services, such as renal replacement therapy, cancer therapy and stem-cell transplants. Furthermore, the National Health Security Act, which was passed by Thailand’s Parliament in 2002, created a new institution to regulate the quality and financial aspects of the UHC scheme. Under this legislation, while benefit entitlements of the civil service and social security schemes remained unchanged, the financing of these two schemes was placed with the National Health Security Office, which oversees the UHC scheme, thus paving the way for eventual consolidation when it becomes politically acceptable to do so.
Despite the successes of Thailand’s UHC scheme it faces several challenges. As a noncontributory, predominantly tax-financed scheme, its sustainability is affected by the adequacy of tax revenues in the face of rising health care costs. Thailand continues to rely on funding from the Global Fund for specific programmes such HIV prevention programmes because of the difficulties in getting certain interventions for key populations funded by government.
Expanding the fiscal space
Implementing a horizontally set benefits plan often requires an increase in resources. In general, with tax-financed health systems, simply improving tax collection could generate more resources for health. However, such expansions, even if feasible, may not guarantee a larger allocation or more consistent support for health care. One potential solution may be for governments to leverage OOP spending; for example, by enticing those paying OOPs to join a collective scheme for a small premium, through which certain frequently used services or purchased drugs could be accessed at better negotiated prices. Such an approach is an alternative to the more commonly used insurance for health financing approach and facilitates greater efficiency in spending. Health insurance for raising funds has been shown to be unlikely to raise revenues commensurate with the requirements of providing adequate coverage for financial risk protection in LMICs (Barasa et al., Reference Barasa2021; Gheorghe et al., Reference Gheorghe2019). Another option is the creation of new taxes or the earmarking of existing tax sources for health spending (Box 3.7.2). Earmarking “involves separating all or a portion of total revenue – or revenue from a tax or group of taxes – and setting it aside for a designated purpose” (WHO, 2017a). Some obvious candidates include levying or increasing taxes on unhealthy products, such as tobacco and alcohol, or a reduction in subsidies for fossil fuels. The use of this earmarked revenue can be channelled to specific health-related priorities rather than to general health spending. The main advantage of earmarking unhealthy products is that in the short-to-medium term they can be a source of continuous, regular funding that is not affected by budgetary reviews. There is also likely to be political support for tax increases on such products when the proceeds are channelled towards health care (WHO, 2016). Over the longer term, revenues may fall as consumption falls or a black market thrives. Such an approach may also generate small revenues in countries where certain unhealthy behaviours (such as smoking) are not dominant. One of the main criticisms of earmarking revenues is that they limit budgetary flexibility and earmarked funds could potentially have been channelled towards more deserving programmes or projects. In this case, soft earmarking for certain priorities may be an option. For example, Thailand’s Health Promotion Foundation is funded directly through a 2% earmarked tax on alcohol and tobacco. Opponents also highlight the importance of determining public spending based on policy decisions rather than by the amount of revenue raised by an earmarked tax. Cases studies on earmarking tobacco tax revenues in nine countries have shown some evidence that when revenues are channelled directly into an autonomous fund dedicated to public health, such as into the overall pool of funds for a UHC benefits plan, then those revenues successfully add funding for health (WHO, 2017a).
Ghana was the first country in sub-Saharan Africa to introduce a National Health Insurance Scheme (NHIS). The NHIS was constituted in 2003 and all residents of Ghana are eligible for NHIS coverage, which has a generous benefits package covering 95% of diagnosed conditions including all outpatient, inpatient and emergency care. The scheme has no cost-sharing requirements, including for pharmaceuticals associated with the covered health conditions (Wang, Otoo & Dsane-Selby, Reference Wang, Otoo and Dsane-Selby2017).
The NHIS is primarily funded from:
VAT (70%);
deductions from the Social Security and National Insurance Trust (SSNIT) (20%) which mainly includes formal sector workers;
premium contributions (3%);
and the remainder from donor funds (Wang, Otoo & Dsane-Selby, Reference Wang, Otoo and Dsane-Selby2017).
Claims payments account for 77% of NHIS expenditure. By deriving funding for the NHIS from taxes on specific goods and services, Ghana’s health insurance scheme is the only in the world that is funded by VAT. This ensures that revenues keep pace with economic growth, while risk and cost pooling occur at the national level. However, reliance on VAT funding means revenue does not rise with an expansion in coverage.
Since its inception, the NHIS has faced several challenges to its financial sustainability. These include the small revenue base arising from high levels of premium exemptions. Over 60% of active NHIS members are exempt from premiums (Alhassan, Nketiah-Amponsah & Arhinful, Reference Alhassan, Nketiah-Amponsah and Arhinful2016). Premium exemptions apply to SSNIT contributors, enrollees under age 18 or over age 70, indigent people, institutionalized people and beneficiaries of some social protection programmes. Adverse selection and enrolee turnover has also been a problem. Wang and colleagues (Reference Wang, Otoo and Dsane-Selby2017) report that NHIS members are more likely to be in high-risk age groups (under 5s and over 55s). Their analysis of membership data shows that only 42% of enrollees from January 2014 remained in the scheme in January 2015 with members aged 15–24 years (least likely to have high medical expenditures) being the least likely to remain enrolled for a full year. A further challenge is the increasing cost of health products and service delivery. Health care providers under the NHIS rely on reimbursements to cover their operational expenditures. Providers are reimbursed using capitation payments for primary care services while all inpatient care and speciality outpatient services are reimbursed using the Ghana Diagnosis-Related Group (G-DRG) tariff scheme. However, pharmaceuticals are reimbursed using a fee for service (FFS), encouraging the use of prescription drugs. While the capitation payment for primary services provides some incentive for providers to be cost-efficient, these outpatient services account for only one third of all claims expenditures. The G-DRG and pharmaceutical FFS account for the remainder, with little incentive for providers to be effective in their referrals for secondary care or to curb overprescribing of curative services and pharmaceutical products. Thus, the combined effects of a generous benefits package, small and inconsistent enrolee base along with weak provider incentives continue to threaten the financial sustainability of the NHIS in Ghana (Durairaj, D’Almeida & Kirigia, Reference Durairaj, D’Almeida and Kirigia2010).
Cooperation between donors and countries
Cooperation between countries and international donors is vital to successfully implementing horizontal priority-setting. Ochalek and colleagues (Reference Ochalek2018) suggest estimating the scale of the health opportunity costs associated with any restrictions and conditions on donor assistance to facilitate a more informed and accountable negotiation between stakeholders, including careful examination of the reasons for restrictions. However, a more pragmatic and sustainable approach may be a change in the role of donors in countries transitioning from donor-dependent to fully domestically funded. Such a role may include supporting interventions that are marginally cost-ineffective, i.e. subsidizing key cost-ineffective interventions to make them cost-effective for a country’s threshold. Such an approach has been shown to be an equitable and sustainable model, especially for middle-income countries (Morton, Arulselvan & Thomas, Reference Morton and Thomas2018). Kanpirom and colleagues (Reference Kanpirom2017) also highlight the importance of not assuming value for money is a static property of interventions. Interventions implemented by a donor that are deemed initially cost-ineffective for a country due to their high start-up costs may become more cost-effective over time due to economies of scale, improvements in efficiency, etc. To ensure sustainability of donor-funded services after eligibility for donor funds ends, both countries and donors should monitor cost–effectiveness over time. This would enable countries to justify continued support for such cost-effective interventions within a horizontally set benefits package.
Donors also have a role alongside national health insurance schemes in ensuring equitable access to services. National schemes often do not prioritize the poorest, sickest or minority groups, resulting in unequal coverage (Schneider, Nakamura & Wu, Reference Schneider, Nakamura and Wu2019). Because of their emphasis on high-priority diseases and conditions by disease burden, national schemes and other UHC programmes may disregard important disease burdens in small populations (Kanpirom et al., Reference Kanpirom2017). For example, poor and marginalized groups living with HIV may not be able enrol in a national scheme as premiums may be unaffordable, or due to the limited regional coverage of the scheme (Global Fund, 2018). Donors supporting countries could focus their conditions or restrictions on requiring access for these groups, or where not feasible within the country’s budget, support such access themselves. Donors such as the Global Fund who invest in specific diseases (HIV, TB and malaria in this case) could pay for the three diseases through insurance funds, as is currently done in Viet Nam, where the Global Fund pays the insurance premiums of people living with HIV through their social health insurance (SHI), with a commitment from the government to absorb these premiums over time under domestic resources. ART and HIV-related care and services became reimbursable under Viet Nam’s SHI in late 2014. Over 70% of people living with HIV were due to receive ARTs via SHI by 2020 (Global Fund, 2020a). In Thailand, through a similar arrangement, migrant populations irrespective of registration status are covered by health insurance (Herberholz, Reference Herberholz2020).
Improving procurement and supply chain management
Improving procurement and supply chain management is critical to making health systems fit for delivering a unified HBP. Such improvements can reduce costs and limit supply shortages (WHO, 2015). Changes can include reducing fragmentation by centralizing procurement and improving data systems to monitor, manage and forecast demand for health products (Seidman & Atun, Reference Seidman and Atun2017). For example, the Nigeria Supply Chain Integration Project was established in 2015 with a mandate to coordinate product supply management across health programmes and funders with the aim of improving cost-efficiencies, reducing waste and minimizing stockouts. The project created and continues to maintain a logistics database on health products and pharmaceuticals across all health programmes in Nigeria, using it to monitor stock levels. The process also involved the creation and coordination of warehousing and transportation systems for health products across local, state and federal levels. Dubois and colleagues (Reference Dubois, Lefouili and Straub2021) further analysed the effect of centralized procurement on drug prices using data from seven LMICs. They found centralized procurement of drugs does lead to lower prices. However, if there are high levels of supply-side concentration, then the extent of price reduction is lower. In some cases, decentralization of financial management and procurement directly to the health facility level has been shown to be effective in improving the availability of medicines and medical equipment in health facilities (Kajuni & Mpenzi, Reference Kajuni and Mpenzi2021).
Any integration of vertical, particularly donor-financed services into a horizontal HBP requires a realignment of procurement arrangements. There are several possible actions for donors to facilitate such integration. For instance, donors can incorporate value-for-money assessments such as those for health technologies into their selection and price negotiation processes. Currently, many donors such as the Global Fund rely mainly on price negotiations based on bulk purchasing. In the longer term using value for money can help countries making the transition away from donor funding avoid the trap of investing in low-cost technologies that may have minimal impact or pay higher prices due to their inability to meet the bulk purchasing requirements for donor-negotiated prices (Kanpirom et al., Reference Kanpirom2017). Gavi, for example, assists countries transitioning away from its funding with access to multiyear supply agreement prices through manufacturer commitments via UNICEF or the Pan American Health Organization (Gavi’s designated procurement agents). However, currently this arrangement only applies to select vaccines, and is time-limited with varying lengths. Keller and Glassman (Reference Keller and Glassman2019) discuss other strategies that Gavi might adopt, including offering incentives to manufacturers to ensure steady vaccine supply, or permitting buy-ins from non-eligible countries. The latter may enable Gavi to globally negotiate tiered pricing agreements for countries, based on local affordability and cost–effectiveness. Delivering on horizontal priority-setting also requires access to safe, effective, good quality and affordable health technologies, medicines and vaccines. WHO (2017b) estimates at least 10% of medicines in LMICs are substandard or falsified, costing approximately US$ 31 billion annually. This is because many developing countries do not have the technical, institutional or financial capacities to regulate health product markets. Donors can facilitate alignment across countries and, where relevant, diseases, through the pooled procurement of products (such as vaccines or antiretrovirals) that meet World Health Organization requirements for international product safety and quality. Such market-shaping activities can benefit not just countries within the pool, but also those outside signalling good quality health products. One such example is the Wambo pilot for transactions not funded by the Global Fund, which was expanded to include COVID-19 products (Global Fund, 2020b).
Within a country, national regulatory authorities play a key role in selecting and approving health products. Thus, ensuring strong country regulatory systems is critical to ensuring countries are using good quality, safe and efficacious health products. Donors, in their efforts to strengthen health systems, could support investments in improving governance, technical competence, monitoring and evaluation capabilities. They could also make on-budget spending a key performance indicator for countries. Finally, donors can facilitate broader information sharing across countries, both within and outside pooled procurement arrangements, so addressing information asymmetry in product quality and safety. Countries, on the other hand, should lead the way in implementing regulatory reforms with donor support, resulting in less reliance on branding as a signal of quality and encourage high-quality generic suppliers (Silverman et al., Reference Silverman2019). They may also leverage models used by international donors such as organizing demand, volume guarantees and pooled procurement on a regional or global basis (Kim & Skordis-Worrall, Reference Kim and Skordis-Worrall2017; Seidman & Atun, Reference Seidman and Atun2017).
Health system strengthening and global health security (GHS)
In recent years there has been a lot of debate around the extent of true dichotomy in global health between either prevention and treatment or primary versus specialized care or, specific to this chapter, vertical versus horizontal financing and delivery of health services (Frenk & Gómez-Dantés, Reference Frenk and Gómez-Dantés2017; Dhillon, Karen & Marten, Reference Dhillon, Karan and Marten2019). The previous contention has been that vertical funding by donors for disease-based programmes could compromise the integrity and equity of recipient health systems (Daniels, Reference Daniels2006). However, evidence shows there are significant lessons and benefits to health systems from vertical programmes in how they strengthen, support and operationalize horizontal systems. For example, the response to the HIV/AIDS epidemic has shown vertical programmes can be effectively integrated into horizontal (in this case primary health care) systems. Such integration has enhanced the quality of the wider primary health care infrastructure, filled workforce gaps and improved patient flows between services (Pfeiffer et al., Reference Pfeiffer2010). Morton and colleagues (Reference Morton, Thomas and Smith2016) also demonstrate how investments in health system strengthening can be built into priority-setting exercises and highlight the complementarity between horizontal and vertical programmes.
Priority-setting implies difficult choices must be made. It also raises important ethical and equity considerations. In setting horizontal priorities and moving towards UHC, decision-makers are required to agree on criteria and establish transparent and fair priority-setting processes (WHO, 2014). As part of their priority-setting agenda, countries should invest in improving their GHS – preparedness for the prevention and management of outbreaks and epidemics, limiting the need to rely on external financing for emergencies and diversion of resources from horizontal priorities (see Chapter 3.8). Both priority-setting for UHC and GHS have intersecting agendas – both UHC and GHS aim at mitigating risk either to individuals (UHC) or populations (GHS) (Wenham et al., Reference Wenham2019). Low or no financial barriers to accessing health care improves access to services for infectious diseases while financial risk protection is an important social deterrent to the spread of infectious diseases. The recent Ebola outbreak in the Democratic Republic of the Congo and the COVID-19 pandemic have more than ever highlighted the importance of GHS and resilient health systems (Meyer et al., Reference Meyer2020). They have highlighted frailties in even the most advanced health systems, reinforcing the importance of successfully functioning health systems to detect and respond to health crises. Recent evidence has also highlighted the extensive contribution by vertical disease-specific international donors such as the Global Fund towards health security efforts through their investments in health system strengthening (Boyce et al., Reference Boyce2021).
Linking UHC and GHS may also enhance leverage for financing UHC (Ooms et al., Reference Ooms2017). The COVID-19 pandemic resulted in simultaneous global health and economic shocks. To facilitate a sustainable and inclusive longer-term recovery, progress towards UHC and improvements in population health (beyond COVID-19) are essential. Countries need to overcome the immense health and economic opportunity costs of managing the COVID-19 crisis (Appleby, Reference Appleby2020) including setbacks in the progress made over decades in key health outcomes such as maternal and child health and malnutrition. For many countries, health recovery requires an expansion of the government health budget. For a substantial group of LMICs, external financing is essential to recovering from this health shock. But an increase in health spending needs to be accompanied by better spending – reflecting improvements in equity and efficiency (Kurowski et al., Reference Kurowski2021). Such decisions inherently imply priority-setting across populations, diseases and services.
Conclusions and policy implications
Priority-setting involves decisions on the allocation of public resources. This naturally makes it a political issue subject to varying perspectives. For example, individuals may consider any reductions in their access to services as unacceptable, health product manufacturers may perceive priority-setting as a barrier to market access, or health care providers may perceive the exercise as restrictive of their autonomy. The ethical principles of priority-setting may not be easy to convey to the public, who may not also perceive the need for setting priorities.
When such political economy barriers are overcome at least to some extent, a move to horizontal priority-setting with the aim of UHC is possible. The long-term financial sustainability of existing national health insurance schemes, as in these countries, is, as such, unclear and potentially an issue. HBPs must be designed with the budget in mind, but also with consideration of the growth in overall health expenditure. As discussed earlier, finding the correct balance between coverage and revenue is a difficult task.
The “best” approach to horizontal priority-setting is context specific. Each country will need to find its own solution to barriers before successfully designing, financing and implementing a comprehensive HBP. But information sharing across countries about their approach and lessons learned can be vital to helping other countries move towards undertaking priority-setting exercises. Global networks like the International Decision Support Initiative can facilitate such information sharing and capacity-building. As both donors and countries have a large role to play in realizing horizontal priority-setting, our key recommendations for policy implementation are given in Table 3.7.1.

Table 3.7.1 Long description
The table has 2 columns: Donors and Countries. It reads as follows. Donors: Engage proactively in local capacity-building for pooling mechanisms, whether through national health insurance schemes or single-payer models with an emphasis on: channelling funds through local country mechanisms (on budget spend); strengthening strategic purchasing, procurement performance management and contractual mechanisms with an emphasis on outcome-based financing where possible; pooling with other donors where possible and aligning agendas. Strengthen regulatory institutions through their investments in wider health systems strengthening. Support and prioritize health benefits package design, including supporting global but also local efforts for local data on cost-effectiveness and equity. Support and promote the use of global networks for capacity building and information sharing.
Countries: Increase the resources available for a health benefits plan through pooling of existing schemes, earmarking taxes or designing schemes to entice out-of-pocket spenders to join collective schemes. Invest in improving procurement systems and processes by reducing fragmentation and improving data gathering and use of data. Coordinate and organize demand, and explore pooled procurement on a regional or global basis. Implement regulatory reforms, moving towards less reliance on branding as a signal of quality and encourage high-quality generic suppliers of drugs. Harmonize regulation across countries, going beyond local legal protectionist approaches to commodity regulation. Invest in improving G H S through preparedness for the prevention and management of outbreaks and epidemics.
In considering the role of vertical programmes and priorities, such vertical efforts can be an efficient way to achieve a time-limited target with explicit plans for future integration into a system-wide benefits plan. Large disease-specific health donors have a big role to play in supporting horizontal priority-setting through investments in building local capacity for its implementation, changing the way they support vertical programmes within a horizontally set benefits plan, and coordinating procurement across countries with lower purchasing power. In addition, more rigorous evaluations of procurement strategies (in addition to pooled procurement) are needed. Countries should also continue to gather and share information either on a regional or global level on health product pricing and quality. Platforms such as the Global Fund’s e-procurement hub (wambo.org) could provide a template for diseases beyond HIV, TB and malaria. It may be that donors can take on the role of coordinating and building or expanding existing platforms to offer global data on health products and market intelligence.Footnote 1
Key messages
Chapter 3.8 highlights the importance of financing as a tool for preparing for and responding to pandemics. A pandemic can wreak health, societal and economic havoc. Prioritizing common and global public goods for health and specifically for pandemic planning is complex and requires financing mechanisms at the national, regional and supranational levels. Key learning, including from COVID-19, is that:
Pandemic preparedness is subject to inherent market and collective action failures and is often underfunded.
Governments need clear strategies for funding preparedness.
Preparedness depends on strong health system foundations and contingency funding mechanisms that go beyond simply setting funds aside. It is crucial that funds can be mobilized quickly and in a coordinated fashion.
Key steps for planning responses include:
○ assessing existing activities and mapping value for money;
○ agreeing on the need for public financing for population-based functions (i.e. common goods);
○ identifying appropriate types of financing that reflect the complexity of determining resource needs and allow for nuanced cost estimation;
○ developing context-specific financing tools that include flexible funds and address accountability;
○ holding transparent discussions about trade-offs;
○ improving budget transfer mechanisms;
○ integrating domestic finance into multiyear budgets; and
○ managing and strengthening international collaboration.
International guidance and learning from COVID-19 can help inform preparations. Organizations including the World Health Organization (WHO) and the World Bank offer tools to help decision-makers. It is crucial that these are assessed for suitability to context and customized to the national and local setting.
Introduction
COVID-19 highlighted the catastrophic health, social and economic havoc that a pandemic can wreak. The widespread health and socioeconomic impacts of the COVID-19 pandemic devastated lives and livelihoods both directly and indirectly. Its impacts on health were not just the illness and deaths caused by the virus itself, but also its knock-on effects on noncommunicable diseases, mental health and health service delivery. Globally, COVID-19 caused major blows to the progress towards the Sustainable Development Goals (United Nations, n.d.) and disproportionately affected the poor and vulnerable groups in society. In 2020 alone, the global economy contracted by 3.6% (United Nations, 2021) and the pandemic further exaggerated disparities between individuals, groups, regions and countries (Blake & Wadhwa, Reference Blake and Wadhwa2020). Supranational/global plans for pandemic preparedness have proliferated and multilateral support for low- and middle-income countries (LMICs) is available in the form of soft loans (see Chapter 1.4). Yet, nationally, governments devote only a fraction of domestic resources to support national preparedness and capacity development. National pandemic preparedness strategies have often been unclear and have lacked realistic financial mobilization plans, as seen during the COVID-19 pandemic (The Independent Panel for Pandemic Preparedness & Response, 2021).
In terms of national health financing, there are specific aspects of funding pandemic preparedness that set it apart from the support required for personal health services. Supporting prevention and preparedness activities involves specific budgets and considerations of institutional capacity, including measurable costs with their own financing streams, as well as dedicated financing mechanisms (WHO, 2021a). Establishing adequate prevention and preparedness systems is a long-term process that varies country by country.
Critical prevention and preparedness activities go beyond the health sector and have implications for overall government, community and global systems (for a global response that takes into account the reasons for the emergence of new viruses, see the summary of the One Health approach in Box 3.8.1). While health system foundations necessary for pandemic preparedness often sit under the purview of the health sector and ministries of health, preparedness and response-related activities are often financed and implemented by a larger range of agencies and government sectors at national and subnational levels (e.g. national centres for disease control, customs/border control, defence agencies, emergency services and various regulatory agencies) (Global Preparedness Monitoring Board, 2019; World Bank Group, 2019b; WHO, 2021b). Budget transfer mechanisms are often used to move funds that serve the entire population across sectors and levels of government, enabling coordination and efficiency.
Established in response to the H5N1 highly pathogenic avian influenza, the One Health approach explicitly recognizes the influence of the human-animal interface and changing ecosystems on the spread of infectious disease. Various global bodies, including the WHO, the United Nations’s Food and Agriculture Organization, the World Bank and UNICEF, together produced a strategic framework, One Health, that focuses on priority areas for financing and implementation in order to diminish the risk and minimize the impact of epidemics and pandemics caused by emerging infectious diseases, including those of animal origin (i.e. zoonotic diseases) (CDC, 2021). The priority areas comprise of intelligence, surveillance, emergency response systems, strong public and animal health services and effective communication. Implementing One Health explicitly requires multidisciplinary, multinational and multisectoral approaches, which has implications for both governance and financing mechanisms (Food and Agriculture Organization of the United Nations et al., 2008).
Financing mechanisms for pandemic preparedness must be set up in a way that ensures that the necessary systems are already in place to respond when a pandemic (or other crisis) hits. Both nationally and globally, this requires proactive planning and mechanisms that can be quickly and flexibly activated. Due to the inherent uncertainty and fluid dynamics of such events, financing mechanisms that can be deployed rapidly and with strong systems of accountability are critical for an effective and timely response. This goes beyond setting funds aside, and rather comprises contingency funding mechanisms that can be quickly mobilized in ways that coordinate with and build upon other efforts.
This chapter focuses on those financing mechanisms that are distinct from and in addition to the general health system financing that relates to personal health services. These aspects of health financing are covered in other chapters in this volume. However, it is important to note that there are many aspects of personal health services that are critical to pandemic preparedness. In other words, the capacities required for effective pandemic prevention, preparedness and response generally rely on a strong health system foundation (WHO, 2021b).
In this chapter, we first define pandemic preparedness and set out the notions of common goods for health and market failures. We describe the particular challenges of financing pandemic preparedness, including high levels of uncertainty, limited resources and competing priorities, cross-border and cross-sectoral governance arrangements, and issues related to funding common goods for health. We outline how to decide what to finance and how to ensure value for money; we then examine the various financing mechanisms available. Throughout the chapter, we draw upon evidence from country examples to highlight lessons for health policy-makers.
What is pandemic preparedness?
Over the last few decades, there has been growing recognition that the world is unprepared for pandemics (Commission on a Global Health Risk Framework for the Future & National Academy of Medicine, Secretariat, 2016; Soucat, Reference Soucat2019). This was emphatically reinforced by the COVID-19 pandemic. Various national and international bodies have drawn up frameworks and strategic plans to anticipate and reduce the threat of new and existing hazards (Table 3.8.1). These instruments all share the common objective of setting countries, and the world, on a path towards a sustainable future, by introducing measures that minimize vulnerability and strengthen resilience. Generally, the instruments cover a broad remit across all-hazards and all-risks of public health concern as described in the WHO Health Emergency and Disaster Risk Management Framework (e.g. outbreaks of any disease or the occurrence of disasters due to natural hazards or chemical incidents (WHO Regional Office for Europe, n.d. a)). While the financing mechanisms and investment approaches are not necessarily distinct across all these risk domains, our focus is specifically on the financing for pandemic preparedness.

Table 3.8.1 Long description
The table has 10 columns: Name, About or purpose of prize, Prize amount, Stakeholders involved, Eligibility criteria and disease focus, How is prize awarded, Who was awarded, Type of technology, Targeted R and D stage, and I P R implication. It reads as follows. Row 1: XPRIZE Foundation (10 million U S D). About: Milestone inducement prize. Non-profit organisation that designs and hosts public competitions intended to encourage technological development to benefit humanity. Many of the prize competitions are not global health or neglected disease-specific. In 2008, the Foundation has recently partnered with the Bill and Melinda Gates Foundation to develop a prize for a better T B diagnostic tool. Stakeholders involved: Prize partners: B M G F; Qualcomm Foundation, A N A, American, Telemedicine Association, Arthur Clarke Center for Human Imagination, Continua Health Alliance, Health 2.0, H I M S S, I E E E, MemsIndustry Group, Point Clear Solutions, Open Photonics Inc., Quest, Shimmer, U S San Diego Clinical and Translational Research Institute, Wireless Life Sciences Alliance and Xamarin. Eligibility criteria: T B; The winning team was required to develop a tricorder device that: 1. accurately diagnose 13 health conditions; 2. capture five real-time health vital signs; 3. provide a compelling consumer experience. How is prize awarded? Any company can enter a competition-style prize, with awards to first and second place among competing teams from various companies. Who was awarded? Pennsylvania-based team, Final Frontier Medical Devices (first place). Taiwan-based finalist, Dynamical Biomarkers Group (second place). Type of technology: Diagnostics. Targeted R&D stage: Clinical testing and registration. The foundation conducts consumer testing at the Altman Clinical and Translational Research Institute. This testing included the same rigour and protocols as a clinical trial but focused on the objectives of the XPRIZE competition. I P R implications: No information found.
Row 2: E U Vaccine Prize (2 million Euros). About: Inducement prize competition launched in 2012 by the European Commission, with more prizes to be offered via the Horizon 2020 Research Funding programme. The prizes intend to accelerate the development of vaccines and solve common issues of vaccine access. Stakeholders involved: Donors: E U Research Council. Eligibility criteria: Cold chain development for vaccines. Competition criteria, includes alternative ways of formulating, preserving or transporting vaccines. How is prize awarded? Competition cash prize with a jury appraising submissions and deciding on winner. No particular approach was prescribed and competitors were invited to convince the jury that their solution could respond best to the competition criteria, including alternative ways of formulating, preserving or transporting vaccines. Who was awarded? CureVac G m b H (2014). Type of technology: Vaccines. Targeted R&D stage: Discovery, preclinical and clinical stages, and registration. I P R implications: Owner maintains I P R.
For the purposes of this chapter, we follow the Global Preparedness Monitoring Board (2019) (an independent monitoring and advocacy body) in defining preparedness as follows:
the ability (knowledge, capacities and organizational systems) of governments, professional response organizations, communities and individuals to anticipate, detect and respond effectively to, and recover from, the impact of likely, imminent or current health emergencies, hazards, events or conditions. It means putting in place mechanisms that will enable national authorities, multilateral organizations and relief organizations to be aware of risks and deploy staff and resources quickly once a crisis strikes.
The definition thus encompasses both “prevention” and “response” as part of being prepared.
Common goods for health and market failures
The financing rationale for pandemic preparedness presented in this chapter is informed by WHO’s Common Goods for Health agenda.Footnote 1 This defines common goods for health as all population-based functions or interventions that require public financing (supplemented by donor funding in some cases), regardless of whether they are delivered by public or private sector providers, and that fulfil the following conditions:
Common goods for health contribute to human health and sustained economic progress over the long-term.
Provision or preservation of common goods for health are subject to specific market failures, typically because they are either public goods (meaning they are non-rival – so the consumption of the good by an individual does not affect the amount available for others – and non-exclusionary – available for all to use (Samuelson, Reference Samuelson1954)), or they have large social externalities.
Despite their importance and the necessity of public financing to support them, common goods for health suffer from both market and collective action failures, and as a result are often underfunded and underprovided for relative to investments in personal, facility-based services (Gaudin et al., Reference Gaudin2019). For many common goods for health expenditures, which can be either capital or recurrent in nature, it is impossible to charge a price (or a fine) to some or all users or consumers of the function. This can discourage private actors from financing common goods for health for fear that others will “free-ride” on their investments, and it limits optimal production. Pandemic-related activities can be usefully classified as common goods for health (Yazbeck & Soucat, Reference Soucat2019). These activities are notable for their market and collective action failures, which lie at the heart of their underinvestment. This means that the predominant source of funding for pandemic preparedness activities will be through public revenues as described later in this chapter.
In the next section we look at how to decide what preparedness activities to finance at both national and global levels, and how to ensure value for money.
Financing pandemic preparedness: the challenges
Despite the resource gaps in their strategies for pandemic preparedness, many countries have yet to commit to firm plans for financial mobilization. This is partly related to the high levels of uncertainty in this area, the delayed and often difficult-to-measure benefits of preparedness financing and differing attitudes to risk among decision-makers. Governments’ failure to commit is also because pandemic preparedness is only one of many competing priorities for health finances. Global institutions, too, must decide how best to fund crisis preparedness.
Challenge 1: How to decide how much and what to finance?
Deciding what to finance at the country level depends on first assessing the existing pandemic preparedness activities and resources and then identifying the gaps, in the context of total available resources. While the activities for prevention and preparedness are varied and many, guiding questions can be asked of each activity’s cost estimate, such as:
Which threats are being addressed (e.g. pandemic only, or broader emergency and disaster risks)?
What stage of the pandemic do activities correspond to: acute, protracted or no one particular stage?
Do they include animal health along with human health activities?
Do they include health system-related activities that help to improve health even in times of no pandemic?
Are they health-only or do they include non-health-related activities?
At the global level, there have only been a few attempts to understand the resource needs for preparedness. What is clear is that greater investment is needed than has occurred traditionally. Pre-COVID-19, the World Bank estimated that global investments in preparedness need to be approximately US$ 4.5 billion per year (World Bank, 2012). Others estimated even larger sums such as US$ 12.3 billion in one-time capital costs, with US$ 13.8 billion yearly recurrent costs (Peters et al., Reference 569Peters2019). Estimates made after the onset of the COVID-19 pandemic by McKinsey and Co. put the figure at many more billions of dollars – US$ 285 billion to US$ 430 billion over 10 years, with many of the costs being incurred as start-up capital costs in the first few years, and sustained annual costs over the time frame (Craven et al., Reference Craven2020).
Beyond estimating potential costs, there has also been an effort to track external assistance for common goods for health at the global, regional and country levels (Schaeferhoff et al., Reference Schaeferhoff2019). One study estimated that in 2017 there was US$ 0.48 billion allocated to global functions for pandemic preparedness and an additional US$ 1.36 billion for control of cross-border disease global functions (e.g. information exchange, early warning and response systems, risk assessment). Despite these efforts, there is a clear disconnect between the amounts committed as external assistance and the amounts needed (Yamey et al., Reference Yamey2019).
At the country level, the activities to be financed can be established as part of a pandemic risk management plan. When undertaking such plans, it is first useful to undertake a resource mapping exercise to understand where resources are currently being allocated, so that gaps and areas for improvements can be identified. Tools to conduct such mappings include the World Bank’s Health Security Financing Assessment (HSFA) tool and WHO’s REMAP tool (Osornprasop et al., Reference Osornprasop2020; WHO, 2019b). Once resources have been mapped, these can be integrated into planning for current and future preparedness activities, and also costed. WHO developed a National Action Plan for Health Security (NAPHS) framework, which provides a costing tool and has been implemented in several countries. The NAPHS plans conducted to date show high variation in cost distribution and estimates within NAPHS technical areas (World Bank Group, 2019b).
When using these costing tools, policy-makers must make careful consideration of cost drivers and the extent to which they are assessed in these models. For example, in Nigeria, three different pandemic costing tools were comparatively implemented and it was found that while in reality the high cost of developing and maintaining a strategic stockpile of medical countermeasures was a very large cost driver, this was not included as a category in several of the tools. In a similar costing exercise undertaken in Tanzania, animal health activities, such as animal vaccination, were another potentially large cost driver, but did not always feature in costing exercises (Mghamba et al., Reference Mghamba2018). Therefore, in decision-making when planning for pandemic preparedness, it is important to weigh the benefits and constraints of different tools and frameworks and consider how accurately they will estimate resource needs.
Challenge 2: How to ensure value for money?
To understand what constitutes a good investment in pandemic preparedness, it is necessary to look at the value for money of the different potential activities. The cost–benefit outcomes for pandemic preparedness are usually quite favourable due to the large impacts of catastrophic events compared to the costs of prevention, and the related co-benefits of tackling other health issues such as antimicrobial resistance (AMR) (Jonas, Reference Jonas2013). A key challenge, however, is to understand the probability of the catastrophic events occurring and to achieve the right balance of investment for preparedness without drawing resources from other essential activities. The assessment of value for money of activities for all health emergency preparedness also faces challenges such as high levels of uncertainty, uneven impacts and the differing perspectives (including attitude to risk) represented in the health system (Branch-Elliman, Safdar & Nelson, Reference Branch-Elliman, Safdar and Nelson2021).
Moreover, it is not a one-off decision. Policy-makers need to establish and maintain systems for ongoing assessments of the value for money of prevention and preparedness activities in order to continuously inform financing decisions based on the expected costs, the potential impacts from different risks, and overall budget availability. In addition, other elements besides cost may factor into decision-making. For example, the “rule of rescue” principle (when the perceived health needs of an individual or particular group override all other considerations) or wider societal priorities might lead policy-makers to invest in certain areas of preparedness regardless of their cost–effectiveness. The value-for-money considerations will also need to account for financial considerations of affordability and understanding of where costs are incurred. For example, costs for a large vaccine development programme may be incurred at the global level, while the delivery costs for the subsequent vaccinations would be borne by health system budgets at national or subnational level.
Once resource needs are estimated and value for money is assessed, financing mechanisms need to be established to execute preparedness activities. The next sections provide understanding on how to finance the activities needed for pandemic preparedness.
What financing mechanisms are available?
Financing mechanisms for pandemic preparedness sit at the supranational/global, national and subnational levels. While this section focuses primarily on national and subnational mechanisms, it also provides a brief overview of supranational/global mechanisms. First, however, we look at the recommendations for preparedness actions made by a number of high-level global expert review panels,Footnote 2 which helps provide the strategic context for the financing mechanisms we then go on to describe.
High-level recommendations
Despite providing separate analyses and recommendations, there is convergence around several global and domestic financing priorities needed for preparedness – especially in the wake of the COVID-19 pandemic. In its report on Improving Pandemic Preparedness by 2025, the Wellcome Trust (2021) summarizes these as follows.
1. Pooled financing at the global level for global public goods
Funding should be pooled at the global level to finance global public health goods, such as global surveillance of major health threats, grant financing to regional or country-level investments, manufacturing and delivery of countermeasures and R&D (G20 High Level Independent Panel on Financing the Global Commons for Pandemic Preparedness and Response, 2021; The Independent Panel for Pandemic Preparedness & Response, 2021; Pandemic Preparedness Partnership, 2021). Multilateral institutions, governments and nongovernmental organizations should provide contributions to these funds based on their ability to pay, amounting to approximately US$ 10 billion per year (G20 High Level Independent Panel on Financing the Global Commons for Pandemic Preparedness and Response, 2021; The Independent Panel for Pandemic Preparedness & Response, 2021). The governing bodies to allocate and monitor funding from these types of pools could be embedded in pre-existing agencies (e.g. the Investment Board of the World Bank), or set up as a new institution (e.g. an international pandemic financing facility) (G20 High Level Independent Panel on Financing the Global Commons for Pandemic Preparedness and Response, 2021; The Independent Panel for Pandemic Preparedness & Response, 2021).
2. Recommendations for Multilateral Development Banks (MDBs)
MDBs should include pandemic preparedness in their core mandates and add it into their major assessment tools (e.g. International Monetary Fund’s (IMF’s) Article IV) (G20 High Level Independent Panel on Financing the Global Commons for Pandemic Preparedness and Response, 2021; The Independent Panel for Pandemic Preparedness & Response, 2021; Pandemic Preparedness Partnership, 2021; McKee, 2021). Influential governments should raise pressure on these banks to ensure they increase lending for health and require health-related considerations to be incorporated into banks’ and borrowers’ business strategies, risk management frameworks and targets (G20 High Level Independent Panel on Financing the Global Commons for Pandemic Preparedness and Response, 2021; McKee, 2021).
3. Domestic financing and preparedness
Governments should renew their focus on resilient domestic finances for preparedness (G20 High Level Independent Panel on Financing the Global Commons for Pandemic Preparedness and Response, 2021). As part of this, each country should consider the cost implications of a NAPHS, including how it fits with overall health system financing, and ensure that any external financing for these objectives complements the domestic financing agenda (G20 High Level Independent Panel on Financing the Global Commons for Pandemic Preparedness and Response, 2021). Measurable targets and benchmarks for countries’ pandemic preparedness and response capacities are an important element to monitor progress (The Independent Panel for Pandemic Preparedness & Response, 2021). As part of this, WHO should advise on how National Health Accounts systems can be used to define and track expenditure on preparedness activities to help monitor and incentivize investments in preventive services for health security (G20 High Level Independent Panel on Financing the Global Commons for Pandemic Preparedness and Response, 2021; McKee, 2021).
It is the financing mechanisms available at the national level that we turn to first.
National-level mechanisms
As mentioned above, investments in pandemic preparedness activities are made in the context of competing demands for scarce budget resources. Countries face one or both of the following challenges: (i) fiscal, where they do not have enough resources; and (ii) prioritization, where they do not give high priority to investments in prevention and preparedness. The latter may be for several reasons, depending on preferences, incentives, politics or, as is likely, a mix of all of these.
At the national level, strategies to increase the investment base for pandemic preparedness include generating domestic resources from taxes or levies, introducing incentive mechanisms that increase awareness of the risks of infectious disease outbreaks to businesses, leveraging insurance models and pooling donor resources within specific prevention and preparedness and response funds or institutions (International Working Group on Financing Preparedness, 2017).
The precise form of the financing mechanism used not only depends on the level at which the prevention and preparedness activities reside, but also on the nature of what needs to be financed. Financing for pandemic preparedness can generally be differentiated into three types:
1. upfront capital investments for systems and infrastructure;
2. sustained, long-term financing for ongoing operations and recurrent costs; and
3. rapidly scalable surge financing that is, ideally, strategically identified in advance of an emergency, and able to be quickly deployed (Bill & Melinda Gates Foundation, 2021).
Here, we consider the available financing mechanisms in terms of revenue and the role of domestic resources; external assistance and loans; purchasing/payment mechanisms; incentivizing preparedness; and a variety of options for public financial management systems to enable both flexible and accountable financing arrangements.
Revenue and role of domestic resources
Domestic expenditure responsibility is often split between central (national) and state/local (subnational) budgets (International Working Group on Financing Preparedness, 2017). For example, in 2016 approximately 75% of all health security-related funding occurred at the provincial level in Viet Nam (see the Evidence in practice section) (Osornprasop et al., Reference Osornprasop2020). Given the need for a coordinated pandemic preparedness strategy, the dynamic between levels of government requires not only targeted governance platforms, but also financing mechanisms that can incentivize cooperation and joint approaches. For example, conditional transfers can influence and support allocation decisions by only allowing funding to be allocated when certain conditions and standards have been met (Jiménez Fernández de Palencia & Pérez-Foguet, Reference Jiménez Fernández de Palencia and Pérez-Foguet2011; Watabe et al., Reference Watabe2017). This approach is especially useful in devolved settings, where priority-setting and budget allocation decisions are made at subnational levels of government.
These explicit financing incentives also require regulatory, governance-related interventions and systems in place that allow for adaptation in the face of crisis. For example, in the face of COVID-19, the Brazilian intergovernmental transfer system was found to lack adaptability to transfer funds based on epidemiological need rather than on population size, and as a result funding for the pandemic response at the subnational level was insufficient (Fernandes & Pereira, Reference Pereira2020). Argentina, in contrast, successfully leveraged its pre-existing conditional grant system to enable fast and responsive funds to meet the needs created by COVID-19 (Barroy et al., Reference Barroy2020b; Sabignoso, Reference Sabignoso2021).
External assistance and loans
In many LMICs, domestic public resources are complemented by development assistance funding (see Chapter 1.4). This can include linking development assistance for capital or one-time expenses with domestic budget funding for recurrent costs for ongoing operations and human resources (World Bank Group, 2019b). Development assistance can also supplement domestic budget allocations for preparedness with matching grants, or by converting debt to grants upon reaching agreed-upon performance benchmarks through “buy-down” approaches. When executed successfully, this type of complementarity and strategic pooling of resources can contribute to a domestically led and sustained preparedness system. The dominant role of domestic financing for national and subnational level preparedness activities is seen across a range of countries, including Indonesia, Kenya, Lao People’s Democratic Republic, the Philippines, Uganda, Viet Nam, to name a few (Barroy et al., Reference Barroy2020b; Development Initiatives, 2017; Hanvoravongchai et al., Reference Hanvoravongchai2010; Osornprasop et al., Reference Osornprasop2020; Panelo, Reference Panelo and Caballero-Anthony2009).
Global mechanisms that support national-level financing of pandemic preparedness include emergency financial reserves; building contingency capacity for disasters into planning processes; emergency supply prepositioning and training; and forecast-based financing. While external assistance can play a critical supplementary role, it can also have unintended negative consequences. The delay between donor pledges and actual funding received can create inefficiencies in response activities. Such delays have obliged businesses and other stakeholders in recipient countries to use credit to meet their operating expenses. Procurement often requires money in the purchasing body’s bank before placing an order and manufacturing also takes time, which can delay the delivery of often critical goods and services. These delays are compounded by the weak health systems in many countries which are the true binding constraint to effective preparedness capacities (Board on Global Health et al., 2016). As a result, there are important considerations to be considered when utilizing these global funding mechanisms to ensure they achieve their end goals in the most effective and efficient way possible.
Flexible, accountable public financial management systems
Timely, agile and sustainable financing is critical to pandemic preparedness financing. Systems for managing public finances for pandemic preparedness therefore need to be flexible, yet still retain their accountability. Beyond revenue availability, the public financial management systems through which funds are allocated, expended and accounted for are central to meeting these objectives.
Public financial management objective 1: flexibility
Lessons from the Ebola epidemic in west and central Africa in 2014 highlight that flexible (unearmarked), rapidly disbursable funds are critical to meet the ever-changing needs of a public health emergency (World Bank Group, 2019a). The financing-related problems encountered in the epidemic included: delays in disbursement of funds, ineffective use of financing, bureaucratic delays, poor transparency and information sharing, lack of accountability and systems to track funds, low capacity to properly procure and enforce financing management – and all of these issues relate to the mechanics of financing rather than the overall resource envelope (World Bank Group, 2019a).
The need for financing mechanisms that are quick, easy to activate, flexible, and accounted for was seen again in the COVID-19 pandemic (Barroy et al., Reference Barroy2020b). Delayed and ad hoc funding is often at the heart of humanitarian agency concerns about their ability to effectively respond to crises (OECD, 2017). However, as discussed above, projecting how much to budget for preparedness activities in the face of resource constraints can be challenging due to the uncertainty of events (Board on Global Health et al., 2016). Still, the level of agility of fast and flexible spending can be enabled through prenegotiated plans delineating ex post and ex ante financing (Board on Global Health et al., 2016). Some countries may make public financial management adjustments to expand and reprioritize budgetary space to allow funds to flow to preparedness activities (Ndii, Reference Ndii2010).
Additional considerations are particularly necessary in fragile and conflict-affected settings where government capacity for intervention is severely limited. The collective action and consensus building essential for sustainable government action in favour of the commons is a special challenge in countries where societies have been fractured (Adulyanon, Reference Adulyanon2012). At the same time, investing in preparedness activities in these settings has particular urgency, given the potential deficits in the capacity, willingness and ability of the government to ensure provision of these goods. Actions to finance pandemic preparedness in these settings can include: targeted capacity-building efforts; coordination of external agencies’ funding; or, in cases where government structures and processes are too weak, establishment of a substitute or shadow process that can be transitioned to domestic institutions as soon as possible.
In countries where governments have greater capacity to act, programme budgeting offers a way of managing public finances that can allow the flexibility that responding to a pandemic requires. The multisectoral nature of pandemic preparedness means that different parts of the public sector may be responsible for both financing and provision of these activities. From a budgetary perspective, the structure of a country’s budget can place constraints on effectively matching financing with prevention and preparedness objectives (Barroy et al., Reference Barroy2018). For example, rigid line-items can be obstacles to the cross-cutting approaches needed to drive efficiency in organizing, delivering and rapidly deploying prevention and preparedness activities (Sparkes, Kutzin & Earle, Reference Sparkes, Kutzin and Earle2019). Moving away from input-based budgets and towards budgets that are formulated and executed based on programmes can help strengthen the linkages between budget allocations and government priorities, as well as foster the flexibility to quickly adapt budgets in the face of crisis (Barroy et al., Reference Barroy2020a). Australia’s experience of programme budgeting provides an example of how such arrangements can support cross-cutting investments in common goods for health (Australian Government, 2017) (Box 3.8.2).
Dedicated resources from general tax revenues finance Australia’s programme budget for “health regulation, safety and protection”. Its required outcome includes key performance indicators for:
disease surveillance and information systems;
immunizations;
public health security response;
AMR regulations;
stockpiling of medicines.
The table shows these indicators do not sit within any specific departments or health programmes; they are all at the level of the “health portfolio” or sector. Additionally, the budget for these health sector activities is directly linked with other budgetary programmes, including some from outside the health sector. This budgeting approach recognizes the complementarity across sectors that is needed to achieve particular outcomes.
Outcome 5. Regulation, Safety and Protection
Protection of the health and safety of the Australia community and preparedness to respond to national health emergencies and risks, including through immunizations, initiative, and regulation of therapeutic goods, chemicals, gene technology and blood and organ products
Program 5.2: Health Protection and Emergency Response
Program 5.3: Lmmunization
Selected Linked Programs to Outcome 5 outside of Health Sector
- Department of Agriculture and Water Resources
Program 2.1: Biosecurity and export services
- Department of Education and Training
Program 1.2: Child care benefit
- Department of the Environment and Energy
Program 1.6: Management of hazardous wastes, substances and pollutants
- Department of Human Services
Program 1.2: Services to the community
The flexibility that programme budgeting affords was on display in the COVID-19 response, with New Zealand, Mexico and South Africa all adding a COVID-19 budgetary programme to the health budget where they were then able to redirect programme envelopes for the response (Barroy et al., Reference Barroy2020b).
Other countries have worked around budget inflexibility by introducing exceptional spending measures. These measures, often introduced by executive decree, can allow for rapid budget reallocation, activation of contingency funds, emergency spending authorization, simplified approvals and rapid fund disbursement to subnational levels (WHO, 2022). Having systems and plans in place in advance of a pandemic enables a faster response. This may also include the revision of finance laws to ensure that these sorts of flexibilities are baked into legislation for certain crisis circumstances.
Effectively integrating domestic financing for pandemic preparedness into annual and multiyear budgets requires targeted efforts. Funding for cross-cutting activities (such as laboratories, training, surveillance or information systems) requires pooled resources and coordination among the health sector and other relevant sectors (Sparkes, Kutzin & Earle, Reference Sparkes, Kutzin and Earle2019). This coordination can be achieved through a health sector medium-term expenditure framework (van Eden, Gentry & Gupta, Reference van Eden, Gentry, Gupta, Lam, 570Rodlauer and Modernizing2017), public expenditure reviews (World Bank Group, 2017) or other processes that build on evidence-based, high-quality diagnostics of health challenges and policy effectiveness.
These processes provide clear priorities for spending over time, particularly in the face of both fiscal and political constraints, and involve focusing on strengthening national and subnational institutions to deliver cross-cutting activities. New Zealand, for example, has implemented a budgetary framework that enables cross-agency funding as a way to improve collaboration and reduce the transaction costs of working across agencies (The Treasury, 2015). The framework contains three possible funding models to determine both government and financing arrangements associated with delivering activities across agencies that contribute to shared outcomes: cost recovery charges, wherein one agency buys a service from another agency and recovers costs through a service fee; pooled funding, in which a group of agencies combine funds in order to share costs to achieve a common goal; and centrally determined funding, when ministers determine cross-agency collaboration is needed and then identify funding sources.
Public financial management objective 2: accountability
The expenditure flexibility required for pandemic preparedness must be matched with strong accountability mechanisms. Often opaque country financial management systems and outdated information systems make financial accountability difficult and a persistent problem (World Bank Group, 2019a). This dynamic not only lends itself to corruption and lack of transparency but also to inefficiencies and wasteful spending (Khasiani et al., Reference Khasiani2020). Budget accountability mechanisms include ex post and/or risk-based controls, regular updates to public spending systems, developing performance frameworks, using programme envelopes for expenditure tracking and ensuring that finance authorities take a lead role (Barroy et al., Reference Barroy2020a). For example, both France and China have introduced and strengthened tracking procedures that take into account clearly defined policy goals and targets.
Purchasing/payment mechanisms
Pandemic scenarios likely require funding arrangements to pay health workers for working overtime and taking on additional responsibilities, establishing diagnosis and treatment facilities, undertaking vaccine R&D and more. However, there can be financial obstacles that hinder a country’s ability to pay. Countries require systems established in advance of a crisis which allow for budget flexibilities and reallocation to pay front-line health workers under pandemic conditions (Board on Global Health et al., 2016; Mathauer, Dkhimi & Townsend, Reference Mathauer, Dkhimi and Townsend2020). Beyond reallocation mechanisms, these adaptations include lifting budget caps so that providers can actually receive the additional funds needed to respond to the pandemic. Facility accreditation changes (and established plans for flexibilities under crisis conditions) can also enable the emergency activation of certain services and providers. A survey of 31 LMICs during 2020 found that half had made this type of accreditation change in order to expand service provision related to COVID-19, particularly through private sector providers. These adaptations all have implications for information system management and governance mechanisms that similarly can be put in place in advance and facilitate coherence between the public and private sectors.
Incentivizing preparedness
Financing mechanisms for preparedness go beyond funding issues and extend to incentivizing investments into these critical activities. These mechanisms are put forward in recognition of the market and political failures until now associated with prioritizing investments in preparedness activities. These incentive approaches can include offsetting negative externalities from business activities by requiring appropriate investments from the private sector in risk mitigation, prevention and preparedness (International Working Group on Financing Preparedness, 2017). There are also calls to incorporate health security risks into macroeconomic bond ratings and investment criteria (International Working Group on Financing Preparedness, 2017; World Bank Group, 2019b). IMF Article IV consultations, which provide country surveillance to identify economic and financial risks, can also be extended to include infectious disease and health security risks. Similarly, the World Bank’s Country Policy and Institutional Assessment and Systems Country Diagnostics are opportunities to integrate preparedness into economic risk and institutional assessments (Global Preparedness Monitoring Board, 2019).
None of these national-level financing mechanisms can ensure pandemic preparedness in isolation. However, they can be critical enablers when taken in conjunction with one another, along with effective planning, political commitment and dedicated implementation capacities. They can also be complemented/supplemented by global and regional mechanisms, as we describe briefly below.
Global and regional mechanisms
Beyond the national-level mechanisms, global and regional mechanisms for pandemic preparedness financing also play important roles. After all, financing for pandemic preparedness represents a vital investment in global solidarity to avoid or mitigate catastrophic pandemic costs. As noted by the Global Preparedness Monitoring Board 2020 Report, “global preparedness is not simply the sum of national preparedness” (Global Monitoring Preparedness Board, 2020). Mechanisms for pathogen tracking, early alert systems, R&D, regulatory capacity-building and harmonization, allocation of countermeasures, stockpiles and supply chains are all necessary at the global and regional level and require dedicated funding. Regional networks and global coordination of funding and response, as well as sharing general best practices around financing preparedness, are all global prevention and preparedness activities. To establish each of these activities, a range of financing mechanisms to fund them should be considered (Global Monitoring Preparedness Board, 2020). Here, then, we consider the potential of pooled resources.
Pooled resources for pandemic preparedness
COVID-19 exposed clear limitations in pre-existing financing mechanisms that were not at a large enough scale to meet needs, and therefore new mechanisms and donor resources had to be mobilized rapidly for the response (Global Monitoring Preparedness Board, 2020). Pooling is the accumulation and management of prepaid financial resources on behalf of some or all of the population (Mathauer et al., Reference Mathauer, Dkhimi and Townsend2020). Many global mechanisms focus on pooled funding, primarily from HICs, to support the response to pandemics and other emergencies (e.g. COVAX), as well as to incentivize investments in preparedness and prevention at the country level.
At the global level, existing financing mechanisms for pandemic response include the WHO Contingency Fund for Emergencies, which since its inception in 2015 has funded operational and response activities. As the scale of the COVID-19 pandemic and response grew, additional funding mechanisms were created or repurposed, including the development of COVAX (Eccleston-Turner & Upton, Reference Eccleston-Turner and Upton2021), and specific funding windows provided by the Global Fund and the World Bank (Bump, Friberg & Harper, Reference Bump, Friberg and Harper2021). Investments are also being made to build vaccine and other production capacities in LMICs. The pre-COVID-19 pooled global funding mechanisms often targeted specific functions, including vaccine and supply stockpiles, insurance systems, cross-border contagions or global coordination functions, including within WHO.Footnote 3 For example, the World Bank’s Pandemic Emergency Finance Facility is an insurance system established in the wake of the Ebola crisis in 2014 to enable the rapid mobilization and deployment of funds (Box 3.8.3).
Response to the Ebola crisis in 2014 was hampered by the inability to rapidly mobilize and deploy funds. To address this issue, the World Bank established its PEF insurance system which has been in operation since July 2017. It provides coverage for countries already deemed eligible for financial assistance from the International Development Association against the risk of pandemic outbreaks. The coverage consists of a combination of insurance bonds and derivatives and a donor-funded cash window for accessing loans. Importantly, the PEF does not provide funds for preparedness, and rather it is meant just for response needs. The facility has sought to create a market for pandemic risk insurance that draws on funds from the private sector through (catastrophe) bonds and swaps (a temporary agreement between two parties to exchange cash flows or liabilities from other financial instruments, often used to reduce financial risk) in return for highly lucrative interest rates. However, due to the relatively high threshold for countries to be able to access PEF funds, there are concerns about its functionality and utility (Brim & Wenham, Reference Brim and Wenham2019).
In learning from the COVID-19 experience, there was a clear need for more coordinated action to strengthen health system foundations, as well as to rapidly mobilize needed resources for pandemic preparedness at a global level. In light of this, The Pandemic FundFootnote 4 was established in 2022 with the objective to provide additional, long-term financing and technical support to LMICs in the areas of health systems strengthening and pandemic preparedness (The Pandemic Fund, 2024). By the time of the first round of grant allocation, The Fund had already raised US$ 2 billion in seed capital from governments, philanthropies and the private sector (The Pandemic Fund, 2023). The first round of funding awarded 37 country recipients with funds to strengthen disease surveillance and early warning systems, laboratory systems and human resources. Many of these country projects involve efforts that will have wider benefits to neighbouring countries through the One Health approach by building up cross-border and regional collaboration. There is a need to ensure, however, that the implementation arrangements and application of these projects and activities do not create new, parallel efforts or systems and are rather aligned with country systems.
As mentioned, global activities have transnational benefits that may extend regionally or globally. For this reason, both revenue mobilization and pooling mechanisms may also sit at regional levels. One such an initiative is Regional Disease Surveillance Systems Enhancement (REDISSE). Like the PEF, REDISSE was set up in the wake of the 2014 Ebola epidemic and is funded by the World Bank. Both a surveillance and response programme, it takes a regional approach across 11 countries in west Africa to strengthen routine systems to prevent and detect health threats, taking advantage of regional economies of scale (World Bank Group, 2019a).
Before setting out our conclusions, we present a case study of Viet Nam, as an example of a lower middle-income country that undertook a review of its health security financing in the light of recent experience of epidemics and pandemic.
Evidence in practice: financing pandemic preparedness in Viet Nam
Since 2000, Viet Nam has encountered several notable epidemics, such as avian influenza (H5N1) in 2003, influenza H5N6 and the pandemic of H1N1 in 2009. Given the history and the ever present threat of outbreaks and public health emergencies, Viet Nam conducted a HSFA (Osornprasop et al., Reference Osornprasop2020) using a tool developed by the World Bank to better understand the country’s practices around health security financing based on data from the fiscal year 2016.Footnote 5 Health security expenditures and activities were identified using the Joint External Evaluation structure.
From the analysis, the total health security expenditure, which included central and provincial levels, was estimated to be US$ 181.2 million (0.09% of gross domestic product, and 0.29% of the total government expenditure), almost 75% of which was spent at the provincial level.Footnote 6
The government funded the largest share of health security activities in the country (77%), followed by external aid (12%), which was spent primarily at the central level. In order to transfer government funds to the implementing agencies, they used annual budget allocations for recurrent, investment and national target programmes, where recurrent budget allocations accounted for 66% of total health security expenditure. Additionally, their systems allowed for contingency funds and budget, financial and national reserves to be triggered at a time of public health emergency.
Differences in health expenditure at the provincial level were found, where provinces on the country border as well as those provinces that were empowered to mobilize their own revenues, where sufficient, to cover health security spent a higher amount on health security activities. At both the central and provincial level combined, spending on preparedness activities was the highest proportion of expenditure (16%), followed by food safety, zoonotic diseases and workforce development (all between 12% and 15%).
During the 2003–2006 avian influenza outbreak, most domestic funds came from a contingency fund within the recurrent budget allocated to ministries and localities. This was already in place: once the necessary authorities declared an epidemic of public health concern, a contingency fund could be activated for the use of prevention and response activities. The central level fund was allocated to provinces to cover 50% of expenses relating to prevention and response of the epidemic, such as culling of infected poultry, while the remaining 50% was covered by the local level contingency fund. Supplementary budgets were also approved through the Prime Minister, which came from the contingency fund from the central budget, budget surplus revenues and loans from the credit balance.
The analysis identified significant challenges in the planning and financing of epidemic and pandemic preparedness. Viet Nam is working to improve and enforce close cooperation and effective coordination across sectors and levels of government for the accountability and funding of these interdisciplinary activities. However, at the time of the study, there was clear duplication in mandates and mechanisms for information sharing across agencies. Without clear coordination, activities such as disease surveillance lack integration, especially across geographical areas. Additionally, important sectors such as agriculture and tourism were rarely accounted for in planning and coordination activities. These deficiencies highlight the importance of establishing and implementing governance arrangements to enable the coordination and collaboration required across different levels of government and between sectors.
Another challenge lies with the planning efficiency and budgeting processes in the country. Recurrent and nonrecurrent funding for pandemic preparedness is based on the previous year’s amount rather than projected need. Reserve budget is allocated on a per capita basis, and additional amounts are specified by an input-based budget structure, which does not account for the cross-sectoral nature of the activities. Proposed budgets are often higher than the approved funding, which is dependent on the amount of external aid and local budget capacity. This often results in lower funding allocations in poorer areas, thus exacerbating existing inequalities.
The report provided a call to action to improve and efficiently plan and allocate necessary funding for preparedness activities. The actions identified included improved information sharing, shared planning across sectors, integrated disease surveillance, increased understanding of actual workload and a budget for these activities across the central level of government.
Policy relevance and conclusions
Evidence-based principles for establishing pandemic preparedness imply actions that strengthen existing systems, ensure business continuity plans with continuous learning to refine systems and strategies and are supported by adequate and appropriate financing mechanisms. This involves a continuous process of planning, exercising, revising and translating into action national and subnational pandemic preparedness and response plans (WHO Regional Office for Europe, n.d. b).
Establishing pandemic preparedness capacities requires targeted financing mechanisms to ensure funding commitments are translated into activities and interventions. Despite the recognized importance of pandemic preparedness, investments have often been limited or lacking due in part to the uncertain nature of preparedness and risk. As exemplified by the Viet Nam case study, the countries that have taken action to dedicate resources and establish financing mechanisms tend to be those spurred into action by their own particular experience of a health crisis. In the context of COVID-19, however, all countries have now experienced such a crisis. Financing pandemic preparedness must be a core government and global function.
The lessons from countries that have worked both to establish preparedness capacity and to respond to crisis show that effective financing goes beyond resource commitments and considers public financial management mechanisms and incentive structures. These financing mechanisms go beyond health budget allocations and consider transfer mechanisms to ensure coordination across multiple sectors (including the health sector) and multiple levels of government. Good governance and stewardship of preparedness, national and multisectoral coordination, political will and previous experience with pandemics have been found to be predictors of better mobilization and allocation of funds for prevention and preparedness (Hanvoravongchai et al., Reference Hanvoravongchai2010).
Financing mechanisms that support preparedness activities require budgetary space and institutional capacities that include funding for both the capital and recurrent expenditures required. These are measurable, annualized costs that require dedicated financing streams. Financing for activities that support preparedness requires proactive planning, systems and mechanisms that can be quickly and flexibly activated. Due to the inherent uncertainty of these events, the prepositioning of financing mechanisms that can be deployed quickly and with strong accountability systems is critical for an effective and timely response. Prepositioning goes beyond setting funds aside, and rather considers contingency funding mechanisms that can be quickly mobilized.
Importantly, financing pandemic preparedness should not be viewed in isolation, separate from the overall health system or other public financing priorities. For the purposes of this chapter, we have focused on distinct characteristics of pandemic preparedness. However, in practice these financing mechanisms need to be well-coordinated and integrated within overall public investments that promote and protect health and well-being and those that protect against emergencies more broadly. Furthermore, these investments can either leverage existing systems, or can have beneficial spillover effects on non-disease control measures, for example through improved information systems for health care or additional hospital capacity. Therefore, the societal gains from investments and sustainable financing of pandemic preparedness are not limited to the cost savings related to averting or being prepared for a pandemic, but also in relation to strengthening the foundations of the system for other health needs.Footnote 7
Key messages
Chapter 3.9 explains how payment mechanisms should respond to the notion of antibiotics as global public goods. Global public goods are goods and services whose benefits are universal in scope. Antimicrobial resistance (AMR) poses a major health and economic threat worldwide, making novel antibiotics a global public good. Payment mechanisms have an important part to play in encouraging crucial R&D. Key learning includes that:
Antibiotics are essential global public goods, but rising antimicrobial resistance is rapidly undermining their effectiveness worldwide.
The antibiotic development pipeline has collapsed, as traditional patent-based market incentives fail to generate sufficient returns for industry.
Antibiotic R&D faces high scientific risk, long timelines, high costs, and weak commercial viability, particularly at clinical and market-entry stages.
Numerous global and national incentive programmes have been established to support, fund, and coordinate antibiotic R&D.
Existing efforts rely mainly on push incentives, such as grants, which support early research but do not ensure successful commercialization.
Pull incentives, such as market entry rewards and subscription payment models, are essential to correct market failure by delinking revenues from sales volume while supporting antimicrobial stewardship and patient access.
Sustainable solutions require coordinated global action integrating push–pull incentives, regulatory harmonization, and One Health principles.
Introduction
Alexander Fleming famously discovered the first modern antibiotic, penicillin, in 1928 – revolutionizing the practice of medicine. Although penicillin was not mass produced until the early 1940s, the subsequent decades saw a boom in new antibiotics and antibacterial classes (Silver, Reference Silver2011). By 1990, 31 new antibiotic classes had been discovered or patented (Pew, Reference Pew2016; Silver, Reference Silver2011). Today, antibiotics are indispensable to routine medical practice for the treatment of mild to severe antimicrobial infections, such as urinary tract infections, tuberculosis (TB), pneumonias and blood stream infections; preventing post-surgical infections; and managing immune-compromised individuals, such as cancer patients receiving chemotherapy.
AMR: causes and effects
However, growing AMR is rapidly pushing our existing antibiotic arsenal into obsoletion. AMR is a biologic process whereby bacteria develop mechanisms over time to escape or buffer antibiotics, making the drugs ineffective. Constant overuse and poor regulation over antibiotic consumption in human and agricultural settings has accelerated AMR in recent years. Between 2000 and 2015, global antibiotic consumption increased by 65%. This can largely be attributed to unregulated use in low- and middle-income countries (LMICs) (Klein et al., Reference Klein2018). The World Health Organization’s (WHO’s) Global Antimicrobial Resistance and Use Surveillance (GLASS) Report for 2021 revealed growing resistance rates to key antibiotics used for common infections (WHO, 2021a). For instance, first-line drugs for urinary tract infections including co-trimoxazole and ciprofloxacin are reaching average resistance rates of 50% and 30%, respectively, for common urinary pathogens.
Today, the impacts of AMR are already high, and they are growing rapidly. Currently, more than 700 000 people die worldwide from drug-resistant pathogens annually (Review on Antimicrobial Resistance, 2016).
AMR and its associated mortality disproportionately affect LMICs but high-income countries are also significantly impacted. In the USA, an estimated 35 000 people die from the >2.8 million antibiotic-resistant infections that occur each year (CDC, 2019). Similarly, AMR is responsible for approximately 33 000 deaths annually in the EU (OECD & ECDC, 2019). At the current rate of advancement, AMR is expected to be responsible for 10 million annual deaths globally by 2050, overtaking the annual mortality of cancer (Review on Antimicrobial Resistance, 2016). The cumulative economic cost of growing AMR is predicted to be US$ 100 trillion between 2014 and 2050 (Review on Antimicrobial Resistance, 2016). This equates to an approximate 2–3.5% drop in predicted global gross domestic product (GDP).
A frighteningly thin antibiotics pipeline
In the past, developing new antibiotics appeared to be the easiest mechanism to overcome emerging resistant pathogens. As certain antibiotics became less effective against evolving bacteria, treatment for infections could be supplemented or replaced by newer generations of the same antibiotic or by a new, more effective class of antibiotic. Pharmaceutical companies leveraged scientific breakthroughs and were rewarded with high-value patents. But, due to a combination of financial, regulatory and scientific barriers to continued development of new antibiotics, the focus of R&D has shifted away to other therapeutic areas such as oncology and cardiovascular disease. As a result, the antibiotic development pipeline has dwindled to almost a complete standstill, leading to increasing challenges in the market, and ultimately to poorer health outcomes.
In 1990, there were 18 large-capital pharmaceutical companies actively developing antibiotics, but as of 2020 there were only eight (Butler, Blaskovich & Cooper, Reference Butler, Blaskovich and Cooper2013; AMF, 2020). Of these, only two companies ranked within the top 50 drug companies by sales in the world. Over the 25-year period from 1990 to 2015, there were no approvals of novel antibiotic drugs with unique chemical structures for clinical use (WHO, 2017a) (Fig. 3.9.1). Developers had relied on reformulating existing antibiotic drugs or combining two different classes of antibiotic. This void in discovery and development has meant that the antibiotic pipeline is frighteningly thin relative to the unrelenting advance of AMR.
Number of new classes of antibiotics discovered or patented each decade

Figure 3.9.1 Long description
The y-axis represents the Number of antibiotic classes discovered or patented from 0 to 10, while the x-axis represents the Decade from the 1890s to the 2010s. The values are as follows. 1890s: 0. 1900s: 1. 1910s: 0. 1920s: 1. 1930s: 1. 1940s: 7. 1950s: 9. 1960s: 5. 1970s: 5. 1980s: 2. 1990s: 0. 2000s: 0. 2010s: 0.
This chapter looks at how to fill this void in the discovery and development of new antibiotics. In particular, we describe the barriers to development and examine the policy and funding tools that can overcome them, in terms of the push and pull incentives available to policy-makers. We outline the various initiatives underway – multilateral, international, national and regulatory. We assess the state of progress in antibiotic development up to 2021 and the performance of the various incentive mechanisms, and suggest other measures that are required.
Barriers to antibiotic development
Low success rates, scientific difficulties and overall costs create a lot of uncertainties in the antibiotic development process.
From the initial process of molecular research right up until regulatory approval and distribution of the finished product, barriers to antibiotic development permeate the entire value chain (Renwick & Mossialos, Reference Renwick and Mossialos2018). The success rate of moving an antibiotic from basic research to market approval is estimated to lie between 1.5% and 3.5% and can typically take 15 years or more (Review on Antimicrobial Resistance, 2015). Towse et al. (Reference Towse2017) estimate that it costs approximately US$ 1.5 billion to bring an antibiotic to the market. The economic, regulatory and scientific barriers to antibiotic R&D can best be categorized based on the steps of the antibiotic value chain: basic research, preclinical trials, clinical trials, market approval and, finally, commercialization (Fig. 3.9.2) (Stern et al., Reference Stern2017, and see also Chapter 3.4). These barriers are important to consider when designing and targeting future incentives to support antibiotic R&D.
Antibiotic value chain and the barriers to R&D progression

Figure 3.9.2 Long description
Step 1. Value chain: Basic research. Key activities: Choosing a target. Screening compound libraries. Discovering and validating hits. Developing lead compounds. Challenges: Discovery void. Underlying scientific challenges, especially penetration of gram-negative bacteria not resolved.
Barriers in basic research and product trials
Research efforts to understand and identify new molecules for candidate drugs present scientific difficulties. Bacteria, particularly Gram-negative varieties, are highly resilient to recent experimental mechanisms of destruction (WHO, 2017b). In addition, scientific expertise in this area is currently lacking and still recovering from the discovery void that began around 1990 (Silver, Reference Silver2011). Thus, the preclinical stage of antibiotic research is often ominously referred to as the “valley of death” (So et al., Reference So2012). As discussed in Chapter 3.4, basic research has predominantly been tackled by academics funded by the public sector, while clinical trials have been the domain of private pharmaceutical companies, thus leaving a gap in funding and appropriate actors to move from molecular discovery to clinical trials.
It costs roughly US$ 130 million to take a drug candidate through clinical trial phases I to III (Review on Antimicrobial Resistance, 2015) and many drug candidates will be discarded along the way, at a financial loss. Additionally, recruiting patients with acute bacterial infections for antibiotics clinical trials poses logistic challenges due to short treatment windows and lack of rapid point-of-care diagnostic tools to identify potential participants. Post-approval follow-on trials, which build further evidence for effectiveness, amount to an additional US$ 146 million costs on average (Review on Antimicrobial Resistance, 2015a). These expenses and uncertainties are often prohibitively high for small and medium-sized enterprises (SMEs) (Renwick, Brogan & Mossialos, Reference Renwick, Brogan and Mossialos2016). Despite these challenges of economies of scale, SMEs represent over 95% of the share of antibiotics in the current antibiotic pipeline and roughly 70% of the companies active in the antibiotic R&D pipeline have never developed, commercialized or marketed a drug product before.
Barriers in market approval and commercialization
Procedural differences in antibiotic approval processes between drug regulatory agencies can make global licensing time-consuming and expensive (Renwick, Simpkin & Mossialos, Reference Renwick, Simpkin and Mossialos2016). These differences relate to patient selection criteria, definitions of clinical end-points, specification of statistical parameters and rules regarding expedited approvals (Stern et al., Reference Stern2017; and see Chapter 3.4).
An additional challenge is that despite their public health value, antibiotics offer minimal (or even negative) commercial reward compared to other therapeutic areas (So et al., Reference So2011; and see Chapter 3.4). Potential sales volumes are restricted by short treatment durations and hospital stewardship programmes that limit access to novel drugs, both of which are critical practices to thwart the advance of resistance rates. In addition, the large overlap in clinical application of newly patented antibiotics with existing generic alternatives places downward pressure on prices (Renwick, Simpkin & Mossialos, Reference Renwick, Simpkin and Mossialos2016).
A 2003 study calculated that investment in musculoskeletal, neurologic and cancer medications were 11.5, 7.2 and 3.0 times more profitable, respectively, than developing an intravenous antibiotic targeting Gram-positive bacteria (Projan, Reference Projan2003). This type of analysis has not been replicated with more current figures, but large-capital pharmaceutical companies have continued to exit the antibiotic R&D space due to profitability. Most recently, Novartis closed its antibiotic development department in 2018 citing plans to focus on oncology projects (Plackett, Reference Plackett2020). The oncology sector is by far the largest drug market, comprising approximately 20% of global pharmaceutical sales with a total market value of US$ 199.5 billion in 2021 (Business Wire, 2022). In comparison, the total global market value of antibiotics in 2021 was estimated at US$ 47.2 billion (Research and Markets, Reference Research and Markets2023). Furthermore, a 2017 study showed that the median R&D cost per drug, including opportunity cost, for 10 new cancer drugs was US$ 648 million and significantly lower than previously estimated (Prasad & Mailankody, Reference Prasad and Mailankody2017). After a median duration of four years on the market, these cancer drugs had accrued revenues that were almost 10 times the total R&D cost.
Overcoming the barriers to antibiotic development?
Policy and funding tools are needed to augment the current drug financing system as it is applied to antibiotics, with push and pull incentives being the main levers available to policy-makers.
Financing of drug R&D has traditionally been the purview of private pharmaceutical companies that allocate resources based on profit potential. National governments incentivize companies to carry the full burden of R&D costs with the promise of lucrative patents for marketable drugs whereby the developer is the sole supplier for a limited time, pricing the drug at their discretion. Basic supply and demand economics states that revenue potential is greatest where there is the highest demand and R&D money tends to flow to areas of public need. This system works well for most therapeutic areas and has resulted in revolutionary developments in medicine. Pharmaceutical companies have greatly benefited with profit margins that are significantly higher than those obtained by other large, public companies (Ledley et al., Reference Ledley2020).
However, the patent-centric system does not work well in every scenario to meet public need and has now failed in the case of antibiotics as outlined above. A significant amount of research has explored the policy proposals for minimizing R&D barriers and incentivizing companies to invest in the antibiotic field. Push and pull incentives are broadly used to classify the two main types of mechanisms for supporting antibiotic R&D (Mossialos et al., Reference Mossialos2010; and see chapters 3.4 and 3.10).
Push and pull incentives: overview
Push incentives reduce the cost of researching and developing new antibiotics, while pull mechanisms increase the potential revenue of a successfully marketed antibiotic. Examples of push incentives include research grants, access to shared resources and product development partnerships to split R&D costs (Dutescu & Hillie, Reference Dutescu and Hillie2021). Pull mechanisms include outcome-based rewards that directly increase revenue such as monetary prizes, reimbursement premiums, advanced market commitments to purchase the drug and patent buyouts by governments (Dutescu & Hillie, Reference Dutescu and Hillie2021). If large enough, outcome-based pull rewards can replace the traditional revenue stream generated by the sales volumes of a licensed antibiotic. This concept is referred to as “delinkage” since the antibiotic’s revenue is delinked or uncoupled from its sales, thus removing the commercial incentive to promote the drug’s use (Rex & Outterson, Reference Rex and Outterson2016). Alternatively, pull mechanisms may be legal or regulatory, providing incentives such as accelerated procedures for marketing approval or extensions to the patent period. As of 2015, there were 47 different core incentives available or proposed for antibiotic developers that ranged from simple push or pull mechanisms to complex hybrid models (Table 3.9.1) (Renwick, Brogan & Mossialos, Reference Renwick, Brogan and Mossialos2016).

Table 3.9.1 Long description
Push incentive strategies: Supporting open access to research; Grants for scientific personnel; Direct funding; Conditional grants; Funding translational research; Tax incentives; Refundable tax credits; Product development partnership.
Outcome-based pull incentive strategies: End prize; Milestone prize; Pay-for-performance payments; Patent buyout; Payer license; Research tournament; Advanced market commitment; Strategic antibiotic reserve; Service-availability premium.
Lego-regulatory pull incentive strategies: Accelerated assessment and approval; Market exclusivity extensions; Transferable intellectual property rights; Conservation-based market exclusivity; Liability protection; Anti-trust waivers; Sui generis rights; Value-based reimbursement; Targeted approval specifications; Priority review vouchers.
Designing a global incentive package for stimulating antibiotic innovation is a complex task with numerous variables. Policy-makers need a methodology for selecting a complete and realistic set of incentives from the surplus of options that takes account of their unique circumstances and contexts. In 2015, the author of this chapter published a conceptual framework to guide policy-makers with this challenge (Fig. 3.9.3) (Renwick, Brogan & Mossialos, Reference Renwick, Brogan and Mossialos2016). The framework breaks the strategy down into three steps or phases. The first phase involves fashioning a core incentive package targeting the economic criteria necessary for rebalancing the market. According to the framework, this core incentive package must:
improve the profitability of developing and commercializing a novel antibiotic;
make market participation feasible for SMEs;
encourage investment by large pharmaceutical companies;
facilitate cooperation across all stakeholders including patients, academics, policy-makers, regulators and industry.
The second step requires adjusting the core incentive package to address public health goals pertaining to sustainability and patient access to new antibiotics. The final step considers the implementation and operational practicalities that are specific to national context.
Framework for developing a holistic incentive package for antibiotic development
NPV: net present value; SME: small and medium-sized enterprise.

Figure 3.9.3 Long description
The infographic is presented as three concentric circles. The inner circle reads: Market factors: Improves N P V; Enables S M E participation; Encourages Big Pharma participation; Facilitates cooperation and synergy. The middle circle reads: Public health goals: Supports antibiotic sustainability; Promotes patient access; Targets high-priority medical need. The outer circle reads: Implementation and operational feasibility.
Current initiatives incentivizing antibiotic R&D
At both the national and international levels, many programmes have been established in recent years to help fund, coordinate and incentivize antibiotic R&D.
By 2016, there were 58 active initiatives directly incentivizing the development of antibiotics at global, EU, and national levels, including in Canada, France, Germany, the Netherlands, Sweden, the United Kingdom and the USA (Renwick, Simpkin & Mossialos, Reference Renwick, Simpkin and Mossialos2016). These initiatives employ one or more push or pull incentive mechanisms and are financed through a combination of public health care budgets, non-profit donations and private pharmaceutical investments. These initiatives provide targeted pathways for public and private money to flow towards the antibiotic market and share the financial risk across all stakeholders. Additionally, nine initiatives were identified as offering indirect incentives through economic and policy research or the coordination of strategic actions on AMR.
The number of active initiatives in this field continues to rise. The Global AMR R&D Hub provides an up-to-date summary of the latest global and national initiatives supporting antibiotic R&D (https://globalamrhub.org/). The following section highlights some of the largest antibiotic R&D initiatives at multilateral and EU levels, as well as key initiatives from the United Kingdom and the USA, which are national leaders in this field (Table 3.9.2).

Table 3.9.2 Long description
The table has 3 columns: Initiative, Value chain target, and Incentive type. It reads as follows. Under Multilateral initiatives: J P I A M R; Research, preclinical; Push. G A R D P: Research, preclinical, clinical, commercialization; Push, outcome-based pull. C A R B-X: Research, preclinical; Push. E D C T P: Research, preclinical, clinical, commercialization; Push. G A M R I F: Research, preclinical; Push. A M R Action Fund: Clinical; Push.
Under E U initiatives: D G-R T D: Research, preclinical, clinical; Push. I M I - N D 4 B B: Research, preclinical, clinical; Push. InnovFin I D: Preclinical, clinical; Push.
Under U S initiatives: N I A I D: Research, preclinical, clinical; Push. B A R D A: Research, preclinical, clinical, commercialization; Push, outcome-based pull.
Under United Kingdom initiatives: N I H R: Research, preclinical, clinical; Push. M R C: Research, preclinical; Push. Netflix: Commercialization; Outcome-based pull.
Under Regulatory initiatives: E M A: Market approval, commercialization; Lego-regulatory pull. F D A: Market approval, commercialization; Lego-regulatory pull. T A T F A R: Market approval; Lego-regulatory pull.
AMR: antimicrobial resistance; BARDA: Biomedical Advanced Research and Development Authority; CARB-X: Combating Antibiotic Resistant Bacteria Biopharmaceutical Accelerator; DG-RTD: Directorate-General for Research and Innovation; EDCTP: European and Developing Countries Clinical Trial Partnership; EMA: European Medicines Agency; EU: European Union; FDA: Food & Drug Administration; GAMRIF: Global Antimicrobial Resistance Innovation Fund; GARDP: Global Antibiotic Research and Development Partnership; IMI: Innovative Medicines Initiative; JPIAMR: Joint Programming Initiative on Antimicrobial Resistance; MRC: Medical Research Council; ND4BB: New Drugs for Bad Bugs; NIAID: National Institute for Allergy and Infectious Diseases; NIHR: National Institute for Health Research; TATFAR: Transatlantic Task Force on Antimicrobial Resistance; UK: United Kingdom; US: United States.
Multilateral initiatives
National health systems alone cannot correct the global market for antibiotics or contain the transborder threat of AMR. The international community has come together to create several multilateral initiatives including the Joint Programming Initiative on Antimicrobial Resistance (JPIAMR), the Global Antibiotic Research and Development Partnership (GARDP), the Combating Antibiotic Resistant Bacteria Biopharmaceutical Accelerator (CARB-X), the European and Developing Countries Clinical Trial Partnership (EDCTP), the Global Antimicrobial Resistance Innovation Fund (GAMRIF) and the AMR Action Fund.
Joint Programming Initiative on Antimicrobial Resistance (JPIAMR)
The JPIAMR is a collaborative organization engaging 28 countries with the purpose of coordinating the national funding of its members towards six priority fields related to AMR: diagnostics, environment, interventions, surveillance, therapeutics and transmission. As of December 2022, the JPIAMR has funded 112 projects and created 44 research networks with €141 million in funding (JPIAMR, 2021). Their incentivization is push-based and is mostly directed towards academic research of basic and preclinical science (Renwick, Simpkin & Mossialos,Reference Renwick, Simpkin and Mossialos2016; Kelly et al., Reference Kelly2016).
Global Antibiotic Research and Development Partnership (GARDP)
Founded in 2016, GARDP is a not-for-profit initiative that is jointly led by the Drugs for Neglected Diseases initiative (DNDi) and WHO with the objective of developing treatments that target priority pathogens, address diseases and syndromes with the greatest medical need and help neglected patient populations (Piddock, Reference Piddock2018). GARDP plans to develop five new treatments in the following core areas: sexually transmitted infections, neonatal sepsis, paediatric infections and serious bacterial infections. By the end of 2020, GARDP had secured €91 million in commitments from several countries including Germany, Japan, the Netherlands and the United Kingdom, as well as charitable organizations such as the Wellcome Trust and the Bill & Melinda Gates Foundation (GARDP, 2021a). This initiative is unique in its offering of both push and pull incentives to antibiotic R&D projects, with the possibility of delinking antibiotics that are developed and marketed with the help of GARDP. As of September 2021, the programme had 10 drugs in its pipeline at various stages of development (GARDP, 2021b).
Combating Antibiotic Resistant Bacteria Biopharmaceutical Accelerator (CARB-X)
CARB-X is a transatlantic public–private partnership started in 2016 aimed at accelerating early-stage R&D for antibiotics, rapid diagnostic tools, vaccines and other antimicrobial products. CARB-X projects receive push funding along with scientific and business guidance for projects in preclinical and early clinical phases, with particular focus on targeting high-priority resistant pathogens (Renwick, Simpkin & Mossialos, Reference Renwick, Simpkin and Mossialos2016). As of July 2021, CARB-X had awarded US$ 361 million to 92 different projects with funding support from large governmental and nongovernmental organizationa (NGOs) in Germany, the United Kingdom and the USA (CARB-X, 2021). Successful projects can unlock additional funding by reaching certain development milestones or can attract external financing from other public and private investors. Nine projects have graduated from the programme to later stages of development, several of which are new antibiotic drug formulations or combinations (CARB-X, 2021).
European and Developing Countries Clinical Trial Partnership (EDCTP)
The EDCTP is a public–private partnership that brings together the EU, 14 European countries, 16 sub-Saharan African countries and the pharmaceutical industry to facilitate clinical trials on therapies treating poverty-related communicable diseases that bear the greatest health burden in sub-Saharan Africa (Olesen, Reference Olesen2017; EDCTP, 2020). These infections include HIV/AIDS, malaria, TB and many neglected infectious diseases. The EDCTP is now in its second decade of operation (2014–2024). The organization operates using pooled push funding from its partners with total funding of €814 million across 431 projects as of December 2022 (EDCTP, 2020). Fifty-one grants totalling €282 million are for drug development, with several large antimicrobial clinical trials currently running. In addition, vaccine development is a major aspect of their funding with 26 active projects and €243 million in funding.
Global Antimicrobial Resistance Innovation Fund (GAMRIF)
Following recommendations from the United Kingdom Review on AMR, GAMRIF was established in 2017 as an investment fund to support underfunded and neglected areas of AMR research for the particular benefit of LMICs. GAMRIF is primarily funded by the United Kingdom’s Department of Health and Social Care with additional funding provided by the Chinese Ministry of Science and Technology. GAMRIF has a £57 million portfolio of seven core work packages including InnoVet AMR (innovative veterinary solutions for AMR with the International Development Research Centre), the United Kingdom–Argentina project on tackling AMR in the environment, and innovation in AMR diagnostic tools with the Foundation for Innovative New Diagnostics (Department of Health & Social Care, 2020). In addition, the fund also supports projects within CARB-X and GARDP.
AMR Action Fund
Established in 2020, the AMR Action Fund is a public–private partnership pooling investment and leadership from over 20 pharmaceutical companies through the International Federation of Pharmaceutical Manufacturers and Associations, the Boehringer Ingelheim Foundation, the European Investment Bank (EIB) and the Wellcome Trust. The fund expects to invest US$ 1 billion to help bring two to four new antibiotics to the market by 2030 (AMR Action Fund, 2021). The AMR Action Fund provides push funding specifically to drug candidates in phase II and III clinical trials to help bridge the gap between early clinical R&D, which has funding support through programmes such as CARB-X and JPIAMR, and the market approval phase (Clancy & Hong Nguyen, Reference Clancy and Hong Nguyen2020).
EU initiatives
The EU has been a leader in initiating policy action to revitalize the antibiotic market. The key EU organizations fostering antibiotic R&D are the European Commission’s Directorate-General for Research and Innovation (DG-RTD), the Innovative Medicines Initiative (IMI), the InnovFin Infectious Diseases Facility (InnovFin ID) and the European Health Preparedness and Response Authority (HERA).
European Commission’s Directorate-General for Research and Innovation (DG-RTD)
The DG-RTD partially administers and funds the largest European antibiotic R&D funding programmes including the EDCTP, the IMI and HERA. Beyond these specific programmes, it provides funding support to numerous smaller R&D projects. Between 2007 and 2013, the DG-RTD gave €235.6 million in direct funding for European antibiotics and diagnostics R&D projects, which were separate from the IMI and EDCTP (Kelly et al., Reference Kelly2016). This funding is primarily push-based via direct project funding, research grants and fellowships. It specifically offers funding opportunities to SMEs undertaking antibiotic R&D through the SME Instrument (Renwick, Simpkin & Mossialos, Reference Renwick, Simpkin and Mossialos2016). As part of the 2020 Pharmaceutical Strategy for Europe, the EU has committed to helping pilot pull incentive programmes (EU-JAMIRAI & Global AMR R&D Hub, 2020).
Innovative Medicines Initiative (IMI)
The IMI is a public–private partnership between the EU and the European Federation of Pharmaceutical Industries and Associations (EFPIA). It has a subsidiary public–private partnership called the New Drugs for Bad Bugs (ND4BB) programme, which is dedicated to the discovery and development of novel antibiotics for humans. Funding for the ND4BB programme is split between the EU and EFPIA and totals over €660 million (Kostyanev et al., Reference Kostyanev2016). There are four core projects, which offer push-based support to most aspects of the antibiotic value chain: TRANSLOCATION and ENABLE assist early drug discovery; iABC and COMBACTE with its subsidiary programmes COMBACTE-NET, -MAGNET, -CARE and -CDI support clinical development of novel antibiotics particularly against Gram-negative bacteria; and DRIVE-AB explores economic solutions to stimulating antibiotic R&D in a sustainable manner (Innovative Medicine Initiative, n.d.). DRIVE-AB’s final report with specific recommendations was published in 2018 (Årdal et al., Reference Årdal2018a).
InnovFin Infectious Diseases Facility (InnovFin ID)
InnovFin ID was a financial risk-sharing programme for ventures in the clinical development phase for a novel drug, vaccine or diagnostic device that tackles an infectious disease. It was jointly governed by the European Commission and EIB. InnovFin ID offered loans ranging from €7.5 million to €75 million, which will only be repaid if the project successfully results in a marketable product (EIB, 2017). These loans were available to non-profit and for-profit ventures alike. The programme ended in 2022.
European Health Preparedness and Response Authority (HERA)
In response to the SARS-CoV-2 pandemic, the European Commission announced the launch of the HERA in September 2021 (EC, 2021). HERA has been tasked with identifying, preparing and tackling current and future health emergencies including AMR. Funding for HERA totals €30 billion sourced from various EU programmes and economic packages. HERA is still in its infancy and undergoing feasibility studies for how the agency can support drug procurement and stockpiling as well as bring AMR counter measures such as antibiotics and vaccines to market (HaDEA, 2022).
Initiatives in the USA
There are two key governmental bodies in the USA that run programmes to incentivize antibiotic R&D: the National Institute for Allergy and Infectious Diseases (NIAID) and the Biomedical Advanced Research and Development Authority (BARDA).
National Institute for Allergy and Infectious Diseases (NIAID)
The NIAID is a research institute within the NIH responsible for conducting basic science and applied research in the field of infectious, immunological and allergic diseases. The NIAID’s large, push-based AMR portfolio runs from basic science projects to clinical trials for antibiotic therapies, rapid point-of-care diagnostic tools and vaccines for resistant bacterial infections. The NIH-wide funding for combating AMR in 2020 was US$ 638 million (NIH, 2025). NIAID supports the Antibiotic Resistant Leadership Group (ARLG), which is an academic team that prioritizes, designs and executes clinical research on antibiotic resistance. The NIH renewed funding for the ARLG in 2019 with a US$ 102.5 million grant over seven years (NIH, 2019). Additionally, the NIAID is a partner of CARB-X (2021).
Biomedical Advanced Research and Development Authority (BARDA)
BARDA is an organization within the Office of the Assistant Secretary for Preparedness and Response in the Department of Health and Human Services (Department of Human & Health Services, 2021a). BARDA is responsible for facilitating R&D and public purchasing of critical drugs, vaccines and diagnostic tools intended for public health emergencies. BARDA is a founder and key funder of CARB-X, manages Project BioShieldFootnote 1 and supports numerous public–private partnerships through its Broad-Spectrum Antimicrobials Program (Department of Health & Human Services, 2021a; 2021b). Since its inception in 2010, BARDA has invested over US$ 1.5 billion into antibiotic R&D through these programmes. As of 2021, BARDA had supported 28 public–private partnerships ranging from SMEs to multinational pharmaceutical firms, including AstraZeneca and GSK, and had 16 products in various development phases (Department of Health & Human Services, 2021b). BARDA offers push funding and guidance to all its partners, as well as the possibility for pull-based purchasing commitments for select marketable antibiotics (Renwick, Simpkin & Mossialos, Reference Renwick, Simpkin and Mossialos2016).
United Kingdom initiatives
The United Kingdom Government offers a variety of programmes with push-based funding to support antibiotic R&D, primarily at the basic science and preclinical stages. The National Institute for Health Research’s (NIHR) Biomedical Research Centres and Health Protection Research Units have started a variety of programmes conducting basic science research that is laying the groundwork for antibiotic development (NIHR, 2023).
Medical Research Council (MRC)-supported initiatives
The United Kingdom’s MRC supports antibiotic R&D through the AMR Cross-Council Initiative, the Newton Fund and the Global Challenge for Research Fund. The Cross-Research Council AMR Initiative promotes a multidisciplinary approach to tackling AMR and offers a range of individual and collaborative grants to academic institutions (UKRI, 2022a). The Initiative aims to break down research silos and involve LMICs in AMR research. The Newton Fund aims to strengthen scientific research partnerships between the United Kingdom and LMICs (UKRI, 2022b). The MRC, alongside government agencies from China, India and South Africa, had pooled approximately £13.5 million by 2017 in the Newton Fund for collaborative academic research on AMR (Simpkin et al., Reference Simpkin2017). The Global Challenge Research Fund is a £1.5 billion fund that strives to address a multitude of challenges faced by LMICs, including AMR (UKRI, 2023). However, antibiotic R&D has played only a small role in this Fund’s mission to date.
“Netflix model”
Finally, NHS England and NHS Improvement, along with support from the Department for Health and Social Care and National Institute for Health and Care Excellence (NICE), are implementing a pilot project for a subscription-type payment model for novel antibiotics – a first of its kind (Anderson & Mossialos, Reference Anderson and Mossialos2020; Perkin & Glover, Reference Perkin and Glover2020). The programme, nicknamed the Netflix model, pays eligible companies a set annual fee for access to a novel antibiotic, regardless of the volume used. The scheme will be trialled with Pfizer’s Zavicefta (ceftazidime avibactam) and Shionogi’s Fetcroja (cefiderocol), two antibiotics that have efficacy against priority pathogens identified by WHO (Mullard, Reference Mullard2020). The pilot is expected to begin in April 2022 and will see that drug developers receive an annual fee of £10 million for 10 years.
Regulatory initiatives
European Medicines Agency (EMA)
EMA authorizes most antimicrobial agents in Europe through its centralized licensing procedure. EMA promotes antibiotic innovation through several lego-regulatory mechanisms that facilitate faster market authorization, lower costs associated with obtaining regulatory approval and potentially increase a drug’s effective patent period (EMA, 2016; Renwick, Simpkin & Mossialos, Reference Renwick, Simpkin and Mossialos2016). For innovative medications that have high-priority for public health and address an unmet medical need, EMA offers an accelerated approval pathway that shortens the assessment period for its marketing authorization application. In addition, EMA can provide scientific advice and protocol assistance with the authorization process. Certain medications may qualify for conditional market authorization whereby a drug is approved under weaker criteria for quality, safety and efficacy, to hasten patient access. These products have much narrower indications for use, must participate in post-market evidence generation, and are reserved for those individuals without other treatment options. Some antibiotics against rare pathogens may also be eligible to receive orphan drug designation and an associated patent extension. EMA recently introduced the PRIME scheme for priority medications to help guide SMEs and academics through the complicated process of market authorization and ensure that these developers take advantage of the offered lego-regulatory mechanisms (EMA & CHMP, 2018).
United States Food & Drug Administration (FDA)
The United States FDA offers similar incentives to antibiotic developers through the Qualified Infectious Diseases Products designation and the Limited Population Antibacterial Drug designation (FDA, 2020; Renwick, Simpkin & Mossialos, Reference Renwick, Simpkin and Mossialos2016). Novel antibiotics that qualify for Qualified Infectious Diseases Products status receive regulatory guidance from the FDA, priority review and fast-track consideration when being assessed for market approval. Certain Qualified Infectious Diseases Products antibiotics may also be eligible for a market exclusivity extension of five years. Antibiotics that target rare and deadly pathogens could be eligible for Limited Population Antibacterial Drug designation, which permits a streamlined and conditional approval process so that patients lacking appropriate treatment can receive early access to a promising novel antibiotic. Analogous to the EMA’s conditional market authorization process, antibiotics with Limited Population Antibacterial Drug designation are studied using smaller clinical populations and would only be approved for a narrow indication limited to the in-need patient cohort. The FDA also has an orphan drug licensing programme that offers market exclusivity extensions among some other benefits (Mossialos et al., Reference Mossialos2010; Renwick, Simpkin & Mossialos, Reference Renwick, Simpkin and Mossialos2016).
Transatlantic Task Force on Antimicrobial Resistance (TATFAR)
TATFAR is an international partnership bringing together health policy and regulatory agencies from Canada, the EU, Norway and the USA (TATFAR, 2021). TATFAR’s key goal is knowledge exchange and coordination across the various partner agencies as well as promotion of innovative global strategies to tackle AMR. The regulatory agencies within TATFAR have been working collaboratively to improve and align the market authorization processes for antibiotics among member nations.
What is the state of progress in the antibiotic pipeline?
A new approach now aims to guide antibiotic R&D based on medical need as opposed to the economic factors that have traditionally directed antibiotic investment.
In 2017, WHO published a priority pathogens list (PPL) which outlines the antibiotic-resistant bacteria that pose the greatest threat to global public health (WHO, 2017b) (Table 3.9.3). At the top of this list, categorized as “critical”, are the Gram-negative, carbapenem-resistant strains of Acinetobacter baumannii, Pseudomonas aeruginosa and the Enterobacteriaceae family. In 2013, the United States Centers for Disease Control and Prevention published a USA-focused urgent threats list for antibiotic resistance, which highlighted many of the same pathogens (CDC, 2013).

Table 3.9.3 Long description
The table has 2 columns: Priority level and Pathogens. It reads as follows Critical: Acinetobacter baumannii, carbapenem-resistant; Pseudomonas aeruginosa, carbapenem-resistant; Enterobacteriaceae, carbapenem-resistant and third-generation cephalosporin-resistant.
High: Enterococcus faecium, vancomycin-resistant; Staphylococcus aureus, methicillin-resistant, vancomycin intermediate and resistant; Helicobacter pylori, clarithromycin-resistant; Campylobacter, fluoroquinolone-resistant; Salmonella s p p., fluoroquinolone-resistant; Neisseria gonorrhoeae, third-generation cephalosporin-resistant, fluoroquinolone-resistant.
Medium: Streptococcus pneumoniae, penicillin-non-susceptible; Haemophilus influenzae, ampicillin-resistant; Shigella s p p., fluoroquinolone-resistant.
Traditional antibiotics
WHO and the Pew Charitable Trust keep close track of the antibacterial agents in clinical development. Between 2014 and 2020, 14 antibiotics had been developed and approved for use by the FDA, EMA or other national drug regulatory agencies (Pew, Reference Pew2021). Of these 14 approvals, 11 occurred in the last four years between 2017 and 2020 (WHO, 2021b). During the same 2014–2020 period, 19 antibiotic drug candidates were discontinued at various stages of development (Pew, Reference Pew2021).
As of March 2021, there were 43 drugs in clinical development: 15 in phase I, 13 in phase II, 13 in phase III and two applying for regulatory approval (Pew, Reference Pew2021) (Fig. 3.9.4). Of these drugs in development, approximately half (26) target a WHO priority pathogen (WHO, 2021b). As with most drug developments, the R&D and market approval process is lengthy. The phase III antibiotics are three to five years from potentially reaching the market. However, the phase I and II antibiotics have development timelines of at least five to 10 years and successful progression to marketing approval is far from certain. Antibiotics in phase I clinical trials have only a 14% likelihood of reaching the market. This means that of the 10 phase I antibiotics targeting resistant Gram-negative bacteria only one or two are likely to succeed.
Antibiotic drugs and alternative antibacterial therapies in clinical development
NDA: new drug application; PPL: priority pathogens list; WHO: World Health Organization.

Figure 3.9.4 Long description
The y-axis represents the Number of drugs from 0 to 18, while the x-axis lists the phases. Each section has 3 bars, for Total small molecule antibiotics, W H O P P L small molecule antibiotics, and Alternative antibacterials, respectively. The values are as follows. Phase 1: 15; 14; 8. Phase 2: 13; 4; 13. Phase 3: 13; 6; 4. N D A: 2; 2; 0.
A compounding problem is that most of the pipeline drugs are redevelopments of classic antibiotic compounds or are combination therapies of existing antibiotic molecules.
These types of less original antibiotics are at higher risk of quickly losing effectiveness in clinical practice because of cross-resistance and therefore offer less clinical benefit over existing options. Of the 11 drugs approved from 2017 to 2020, only two drugs represent a novel antibiotic class with new pathogen target (meropenem/vabrobactam and lefamulin) (WHO, 2021b). Furthermore, of the 26 antibiotics in the pipeline targeting a WHO PPL pathogen, only seven (27%) meet at least one criteria for innovation: (i) absence of cross-resistance to existing antibiotics; (ii) new chemical class: (iii) new target; or (iv) new mechanism of action. The recent 2021 WHO analysis concluded that the current antibacterial pipeline is inadequate for the soaring resistance rates. This sentiment was echoed in the Access to Medicine Foundation’s 2021 AMR Benchmark Report, an independent assessment of key industry players across a spectrum of AMR priorities related to R&D, production and manufacturing and appropriate access and stewardship (AMR, 2021).
Alternative antibacterial therapies
A burgeoning portfolio of alternative antibacterial therapies in addition to antibiotics is now emerging and includes antibodies, bacteriophages, immunomodulating agents, microbiome-modulating agents and various peptides (Fig. 3.9.5). These products would likely supplement typical antibiotic regimens as adjunct or preventive therapies. WHO’s pipeline analysis found that there are 27 alternative therapies in development targeting PPL bacteria: eight in phase I, 14 in phase II, four in phase III and one not in a defined clinical trial phase (WHO, 2021b) (Fig. 3.9.4). Most of these alternative therapies are in the early phase of clinical trials and target specific pathogens, namely Staphylococcus aureus and Clostridium difficile. This specificity limits clinical applicability when there is diagnostic uncertainty about the exact pathogen causing infection, which is a common issue in LMICs. Furthermore, a significant challenge will be later-stage clinical trials as well as regulatory hurdles, as regulatory agencies have minimal experience with many of these drugs.
Types of alternative antibacterial therapies in development

Figure 3.9.5 Long description
The x-axis notes the numbers from 0 to 10, while the y-axis lists the therapies. The values are as follows. Miscellaneous: 4. Immuno-modulating agents: 2. Microbiome-modulating agents: 8. Bacteriophage and phage-derived enzymes: 4. Antibodies: 9.
Antibiotic development incentivization: is it working?
The current incentive package still has major gaps and deficiencies that inhibit the transition from basic science research all the way to patient access, and incentivization needs to be adjusted accordingly.
Though the extensive array of antibiotic R&D incentives is commendable, and incredible strides have been made towards reviving the antibiotics pipeline over the past several years, the end goal should be a continuum of incentivization that reflects the economic need, cost distribution and blockages of the entire antibiotic value chain. Different types of incentives are better suited for tackling different stages of this value chain (Fig. 3.9.6). To achieve this continuum, there is a need to adjust push incentivization to increase funding of clinical development, support global regulatory harmonization and provide added legal or regulatory incentives to facilitate market approval. There is also a need to introduce a variety of outcome-based pull incentives to help with commercialization and distribution of licensed antibiotics. These incentive changes must involve inter-initiative coordination and be made within the context of broader public health and health system goals related to sustainability, patient access, care quality and access and medical need.
Continuum of incentivization across the antibiotic value chain

Figure 3.9.6 Long description
The 5 steps are: 1. Basic science. 2. Preclinical development. 3. Clinical development. 4. Market authorization. 5. Commercialization. Steps 1 and 2 form Early-stage push incentives. Steps 3 and 4 form Late-stage push incentives. Step 4 forms Lego-regulatory pull incentives. Steps 3, 4, and 5 form Outcome-based pull incentives.
Early-stage push incentives
Push incentives, such as grants for researchers and direct project funding, are best used to facilitate the earlier stages of R&D from basic science up to clinical development. Most push funding for antibiotic R&D is directed towards basic antimicrobial science and less so towards clinical development. An estimated 86% of European national-level public funding of antibiotics was in this category (Kelly et al., Reference Kelly2016). The JPIAMR, DG-RTD, CARB-X, United States NIAID, United Kingdom MRC and United Kingdom NIHR preferentially fund antimicrobial basic science and preclinical development. While early-stage push funding of antimicrobial science is integral to the R&D process, there is a need for more late-stage push funding of clinical trials to help translate scientific innovation into marketable products. The overemphasis on early-stage push funding reflects the fact that basic science and preclinical development lends itself to being partitioned into projects requiring smaller individual monetary commitments than clinical trials. In addition, public funders can more easily justify supporting non-profit academic work. Basic science is largely the domain of academia and, as a result, private companies often do not benefit from early-stage push funding. Yet, clinical trials, which are usually operated by private companies, are by far the most expensive aspect of R&D (Review on Antimicrobial Resistance, 2015). SMEs are the most impacted by the lack of late-stage push funding as they often struggle to raise the capital necessary for clinical trials (Renwick, Simpkin & Mossialos, Reference Renwick, Simpkin and Mossialos2016).
As more drug candidates transition to clinical development, early-stage push funding could be pooled and reallocated to late-stage push funding to ensure viable antibiotics make it to the market approval stage. In addition, existing programmes, such as BARDA and the IMI’s COMBACTE, which specifically fund clinical trials could be further expanded. The AMR Action Fund is another promising new initiative that specifically addresses the lack of push funding in the latter half of the clinical development pipeline (i.e. phase II and III). Public and regulatory organizations could bolster this initiative by offering further funding and clinical trial guidance, respectively. Public–private partnerships naturally lend themselves to facilitating early- and late-stage clinical development by pooling investment and expertise from industry and governmental organizations while also dispersing financial risk. Many major incentive programmes such as BARDA, IMI and CARB-X rely on public–private partnerships and have been successful in adding promising drugs to the pipeline.
Lego-regulatory incentives
Lego-regulatory pull incentives, such as those offered by the EMA and FDA, are most effective at facilitating progress through the market approval stage.
Both the EMA and FDA offer several incentives that decrease the approval timeline for antibiotics: regulatory guidance, expedited pathways and conditional market authorization. The primary value of these incentives comes from indirectly increasing the effective patent period of the antibiotic since it reaches the market earlier (Mossialos et al., Reference Mossialos2010). But there is a balance to be struck between speeding up the approval process and ensuring that licensed drugs meet standards for quality, safety and efficacy (Renwick, Simpkin & Mossialos, Reference Renwick, Simpkin and Mossialos2016). It is unlikely that these regulatory processes can be shortened any further without sacrificing regulatory standards. It remains to be seen how these lego-regulatory incentives may be applied to the variety of alternative antibacterial therapies in the pipeline. In addition, many of the pipeline antibiotics are not expected to be high-volume products and therefore adding to their effective patent period does not translate into meaningful revenue. Market exclusivity extensions suffer from this same problem. Therefore, it may be worthwhile to explore alternative incentives that allow priority review (e.g. priority review vouchers) or market exclusivity extensions (e.g. transferable intellectual property rights (TIPR)) to be transferred from an approved antibiotic to another product in the developer’s portfolio that would benefit more from the longer effective patent period (Ferraro, Towse & Mestre-Ferrandiz, Reference Ferraro, Towse and Mestre-Ferrandiz2017). Incentives such as priority review vouchers and TIPR could provide a market incentive to license new antibiotics without requiring upfront government funding. However, it is important to be aware that priority review vouchers and TIPR do not incentivize antibiotic commercialization or access and they could have broader pharmaceutical market consequences (Ferraro, Towse & Mestre-Ferrandiz, Reference Ferraro, Towse and Mestre-Ferrandiz2017; Mossialos et al., Reference Mossialos2010).
Harmonization between the EMA and FDA’s market approval requirements has been a step towards lowering market approval costs and time. However, the EMA and FDA regulatory processes are relatively similar, unlike the Japanese Pharmaceuticals and Medical Devices Agency or the Chinese Food and Drug Administration. Harmonization efforts among these agencies will prove more challenging but could further relieve companies of duplicative regulatory approval costs. Including the Japanese Pharmaceuticals and Medical Devices Agency in TATFAR discussions was a laudable starting point.
The need for outcome-based pull incentives
Push funding and legal or regulatory incentives can drive viable antibiotics to licensing; however, they are weak incentives for the commercialization and distribution of the product. Net profits from sales of an innovative new antibiotic are perceived to be limited for several reasons, especially when compared to therapeutic areas with the highest sales revenues; for example, oncology, immunology and musculoskeletal medicine (EvaluatePharma, 2021). A novel antibiotic would be reserved as a treatment of last resort or may only target a rare resistant pathogen, which restricts potential sales revenue. High product prices are unlikely to compensate for low sales volume because of the considerable overlap in effectiveness between existing antibiotics. Also, future rapid-point-of-care diagnostic tools could cut into the revenue potential for newly marketed antibiotics (Outterson et al., Reference Outterson2015). Therefore, large outcome-based pull incentives are necessary in the absence of a viable market. Pull incentives have the added benefit of potentially allowing SMEs to secure venture capital for clinical trials. However, pull incentives for antibiotics have been mostly absent from current funding initiatives. The only established outcome-based pull incentives currently available are relatively limited advanced market commitments offered by BARDA and GARDP for certain low-volume antibiotics (Simpkin et al., Reference Simpkin2017).
Market entry rewards
Market entry rewards have repeatedly been recommended by major reports and journal articles as an effective pull incentive for antibiotic commercialization (Stern et al., Reference Stern2017; Årdal et al., Reference Årdal2018a; Rex & Outterson, Reference Rex and Outterson2016; Outterson et al., Reference Outterson2015; Renwick, Simpkin & Mossialos, Reference Renwick, Simpkin and Mossialos2016; Simpkin et al., Reference Simpkin2017; Ferraro, Towse & Mestre-Ferrandiz, Reference Ferraro, Towse and Mestre-Ferrandiz2017). A market entry reward is a financial prize for the successful development and licensure of an innovative antibiotic. To receive the prize, a developer must ensure that the antibiotic meets predefined product criteria and adheres to post-market authorization conditions related to sustainability and patient access as specified by the payer. The DRIVE-AB group, as well as other major reports, expect that an effective reward would need to be approximately US$ 1–2 billion per first-entrant novel antibiotic to entice developers to invest in R&D and gamble on inventive antibiotic projects (Årdal et al., Reference Årdal2018a). In a more recent journal article, Outterson (Reference Outterson2021) estimates that a more accurate price for a standalone market entry reward would be in the range of US$ 1.5–4.8 billion. A prize of this magnitude might be paid out in instalments over five to 10 years. This would create a guaranteed revenue stream for the developer, spread out payer expenditures and provide the payer with leverage if the developer chose to deviate from the agreed reward conditions.
Market entry rewards can also be designed to have varying degrees of delinkage. Delinkage, in the context of a reward, refers to how much of the winner’s revenue can be generated from sales volume (Rex & Outterson, Reference Rex and Outterson2016). A fully delinked market entry reward would pay for the antibiotic patent or licence in return for access to the drug at the cost of production. A partially delinked reward would still allow developers to generate some revenue from antibiotic sales. A fully delinked reward would thus need to be much larger than a partially delinked one.
Numerous other design variations, stipulations and augmentations can be applied to the basic market entry reward model to achieve various market goals. One such variation is a sustainability bonus that rewards developers for maintaining low resistance rates for their drugs (Morel et al., Reference Morel2020). Both the 2018 DRIVE-AB final report and the 2017 OHE Report offer in-depth discussion of and recommendations for market entry reward design and costing (Årdal et al., Reference Årdal2018b; Ferraro, Towse & Mestre-Ferrandiz, Reference Ferraro, Towse and Mestre-Ferrandiz2017).
The key barrier to implementing a reward programme is the cost. With the 10-year goal of bringing 10 to 15 novel antibiotics to market, a market entry reward programme is estimated to cost between US$ 10 and US$ 30 billion (Årdal et al., Reference Årdal2018a; Ferraro, Towse & Mestre-Ferrandiz, Reference Ferraro, Towse and Mestre-Ferrandiz2017; Review on Antimicrobial Resistance, 2016). Such a programme would provide large payouts of US$ 1–2 billion for first entrants and increasingly smaller prizes for follow-up therapeutic products. A fund of this scale can only be practically achieved by pooling financial commitments from numerous countries and institutions into a secure endowment. For a market entry reward programme to effectively pull antibiotics to the market, it is important that developers perceive this fund to be guaranteed by participating governments and protected from other public expenditures. This type of international fund for market entry rewards has been recommended by various journal articles and international reports, such as the United Kingdom’s AMR Review, Boston Consulting Group’s report for the GUARD initiative and DRIVE-AB (Stern et al., Reference Stern2017; Review on Antimicrobial Resistance, 2016; Renwick, Simpkin & Mossialos, Reference Renwick, Simpkin and Mossialos2016; Rex & Outterson, Reference Rex and Outterson2016).
In lieu of a global market entry reward scheme, alternative outcome-based pull incentives could be applied such as corporate tax incentives, value-based pricing and reimbursement strategies, and national advanced market commitments for bulk purchasing (Renwick, Simpkin & Mossialos, Reference Renwick, Simpkin and Mossialos2016). These strategies are generally weaker incentives, but do not require the same upfront financial commitment as a market entry reward programme and thus may be more politically palatable.
Further developments
Subscription models
Subscription models in Sweden and the United Kingdom
Both Sweden and the United Kingdom have pilot programmes that offer payment subscriptions for access to antibiotics regardless of volume acquired (Global AMR R&D Hub, 2020). Sweden started its programme in 2020, securing access to five products, and will run until 2022. The United Kingdom announced its “Netflix” programme will start in early 2022 and offer subscription payments of £10 million annually to four antibiotics for 10 years. These two pilot programmes are an exciting initial step towards creating a global delinked pull mechanism. Rex and Outterson (Reference Rex and Outterson2020) estimate that if the United Kingdom’s subscription programme was scaled up to a G20-financed programme, reflecting individual national contributions to total G20 GDP, the G20 could offer a global delinked pull incentive of US$ 2–4 billion per novel antibiotic. Therefore, if other countries within the G20 offered similar subscription payment schemes adjusted for their overall GDP or national drug sales then a global pull incentive is feasible.
Subscription model in the USA
Another promising development is the reintroduction of the Pioneering Antimicrobial Subscriptions to End Upsurging Resistance (PASTEUR) Act to United States Congress previously submitted in September 2020 (Bennet et al., Reference Bennet2023; Global AMR R&D Hub, 2020). The PASTEUR Act would create a delinked subscription scheme for priority antibiotics available to the United States Centers for Medicare and Medicaid Services. Like the United Kingdom’s programme, PASTEUR would offer eligible antibiotics annual payments of US$ 750 million to US$ 3 billion for 10 years along with stipulations regarding access, appropriate use and post-market evidence generation. The entire package would total US$ 6 billion.
The need for a global coordinating body for antibiotic R&D investment
Coordinating antibiotic incentivization is a complex task, but essential to creating an efficient and effective continuum of antibiotic incentivization. National governments, global institutions, NGOs and industry often independently invest their resources in antibiotic R&D projects and funding programmes. This has partially been responsible for mismatched and incomplete global incentive packages (Renwick, Simpkin & Mossialos, Reference Renwick, Simpkin and Mossialos2016). In addition, many of the antibiotic R&D initiatives operate in isolation from one another despite their commonalities. There is a clear risk of duplicating efforts with initiatives that have similar mandates and receive interweaving funding from different payers.
The Global AMR R&D Hub was established in 2018 by the German government to provide a knowledge sharing platform about current incentive programmes, the antibiotic clinical pipeline and R&D financing to guide policy-makers, organizations and funders towards evidence-based, collaborative decisions about antibiotic investment. Ideally, this hub could be taken a step further to become a global governing body that can take a more active role in coordinating antibiotic R&D incentive programmes at an international level and direct their operation at national levels. This global governing body could establish a unified direction for international antibiotic R&D incentives and guide incentive programmes towards achieving a more balanced global R&D incentive profile.
Such an entity would also help ensure that broader AMR goals related to a global One Health approach are reinforced by the individual incentives. The concept of One Health recognizes that AMR reaches all edges of the world and impacts humans, livestock, wildlife and our broader environment, and, therefore, a holistic strategy addressing all areas of the issue is needed for a long-term solution. Issues such as veterinary antibiotic use, rapid diagnostic tools for identifying pathogens, vaccinations, antibiotic stewardship and antibiotic access all play vital roles in tackling AMR. Fixing the antibiotic pipeline will be wasted if the root causes of AMR itself are not addressed.
Policy relevance and conclusions
Health systems traditionally rely on private industry to finance the discovery and development of novel medical therapies in exchange for patents that provide developers with market exclusivity and freedom to choose their price. However, in the field of antibiotics, a multitude of unique scientific, regulatory and economic barriers prevent this arrangement from working sufficiently. Consequently, the antibiotic discovery and development pipeline severely lags behind the critical public health need for novel antibiotics. Innovative incentives and funding mechanisms are necessary to fix this broken market and overcome the barriers that impede progress through the entire antibiotic value chain.
Over recent years, many multilateral, European and national-level incentive programmes have been implemented to repair the antibiotic value chain. These have lifted the clinical pipeline out of dormancy. Promising antibiotic drugs and alternative therapies are on the horizon. However, with few truly innovative drugs targeting high-priority pathogens, the present pipeline is not sufficient to overcome the relentless advancement of resistance rates. We must capitalize on global momentum to tackle AMR by bolstering and calibrating existing push funding and expand pilot programmes for pull mechanisms. The United Kingdom’s subscription programme and the United State’s PASTEUR Act are encouraging steps towards addressing the serious lack of pull financing and commercial incentivization. A global governing body that provides overarching guidance to international and national-level incentive programmes could be an asset to achieving an effective continuum of antibiotic R&D incentivization.Footnote 2
Key messages
Chapter 3.10 evaluates innovative financing for neglected diseases. Neglected diseases account for about a fifth of the global burden of disease and affect over 1 billion people. They are neglected because the pharmaceutical sector does not consider it profitable to develop treatments for them. This reflects the fact that neglected diseases are most prevalent in low- and middle-income countries (LMICs) with relatively low purchasing potential. Key learning includes that:
Global pharmaceutical R&D invests a disproportionate share of innovation and activity in diseases that affect high income countries, something which fosters significant inequities.
A range of push and pull incentive mechanisms have been developed to delink the cost of research from market profitability and promote innovation in areas of need. These include measures to:
○ reduce the upfront costs by subsidizing R&D pre-discovery (push incentives); and
○ offer a reward post-discovery (pull incentives).
The evidence on the effectiveness and reach of incentive schemes is scant and more needs to be done to understand the relative cost–effectiveness of the different incentive mechanisms and the extent to which they mitigate inequalities in innovation and access to new medicines.
A global, unified governance framework for needs assessment and resource allocation could usefully:
○ carry out systematic comparisons of the relative needs associated with neglected diseases globally;
○ assess the costs and benefits of addressing these;
○ set priorities for the coordinated global allocation of funding and targeted incentive mechanisms; and
○ consider payment mechanisms that will translate research into market launches.
Introduction
Neglected diseases (NDs) comprise a diverse set of around 20 diseases and disease groups, depending on the classification used. Typically considered to offer little scope for profitability to the pharmaceutical industry, these diseases are known as neglected diseases either because their prevalence is proportionally small (rare diseases) or because they are endemic in LMICs that cannot afford to buy either treatment or prevention therapies at market prices. As a result, market incentives for R&D to develop therapies for these conditions are weak (Maurer, 2005).
Neglected diseases include several parasitic, viral and bacterial diseases that cause substantial illness globally (Table 3.10.1). Neglected disease products were only 4% of all therapeutic products registered between 2000 and 2011 (Belen et al., Reference Belen2013). Despite these diseases affecting more than 1 billion people, causing around 19% of global burden of disease, with devastating health, social and economic consequences (Fitzpatrick et al., Reference Fitzpatrick and Holmes2017; IHME, 2019), there is substantial inertia in the development of treatments and prevention targeting these diseases. Fig. 3.10.1 illustrates the wide geographical distribution of disability-adjusted life years (DALYs) from neglected diseases between 1990 and 2010 for both sexes and all ages.
Disease categories
1. HIV/AIDS
2. TB
3. Malaria
4. Diarrhoeal disease (rotavirus, cholera, shigella, cryptosporidiosis, enterotoxigenic Escherichia coli, enteroaggregative E. coli and giardiasis)
5. Kinetoplastid disease (sleeping sickness or HAT, Leishmaniasis, Chagas disease (American trypanosomiasis))
6. Bacterial pneumonia and meningitis (Streptococcus pneumoniae, Neisseria meningitidis)
7. Salmonella infections (typhoid and paratyphoid, non-typhoidal Salmonella enterica)
8. Helminths infections (schistosomiasis, onchocerciasis, lymphatic filariasis, tapeworm, hookworm, whipworm, roundworm, strongloidiasis)
9. Dengue
10. Hepatitis B
11. Hepatitis C
12. Leprosy
13. Cryptococcal meningitis
14. Snakebite envenoming
15. Buruli ulcer
16. Trachoma
17. Leptospirosis
18. Rheumatic fever
19. Mycetoma
20. Other diseases (rare diseases, chikungunya, dracunculiasis, rabies, scabies, yaws)
Neglected diseases disproportionately affect LMICs
DALYs: disability-adjusted life-years.

While over time there has been a decline in the global burden of disease associated with neglected diseases, they still disproportionately affect LMICs (Fig. 3.10.2).
Neglected diseases have declined in richer countries but remain constant in LMICs
B: billion; DALYs: disability-adjusted life-years; M: million.

Fig. 3.10.2 Long description
The y-axis represents the D A L Ys per 100,000 from 0 to 150k, while the x-axis represents the Year from 1990 to 2020. There are 4 lines representing the World Bank income classifications, as follows. Low-income: from (1990, 175k) to (2020, 100k). Lower-middle income: from (1990, 115k) to (2020, 65k). Upper-middle income: from (1990, 60k) to (2020, 50k). High income: (1990, 15k) to (2020, 10k).
Diarrhoeal diseases, HIV/AIDS, malaria, tuberculosis (TB) and typhoid and paratyphoid are the top five diseases that contribute the highest burden of DALYs (Fig. 3.10.3). The bottom five diseases that contribute the lowest burden of DALYs are trachoma, Chagas disease, acute hepatitis B, leprosy and acute hepatitis C (Fig. 3.10.3).
Top five neglected diseases: diarrhoeal diseases, HIV/AIDS, malaria, TB, and typhoid and paratyphoid
B: billion; DALYs: disability-adjusted life-years.

Fig. 3.10.3 Long description
The x-axis represents D A L Ys from 0 to 3 billion, while the y-axis represents the diseases. Between 0 and 1 billion D A L Ys: Typhoid and paratyphoid, Invasive non-typhoidal, Salmonella, Leishmaniasis, Dengue, Lymphatic filariasis, Schistosomiasis, Tapeworm, Ascariasis, Hookworm disease, Onchocerciasis, African trypanosomiasis, Trichuriasis, Trachoma, Chagas disease, Acute hepatitis B, Leprosy, and Acute hepatitis C. Between 1 and 2 billion: Malaria and Tuberculosis. Between 2 and 3 billion: H I V/A I Ds. Above 3 billion: Diarrheal diseases.
World Health Organization’s (WHO’s) neglected diseases roadmap, 2021–2030
The WHO Road Map for Neglected Tropical Diseases 2021–2030 sets out global targets and milestones for 2030, including 90% reduction in cases requiring interventions, 75% reduction in DALYs lost to neglected diseases, working to eliminate at least one neglected disease in 100 countries, and eradicating two neglected diseases globally. The roadmap highlights research, development and innovation as “fundamental enablers of programmatic progress for all neglected diseases” (WHO, 2021a). To achieve this endeavour, the WHO Council highlights the need for a systematic approach to innovation and the elimination of unacceptable inequities in access to treatment and prevention (WHO, 2021b).
Delinking the costs of R&D from the cost of new therapies: financing incentive mechanisms
The eradication of neglected diseases or the mitigation of their impacts requires greater pharmaceutical innovation. The report on financing and coordination by WHO’s consultative expert working group on R&D (WHO, 2012) highlights that novel financing incentive mechanisms are required to address these challenges. The World Health Assembly passed a resolution in 2006 that highlighted the importance of “incentive mechanisms … addressing the linkage between the cost of R&D and the price of medicines, vaccines, diagnostic kits and other health care products” in addressing unmet needs for neglected diseases (WHO, 2007). The design of financing incentive mechanisms is important to ensure not only sustained investment in R&D but also an efficient targeting of effort and resources towards key areas of need.
In this chapter, we quantify some of the systemic gaps with regards to the distribution of pharmaceutical R&D activity and funding across neglected diseases, and describe some of the underlying reasons for these gaps. We then discuss the financial incentive mechanisms in use since 2007 in terms of pre-discovery push (public–private partnerships, in particular product development partnerships, R&D grants and subsidies, fiscal measures) and post-discovery pull (transferable patent extensions, patent buyouts, priority review vouchers (PRVs), advance market commitments (AMCs), prizes). We examine the evidence for their effectiveness levels, noting their relative advantages and disadvantages. We conclude with insights into the overall state of R&D funding for neglected diseases.Footnote 1
Trends in funding, 2007–2019
Fig. 3.10.4 illustrates total spending in US dollars by source of spending on R&D for new products and technologies to address challenges in public health caused by neglected diseases between 2007 and 2019. Total spending is around US$ 3.25 billion per year and was highest in 2009, 2017, 2018 and 2019 and lowest in 2007 and 2015. Between 2015 and 2018 spending on R&D for neglected diseases amounted to US$ 17.9 billion, 2.7% of global pharmaceutical R&D spending (US$ 660 billion) (Statista, 2021), signalling underinvestment in neglected disease R&D, considering that neglected diseases account for 19% of the total global burden of disease (IHME, 2019).
Global pharmaceutical companies are underinvesting in neglected disease R&D, 2019
B: billion.

Between 2007 and 2019, on average, the three areas that accounted for the highest proportion of spending, in descending order, were vaccines, drugs and basic research (Fig. 3.10.5). The year 2014 saw the highest spending, with vaccines, drugs and basic research accounting for about 37.5%, 22.5% and 20% of total spending, respectively, when compared to other products such as diagnostics and core funding and other R&D products. Cumulatively, between 2015 and 2019, there was a gradual decline in total spending across all the different types of products.
Most money is spent on vaccines, drugs and basic research
R&D: research and development.

Between 2007 and 2019, although around 30% of total spending was unspecified, the majority (approximately 70%) of spending was shared between two stages, namely the clinical and the basic and fundamental research stages (Fig. 3.10.6). The regulatory, implementation, market launch and post-market stages received the smallest proportions of the total funding. Even though the proportion of total funding invested in clinical research has remained constant at around 35% during the period 2015 to 2019 (Fig. 3.10.6), the increased funding in clinical and preclinical R&D over the years could be translated into further innovation for neglected diseases in the years to come.
Most R&D spending to address neglected disease challenges goes on just two stages
R&D: research and development.

Sources of funding
The three most common sources of funding were industry, philanthropic and public sources. Between 2007 and 2019, public and philanthropic sources accounted for more than 70% and 20% of total expenditure, respectively, while industry sources accounted for about 10%.
The United States of America (USA) consistently ranks as the top funder, funding on average 65% of total spending between 2007 and 2019. Apart from the EU, which funds on average 3% of the total expenditure, other top funding countries include the United Kingdom and France, which fund on average 6% and 2%, respectively. However, it is important to note that over the same period, about 13% of the total spending came from countries that were not specified.
Fig. 3.10.7 shows total neglected disease R&D spending by type of recipient. On average academics and other research institutions receive the highest amount of investment followed by industry, whereas “other intermediaries”Footnote 2 receive the lowest amount of funding.
Academics and research institutions receive the biggest proportion of investment
PDP: product development partnership.

Fig. 3.10.7 Long description
The y-axis represents Total investment in U S dollars, from 0 to 4 billion, while the x-axis lists the years. The total values are as follows. 2007: 2.95 billion. 2008 to 2016: Between 3 and 3.5 billion. 2017: 3.6 billion. 2018: 4 billion. 2019: 3.9 billion.
Inequities and inequalities in R&D activity and funding
When we compare the distributions of pharmaceutical R&D activity and global DALYs across neglected diseases (Fig. 3.10.8), for the diseases at the top of the distribution of DALYs there is a disproportionate concentration of innovation in low-burden diseases, meaning that low-burden diseases receive more than the fair share of R&D activity when we consider their need relative to other diseases (inequity pro-low burden). This inequity is even more pronounced once we consider market launches in LMICs where we see low-burden diseases experience more market launches than their relative need would warrant when compared to high burden diseases (Fig. 3.10.9).
Low-burden diseases receive more than their fair share of R&D
DALYs: disability-adjusted life-years; R&D: research and development.
Note: Authors’ analyses.

LMICs receive few market launches for new pharmaceutical products
DALYs: disability-adjusted life-years; R&D: research and development.
Note: Authors’ analyses.

These inequities can be attributed to inequalities in the distribution of R&D funding across neglected diseases and/or the fact that most LMICs lack the resources and research infrastructure to develop their own medicines (Mrazek & Mossialos, Reference Mrazek and Mossialos2003).
The 10 neglected diseases that received the highest R&D investment in US dollars between 2007 and 2019 for new products and technologies to address challenges in public health are shown in Fig. 3.10.10. HIV/AIDS received the highest investment by about US$ 16.9 billion, followed by malaria and TB, with US$ 7.9 billion and US$ 7.8 billion, respectively. Mycetoma, leptospirosis and hepatitis B received the lowest investment, which cumulatively in the last five years (2015 to 2019), was around US$ 1.5 million, US$ 9.3 million and US$ 16.5 million, respectively (Policy Cures Research, 2021a).
HIV/AIDS, malaria and TB receive most investment
B: billion.

Between 2015 and 2018 the cumulative spending has seen a steady increase, albeit remaining concentrated on HIV/AIDS, malaria and TB. Looking at global spending for R&D activity for neglected diseases, we observe a disproportionate concentration on low-burden neglected diseases.
Fig. 3.10.11 (the concentration curve of global R&D activity (1980–2019) and DALYs in LMICs (2018–2019)) and Fig. 3.10.12 (the concentration curve of market launches in LMICs (1980–2019) and DALYs (2018–2019) in LMICs (2018–2019)) show that low-burden diseases receive more than their fair share of funding given their relative disease burden. With the exception of spending on regulatory, implementation, market and post-market launch activities, this inequity is more pronounced when one considers funding allocated only to LMICs.
Low-burden diseases received more than their fair share of funding
DALYs: disability-adjusted life-years R&D; research and development.
Note: Authors’ analyses.

Reasons for inequities and inequalities
Several mechanisms may explain these inequities in innovation that impact differential access to treatment for neglected diseases to the detriment of health and well-being in LMICs. Concerns around pricing, affordability and the low potential for profit of those treatments in LMICs implies that firms have little incentive to develop innovations for these populations. This is aggravated by HICs giving priority to fund R&D for diseases that impact their own populations and the lack of international coordination in pooling and allocating resources to innovation taking account of health needs across all disease areas and geographies, as well as affordability.
These inequities are also intrinsically related to market failures and the effectiveness of mitigating strategies, including financing and incentive mechanisms.
Market failures in R&D: misalignment between private incentives and health need
There are several features of the R&D sector in the context of pharmaceutical innovation that are associated with market failures as a result of which the resource allocation for R&D efforts is not socially optimal (Arrow, Reference Arrow1962), thus justifying government intervention. Most notably there is imperfect appropriability, with significant knowledge spillovers implying that firms will not fully recoup the benefits of their investment in R&D (Henderson & Cockburn, Reference Henderson and Cockburn1996; Bloom, Schankerman & Van Reenen, Reference Bloom, Schankerman and Van Reenen2013). Research shows social rates of return to R&D (i.e. returns to the innovator, benefits to other firms and to society) to be up to five times higher than private rates of return (Salter et al., Reference Salter2000). These may lead to underinvestment (Romer, Reference Romer1990), in particular in risky areas where prospects of profitability are uncertain, such as neglected diseases.
There is also information asymmetry between pharmaceutical firms and funders because several aspects of innovation and its processes are difficult to describe contractually and there are often no incentives for private firms to disclose them. Asymmetry of information between firms and funders typically leads funders to underinvest in R&D in the light of risk and uncertainty (Czarnitzki & Toole, Reference Czarnitzki and Toole2007). This underinvestment may be more accentuated in markets with high levels of uncertainty such as those for neglected diseases. It also disproportionately impacts firms that may lack the financial resources to self-fund their activities; thus, decreasing prospects of breakthrough innovation by smaller but innovation-agile firms that play a crucial role in neglected disease markets (BVGH & BIO, 2012). Small and medium-sized enterprises (SMEs) play an important role in the development of innovation for neglected diseases being engaged in 41% of drug and vaccine R&D activity (BVGH & BIO, 2012), but they face severe funding constraints and often bear the risks and uncertainty associated with therapy development.
Infectious diseases do not have borders, thus eradication and to some extent herd immunity is a public good, which implies that some countries will free-ride on others’ efforts to invest in control and prevention measures. At an individual level there are externalities, implying that the social marginal benefits of infection control are higher than the marginal private benefits, leading to under provision of preventive and infectious control measures.
These factors, combined with the fact that pharmaceutical innovation is costly, lengthy and risky, result in firms focusing on markets that maximize the return on investment and therefore the level of innovation for neglected diseases is suboptimal.
These issues are often used as the rationale for intellectual property rights. Beyond the standard drawbacks of patent systems (e.g. costly patent races, incentives for incremental rather than breakthrough innovation, barriers to entry, pre-emptive patenting, etc.; see Gallini and Scotchmer (Reference Gallini, Scotchmer and Maurer2002) for a review), patent systems bring additional challenges in the context of neglected diseases. Patents are associated with lack of affordability in low-income settings where neglected diseases are endemic. And importantly, since markets for neglected diseases are therefore small, the incentives inherent in patent systems are reduced in the context of these diseases.
As a result, market incentives reinforced through a patent system alone are insufficient to stimulate innovation for neglected diseases and should, therefore, be coupled with other incentive mechanisms. In particular, policies related to public and donor financing have an important role to play. These financing policies can aim to build research capacity through the direct funding of innovation, or they can be designed to steer R&D and ensure equity and affordability through the implementation of a set of incentive mechanisms that directly or indirectly affect investment in R&D.
Using incentive mechanisms to stimulate innovation for neglected diseases: an overview
The underlying principle behind these mechanisms is the “delinkage” of the cost of research from market profitability so that the incentive to enter the market is not (or is less) contingent on the ability to charge high prices and recover costs through sales. Push mechanisms reduce upfront costs inherent to R&D activities by subsidizing R&D activities prior to product discoveries (i.e. ex ante). Pull mechanisms, on the contrary, offer a reward contingent on successful product discoveries (i.e. ex post). Hybrid mechanisms combine pull and push incentives.
Push mechanisms work better in settings where developers are capital constrained and risk averse. By subsidizing R&D costs push mechanisms also stimulate competition in innovation by enabling small companies and start-ups that lack capital to develop R&D activities. However, when effort is difficult to monitor and contracts are incomplete with research outcomes not contractable, push incentives lead to moral hazard, resulting in suboptimal levels and scope of innovation (Kremer, Reference Kremer2002).
Adverse selection may also arise. Payers have little insight into the relative chances of success of different R&D targets and the effort exerted in each project. Therefore, push mechanisms may incentivize projects with small chances of success (Kremer, Reference Kremer2002).
Under pull incentives, on the other hand, the risk lies with the innovator, with incentives accruing only when innovation occurs and targets key public health priorities. Innovators are better informed about the risk of investment but also, bearing the risk of development, have a strong incentive to prioritize projects with a higher chance of success and better prospects of social and financial impact. If public health needs are well defined, these pull mechanisms enable the funder to direct incentives to key priority areas as the reward is attributed after the innovation has occurred.
However, these mechanisms benefit larger companies that can leverage capital for R&D. Smaller firms (e.g. biotech companies) that are capital constrained and more risk averse are less likely to benefit from pull incentives. This is particularly relevant in markets where the prospects of profitability are weak or uncertain such as in the case of neglected diseases.
The extent to which push and pull incentives are effective also depends on the stage of the R&D process they target, given that the costs and risk vary considerably during the R&D process.
Pull incentives require the desired innovation to be specified in advance, so are less likely to encourage basic and fundamental research (Moran et al., Reference Moran2005; Grace & Kyle, Reference Grace and Kyle2009). Push mechanisms, on the contrary, incentivize R&D by decreasing the marginal cost of development and/or by ensuring access to key research inputs through collaboration with key stakeholders, thus favouring the invention phase of the R&D process when compared to pull. The facilitated collaboration with other stakeholders that is inherent to some forms of push mechanism (e.g. public–private partnerships) implies that they are also useful in supporting advanced stages of the R&D process, including regulatory hurdles and market launch.
The effectiveness of pull and push incentives is also likely to vary depending on the type of technology. Drug therapies that target treatment or management of chronic conditions offer a broader prospect for recouping R&D investments than prevention therapies or vaccines. Therapies and vaccines that target larger markets with high willingness and ability to pay for therapies (e.g. HIV) are less risky than smaller markets (e.g. schistosomiasis). Therapeutic areas also differ on scientific challenges and development times and costs. One could expect incentive mechanisms that enable collaboration among different stakeholders with different expertise and inputs to therefore perform better in areas where it is scientifically more challenging to innovate than those mechanisms that bring only R&D subsidization.
In what follows we present an overview of the main types of push and pull incentives. A full discussion of the advantages and disadvantages can be found in Table 3.10.2. Note that, in addition to push and pull mechanisms, pool mechanisms can be seen as indirect mechanisms to incentivize R&D. In pool mechanisms intellectual property and knowledge is “pooled” to enable collaboration in research, technology and knowledge sharing to fast-track R&D (Gold et al., Reference Gold2007). While these mechanisms relate to intellectual property and knowledge sharing rather than financing mechanisms, they have the potential to substantially decrease the costs and thus incentivize innovation. AMCs, one of the pull mechanisms discussed below, also involves pooling, but in terms of purchasing, rather than intellectual property and knowledge.

IP: intellectual property; ND: neglected disease; NTD: neglected tropical disease; PPP: public–public partnership; PRV: priority review voucher; R&D: research and development.
Table 3.10.2 Long description
The table has 11 main columns: Mechanism, Commitment timing, Payment timing, Mechanism focus, Monitoring challenges, Intellectual property appropriability, Incentives for access, Disease focus (general versus targeted) or scope for steering social desirable innovation, Time inconsistency, Risk sharing (borne mostly by funder, by developer, shared), and Knowledge sharing or pooling of expertise. It reads as follows.
Under Push: Row 1: Research grants. Commitment timing: Pre- and during innovation. Payment timing: Pre-innovation. Mechanism focus: Advance lump sum funding (depends on the grant where some may cover initial R and D costs while others may not). Monitoring challenges: Funders are unable to perfectly monitor research activity and effort or use of funds. Moral hazard and misdirection of resources towards other activities is possible. Intellectual property appropriability: Retained by: Originator unless donor sets IP or price conditions. Incentives for access: Pricing or access conditions are not usually specified, hence may neither enable nor hinder access. Disease focus: Can be general but can also target investment towards priority areas with large social benefits or High, if funder prespecifies conditions of award around breakthrough innovation, otherwise firms can apply for grants with any project so long as private marginal cost is close to zero. Time inconsistency: Not an issue since grant is not contingent on successful innovation. Risk sharing: Mostly borne by funders since grants are awarded ex ante on the premise of a potential product, not on an actual delivery. Knowledge sharing: Both possible if multiple partners involved in innovation are set as precondition for award.
Row 2: P P Ps. Commitment timing: Pre- and during innovation. Payment timing: Pre-innovation since funding is provided to alleviate capital constraints. Mechanism focus: Funding from public or philanthropic donors (covers upfront R and D costs). Monitoring challenges: Significant monitoring challenges due to large information asymmetries between funders and developers. Intellectual property appropriability: Varies; IP and pricing conditions may be set. Incentives for access: High (variable I P arrangements but most set price or accessibility conditions). Disease focus: Both possible: funding by government tends to have unrestrictive use while private funding tends to be restricted, although better prioritization of neglected diseases since collaborative agreements are normally independent of market size or High. Time inconsistency: Not an issue since funding is not contingent on successful innovation. Risk sharing: Borne by funder, i.e. public sector bears most of the financial risk. Knowledge sharing: High between collaborating partners, reduces duplication of efforts and increases scale and scope of activities.
Row 3: Fiscal incentives. Commitment timing: All stages of innovation. Payment timing: All stages of innovation. Mechanism focus: Tax credits, tax exemptions, tax deductions, tax allowances, for example, depreciation allowances once inputs are realized (covers R and D costs). Monitoring challenges: Vary across mechanisms. When inputs are rewarded monitoring is difficult if firms use creative accounting to increase claims. If incentives are pre-innovation, monitoring may be difficult. Intellectual property appropriability: Retained by: Originator but IP and price conditions may be set for selected markets. Incentives for access: Ultimately depends on whether there is passthrough of tax credits onto consumers. Do not generally accommodate provisions ensuring accessibility or affordability but in some cases may require companies to donate licenses to foreign government or non-profit entity (for example, N D tax credit H R 3156). Disease focus: Can target specific disease area or groups of diseases or R and D targets normally at the discretion of private developers and may be misaligned with social priorities. Time inconsistency: Limited scope for time inconsistency issue since incentives applicable for inputs and not actual product development. Risk sharing: Shared between developer and funder. The extent to which risk is shared varies by specific fiscal incentive, the timing of its application in the R and D process and the financial value of the incentive. Fiscal incentives on N T Ds tend to reduce expenses on early R and D activities and therefore risk sharing is subject to degree of costs sharing. Knowledge sharing: Some mechanism (e.g. tax credits) require donating licenses to not for-profit entities enabling knowledge sharing or target different types of innovators allowing pooling from diversified sources of knowledge and expertise, including small firms for whom financial incentives may be crucial for survival in the market.
Under Pull. Row 4: Transferable Patent Extensions. Commitment timing. Payment timing: Post innovation. Mechanism focus: Reward (ring fences revenues). Monitoring challenges: Generally irrelevant but rent-seeking behaviour may occur if qualification criteria for an extension are incomplete and nonspecific. Intellectual property appropriability: Retained by: Originator. Incentives for access: Hinders access if innovator applies extension to another blockbuster drug, can limit generic entry of that drug and limit its access and affordability. Disease focus: Targeted towards innovation in critically needed but less profitable areas or High. Time inconsistency: Not an issue since there is no commitment of extension pre-innovation. Risk sharing: Borne by the developer since no upfront funding is involved. Knowledge sharing: Does not enable knowledge sharing/Low since collaboration between different firms is unlikely.
Row 5: Priority review vouchers. Commitment timing: Pre-innovation. Payment timing: Post-innovation. Mechanism focus: Reward (ring fences revenues). Monitoring challenges: Irrelevant since voucher is granted conditional on the innovation of N D-specific drugs. Intellectual property appropriability: Retained by: Originator. Incentives for access: Early market entry enables faster access in high-income countries. Market based nature of the scheme, however, means that access depends on firms pricing strategies, and therefore does not ensure access to deprived populations where neglected disease may be endemic. Disease focus: Targeted at key areas of need/High since PRV will be used for drugs with highest expected return for firms and valued highly by society. Time inconsistency: Limited scope for time inconsistency since P R Vs are rewarded post innovation. Risk sharing: Borne by the developer since voucher is conditional on innovation for a specific neglected disease being delivered. Knowledge sharing: Low.
Row 6: Advanced market commitments. Commitment timing: Pre-innovation. Payment timing: Post-innovation. Mechanism focus: Reward (ring fences revenues). Monitoring challenges: Irrelevant since voucher is granted conditional on the innovation of N D specific drugs. Intellectual property appropriability: Retained by: Originator. Incentives for access: High (award conditional on negotiated low prices) - attempts to provide short and long-term access for low-income countries but depends on complexity of intervention and facility to scale up production. Disease focus: Targeted or reward output rather than input so less prone to moral hazard, allowing effort allocations to socially desired outcome. Time inconsistency: Time inconsistency problems can occur in that the government commits ex ante but may not comply with commitment ex post. Risk sharing: Developer bears risk entirely during development phase. Post development though there is purchasing commitments by payers mitigating risk for developers. Knowledge sharing: Low since scheme fosters more competition – several companies compete simultaneously to develop the product fastest.
Row 7: Prizes. Commitment timing: Pre-innovation. Payment timing: Post-innovation. Mechanism focus: Reward (prize). Monitoring challenges: Irrelevant if prize awarded for finished product. However, if prize is awarded to encourage early-stage research, then monitoring of effort may be difficult. Intellectual property appropriability: Variable; patent expropriation in some cases, in others I P is retained by originator. Incentives for access: Low unless I P is expropriated. Disease focus: Targeting specific diseases or High. Time inconsistency: Time inconsistency problem with uncertainty on whether sponsor commits to agreed size of reward post-innovation. Risk sharing: Borne by the developer since prize award is fixed and awarded only upon successful innovation. Knowledge sharing: Low scope of collaboration due to the winner-takes-it-all nature of the scheme.
Row 8: Patent buyouts (proposal). Commitment timing: During and post-innovation. Payment timing: Post-innovation. Mechanism focus: Reward in the form of a prize or premium paid by the government. Monitoring challenges: Generally irrelevant since reward is contingent on successful innovation. Intellectual property appropriability: Government can acquire patent directly from the innovator and place it in the public domain in exchange for a payment. Incentives for access: If patent is bought, it is proposed to be made available publicly so it enables lower prices and better access to innovation once rights have been bought out. Disease focus: Targeted or encourages sequential and complementary innovation if the government buys the patent and places in the public domain eliminating need for contracting or licensing. Time inconsistency: Limited scope for time inconsistency since there is no commitment pre-innovation. Risk sharing: Developer bears complete risk of innovation in the development phase. Knowledge sharing: High since the patent is placed in the public domain.
Push mechanisms
Product development partnerships (PDPs)
PDPs are the most common type of public–private partnerships for neglected diseases (Aerts et al., Reference Aerts2017; Widdus, Reference Widdus2005). PDPs may exist as voluntary collaborations between private companies and public funders, but may also involve contract-based stakeholders such as academic centres that provide scientific expertise in drug development (Moran, Reference Moran2005; Moran et al., Reference Moran2005; Widdus, Reference Widdus2005). More recently, along with public and private partners (e.g. academia, public funding organizations and pharmaceutical companies) PDPs, and public–private partnerships more broadly, include diverse stakeholders such as regulators, insurers and patient organizations (de Vruehm, de Vlieger & Crommelin, Reference de Vrueh, de Vlieger and Crommelin2019).
In 2017, there were around two dozen PDPs for neglected diseases, most created around 2000 (Borrás, Reference Borrás2017), with most focusing on malaria, HIV/AIDS and tuberculosis (TB). Notable examples are shown in Table 3.10.3 (Munoz et al., Reference Munoz2015; Borrás, Reference Borrás2017).
While focusing on all R&D stages, PDPs are particularly relevant in incentivizing early-stage innovation when firms may not have easy access to capital (Grace & Kyle, Reference Grace and Kyle2009) by financing the large upfront R&D cost through public or private funding, or a combination of both (Chapman et al., Reference Chapman2020; Sloan & Hsieh, Reference Sloan and Hsieh2017).
External financing (mainly through the public sector and multiple philanthropic organizations) and amounting to 16% of total “external” R&D funding for neglected diseases (Chapman et al., Reference Chapman2020) reduces the cost of failure for collaborating partners by sharing the risk of failure early on between them, thus incentivizing private R&D (Moran et al., Reference Moran2005; WHO, 2013). In exchange for funding and research inputs, the developer commits to invest in less profitable products at early R&D stages of basic research and to a reduction in eventual profits. The public sector contributes to the development and/or clinical trial stages that require most of the investment (Moran, Reference Moran2005). In most cases, PDPs channel funding through pharma partners, who own the rights to the product. In return for those rights, the partner commits to ensuring global access to the product at a reasonable price for those in developing countries (NBR, 2014). Notably in some product development schemes intellectual property rights (IPR) are owned by the partnership, so enabling some pricing control once the innovation is developed and thus promoting affordability and access (Buse & Walt, Reference Buse and Walt2000). Box 3.10.1 provides a case study of a PDP and Table 3.10.3 provides selected examples to show PDPs’ common features and differences with regard to IPR.
Who are Medicines for Malaria Venture (MMV)?
A collaborative non-profit product development partnership established in 1999 to fund and manage R&D and access to antimalarial medicines for 400 partners in 50 countries. This includes clinical centres in endemic countries across sub-Saharan Africa, South-East Asia and South America. The mission of MMV is to support specific, targeted interventions to reduce the burden of malaria in disease-endemic countries by discovering, developing and facilitating the delivery of new, effective and affordable antimalarial drugs.
Funding
US$ 350 million, funding source more than 60% private.
How does the PDP model work?
With financial support from donors including government agencies, private foundations, international organizations, corporations, corporate foundations and private individuals, MMV operates a virtual R&D model bringing together partners from academia and the public and private sectors and uses funds to establish a portfolio of R&D projects for developing antimalarial medicines.
The PDP does not itself have the capacity or infrastructure to undertake early-stage development projects in-house; instead, it relies on its partners for financing and other in-kind contributions (i.e. laboratories and expertise) and then allocates resources to the most promising projects, coordinates partner activities for various stages of the R&D process and manages the project portfolio. The PDP acts as a facilitator, bringing dedicated sources of funding and know-how to committed researchers so they can collaborate on the right projects to fulfil the objectives of the PDP’s mission.
IPR and access
When MMV enters into contractual relationships with partners, they encourage partners to work with them to guarantee that malaria drugs that they develop and launch will be accessible to those most in need in malaria endemic countries. This means ensuring first and foremost that agreements made within the PDP meet this public health mission. MMV negotiates for new medicines to be made available at an affordable price – typically with no profit and no loss – through public sector channels.
To achieve this, MMV must retain the rights to any intellectual property arising from the R&D undertaken by their partners. This is essential in allowing them to develop and launch drugs for the benefit of target patient groups. The following principles are applicable to all MMV contracts.
Exclusivity: If MMV does not own the necessary IPR outright, it insists on being granted an exclusive licence to use the “programme intellectual property rights” and any necessary “background intellectual property rights” to develop a drug for malaria and bring it to market. That licence must be worldwide, to ensure maximum flexibility for later-stage activities such as manufacturing and distribution.
Royalty-free: Any such licenses are preferably royalty-free, at least in malaria endemic countries, to help keep costs to a minimum and ensure that the drug will be sold at the lowest price possible in these countries.
Transferable: MMV does not conduct any R&D in-house or any manufacturing and, therefore, requires IPR that can be transferred to other partners – especially manufacturing partners – if necessary.
Portfolio
MMV and partners manage a portfolio of over 65 projects, the largest portfolio of antimalarial R&D and access projects ever assembled. The 2021 portfolio includes 11 compounds in clinical development addressing unmet medical needs in malaria, including medicines for children, pregnant women and relapsing malaria and drugs that could support the elimination/eradication agenda.
Notable successful products – Coartem Dispersible
Coartem is an antimalarial paediatric formulation that was developed by Novartis and gained approval by securing a United States Food & Drug Administration (FDA) priority review voucher (“fast-track voucher”) in 2009. It is approved in over 80 countries and by several regulatory agencies in Africa, Swissmedic and the EMA, and it is the only artemisinin-based combination therapy which has been approved by the International Council for Harmonisation of Technical Requirements for Pharmaceuticals for Human Use regulatory authorities. The Coartem combination of artemether and lumefantrine reduces the risk of resistance developing to either agent, and is therefore useful for the treatment of chloroquine-resistant Plasmodium falciparum cases.

Table 3.10.3 Long description
The table has 8 columns: Name of P D P, About or purpose of P D P, Funding amount, Stakeholders involved, Disease focus, Type of technology, Targeted R and D stage, and Intellectual property rights implications. It reads as follow. Row 1: Drugs for Neglected Disease Initiative (D N D i). About: Collaborative P D P. Non-profit R and D organization established in 2003 to fund and manage R and D development for medicines across over 200 partners. D N D i has already delivered eight field-adapted and affordable treatments for five deadly diseases, and aims to have delivered 25 new treatments by 2028. Funding amount: 615.5 million Euros (raised by end of 2019). Funding source: 57 percent public, 43 percent private. Stakeholders involved: Founding partners: W H O T D R, M S F, Malaysian Ministry of Health, Kenya Medical Research Institute, Indian Council of Medical Research, Oswaldo Cruz Foundation and Institute Pasteur. Donors: 1. Public: Australian Trade and Investment Commission, United Kingdom Department of Health and Social Care, Dutch Ministry of Foreign Affairs, French Development Agency, G I Z, European Commission, etc. 2. Private: B M G F, M S F, Takeda Pharmaceuticals, Wellcome Trust, etc. Disease focus: Visceral Leishmaniasis, Human African trypanosomiasis (sleeping sickness), Chagas, paediatric H I V, filarial infections, mycetoma and hepatitis C. Type of technology: Treatment (drugs). Targeted: R and D stage: Drug discovery, translational research, clinical trials and registration and access. Intellectual property rights implications: Variable per drug D N D i adheres to basic principles stated in its intellectual property rights policy. The overarching theme is that it will ensure that the results of the work carried out under its auspices are disseminated as widely as possible and its products made readily available and affordable in developing countries.
Row 2: Medicines for Malaria Venture (M M V). About: Collaborative P D P. Non-profit product development partnership established in 1999 to fund and manage R and D development and access to antimalarial medicines across around 400 partners in 50 countries (donors and clinical centres in endemic countries). MMV has validated more than 19 new malaria drug targets since 1999. Funding amount: 350 million U S D (raised by the end of 2018); Funding source: More than 60 percent private. Stakeholders involved: Founding partners: Launched with initial seed finance of 4 million U S D from the Government of Switzerland, United Kingdom Department for International Development, the Government of the Netherlands, the World Bank and the Rockefeller Foundation. Clinical centre partners: 50 clinical trial sites in sub-Saharan Africa, South East Asia and South America. Donors: 1. Public: United States government (U S A I D, N I H), Australian Government; Development of Foreign Affairs and Trade, United Kingdom Government (D F I D and D o H), Netherlands Ministry for Development Cooperation, etc. 2. Private: B M G F, Wellcome Trust, G S K, Sanofi, etc. Disease focus: Malaria. Type of technology: Treatment (drugs). Targeted R and D stage: Drug discovery, translational research, clinical trials and registration and access. Intellectual property rights implications: M M V retains rights to any Intellectual property rights that is essential in allowing them to develop and launch drugs for the benefit of M M V target group. Principles include: exclusivity, royalty-free, transferable Intellectual property rights.
Row 3: T B Alliance. About: Collaborative P D P. Non-profit product development partnership of around 38 partners established in 2000 to fund and manage R and D development and access to T B medicines. Funding amount: Around 184 million U S D (raised by end of 2019). Stakeholders involved: Founding partners: Launched with issuance of Cape Town Declaration by around 28 partners, including B M G F, European Commission, M S F, W H O, World Bank, Wellcome Trust, etc. Donors: 1. Public: Australian Aid, United Kingdom F C D O and M R C, U S A I D, Germany Federal Ministry of Education and Research, Netherlands Ministry of Foreign Affairs, Ministry of Foreign Affairs (Republic of Korea), etc. 2. Private: B M G F, The Rockefeller Foundation, E D C T P, Global Health Innovative Technology Fund (Japan), U N I T A I D, etc. Disease focus: Tuberculosis. Type of technology: Treatment (drugs). Targeted R and D stage: Drug discovery, translational research, clinical trials and registration and access. Intellectual property rights implications: T B Alliance’s mission includes an explicit commitment to A A A Mandate that all new products will be adopted, available and affordable to those with T B. No further information on Intellectual property rights implications.
BMGF: Bill & Melinda Gates Foundation; DFID: Department for International Development; DNDi: Drugs for Neglected Disease Initiative; DoH: Department of Health; EDCTP: European and Developing Countries Clinical Trials Partnership; FCDO: Foreign, Commonwealth and Development Office; GIZ: German International Cooperation Society; MMV: Medicines for Malaria Venture; MRC: Medical Research Council; MSF: Médecins sans Frontières; NIH: US National Institute of Health; PDP: product development partnership; TB: tuberculosis; TDR: Special Programme for Research and Training in Tropical Diseases; WHO:World Health Organization.
Despite the wide proliferation of public–private partnerships in recent years, in particular those focused on product development, a systematic review by Aerts et al. (Reference Aerts2017) did not find a single impact evaluation related to them, barring one analysis that compared the cost–effectiveness of the PDP model against AMCs and a hybrid scheme (PDP until phase II trials, followed by AMCs later) in the context of immunizations for malaria. While costs were lowest for the PDP scheme, DALYs averted were also the lowest, rendering PDPs a non-cost-effective approach. Most descriptive evidence, however, suggests that PDPs have led to a substantial increase in investment in R&D and innovation for neglected diseases. Between 2009 and 2013, 57% of new approvals in WHO’s list of essential medicines were developed through PDPs. PDPs have been particularly successful in vaccine development, with more than 400 PDP-led vaccines under development (Breitstein & Spigelman, Reference Breitstein and Spigelman2013); and over half of the vaccines for neglected diseases during the period 2009 to 2013 resulting from PDPs (Cohen, Sturgeon & Cohen, Reference Cohen, Sturgeon and Cohen2014). Despite these promising results, impact evaluations are seriously lacking and consistent data collection and availability of data to analyse cost–effectiveness of PDPs are necessary.
R&D grants and subsidies
Grants and subsidies are normally in-advance lump sums awarded to fund R&D. They tend to focus on key priority areas identified by funders and cover the initiation of discovery or early stage research. Grants and subsidies constitute the main means to fund R&D adopted by public funders and third parties, contributing to 77% of total R&D funding for neglected diseases (Chapman et al., Reference Chapman2020). They specifically focus on early basic research, preclinical and clinical development stages, but tend to cover a wide range of neglected diseases (WIPO, 2014) and are primarily provided by public and philanthropic sources. This includes, for example, governments that allocate a proportion of their gross domestic product (GDP) such as the USA through the United States National Institute of Health and USAID, or the United Kingdom through the Department for International Development (DFID)Footnote 3 and Medical Research Council (MRC), as well as philanthropic organizations such as the Bill & Melinda Gates Foundation (BMGF) and the Wellcome Trust (Chapman et al., Reference Chapman2016). Grant funds are channelled either directly to researchers and developers or through a conduit (20% of research grants) such as public–private partnerships/PDPs with some private sector participation (Pugatch Consilium, 2017), or through non-PDP intermediaries such as the Global Health Innovative Technology Fund (GHIT) and the European and Developing Countries Clinical Trial Partnership. Non-PDP intermediaries generally have a broader funding base than PDPs, supported by science and technology organizations, aid agencies and philanthropic foundations, making them less vulnerable to changes from one donor funding stream (Table 3.10.4).

Table 3.10.4 Long description
The table has 8 columns: Name of intermediary, About or purpose of intermediary, Funding amount, Stakeholders involved, Disease focus, Type of technology, Targeted R and D stage, and Intellectual property rights approach. It reads as follows. Row 1: Global Health Innovative Technology Fund (G H I T). About: G H I T fund is a general incorporated association in Japan (P P P), founded in 2012 to facilitate and invest in global partnerships (including P D Ps) for the discovery and development of new health technology for infectious diseases prevalent in developing countries. Funding amount: More than 260 million U S D invested to date. Stakeholders involved: Japanese Government, B M G F and 6 Japanese pharmaceutical companies, and foundations such as the B M G F and Wellcome Trust. Disease focus: Malaria, T B and the 17 W H O defined N T Ds. Type of technology: Drugs, vaccines and diagnostics. Targeted R and D stage: Discovery, preclinical and clinical stages and registration. Intellectual property rights approach: Supports open access innovations through its access policy. When product development partners and/or participants are successfully granted a patent deriving from projects invested by the GHIT Fund, product development partners and/or participants will grant royalty-free licenses to users operating in least developed countries, as categorised by the United Nations classification and low-income countries, categorised by the World Bank classification.
Row 2: European and Developing Countries Clinical Trials Partnership (E D C T P 1 and 2). About: E D C T P is an E U-funded P P P established in 2014 between countries in Europe and sub-Saharan Africa to enhance research capacity, collaboration and accelerate the development of new or improved medical interventions for the identification, treatment and prevention of poverty-related infectious diseases. E D C T P 1 (2003 to 2015). E D C T P 2 (2014 to 2024). Funding amount: Total fund around 752.7 million Euros to date. Stakeholders involved: 14 European and 16 sub-Saharan African countries, supported by the European Union, third parties and participating states. Disease focus: T B, H I V, malaria, diarrhoeal diseases, lower respiratory tract infections, other neglected infectious diseases, including emerging and re-emerging infections of particular relevance in sub-Saharan Africa. Type of technology: Drugs, vaccines and diagnostics. Targeted R and D stage Phase 1 to 4 clinical trials, with an emphasis on phase 2 and 3 trials and access (product-focused implementation research). E D C T P also funds capacity development and international networking. Intellectual property rights approach: No specific information on Intellectual property rights implications was detected.
BMGF: Bill & Melinda Gates Foundation; EDCTP: European and Developing Countries Clinical Trials Partnership; EU: European Union; GHIT: Global Health Innovative Technology Fund; NTDs: neglected tropical disease; PDPs: product development partnership; PPP: public–public partnership; TB: tuberculosis; WHO: World Health Organization.
Evidence of the impact of grants and subsidies on neglected disease-specific R&D is lacking. However, general pharmaceutical industry research suggests that grants and subsidies have a positive effect on R&D investment, and the innovation of new molecules and patent applications (Toole, Reference Toole2012; Azoulay et al., Reference Azoulay2019; Kourouklis, Reference Kourouklis2021). These effects vary across different stages of drug development – in the case of orphan drugs, they are most pronounced in phase I and phase II of the drug development process (Kourouklis, Reference Kourouklis2021).
Fiscal incentives
Fiscal incentives focus on reducing the cost of R&D, raising the long-term rate of return on R&D investments, and include: tax exemptions, tax deferrals, tax allowances and tax credits (OECD, 2016).Footnote 4 Some apply to current expenditures, others to capital or revenues. Tax allowance, exemption and deduction consist of reducing the taxable amount by reducing the tax base before the tax liability is computed. With tax credits, in contrast, the tax liability is reduced by subtracting the credit after the liability has been determined. Tax deferrals do not reduce tax liability but defer tax payment. These incentives can be used to target single firms or foster collaboration across firms, with some schemes designed to support SMEs, and they can also be used to target a specific disease area or groups of diseases.
In practice, fiscal incentives for neglected diseases are mostly in the form of tax credits, exemptions and reliefs. Although the R&D phases targeted by fiscal incentives may vary across initiatives, tax incentives for neglected disease R&D have often been considered for encouraging basic and non-clinical research for vaccines or medicinal products (Rao, Reference Rao2011). By reducing the R&D cost, these incentives encourage innovation in areas of high risk and smaller returns on investment – such as neglected diseases. These particularly benefit SMEs that, while financially constrained, are often agile and innovative in neglected disease innovation (BVGH & BIO, 2012), thus increasing the prospects of breakthrough innovation.
There are two main tax incentive initiatives highlighted in literature (Monroe, Greenberg & Basey, 2015; Pugatch Consilium, 2017). These are the United States Neglected Disease Tax Credit Proposal (HR3156) which mandates a transfer of IPR, and the United Kingdom Vaccine Research Relief which is not necessarily limited to a neglected disease focus, but rather extends to orphan drugs and humanitarian driven innovations (Monroe, Greenberg & Basey, 2015; UK Government, 2016; US Congress, 2009a) (Table 3.10.5).

Table 3.10.5 Long description
The table has 6 columns: Fiscal incentive, About the scheme or incentive nature, Eligibility criteria or disease focus, Targeted companies, Benefits claimed, and Intellectual property rights implications. It reads as follows. Row 1: United Kingdom Vaccine Research Relief (V R R). About: Proposed and introduced in 2003, implemented and expired in 2017. In the United Kingdom R and D tax credits were introduced for S M Es in 2000 and extended to large companies from 2002. This is normally done through S M E scheme and Research and Development Expenditure Credits (R D E C) (non-neglected disease specific). V R R was introduced as an additional top-up relief for vaccines research. All companies may deduct a standard 100 percent of their R and D expenditure from their taxable income under S M E scheme and R D E C. While V R R allows 50 percent deduction on top for eligible R and D expenditure. Criteria: H I V/AIDS, T B and Malaria. Expenditures on activities ranging from identification of a chemical entity, or a potential vaccine through completion of Phase 3 clinical trials. Targeted companies: All companies. Large companies claiming VRR can only use the deduction option; they cannot claim payable credits for V R R. Benefits claimed: Number of claims under the V R R scheme remained at about 10 a year with support claimed of less than 5 million pounds each year between 2003 to 2004 and on average around 20 million pounds each year in the period up to 2012 to 2013. Intellectual property rights implications: No information detected on intellectual property rights implications.
Row 2: United States neglected disease tax credit proposal (H R 3156). About: Proposed in 2009, no information detected on introduction or implementation. This proposal was put forward by the biotechnology company (biotech) Genzyme with the sponsorship of Representative Donald Payne and others. 50 percent tax credit for non-clinical expenses for research on neglected disease treatments. Criteria: All N T Ds (see Table 3.10.1) and any infectious disease with unmet need or disproportionately affecting the poor. Qualified research: Only preclinical or basic research. Companies could not use the credit for expenses incurred from clinical trials or regulatory review. This includes expenses for in-house or contracted research activities undertaken for the purpose of non-clinical basic research only. With this specific criteria of discovering information - which is 1. technological in nature, and 2. the application of which is intended to be useful in the development of a new or improved business component of the taxpayer. Targeted companies: All companies. In-house or contracted research services. Benefits claimed: No information detected on implementation. Intellectual property rights implications: Mandates a transfer of intellectual property rights and could only apply for the credit if they have donated a royalty-free licence to a foreign government or a non-profit research organization for the claimed research in that year.
Given the reduced number of fiscal incentives for neglected diseases, their effectiveness in spurring research for neglected diseases is difficult to ascertain. Rao (Reference Rao2011) argues that tax credits in the United Kingdom did not attract new firms to invest in R&D for neglected diseases and alone are insufficient to increase R&D spending in global health. In contrast, the tax credits created in the Orphan Drug Act (P.L. 97–414) in 1983 have had a significant impact on orphan drug development, leading to 201 new orphan drugs in the market and this trend has been particularly strong in recent years; for example, 18 new drugs gained approval in 2014 (EY, 2015). Yin (Reference Yin2008) shows that the Orphan Drug Act-led income tax credit (equal to 50% of clinical trial expenses) increased the annual flow of clinical trials for drugs for rare diseases by 69%.
Pull mechanisms
Transferable patent extensions
Transferable patent extensions (TPEs) or wildcard patent extensions are a form of supply-side production response intended to encourage R&D for critically needed drugs in less attractive disease areas (Sonderholm, Reference Sonderholm2009). A successful innovator of a new drug is granted a one-time patent extension (ranging from six months to two years in the USA and five years in Europe) that can be applied to one of the innovator’s other drugs or sold to another firm. Such an extension is worthwhile for companies with a drug in their portfolio whose patent is near to expiry, and provide a source of return on investment (Moran, Reference Moran2005; Sonderholm, Reference Sonderholm2009; Seabury & Sood, Reference Seabury and Sood2017). These incentives can be particularly important for attracting companies to undertake R&D for neglected diseases because the return on investment in neglected disease markets remains insufficient due to limited market size and affordability (Seabury & Sood, Reference Seabury and Sood2017). Our review did not yield notable examples of TPEs granted for neglected diseases, but they have been proposed as a potential incentive in the context of developing new antimicrobials to tackle the problem of antimicrobial resistance (AMR) (Spellberg et al., Reference Spellberg2007; Spellberg et al., Reference Spellberg2008; Outterson, Samora & Keller-Cuda, Reference Outterson, Samora and Keller-Cuda2007). Within this context, Outterson and McDonnell (Reference Outterson and McDonnell2016) calculate the potential costs of a 12-month extension and conclude that such an extension would cost the USA’s health system more than US$ 4.8 billion, making such an extension extremely inefficient.
Patent buyouts
A patent buyout is an outcome-based pull mechanism aimed at delinking returns from price and volume-based sales by acquiring the patent directly from the innovator in exchange for a payment (Batista et al., Reference Batista2019). The government offers to buy the rights to the patent to encourage innovation and subsequently places the patent in the public domain for unrestricted access. The scheme may specify criteria ex ante to run a prize-like competition or may engage in ex post identification of a suitable patent candidate (Robinson, Ritchie & Kenny, Reference Robinson, Ritchie and Kenny2020). Patent buyouts add a markup to private market valuations and internalize the social returns to innovation, which in the context of limited market size for neglected diseases, assures innovators a satisfactory return on investment. By abolishing private patent rights, it also fosters access to innovation through lower prices.
Despite the theoretical applicability of buyouts, there is a lack of real-world application and empirical evidence on its effectiveness in the context of neglected diseases. In the context of neglected diseases, patent buyouts have only been proposed within the Medical Innovation Prize Fund (S.2210) as an end-product prize (US Congress, 2007). Theoretical evidence on welfare effects concludes that buyouts rewarding innovators based on observed market outcomes are an effective tool to improve social welfare (Galasso, Mitchell & Virag, Reference Galasso, Mitchell and Virag2016; Radhakrishnan, Reference Radhakrishnan2016). Outterson (Reference Outterson2006) argues that by recovering lost R&D costs, buyouts are a cost-effective method to improve access and health outcomes in LMICs. For example, the lost R&D cost recovery for GlaxoSmithKline’s Cervarix human papillomavirus vaccine is as little as US$ 29.2 million. Therefore, for a patent buyout that would cost as little as US$ 30 million, the medicine could be immediately available for millions in LMICs in its generic form.
Priority review vouchers (PRVs)
The PRV scheme enables firms with drugs approved for certain tropical diseases to apply for a voucher that can be used to obtain priority review for an unrelated drug application, so shortening the regulatory agency review time from a standard average of 10 months to a maximum of 6 months (Ridley, Grabowski & Moe, Reference Ridley, Grabowski and Moe2006; Gaffney, Mezher & Brennan, Reference Gaffney, Mezher and Brennan2019; Aerts et al., Reference Aerts2022). Alternatively, the firm can sell the voucher to another firm.
The innovator retains IPR and prices may be unaffordable if this mechanism is not complemented by differential (tier) pricing, donation or a drug access programme.
At the time of writing, PRV initiatives are primarily offered through the United States FDA’s scheme (FDA, 2020). To be eligible, products need to satisfy certain criteria including: approval by the FDA or the EMA; recognition as a product for serious conditions where there is unmet medical need; adequate and well-controlled trials have established that the drug influences a surrogate end-point and there is clinical superiority to other existing therapies. PRVs mostly focus on late-stage clinical development, registration and post-marketing and delivery stages of the R&D model and are commonly awarded to drugs. For a potential blockbuster drug, the value of PRV has been estimated by some experts to be worth anywhere between US$ 50 million to US$ 500 million (Robertson et al., Reference Robertson2012). As of late 2018, seven PRVs had been awarded for neglected/tropical diseases – in malaria, tuberculosis, leishmaniasis, cholera, onchocerciasis (river blindness) and Chagas disease (US FDA, 2017; Cohen, 2018). Since then, the PRV programmes have expanded substantially, with many more vouchers issued across tropical disease, rare paediatric disease and medical countermeasure indications).
Notable examples include: Coartem, which is now a first-line treatment for malaria across Africa and South-East Asia; benznidazole indicated for Chagas disease (in use as early as the 1970s, approved by FDA in 2017); Krintafel, the first new antimalarial in over 18 years (approved in 2018); and Moxidectin, a treatment for onchocerciasis (approved in 2018) (MDGH, 2018; Cohen, Reference Cohen2018) (Table 3.10.6).

Table 3.10.6 Long description
The table has 6 columns: Drug name, Supplier(s), Year P R V granted, Disease focus, How was the voucher redeemed or traded, and Approach to I P R transfer. It reads as follows. Row 1: Coartem (artemether or lumefantrine); Novartis; 2008; Malaria; First P R V so market value of P R V was unknown. In 2011, Novartis redeemed the voucher on a B L A for Ilaris (canakinumab) to treat gouty arthritis. F D A declined the application; Innovator retains I P R. Row 2: Benznidazole; Chemo Research; 2017; Chagas; blank; Innovator retains I P R. Row 3: Krintafel; G S K; 2018; P. vivax malaria; No information found or anonymously redeemed; Innovator retains I P R. Row 4: Moxidectin; Medicines Development for Global health; 2018; Onchocerciasis (river blindness); blank; Innovator retains I P R.
BLA: biologics licence application; FDA: Food & Drug Administration; IPR: intellectual property rights; PRV: priority review voucher.
Evidence on the impact of PRVs on R&D is hampered by a lack of data; sample sizes are small due to the low number of vouchers issued. PRVs have been found to not significantly impact clinical trial activity for neglected tropical disease (Aerts et al., Reference Aerts2022; Jain et al., Reference Jain2017) nor for rare paediatric conditions (Hwang et al., Reference Hwang2019) but have been found to increase the likelihood of initiation of large patient trials for paediatric rare disease (Hwang et al., Reference Hwang2019).
Advance market commitments (AMCs)
In AMCs the funder/donor commits to (fully or partially) subsidize the initial purchases of innovative medicines at an agreed price, for an established maximum threshold, to be provided to a specified set of countries. The subsidy is normally only triggered when countries purchase the innovation. The binding agreement is signed before the medicine is developed and contains a full specification of the desired product and use. They also often involve a commitment by the firm to sell at an affordable price (close to marginal cost and below the AMC price) all quantities beyond the agreed subsidization threshold in the agreed countries (Levine, Kremer & Albright, Reference Levine, Kremer and Albright2005).
By “pooling” purchase commitments across many countries the scheme creates a profitable and less risky market for the developer by establishing volume guarantees. By pooling funding from several donors and negotiating a low price it enables LMICs to access the medicine. The risk is shared by the developer and the funder: while in the development phase costs are born entirely by the developer who still bears fully the risks associated with the scientific challenges of R&D, when innovation occurs the funder commits to a level of demand in participating countries, thus minimizing for the developer the risk associated with low demand and reduced affordability in LMICs (including international advocacy for low prices of novel treatments) (Berndt et al., Reference Berndt2007). For the funder/sponsor the scheme is beneficial as the financial commitment only occurs if a medicine with social value targeting key areas of need is developed and launched in the market.
AMC is intended to focus on clinical development, registration and post-marketing and delivery stages of the R&D model (Pugatch Consilium, 2017). At the time of writing, only two AMCs have been implemented. In 2007, BMGF initiated the first AMC pilot programme targeting the development of pneumococcal conjugate vaccine (PCV) (Gavi-run pilot Pneumococcal AMC) and in June 2020, Gavi launched the second AMC, COVID-19 Vaccines AMC (COVAX AMC) to accelerate access to 1.8 billion COVID-19 vaccine doses for 92 lower-income countries (Gavi, 2022). Price details of the most recent Gavi supply agreement are provided in Table 3.10.7.

Table 3.10.7 Long description
The table has 9 columns and reads as follows. Name: Pneumo A M C 2009. About or purpose of A M C: It was launched by donors in 2009 to accelerate the development of vaccines that meet country needs, scale production and accelerate vaccine uptake, while testing the A M C concept for future applications. Funding amount: 1.5 billion U S D to the Pneumococcal A M C (as of January 2021). Stakeholders involved: A M C donors: B M G F, Governments of Canada, Italy, Norway, the Russian Federation and the United Kingdom. Vaccines rolled out in 45 countries across 3 continents by 2015. Manufacturers: G S K, Pfizer and S I I. Eligibility criteria and disease focus: Pneumococcal disease; Target product profile required to be prequalified by W H O. How is A M C awarded?: The A M C is delivered through supply agreements with manufacturers where donors make a financial commitment through Gavi alliance to fully or partially finance the purchase of treatments meeting pre-established criteria at a specified price to be distributed on Gavi countries. Specific supply agreements are available on the Gavi Pneumo A M C. A latest AMC was awarded in June 2020 by UNICEF in its capacity as Gavi’s procurement agency to SII for its recently W H O-prequalified P C V 10 product. S I I received an award of 10 million doses annually (Annual Supply Commitment) from 2020 for a period of 10 years, for a cumulative total of 100 million doses. 5 percent of the A M C funds are allocated to S I I according to the A M C terms and conditions, representing 75 million U S D. The Tail Price for this agreement is 2.00 U S D per dose (for the 5-dose vial presentation) from 2020 onwards, a reduction of over 30 percent from the previous lowest Tail Price of 2.90 U S D per dose. Type of technology: Vaccines. Targeted R and D stage: Focused mainly on late-stage R and D and launch. I P R implications Innovator retains I P R.
a Gavi: Supply agreements, https://www.gavi.org/investing-gavi/innovative-financing/pneumococcal-amc/manufacturers/supply-agreements
AMC: advance market commitment; BMGF: Bill & Melinda Gates Foundation; IPR: intellectual property rights; R&D: research and development; SII: Serum Institute of India. WHO: World Health Organization
With only two AMCs fully implemented, evidence is either descriptive due to a lack of appropriate counterfactuals or based on simulations. For the PCV AMC, Médecins sans Frontières (MSF) indicated that for over 12 years donors have granted more than US$ 1 billion in subsidies to two vaccine producers, GSK and Pfizer (main producers of the vaccine in the market) (MSF, 2020). Although in principle both manufacturers were obliged to cut the price after a predetermined level of doses was sold, or to license their technology to other manufacturers, prices were only marginally reduced and the transfer of technological know-how was not adequate to expand the manufacturer base into LMICs (MSF, 2020). COVAX AMC has also gathered more than US$ 6 billion in funds from governments, foundations and the private sector (WHO, 2021c). Further evidence suggests that the AMC for PCV has increased vaccination coverage across 60 countries immunizing over 49 million children and saving 14 to 17 million DALYs through to 2015 (Kremer, Levin & Snyder, Reference Kremer, Levin and Snyder2020; BCG, 2015). Both the PCV AMC as well as a vaccine AMC for malaria, TB and HIV/AIDS have been shown to be cost-effective in modelling studies (Berndt et al., Reference Berndt2007; Tasslimi et al., Reference Tasslimi2011).
Prizes
Prizes are rewards for innovations that may focus either on the technical specifications of a product or on the desired outcomes it delivers. Prizes may adopt different models but essentially are a pay for performance scheme where the developer receives a lump sum amount if a certain innovation with social impact is achieved (Hollis, Reference Hollis2005a; Reference Hollis2005b; Love & Hubbard, Reference Love and Hubbard2007), with the risk borne by the developer. Prizes thus incentivize innovations where social marginal benefits outweigh (or are equal to) marginal costs of development, thus promoting an efficient allocation of innovation effort. Some propose that this mechanism be voluntary, and complement the patent system by imposing structure on market rewards defined on the basis of incremental benefits (Hollis, Reference Hollis2005a; Pogge, Reference Pogge2005); for example, the Health Impact Fund prize scheme proposed by Hollis and Pogge (Reference Hollis and Pogge2008). Others recommend that such schemes be compulsory, with companies forgoing IPR so the developed drug could be made available globally, i.e. also in economically deprived populations (Love & Hubbard, Reference Love and Hubbard2009; Syed, Reference Syed2009; Shavell & Van Ypersele, Reference Shavell and Van Ypersele1999).
In the context of neglected diseases, prize schemes have mostly been used to reward innovation in relation to a specific disease; however, there have been some schemes that encompass any innovation for neglected diseases (Pugatch Consilium, 2017).
To date, only five of the 11 prize schemes in health targeted neglected diseases (Monroe, Greenberg & Basey, 2015; Pugatch Consilium, 2017), including the Qualcomm Tricorder XPRIZE (run by the XPRIZE Foundation and sponsored by the Qualcomm Foundation), the Health Impact Fund, the EU vaccine prize led by the European Research Council, the Longitude Prize led by Nesta (a United Kingdom innovation foundation) and a combined initiative proposed by Bangladesh, Barbados, Bolivia and Suriname. With a combined funding purse of roughly US$ 130 million, these prizes mostly focus on basic R&D research, preclinical development and post-marketing and delivery stages of the R&D model. Disease fields included treatments for TB, AMR and vaccine cold chain development, with some prizes allowing companies to maintain IPR and others replacing IPR rights with respective prize awards (Table 3.10.8).

Table 3.10.8a Long description
The table has 10 columns: Name, About or purpose of prize, Prize amount, Stakeholders involved, Eligibility criteria and disease focus, How is prize awarded, Who was awarded, Type of technology, Targeted R and D stage, and I P R implication. It reads as follows. Row 1: XPRIZE Foundation (10 million U S D). About: Milestone inducement prize. Non-profit organisation that designs and hosts public competitions intended to encourage technological development to benefit humanity. Many of the prize competitions are not global health or neglected disease-specific. In 2008, the Foundation has recently partnered with the Bill and Melinda Gates Foundation to develop a prize for a better T B diagnostic tool. Stakeholders involved: Prize partners: B M G F; Qualcomm Foundation, A N A, American, Telemedicine Association, Arthur Clarke Center for Human Imagination, Continua Health Alliance, Health 2.0, H I M S S, I E E E, MemsIndustry Group, Point Clear Solutions, Open Photonics Inc., Quest, Shimmer, U S San Diego Clinical and Translational Research Institute, Wireless Life Sciences Alliance and Xamarin. Eligibility criteria: T B; The winning team was required to develop a tricorder device that: 1. accurately diagnose 13 health conditions; 2. capture five real-time health vital signs; 3. provide a compelling consumer experience. How is prize awarded? Any company can enter a competition-style prize, with awards to first and second place among competing teams from various companies. Who was awarded? Pennsylvania-based team, Final Frontier Medical Devices (first place). Taiwan-based finalist, Dynamical Biomarkers Group (second place). Type of technology: Diagnostics. Targeted R&D stage: Clinical testing and registration. The foundation conducts consumer testing at the Altman Clinical and Translational Research Institute. This testing included the same rigour and protocols as a clinical trial but focused on the objectives of the XPRIZE competition. I P R implications: No information found.
Row 2: E U Vaccine Prize (2 million Euros). About: Inducement prize competition launched in 2012 by the European Commission, with more prizes to be offered via the Horizon 2020 Research Funding programme. The prizes intend to accelerate the development of vaccines and solve common issues of vaccine access. Stakeholders involved: Donors: E U Research Council. Eligibility criteria: Cold chain development for vaccines. Competition criteria, includes alternative ways of formulating, preserving or transporting vaccines. How is prize awarded? Competition cash prize with a jury appraising submissions and deciding on winner. No particular approach was prescribed and competitors were invited to convince the jury that their solution could respond best to the competition criteria, including alternative ways of formulating, preserving or transporting vaccines. Who was awarded? CureVac G m b H (2014). Type of technology: Vaccines. Targeted R&D stage: Discovery, preclinical and clinical stages, and registration. I P R implications: Owner maintains I P R.

Table 3.10.8b Long description
The table has 10 columns: Name, About or purpose of prize, Prize amount, Stakeholders involved, Eligibility criteria and disease focus, How is prize awarded, Who was awarded, Type of technology, Targeted R and D stage, and I P R implication. It reads as follows. Row 3: Health Impact Fund (proposal; A reasonable minimum required is 6 billion U S D per year): About: A new proposal by Incentives for Global Health to provide a complementary or alternative to the patent system for development of pharmaceutical innovations intended for poor patients. Stakeholders involved: Founding partner: Incentives for Global Health. Potential funding partners: Governments, charitable foundations or international taxes. Eligibility criteria: Pharmaceutical innovations intended for poor patients. How is prize awarded? The product is supplied at a generic price with a potential mark up for increment health gains, and the developer is not rewarded for the R&D element until it can demonstrate that the resulting product has health value for the intended patients. A 10-year fixed payment contingent on development, making I P R available for competing manufacturers, and calculated according to health impact of developed product. Who was awarded? (blank). Type of technology: Drugs. Targeted R&D stage: Discovery, preclinical and clinical stages, and registration. I P R implications: Developer making I P R available for competing manufacturers.
Row 4: Longitude Prize (10 million-pound prize fund): About: An ex ante inducement prize launched in 2014, awarded to the submission considered most impactful and feasible, currently for a competitive A M R innovation. Stakeholders involved: Lead by: Nesta (United Kingdom). Funding partners: Innovate United Kingdom and Biotechnology Industry Research Assistance Council (B I R A C). Supported by: Amazon, B B C, Science Museum, and Marks and Clerk I P services. Eligibility criteria: A M R. Any team of innovators from anywhere in the world that can invent an affordable, accurate, fast and easy-to-use point-of-care diagnostic test for bacterial infections that will allow health professionals worldwide to administer the right antibiotics at the right time (prize rules). How is prize awarded? Competition style prize, with 8 million pounds pay-out to winner, judged by a Prize Advisory Panel. Who was awarded? The first challenge is ongoing with around 50 registered teams. Type of technology: Diagnostics. Targeted R&D stage: n/a. Testing will take place over the six months following the Prize Advisory Panel’s decision. If the Panel judges that the testing confirms that the entry meets the criteria, they will recommend the entry as a potential winner. I P R implications: Developer maintains I P R.
The table has 10 columns: Name, About or purpose of prize, Prize amount, Stakeholders involved, Eligibility criteria and disease focus, How is prize awarded, Who was awarded, Type of technology, Targeted R and D stage, and I P R implication. It reads as follows. Row 5: B B B S open-source dividend (100 million U S D for T B. 250 million U S D for Chagas. 10 percent of donor assistance for health (D A H) to enhance access): About: Proposal by Bangladesh, Barbados, Bolivia and Suriname. Introduced in 2009 and 2015, of an open-source dividend and milestone prizes fund to reward R&D open innovation and access for donor-supported markets. Some of the Bangladesh, Barbados, Bolivia and Suriname proposals include the obligation to grant open, reasonable and non-discriminatory licenses to patent pools (such as the UNITAID patent pool). Stakeholders involved: B B B S, W H O, and Knowledge Ecology International. Eligibility criteria: Chagas disease, T B, H I V/AIDS, and malaria. Information on technical specification information not found. How is prize awarded? B B B S developed a prize fund that is endowed through a committee placed in W H O, which then allocates prizes to neglected diseases in separate disease-specific proposals, each drafted separately. The main objective is to share a percentage of end-product prize money with those who openly, freely share knowledge materials and technology. Example: The 2015 Development of Low-Cost Rapid Diagnostic Test for Tuberculosis Proposal suggests endowing a 100 million U S D for an entrant T B diagnostic that satisfies criteria set by W H O committee. A licensing pool would manage the intellectual property and guarantee that the diagnostic would be made available at an accessible price. Who was awarded? No information found. Type of technology: Drugs, diagnostics and vaccines. Targeted R&D stage: Clinical trials. I P R implications: I P R to be transferred to patent pool.
AMR: antimicrobial resistance; ANA: All Nippon Airways; BBBS: Bangladesh, Barbados, Bolivia and Suriname; BBC: British Broadcasting Corporation; BMGF: Bill & Melinda Gates Foundation; EU: European Union; HIMSS: Healthcare Information and Management Systems Society; IEEE: Institute of Electrical and Electronics Engineers; IP: intellectual property; IPR: intellectual property rights; TB: tuberculosis; WHO: World Health Organization.
Different prize schemes focusing on specific disease areas and sometimes on unmet needs have spurred innovative activity in early stages of R&D. For instance, the Gotham Prize for Cancer research has led to the development of novel approaches to treat cancer (Bernstein, Reference Bernstein2008). Similarly, the Dr Paul Janssen Award, aimed at solving unmet medical needs and rewarding scientists for basic or clinical research, has advanced innovation in the treatment of rare diseases such as mosaicism (Johnson & Johnson, 2020). The Prize4Life organization has accelerated discovery of treatment of amyotrophic lateral sclerosis (ALS) through its ALS Prediction Prize scheme (Leone, Reference Leone2012). While such awards have increased early-stage discovery in critical areas as described above, systematic evidence on the impact of prizes on stimulating R&D for neglected diseases is virtually non-existent.
Policy relevance and conclusions
Since the early 2000s there has been a considerable amount of effort to tackle the global burden associated with neglected diseases by fostering innovation in safe, effective and affordable medicines and prevention. To stimulate R&D investment a complex range of innovative financing mechanisms have been proposed, with most of the funding provided by public, philanthropic and private industry sources. Over the course of the last decade total R&D funding grew by 14%, rising from US$ 3 410 billion in 2010 to US$ 3 876 billion in 2019 (Chapman et al., Reference Chapman2020). And although progress has been made, control of neglected diseases is still largely inadequate and extremely difficult to monitor or evaluate. There is little evidence on the effectiveness of the current mix of innovative financing mechanisms, either at the individual or the collective level.
At the disagregated level the prospect for effective delinkage of R&D from market considerations varies across schemes and specificities of initiatives (in particular, schemes that only partly fund R&D costs only enable partial delinkage; for example, in the case of prizes it can be difficult to measure the expected effects of a registered health product in order to estimate a suitable prize amount). The heterogeneity and lack of widespread implementation of these schemes means there is little evidence on whether they succeed in stimulating innovation in key areas of need and the extent to which they may lead to crowding-out of private investment.
From a policy perspective, it is important to assess the extent to which these different funding incentive mechanisms work, as well as their relative cost–effectiveness. This can be achieved by international collaboration in devising and implementing pilot schemes designed to allow an assessment of the factors that hinder or enable a particular mechanism’s effectiveness. Yet, to date, the rolling out of these schemes seems to be linked to political will and the strength of their proponents’ advocacy rather than the need to gather and examine evidence. For example, tax credits have been considered to have a low uptake as an incentivizing mechanism for R&D in the United Kingdom. The tax credit-based vaccine research relief initiative came to an end in 2017, with United Kingdom assessors having found evidence for minimal or negligible impact on incentivizing R&D uptake (UK Government, 2016). Meanwhile, in the USA, pharmaceutical companies can receive a 20% R&D tax credit (that can be increased to 50% if the neglected disease is low burden), reflecting a contrasting view of the potential effectiveness of this approach (Mueller-Langer, Reference Mueller-Langer2013).
Another issue that can be observed among innovative financing mechanisms is their primary focus on “innovation” as an objective rather than “access and affordability”. The ultimate desirability of each of these mechanisms relies on the extent to which they either embed or are complemented by provisions to ensure innovation is affordable and supplied in LMICs. Such provisions include knowledge and technology transfer, pricing and financing policies. In their absence, some of the incentives may further widen existing health inequalities, for example by enabling high prices through extending the effects of IPR arrangements. Schemes that combine incentives to foster innovation coupled with specific provisions with regard to weakening IPR and/or pricing arrangements (e.g. AMCs and the Health Impact Fund) are therefore more likely to contribute effectively to tackling neglected diseases in LMICs.
On the collective level, the current push and pull mechanisms remain fragmented and consistently lack a governing overarching framework. Most schemes implemented to date target one or few disease areas, with allocation of resources across neglected diseases largely depending on donors’ views of need or particular remit of action. There is no needs assessment that systematically compares the relative needs associated with neglected diseases globally, assesses the costs and benefits of addressing them, and defines guidance on priority-setting for the coordinated global allocation of funding and targeted incentive mechanisms. This state of affairs risks a suboptimal allocation of funding as well as negative spillover effects across initiatives. The relationship between push mechanisms (such as R&D tax credits or PDPs) and pull mechanisms (such as the prizes, patent system, patent pools, AMCs or wildcard extension) is a good example. The Medical Innovation Prize Act (US Congress, 2007) was proposed as a replacement for the patent system, while others such as the earlier United States Orphan Drug act (US Congress, 1983) aim to complement or augment existing patency jurisdictions.
A governance and resource allocation framework that embeds incentive schemes would need to assess their relative ability to generate valuable innovations across the different disease areas, how they interplay with intellectual property regulations, and consequently their implications for affordability. Given that the R&D landscape is not comprehensively mapped or supranationally governed, it is challenging to produce such a framework, hindering the ability to make informed decisions to allocate resources efficiently across key priority areas. As a result, considerable systemic gaps in funding exist across different R&D stages and disease areas. The Global Strategy and Plan of Action on Public Health, Innovation and Intellectual Property drawn up by WHO’s consultative expert working group (WHO, 2012) highlights the key elements desirable in such a framework as being: needs assessment and prioritization; promoting R&D and R&D capacity; transfer of technology; application and management of intellectual property to contribute to innovation and promote public health; improving delivery and access; promoting sustainable financing mechanisms; and establishing and monitoring reporting systems.
Finally, WHO recognizes that the way research is currently funded is integral to the perceived need for better coordination. There are many funders in both public and private sectors, as well as many research organizations in public and private sectors and in partnership between them. Coordination among these actors is strongly needed to identify and manage research priorities. Not only will coordination provide opportunities for pooling resources for donors to fund a multiplicity of research institutions in developing country neglected diseases, but it will also enable the strategic governance of initiatives and inputs made in priority-setting, monitoring and evaluation, coordination and advocacy, and impact assessment (WHO, 2012).Footnote 5
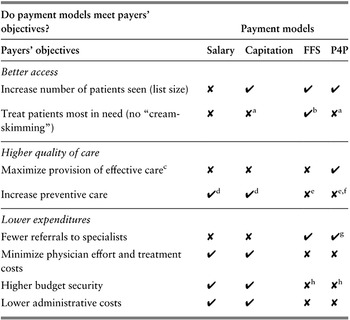
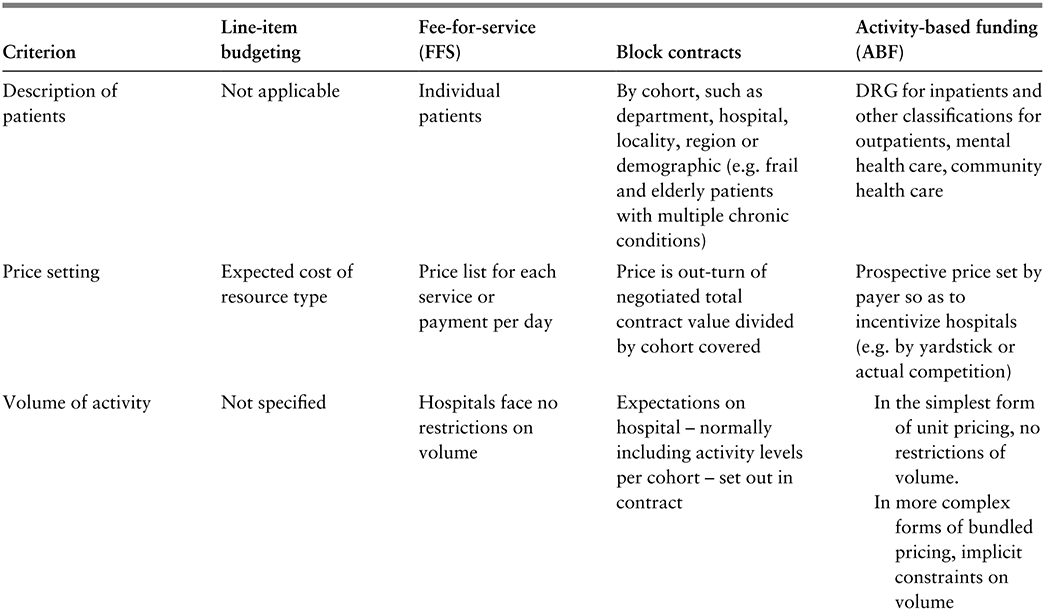
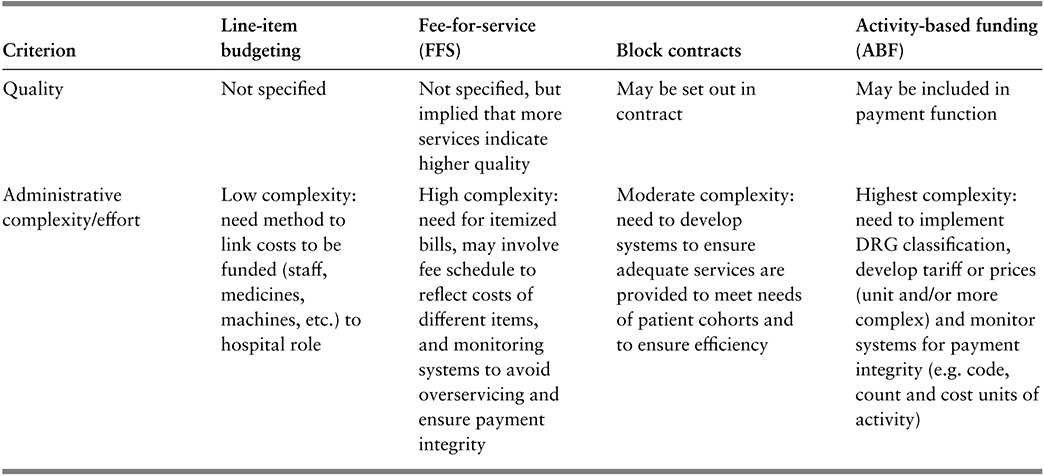
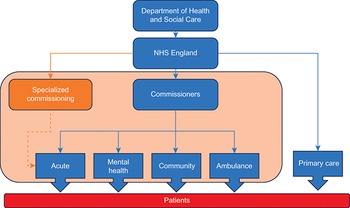
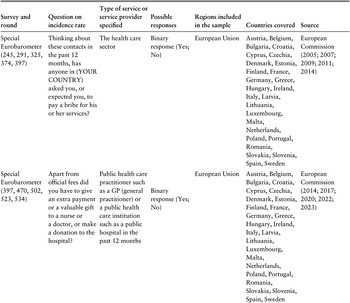
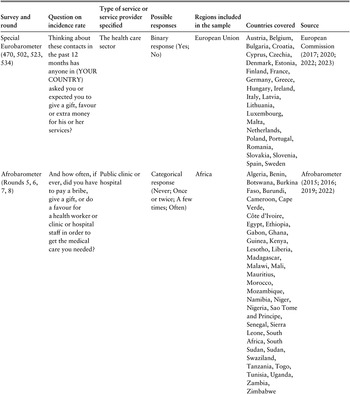
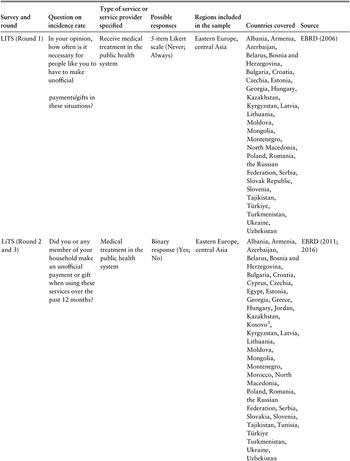
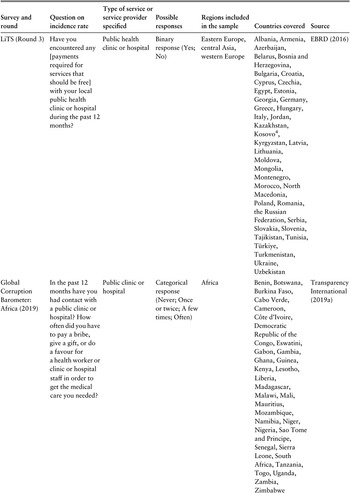
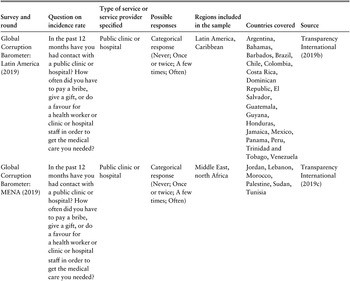
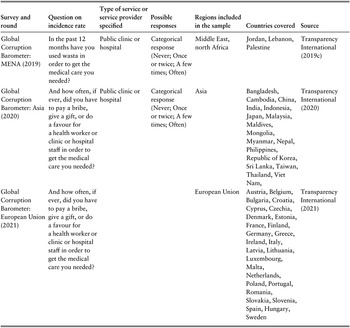
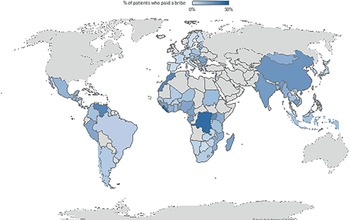
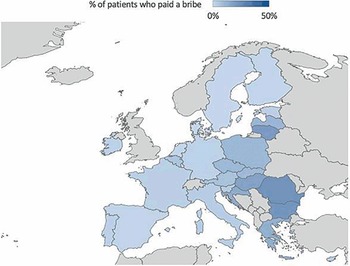
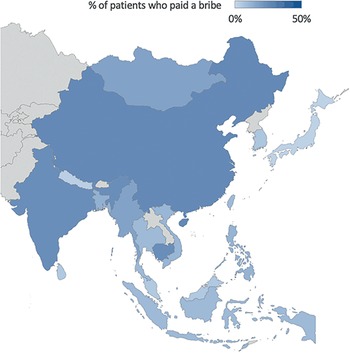
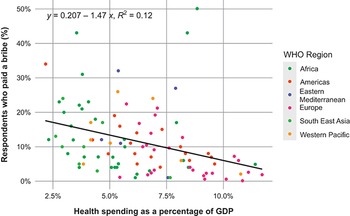
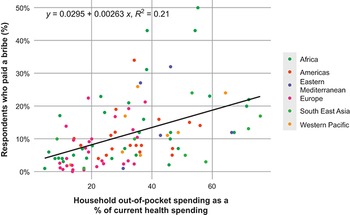
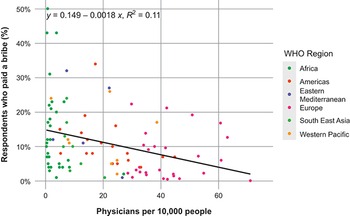
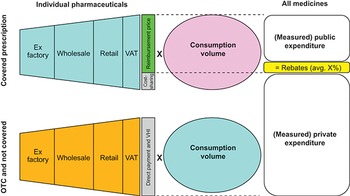
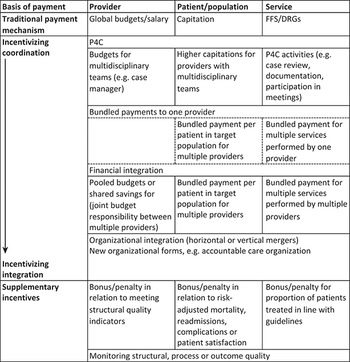
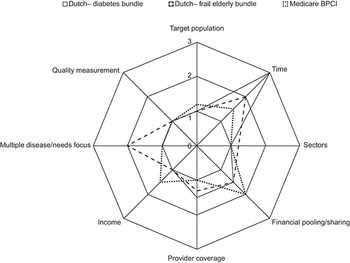
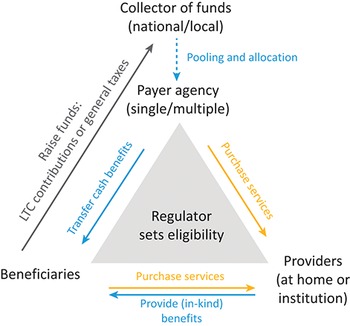
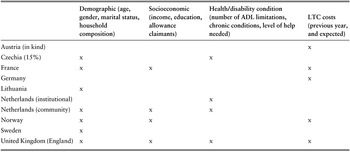
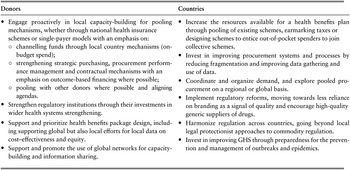
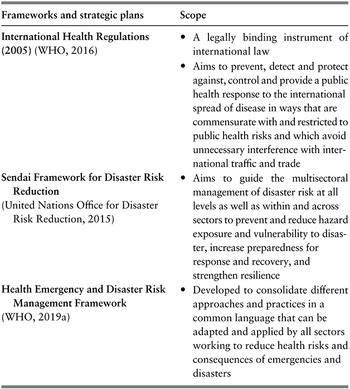

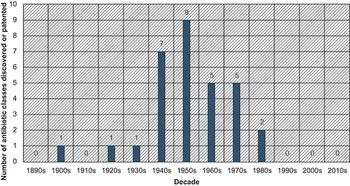
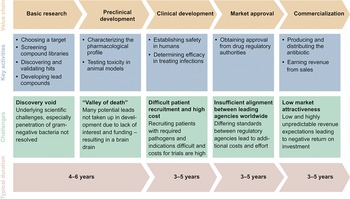
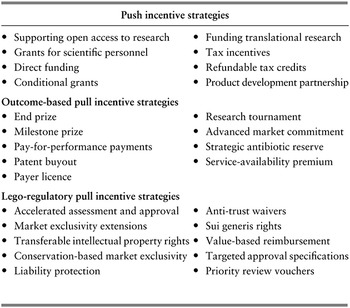
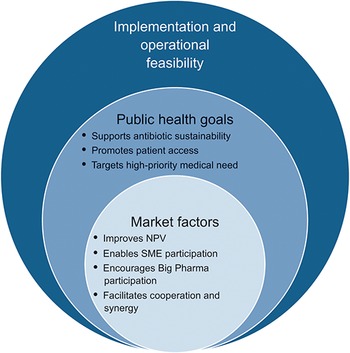
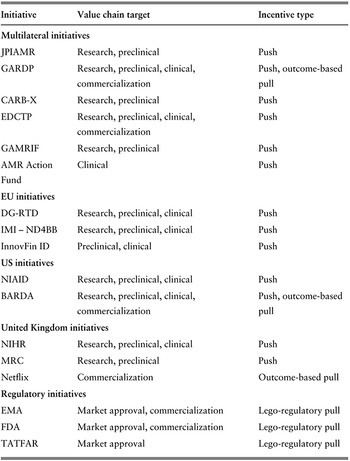
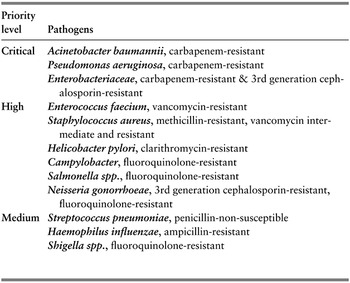
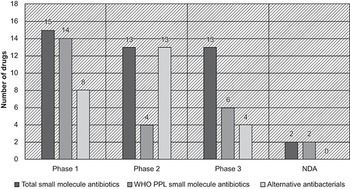
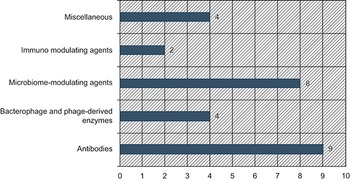
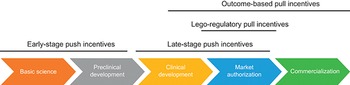
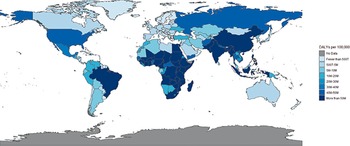
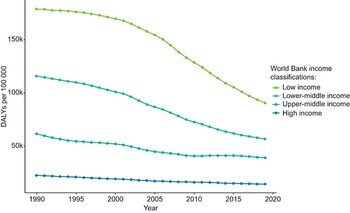
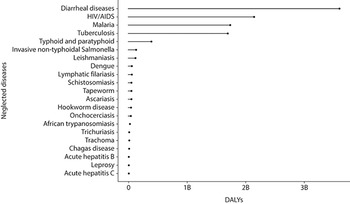
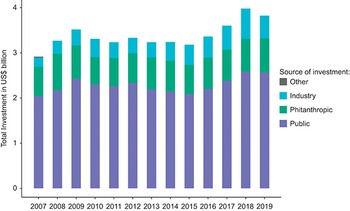
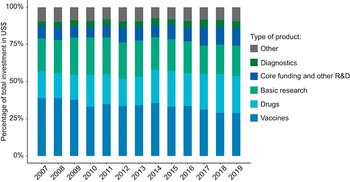
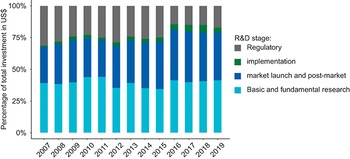
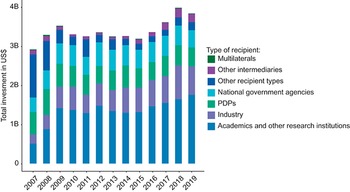
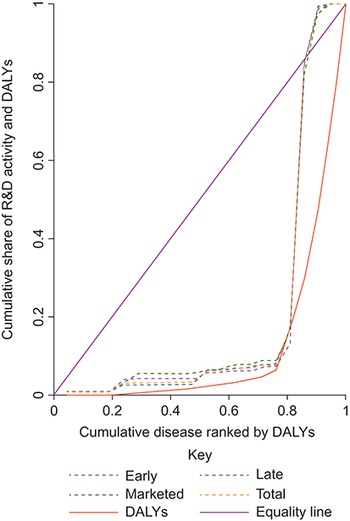
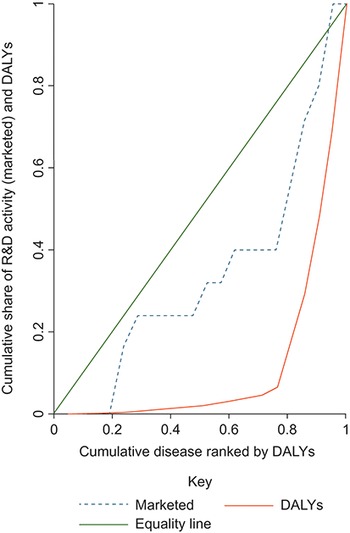
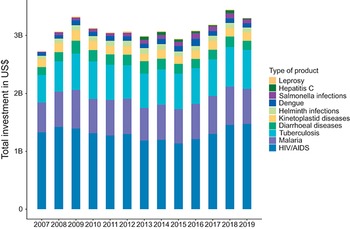
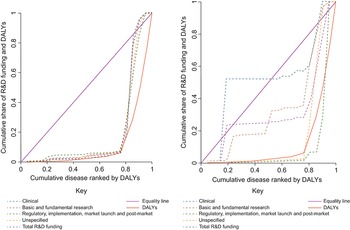
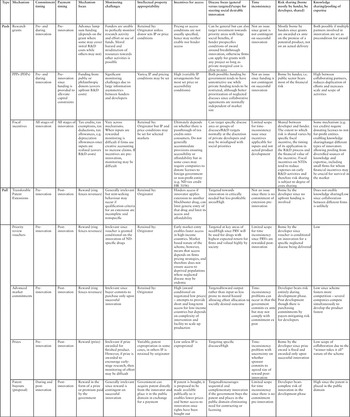
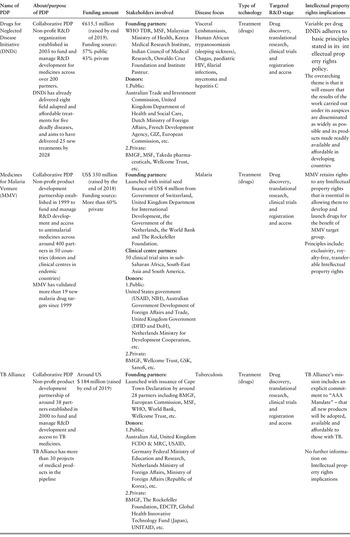
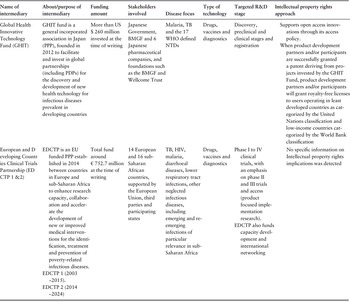
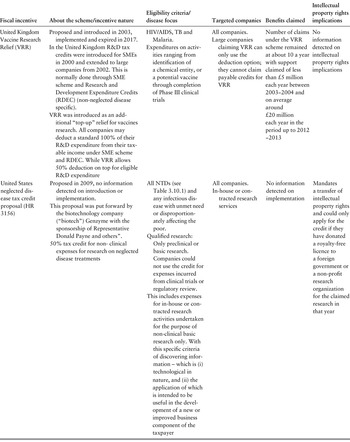
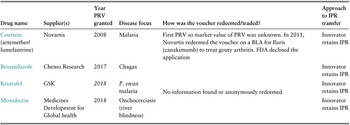
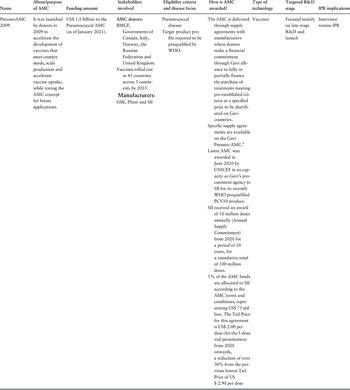
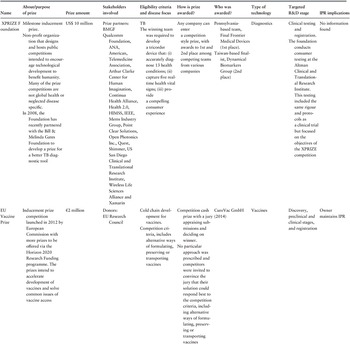
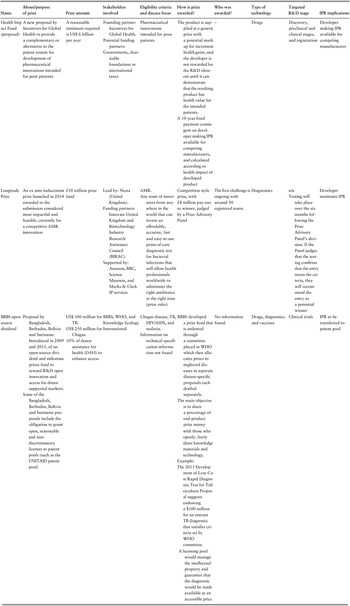

 Open access