





INTRODUCTION
Soil respiration, the emission of carbon dioxide CO2 from soils, is a major flux in the global carbon (C) cycle, and its radiocarbon content (here reported as fraction modern carbon (F) (Trumbore et al. Reference Trumbore, Sierra and Hicks Pries2016)) allows insights to the cycling of C in terrestrial ecosystems (Trumbore Reference Trumbore2009). The F of soil respiration (soil FCO2) is a measure of the amount of time that has passed since the constituent C atoms were last in the atmosphere, integrating the transit through various reservoirs, including plant and microbial biomass, soil organic matter, and carbonates (Sierra et al. Reference Sierra, Müller, Metzler, Manzoni and Trumbore2017).
In organic and acidic soils, soil FCO2 provides an important constraint on how rapidly soils may sequester or lose organic C in response to changes in net primary productivity or environmental conditions (Shi et al. Reference Shi, Allison, He, Levine, Hoyt, Beem-Miller, Zhu, Wieder, Trumbore and Randerson2020). Along with its δ13C signature (Hicks Pries et al. Reference Hicks Pries, Schuur and Crummer2013), soil FCO2 can be used to partition soil C emissions into contributions from the rhizosphere (respiration of roots and associated microorganisms) relative to those from microorganisms that decompose soil organic matter to reveal how plant and microbial activity and microbial C sources are influenced by changes in environmental conditions (Trumbore Reference Trumbore2006, Reference Trumbore2000; Hicks Pries et al. Reference Hicks Pries, Schuur and Crummer2013).
Many investigations of soil FCO2 collect net soil respiration from chambers or soil pore space CO2 from gas wells (Borker et al. Reference Borker, Savage, Davidson and Trumbore2006; Czimczik et al. Reference Czimczik, Trumbore, Carbone and Winston2006; Schuur and Trumbore Reference Schuur and Trumbore2006; Estop-Aragonés et al. Reference Estop-Aragonés, Czimczik, Heffernan, Gibson, Walker, Xu and Olefeldt2018; Hicks Pries et al. Reference Hicks Pries, Castanha, Porras and Torn2017, Reference Hicks Pries, Schuur and Crummer2013; Lupascu et al. Reference Lupascu, Welker, Seibt, Maseyk, Xu and Czimczik2014a). However, these methods use pumps or evacuated canisters and accumulate CO2 prior to collection, which can affect the gradient of CO2 within the soil profile and may change soil FCO2. These approaches also collect CO2 about once a month over periods of minutes to about one day and may miss episodic C emissions (Muhr et al. Reference Muhr, Franke and Borken2010; Lupascu et al. Reference Lupascu, Welker, Seibt, Xu, Velicogna, Lindsey and Czimczik2014b). Furthermore, most soil respiration source studies in seasonal environments have focused on the growing season. The scarcity of time-integrated and non-growing season data is of particular concern in high latitude ecosystems (Lupascu et al. Reference Lupascu, Czimczik, Welker, Ziolkowski, Cooper and Welker2018; Natali et al. Reference Natali, Watts, Rogers, Potter, Ludwig, Selbmann, Sullivan and Zona2019), where permafrost soils with vast C stocks are rapidly warming and active layer depths are changing (Box et al. Reference Box, Colgan, Schmidt, Lund, Parmentier, Brown, Bhatt, Euskirchen, Romanovsky and Walsh2019; Pulliainen et al. Reference Pulliainen, Luojus, Derksen, Mudryk, Lemmetyinen, Salminen, Ikonen, Takala, Cohen, Smolander and Norberg2020). Thus, the evaluation of environmental change on C cycling in soils over time and across landscapes could be improved by more continuous and passive measurements of soil FCO2.
To achieve time-integrated samples, gas intake rates into evacuated steel canisters have traditionally been modulated by adjusting the length and inner diameter of a critical flow path, i.e. a capillary (Lupascu et al. Reference Lupascu, Welker, Xu and Czimczik2014c; Trumbore et al. Reference Trumbore, Czimczik, Sierra, Muhr and Xu2015; Walker et al. Reference Walker, Xu, Fahrni, Lupascu and Czimczik2015). In cold environments, however, a capillary upstream from the membrane is likely to become obstructed by condensing or freezing water vapor. Our sampler uses a tubular diffusive membrane intake to exclude liquid water while transmitting gas. Passive CO2 trapping for 14CO2 analysis is a technique with increasing use and popularity (Walker et al. Reference Walker, Xu, Fahrni, Lupascu and Czimczik2015; Wotte et al. Reference Wotte, Wischhöfer, Wacker and Rethemeyer2017a, Reference Wotte, Wordell-Dietrich, Wacker, Don and Rethemeyer2017b). Trace-gas sampling wells and chambers with passive CO2 traps have been used with diffusive silicone (Si) membranes in periodically saturated soils and waters since 2001 (Jacinthe and Groffman Reference Jacinthe and Groffman2001; Kammann et al. Reference Kammann, Grünhage and Jäger2001; Garnett et al. Reference Garnett, Hartley, Hopkins, Sommerkorn and Wookey2009; Wotte et al. Reference Wotte, Wischhöfer, Wacker and Rethemeyer2017a), and modified to perform depth-resolved C isotope sampling in peatlands (Clymo and Bryant Reference Clymo and Bryant2008; Garnett et al. Reference Garnett, Dinsmore and Billett2012, Reference Garnett, Hardie and Murray2011) and mineral soils (Hartley et al. Reference Hartley, Garnett, Sommerkorn, Hopkins and Wookey2013). Here, we adapted such a sampler for usage in upland environments (mineral soil) without soil collars (trenching). Our sampler is designed to be permanently installed year-round in extreme conditions (–36 to +15°C, ice-bound to 100% volumetric water content (VWC)), with negligible routine maintenance and easy and efficient exchange of CO2 traps to capture winter and shoulder-season (spring/autumn) permafrost dynamics. Fully steel components (excluding PTFE ferrules for airtight connections and Si tubing) and cold- and vacuum-rated valves ensure high durability and accuracy in the harsh winter. We also investigate some environmental predictors (VWC, temperature, CO2 concentration CO2) that likely relate to sampling rate and soil respiration F and δ13C values.
We present a rugged and lightweight sampler that collects soil CO2 passively (capturing CO2 by diffusion) for subsequent F (and δ13C) analysis over periods of two weeks to two months from soil depths of 20–80 cm below the surface. We designed the sampler to withstand Arctic conditions, including freeze-thaw cycles, waterlogging, and herbivory, in a remote location without power. Our method allows the collection of soil FCO2 year-round to provide seasonal to annual estimates of C cycling rates in terrestrial ecosystems.
METHODS
CO2 Isotope Sampler
The sampler consists of a soil gas access well (“access well”) that is permanently installed in the soil, and an exchangeable, rechargeable molecular sieve trap (“MS trap”) to capture soil CO2 for C isotope (F and δ13C) analysis (Figure 1). The soil gas inlet (Figure 1A) is composed of a platinum-cured Si rubber tube (1 m, ¼″ OD, 2124T5, McMaster-Carr, USA), which forms a membrane between the interior of the tubing and the (semi-) saturated soil surrounding it. Silicone rubber (and other Si-polymeric membranes) are known to be permeable to many gases, with gas-specific permeability proportional to molecular diameter and temperature (Kammermeyer Reference Kammermeyer1957; Robb Reference Robb1968). The tubing excludes liquid water but allows gas to diffuse into the sampler without disturbing the CO2 gradient within the soil profile. Diffusivity of CO2 in Si rubber is governed by Fick’s law, whereby diffusion of a gas across a fluid barrier (the Si tube) is a function of the concentration difference across the barrier, the barrier thickness, and the (temperature-dependent) diffusion coefficient of the gas (Bertoni et al. Reference Bertoni, Ciuchini and Tappa2004). The length of the tubing which we use directly translates to a greater surface area over which diffusion can occur. Diffusivity is also determined by the polarity of the material and permeating gas molecule (Zhang and Cloud Reference Zhang and Cloud2006), which should make (polar, hydrophobic) Si effective at reducing water vapor uptake.
Soil 14CO2 sampler components consisting of a permanently installed access well (2 generations), exchangeable MS trap, and CO2 extraction heater. Soil CO2 passes through gas-permeable silicone tubing (A) and passively diffuses along flow path through junction (B) to be adsorbed upon molecular sieve (C). Interior ice deposits melt and pool in sump (D) in spring. CO2 is thermally desorbed in laboratory using clamshell-style heaters (E).

Two generations of inlets were used. In the original version, Si tubing is sealed on one end and connected to the sampler via a ¼″ hose connection. This connects to ¼″ OD stainless steel tubing that passes through a bore-through connection to the interior of a ¾″ OD tube to create a water sump (Figure 1D), which prevents the obstruction of the gas flow path by ice or water from water vapor permeating the inlet and condensing or freezing along the inner walls.
In the optimized 2nd version, Si tubing is coiled around the sampler and connected at both ends by a steel 90º elbow tube silver-soldered to the interior of a 1.5 m long ½″ OD smooth-bore stainless-steel tube. This central steel tubing ends above ground and is capped 5 cm below the Si coil to create the water sump (Figure 1D). After soldering on the bottom cap, the steel tubing is washed with 20% HCl (#7647-01-0, Klean Strip Green, USA) and rinsed with MQ water. The steel tubing sections above and below the Si coil, which are expected to be below the soil surface, are sleeved with PVC tubing (1″ OD, 1/2″ ID) to seal the hole augured into the soil for well insertion to minimize gas flux in the vertical axis. All wells in the 2nd gen. are the same length to maintain a consistent internal diffusion path, independent of how deep they are inserted in the soil.
A junction (Figure 1B) spanning two plug valves (PTFE components and Si-based lubricant, SS-4P4T, Swagelok, USA) connects the access well to a removable MS trap and enables MS trap exchanges without exposure of the interior of the access well to ambient atmosphere. Expected snow depths determine the overall length of the access wells. Prior to attaching the first MS trap, each access well is evacuated to –25″ Hg pressure with a hand pump (MITMV8500, MightyVac, USA).
The design and extraction technique of the MS trap was based on work by Walker et al. (Reference Walker, Xu, Fahrni, Lupascu and Czimczik2015). With open valves, CO2 is collected by sorption onto pre-cleaned zeolite MS (Figure 1C; 1.5 g, 45–60 mesh, 13X, 20304 Sigma-Aldrich, USA) contained within a 316 stainless steel mesh envelope (0.114 mm ID mesh opening, 9419T34, McMaster-Carr, USA). The envelope is folded to contain the zeolite and stay in place through friction with the interior of a steel tube (½″ OD, 8″ length) that is pre-baked at 550ºC in air for 1 hr (to oxidize any residual organics from fabrication) and capped with ½″ to ¼″ reducers and SS-4P4T valves. All connections are stainless steel to avoid differential expansion. Alternatively, soil gas can be collected from the access well with an evacuated steel canister.
Laboratory Analyses of CO2
We built two clamshell-style heaters to thermally desorb CO2 from MS traps in the laboratory (Figure 1E). One half of each heater was built by installing insertion heaters (4877133 x2, McMaster-Carr, USA) and a high-temperature thermocouple (9353k31, McMaster-Carr, USA) into an insulated steel block. Two symmetrical halves were both connected to a digital temperature control (sensitivity ±2oC, SL4848-RR, AutomationDirect, USA) to form a full heater. The MS trap is clamped within a heater and attached to a vacuum line, where CO2 is extracted under vacuum at 425ºC for 30 min, cryogenically purified, and graphitized using a sealed-tube zinc reduction method (Xu et al. Reference Xu, Trumbore, Zheng, Southon, McDuffee, Luttgen and Liu2007). The extraction is followed by a cleaning sequence at 500ºC with 100 mL min–1 UHP N2 flush for 20 min, then 100 mL min–1 UHP CO2-free (zero) air flush for 10 min. After cleaning, the MS trap is pressurized to just over 1 atm with UHP zero air to minimize leaking caused by pressure changes during air transport.
For samples with a total yield >0.3 mg C, an aliquot of CO2 is split and analyzed for 13C (GasBench II coupled with DeltaPlus XL, Thermo, USA). The 14C of the graphite is measured with accelerator mass spectrometry (NEC 0.5MV 1.5SDH-2 AMS) alongside processing standards and blanks at the KCCAMS laboratory of UC Irvine (Santos et al. Reference Santos, Southon, Griffin, Beaupre and Druffel2007; Beverly et al. Reference Beverly, Beaumont, Tauz, Ormsby, von Reden, Santos, Southon, Reden, Von Santos and Southon2010).
We report stable isotope measurements using conventional δ notation (‰) (Equation 1):
 $${\delta ^{13}}C = 1000 \cdot \left( {{{{R_{{\rm{sample}}}}} \over {{R_{{\rm{standard}}}}}} - 1} \right)$$
Where R sample denotes the heavy-to-light isotope ratio of a sample and R standard is the isotope ratio of the standard (0.0112372 for Vienna Pee Dee Belemite (PDB) 13C/12C standard (Gonfiantini Reference Gonfiantini1984). We report radiocarbon results using the fraction modern (F) notation (Equation 2):
 $$F = {{{R_{{\rm{SN}}}}} \over {{R_{{\rm{ON}}}}}} = {{{R_{\rm{S}}}{{\left( {{{0.975} \over {1 + \delta /1000}}} \right)}^2}} \over {0.95{R_{{\rm{O}}, - 19}}}}$$
Where R SN is the measured 14C/12C ratio of the sample normalized for fractionation to a δ13C value of –25‰, with δ being the measured δ13C value of the sample, and R ON is the 14C/12C ratio of the oxalic acid I standard measured in 1950 (1.176 ± 0.010·10–12), normalized for fractionation to its measured δ13C value of –19‰ (Trumbore et al. Reference Trumbore, Sierra and Hicks Pries2016). The measurement uncertainty for all samples and standards was <0.003 F based on long-term reproducibility of secondary standards.
Sampler Performance
We took three approaches to evaluate the samplers: (1) We examined isotope sampling accuracy and potential memory effect on both the standalone MS traps and full-process replications by collecting pure certified reference material standards for up to 24 hr and periods of 1–4 weeks, respectively. (2) We optimized access well dimensions for sample intake rate by attaching varied lengths of Si membrane and Bev-A-Line (56280, 1/8" ID x 1/4" OD Bev-A-Line IV, United States Plastic Corp., USA) to evacuated steel canisters and MS traps. To further test sampling rate and gas seal, we exposed the full-process replications to varied CO2 and temperature. (3) We evaluated real-world performance by deploying a complete sampler in the field for two years.
(1) Isotope sampling. To assess the suitability of each MS trap for isotope analysis, we compared the C isotope data of reference materials analyzed with and without MS trap exposure. As “known” values, we used literature consensus F values, and measured δ13C of pure aliquots (Table 1). Specifically, we used two modern oxalic acid standard materials OX I (SRM4990B) and OX II (SRM4990C) (Mann Reference Mann1983), one aged wood standard, (TIRI B) (Scott Reference Scott2003), and one 14C-free material (ABA-cleaned bituminous coal, USGS Pocahontas #3) (Trent et al. Reference Trent, Medlin, Coleman and Stanton1982; Xu et al. Reference Xu, Trumbore, Zheng, Southon, McDuffee, Luttgen and Liu2007). These reference materials were combusted to CO2, purified, and allowed to passively transfer onto each MS trap on a vacuum line. After 12–24 hr, CO2 was extracted and measured for F and δ13C (see section Laboratory Analysis of CO2). To quantify potential memory effects (i.e., “hysteresis,” CO2 that survives the post-extraction cleaning), some traps were tested multiple times, so that standards with known signatures (0.571–1.040 F, n = 12; –23.1 to –19.4‰ δ13C, n = 5) could be compared to values of the previous samples held by those traps.
Summary statistics for standard material tests on MS traps. Known values are accepted literature consensus F values, and measured δ13C of pure aliquots (‰); 2-tailed Student’s t-test p-values use the Known value as true.

A MS trap method blank was evaluated from a set of MS traps that were subjected to the entire sampling process aside from actual exposure to soil CO2, in order to capture the average contaminating CO2 intrusion which may leak into a MS trap in routine sampling. MS traps were shipped to the field site filled with ˜1 atm UHP CO2-free air, attached to access wells (but never opened), and shipped back to the lab (58–59 days, n = 8). These were extracted and used to calculate the size and F of the method blank (only 2 were large enough for 14C, but not 13C analysis).
Full-process replications were created by enclosing Si inlet assemblies (as in Figure 1A, 1st gen.) in sealed glass mason jars with ports through which the internal atmosphere could be evacuated and then filled with CO2. These full-process sampler + jar systems were evacuated to <10–2 torr and filled with 1 atm UHP zero air, and reference material was injected into the jars and allowed to diffuse into the samplers for 1–4-weeks (n = 20). We evaluated the response of the measured isotopes to varied ambient CO2 (0.33–0.71%), temperature (–20 and 20ºC), path length (0.03–1.3 m), and unique reference material signature (0.571–1.040 F; –24.5 to –19.04‰ δ13C) by varying the amount of reference material injected into each jar, and either enclosing the mason jar in a freezer or leaving it at lab temperature. We used stepwise optimization of multivariate linear regression models (R step and lm functions, stats v3.6.2 package) to determine the unbiased significance of each predictor variable to each response (F, δ13C, sampling rate). By using Aikaike information criteria to eliminate irrelevant predictors, we arrived at multivariate models for each response that maximized goodness of fit while minimizing model complexity.
(2) Access well. We optimized several access-well components in the laboratory to maximize the CO2 uptake rate in intermittently waterlogged and frozen soil without disturbing the CO2 gradient. First, we tested the influence of Si surface area, diffusion path length, and collection system (canister or MS trap) by attaching diffusive Si tubing (0–3 m, sealed on one end) to gas-impermeable Bev-A-Line tubing (0-3 m). This well-prototype was connected to MS traps and, or 0.5, 6, or 32 L evacuated stainless-steel canisters and exposed to ambient CO2 (n=41). The uptake rate was calculated by extracting CO2 after 1–58 days. We selected Si tubing lengths up to the maximum amount that could be installed without causing dramatic site disturbance, and path lengths that would allow us to access the collection system above typical snowpack heights.
Second, we evaluated the predictive value of CO2, temperature, and path length on the sampling rate response for the same full-process replications described in Isotope sampling.
(3) Field sampling. To assess the performance of the sampler in the field, we continuously collected soil CO2 from a moist acidic tussock (dominated by Eriophorum vaginatum L.)/wet sedge (Carex bigelowii) tundra (O horizon pH = 3.7 ± 0.1, B horizon 4.6 ± 0.4 mean ± se (Hobbie and Gough Reference Hobbie and Gough2002)) near Toolik Field Station, AK, USA (68.625478 N, 149.602199 W, 724 m, –6.8 to –5.8oC MAT, 44 to 52 cm yr–1 MAP 2017-2019) between June 2017 and August 2019. The values presented here are from samplers that were part of a larger experiment, but we focus only on assessing the sampler performance.
The 1st gen. access well (n = 1) was installed at 20 cm below the surface in June 2017. Soil gas samples were collected over 3–6 weeks in evacuated canisters (0.5–32 L) from June 2017 to September 2017, with MS traps from September 2017 to 2018, and with alternating MS traps and evacuated canisters from September 2018 to August 2019. Episodically (n = 6), when FCO2 was also measured using traditional sampling approaches with dynamic chambers (n = 42) as described in Lupascu et al. (Reference Lupascu, Welker, Seibt, Maseyk, Xu and Czimczik2014a), we also collected gas samples over 3–6 days in 0.5 L evacuated canisters. The 2nd gen. access wells (n = 20) were installed between 20 and 80 cm depth in July 2019 and were only sampled over 8 weeks with MS traps.
To gauge the sampler’s efficiency and quantify the temporal variability of soil pore space CO2, we co-deployed CO2 (non-dispersive infrared, Carbocap GMP343 with vertical soil attachment and PTFE membrane, Vaisala, Finland) and VWC and temperature probes (VWC from dielectric permittivity, temperature from thermistor, Decagon 5TM, METER, USA) with the 1st gen. access well (n = 1 each at –20 cm). CO2 data were collected from June 2017 to August 2019 at 30-s resolution on a computer, using software made in LabVIEW (Laboratory Virtual Instrument Engineering Workbench, National Instruments, USA, 2017) to simply capture data output from the probes and save it to a text file located on a cloud drive. A CO2 temperature-correction was applied by the GMP343 firmware at the time of measurement. VWC and temperature data were collected from September 2017 to August 2019 at 15-min resolution and stored on a Decagon Em50 battery-powered data logger and accessed during field campaigns.
We evaluated the response of the measured isotopes and sample collection rate to the dynamic soil environment. We again used stepwise optimization of a multivariate linear regression model to determine the significance of each predictor variable. These include the mean of measured environmental predictors over each sampling period (CO2, VWC, temperature), state of water at the depth of the gas inlet, and the collection system used. Sample collection rate was also considered as a predictor for 13C and 14C. Where gaps in the data existed due to sensor malfunction or differences in installation date, the day-of-year means over the sampling period (˜2% of CO2, ˜7% of VWC and temperature data) were used.
Data Corrections
We corrected the measured C isotopes for three likely sources of exogenous C: method blank (full-process replications and field samples), contaminating lab-air CO2 dissolved in Si tubing (full-process replications only), and mixing of ambient air CO2 into soil (field samples only). Calculated method blank or air fractions (i.e., impurities) were used to correct isotope values (Equation 3):
 $${\Delta _{sample}} = {\Delta _{impurity}} \cdot {f_{impurity}} + {\Delta _{corrected}} \cdot (1 - {f_{impurity}})$$
Where Δ represents either FCO2 or δ13CO2. Calculated fractions were also used to correct yield (and thereby sampling rate) (Equation 4):
 $$Yiel{d_{corrected}} = Yiel{d_{sample}} - Yiel{d_{sample}} \cdot {f_{impurity}}$$
We corrected samples with yields <1 mg C for method blanks using the blank size and F (see Isotope sampling). Given a fixed blank value, the significance of the blank to the total sample signature will decrease as the sample size increases. With our blank F (0.5875, 0.6013, n = 2) and size (8.5 ± 6 µg C, n = 8), blank corrections for samples >1 mg C would approach our analytical uncertainty (0.003 F). MS trap results were not corrected for δ13C method blanks.
To account for lab-air CO2 that was dissolved in the Si tubing used for full-process replications, we calculated the total mass of CO2 which was dissolved in the Si tubing at the experimental start time given the tubing dimensions and an approximate solubility of 2.2 m3 CO2 m−3 Si atm (Robb Reference Robb1968). We then took the ratio of this mass to the total yield for the contaminating fraction (<7% for all samples). We assume that the isotopic composition of the lab air was similar to that of the field air given that: CO2 is a well-mixed gas, lab-air measured no more than 600 ppm when testing the GMP343 probes, and human-respired δ13CO2 is not different enough from ambient (approximately –22‰ vs. –9‰ respectively; Affek and Eiler Reference Affek and Eiler2006) to have a large effect on the correction.
To account for mixing of ambient air CO2 into soil, which dilutes the soil respiration isotope signatures, we calculated the fraction of air present in the soil over each sampling period as the ratio between CO2 in ambient air (from Imnavait, about 8 km away) and at the inlet depth. The isotopic composition of the field air was measured at the site during campaigns (n = 11 FCO2, n = 10 δ13CO2) as described in Lupascu et al. (Reference Lupascu, Welker, Seibt, Maseyk, Xu and Czimczik2014a).
RESULTS AND DISCUSSION
(1) Isotope sampling. Our MS traps allowed for reproducible and accurate C isotope measurements of CO2. The mean standard error for three reference materials (OXI, OXII, and TIRI-B) absorbed upon standalone MS traps was 0.0014 F and 0.056‰ δ13C (Figure 2A, B, Table 1). F of the recovered reference materials was not very different from their consensus values (Table 1). Although the two-tailed Student’s t-test indicated a p-value only slightly greater than 0.01 for two of the standards, the greatest mean difference (i.e., sample-known values, 0.013 ± 0.002 F for OXII) is less than the standard deviation of full-process replicates (0.020 F for OXI, 0.024 F for TIRI-B, Figure 2E, G, I), indicating that 14C error of MS traps is less than that of individual samples. Only one bituminous coal standard was run as an extreme test of sorption hysteresis; it is shown in Figure 2A-D. δ13C was greater than pure aliquot values by <0.5‰ consistently. It is known that MS material fractionates δ13C upon absorption (Davidson Reference Davidson1995; Garnett and Hardie Reference Garnett and Hardie2009), with a typical value of 4‰ under ambient CO2. It is likely that we do not see this magnitude of fractionation because pure CO2 was used, and therefore absorption was not inhibited or slowed by non-absorbable gases (N2 and O2) as it would be in atmospheric or soil gas environments. Additionally, the diffusion pathway between the vacuum extraction line and the MS traps was short, and complete absorption only took <5 min. Wotte et al. (Reference Wotte, Wordell-Dietrich, Wacker, Don and Rethemeyer2017b) also report insignificant δ13C fractionation for their testing of a similar MS trap design. We observe no hysteresis for 14C or 13C (Figure 2C, D), which would be evident as a strong linear relationship between previous signature and current deviation from known. The MS trap blank (not shown) was 8 ± 6 µg C, equivalent to 0.15 ± 0.11 µg C day–1 (mean ± sd, n = 8), with F of 0.5875 and 0.6013 (n = 2).
Recovery of reference materials from standalone and full-process tests of CO2 traps. A–J: Deviation of recovered isotope values from known values of FCO2 and δ13CO2 of reference materials (grey vertical band shows no difference). Small error bars show instrumental error (1σ). A–D: Open symbols, performance of standalone MS traps (0.18–0.92 mg C). A, B show recovery of pure reference material for standalone traps (on top of large light-grey standard mean ± sd), and C, D show this relative to a trap’s previous sample value. E–L: Closed symbols, performance of full-process replications as a function of relevant predictors. Regressions and significance level are shown for significant predictors as determined by stepwise minimization of Akaike information criterion. For full-process replicates, reference material signature is significant for F deviation, and path length and temperature are significant for δ13C deviation and sampling rate (all p<0.004).
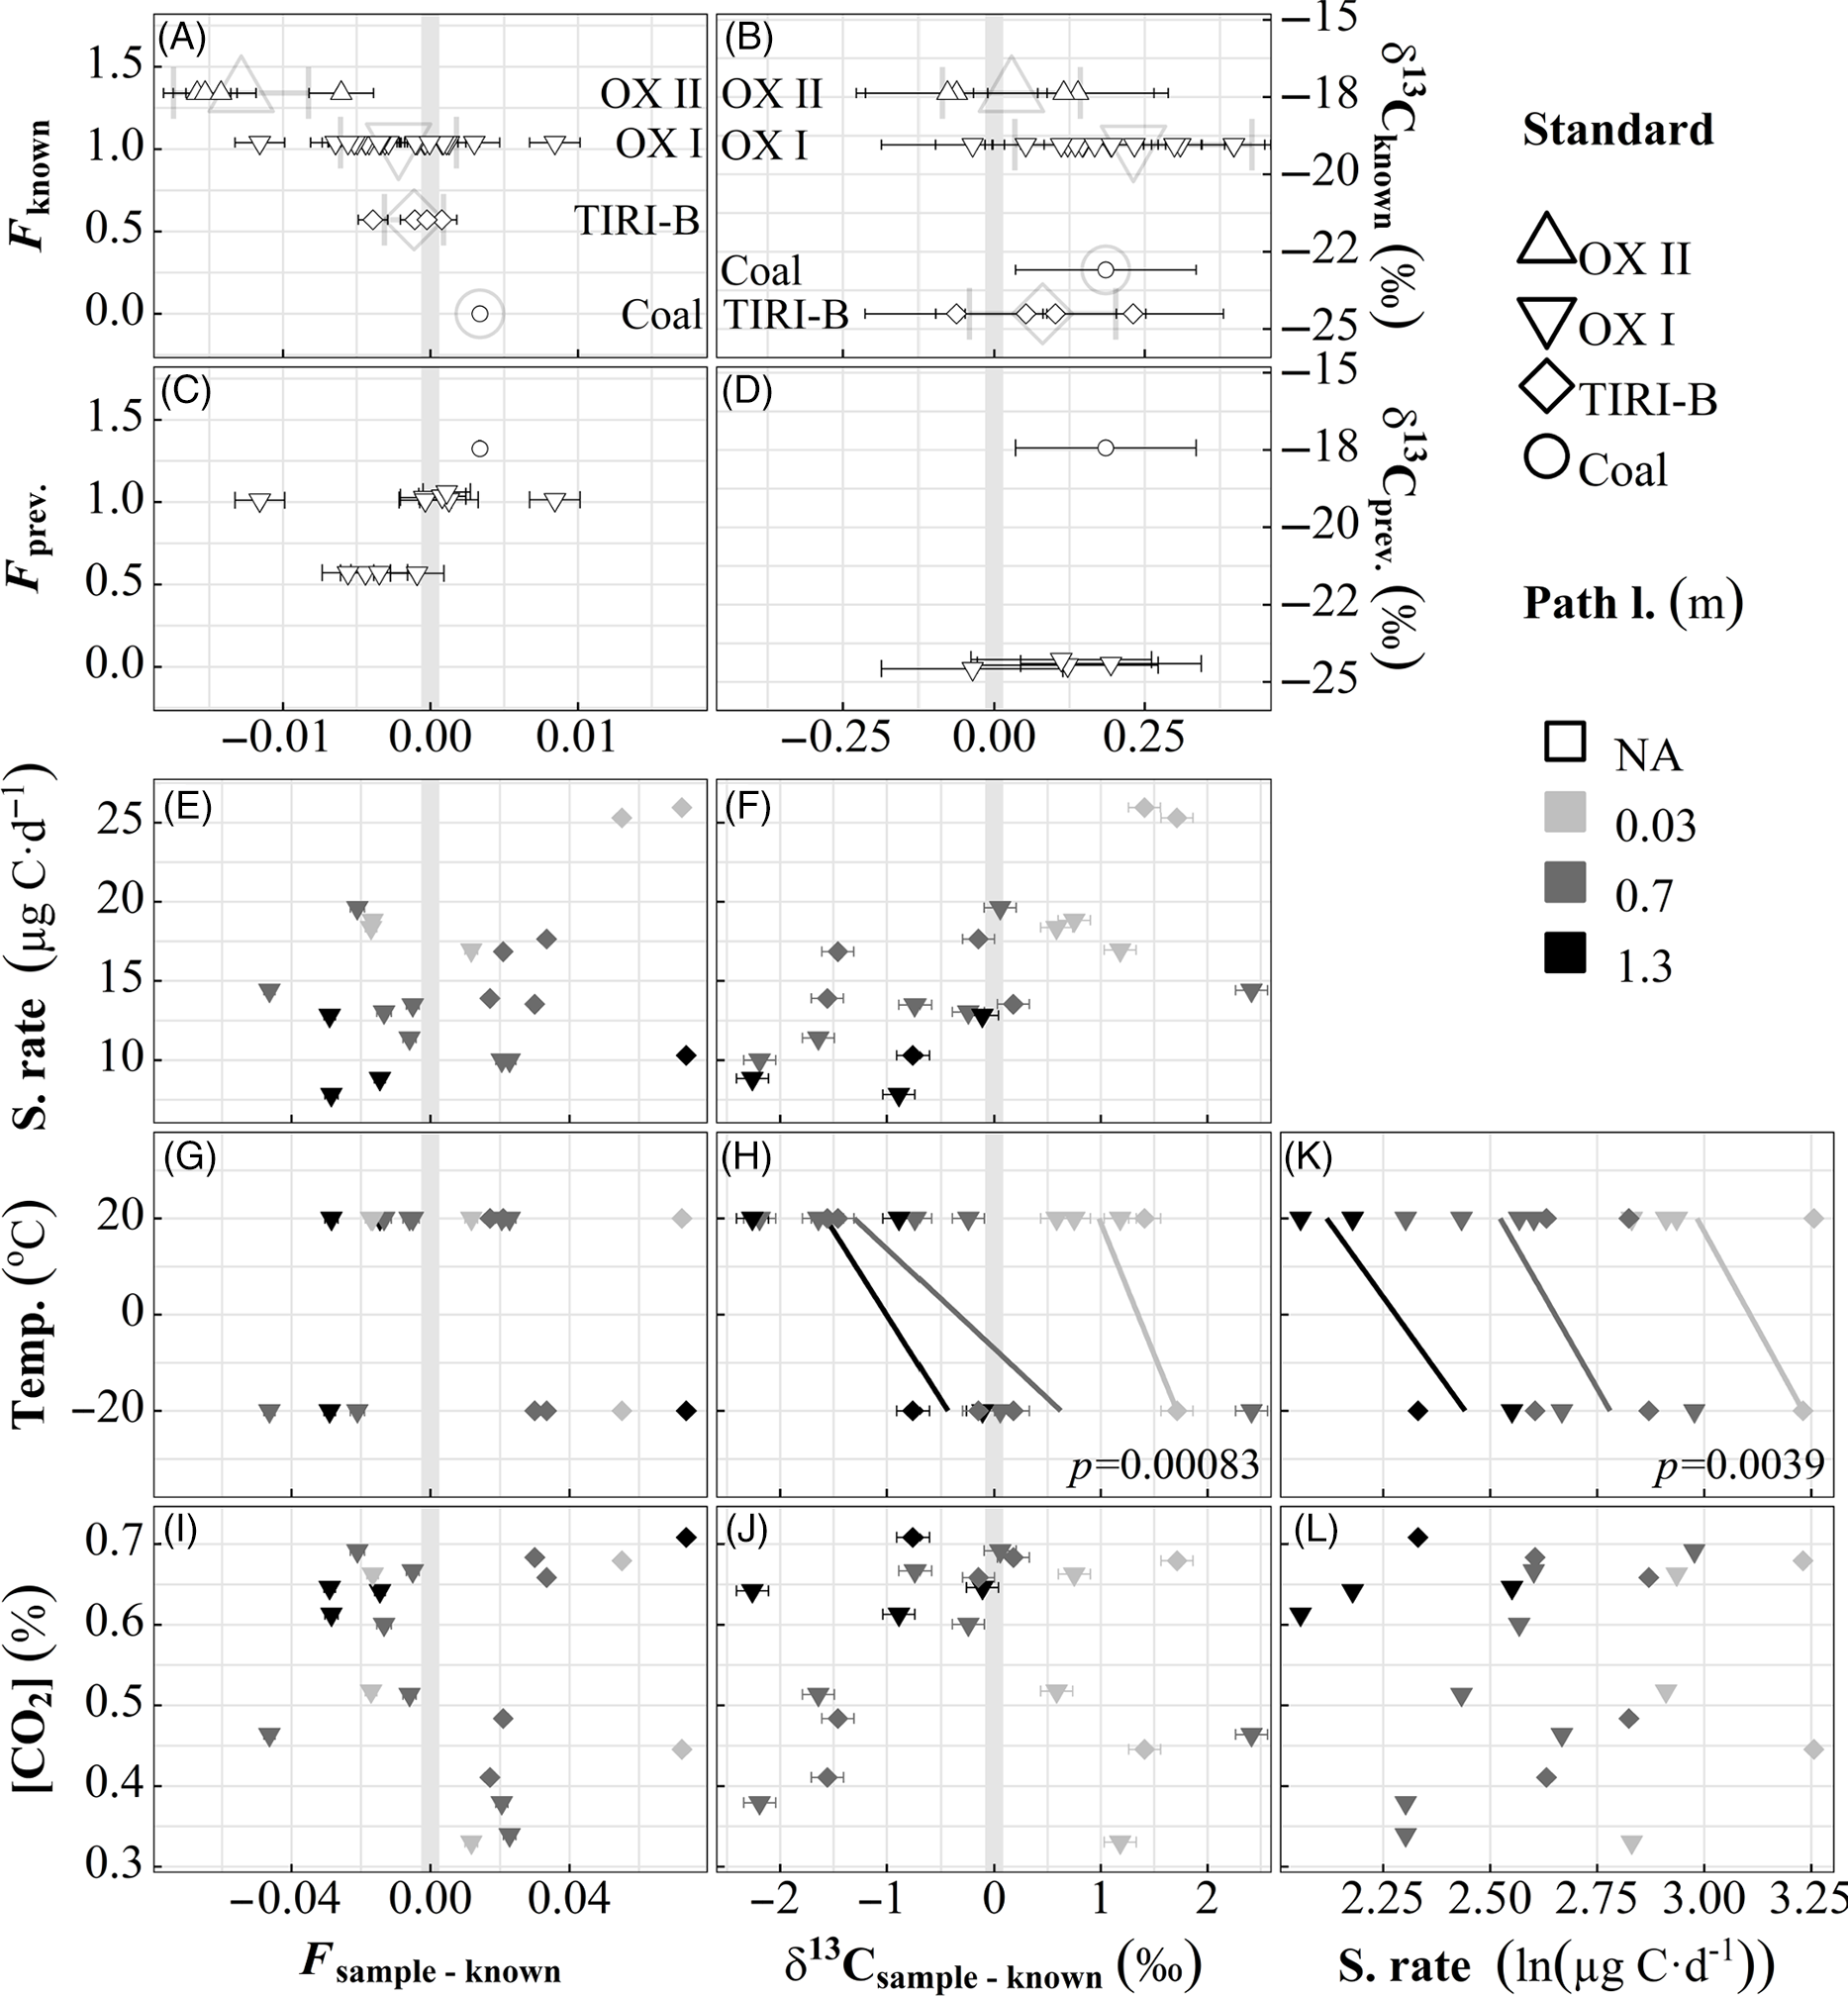
The deviation from known is larger for full-process replications (Figure 2E–J) than for standalone MS traps. It is likely that our attempt to create a controlled ambient environment around the inlets resulted in an imperfect seal, causing recovered reference materials to deviate towards the value of ambient air (Northern Hemisphere FCO2 was 0.98 in 2013 (Reimer et al. Reference Reimer, Bard, Bayliss, Beck, Blackwell, Bronk Ramsey, Buck, Cheng, Edwards, Friedrich, Grootes, Guilderson, Haflidason, Hajdas, Hatté, Heaton, Hoffmann, Hogg, Hughen, Kaiser, Kromer, Manning, Niu, Reimer, Richards, Scott, Southon, Staff, Turney and van der Plicht2013), while atmospheric δ13CO2 is approximately –9‰). This is most apparent in F results: TIRI-B samples were more enriched than known, while OX I were more depleted (known F of 0.571 and 1.040, respectively). The larger deviation of samples taken at –20ºC leads us to believe that the suboptimal seal on the mason jar intended to contain the ambient atmosphere was exacerbated by different thermal expansion coefficients of the jar materials (i.e., metal will contract more than glass). Stepwise regression assigns significance to the reference material signature for 14C, and temperature and path length for 13C. We see no influence of sampling rate, temperature, or CO2 on F, and no radical values that would reveal methodological contamination. The significant temperature + path length δ13C trend (Figure 2H) is likely the combined result of air leakage from imperfect seal and fractionation along the diffusive path from inlet to MS material, as it is not evident in (fractionation-corrected) F results (Figure 2G). This observed fractionation may contribute to the ˜4‰ δ13C depletion reported in previous research on passive MS trapping (Davidson Reference Davidson1995; Garnett and Hardie Reference Garnett and Hardie2009). While it appears to be correctable, we will not attempt to do so until the phenomenon is better understood.
(2) Access well. In the prototyping tests, the CO2 sampling rate varied from 7–44 µg C day–1 depending on Si tubing length and path length, temperature, CO2, and to a smaller degree, on collector (canister or MS trap). We found sampling rate to be directly related to Si tubing length and inversely to path length (Figure 3A). At equivalent Si and path lengths and temperatures, the rate for canisters (which actively draw all ambient gas into the sampler with negative pressure) is 3.7 ± 1 (mean ± sd, n = 17) times greater than for MS traps, which adsorb CO2 molecules passively diffusing into the sampler. We also observe a small direct sampling rate proportionality to canister volume (not shown), however it was far outweighed by the other controls.
Response of CO2 sampling rate to (A) varied silicone inlet lengths at equivalent CO2 (lab only) and (B) varied ambient CO2 at equivalent silicone tubing length of 1 m (lab and field at temperatures >0°C). Path length is from inlet connection to MS trap joint.
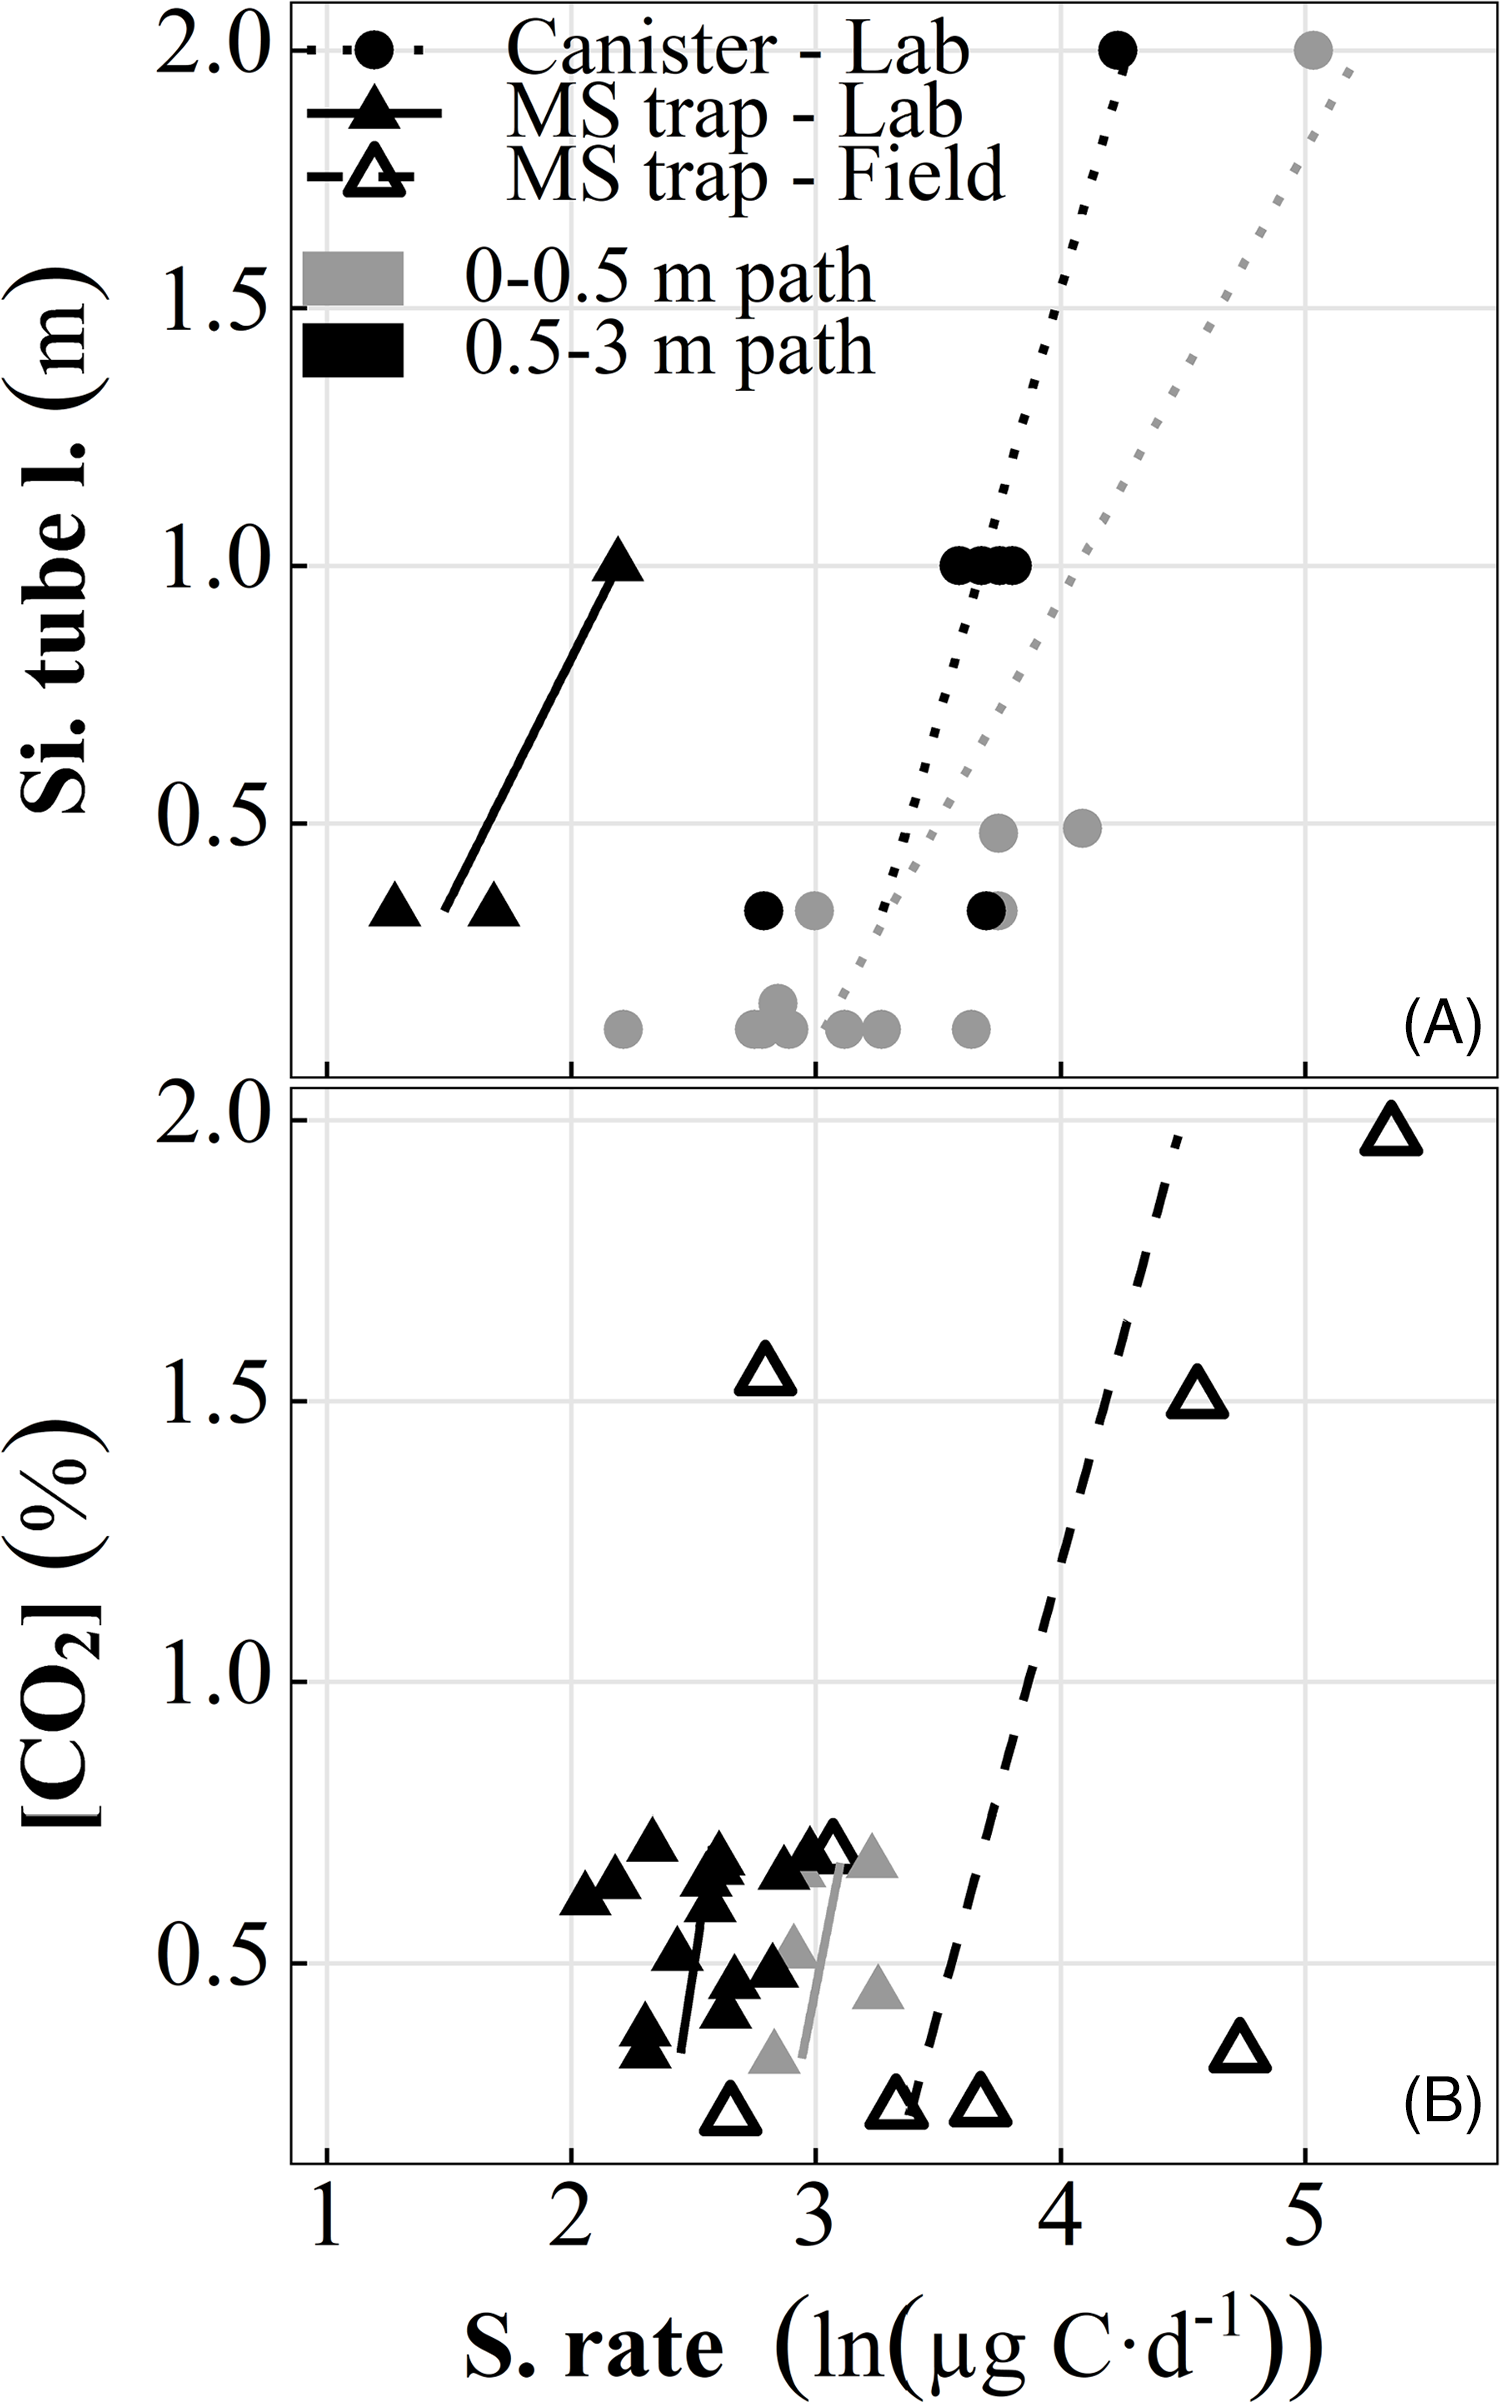
A Si tubing length of 1 m was chosen to optimize sampling rate while minimizing site disturbance, producing reasonable yields over a range of path lengths for sampling periods >2 weeks given the anticipated soil CO2. Stepwise regression assigns significance to temperature and path length as predictors of sampling rate (Figure 2K). We transform (natural log) sampling rate here and throughout the figures for easy comparison with field results, which demonstrate bimodal distribution (i.e., frozen vs. thawed) and a strong exponential relationship between sampling rate and temperature (Figure 4E). The inverse temperature effect on sampling rate was unexpected, as CO2 permeability of Si rubber increases with increasing temperature (a dramatic reduction is only seen below approximately –40ºC; Robb Reference Robb1968). The most likely explanation is once more the poor seal of the mason jars containing the inlets, allowing more freezer air to enter the system. This potentially contributes to the temperature dependence of 13C as well. If the influence of temperature on sampling rate is ignored, CO2 becomes a significant predictor in a simple linear model of CO2 and path length (p = 0.03, Figure 3B, solid symbols).
Response of 2 years of soil CO2 F, δ13C, and sampling rate (one sampler, depth = –20 cm) to relevant predictors. Bars for Sampling period panels (L–N) span on and off dates. Error bars of environmental predictor panels (C–K) show standard deviation of the predictor over the sampling period. Regressions are shown for predictors that maximize the quality of a multivariate linear regression for each response (x-axes). The vertical dashed line for F is the mean value for ambient air over the experimental period (6 ± 8‰, n = 9).
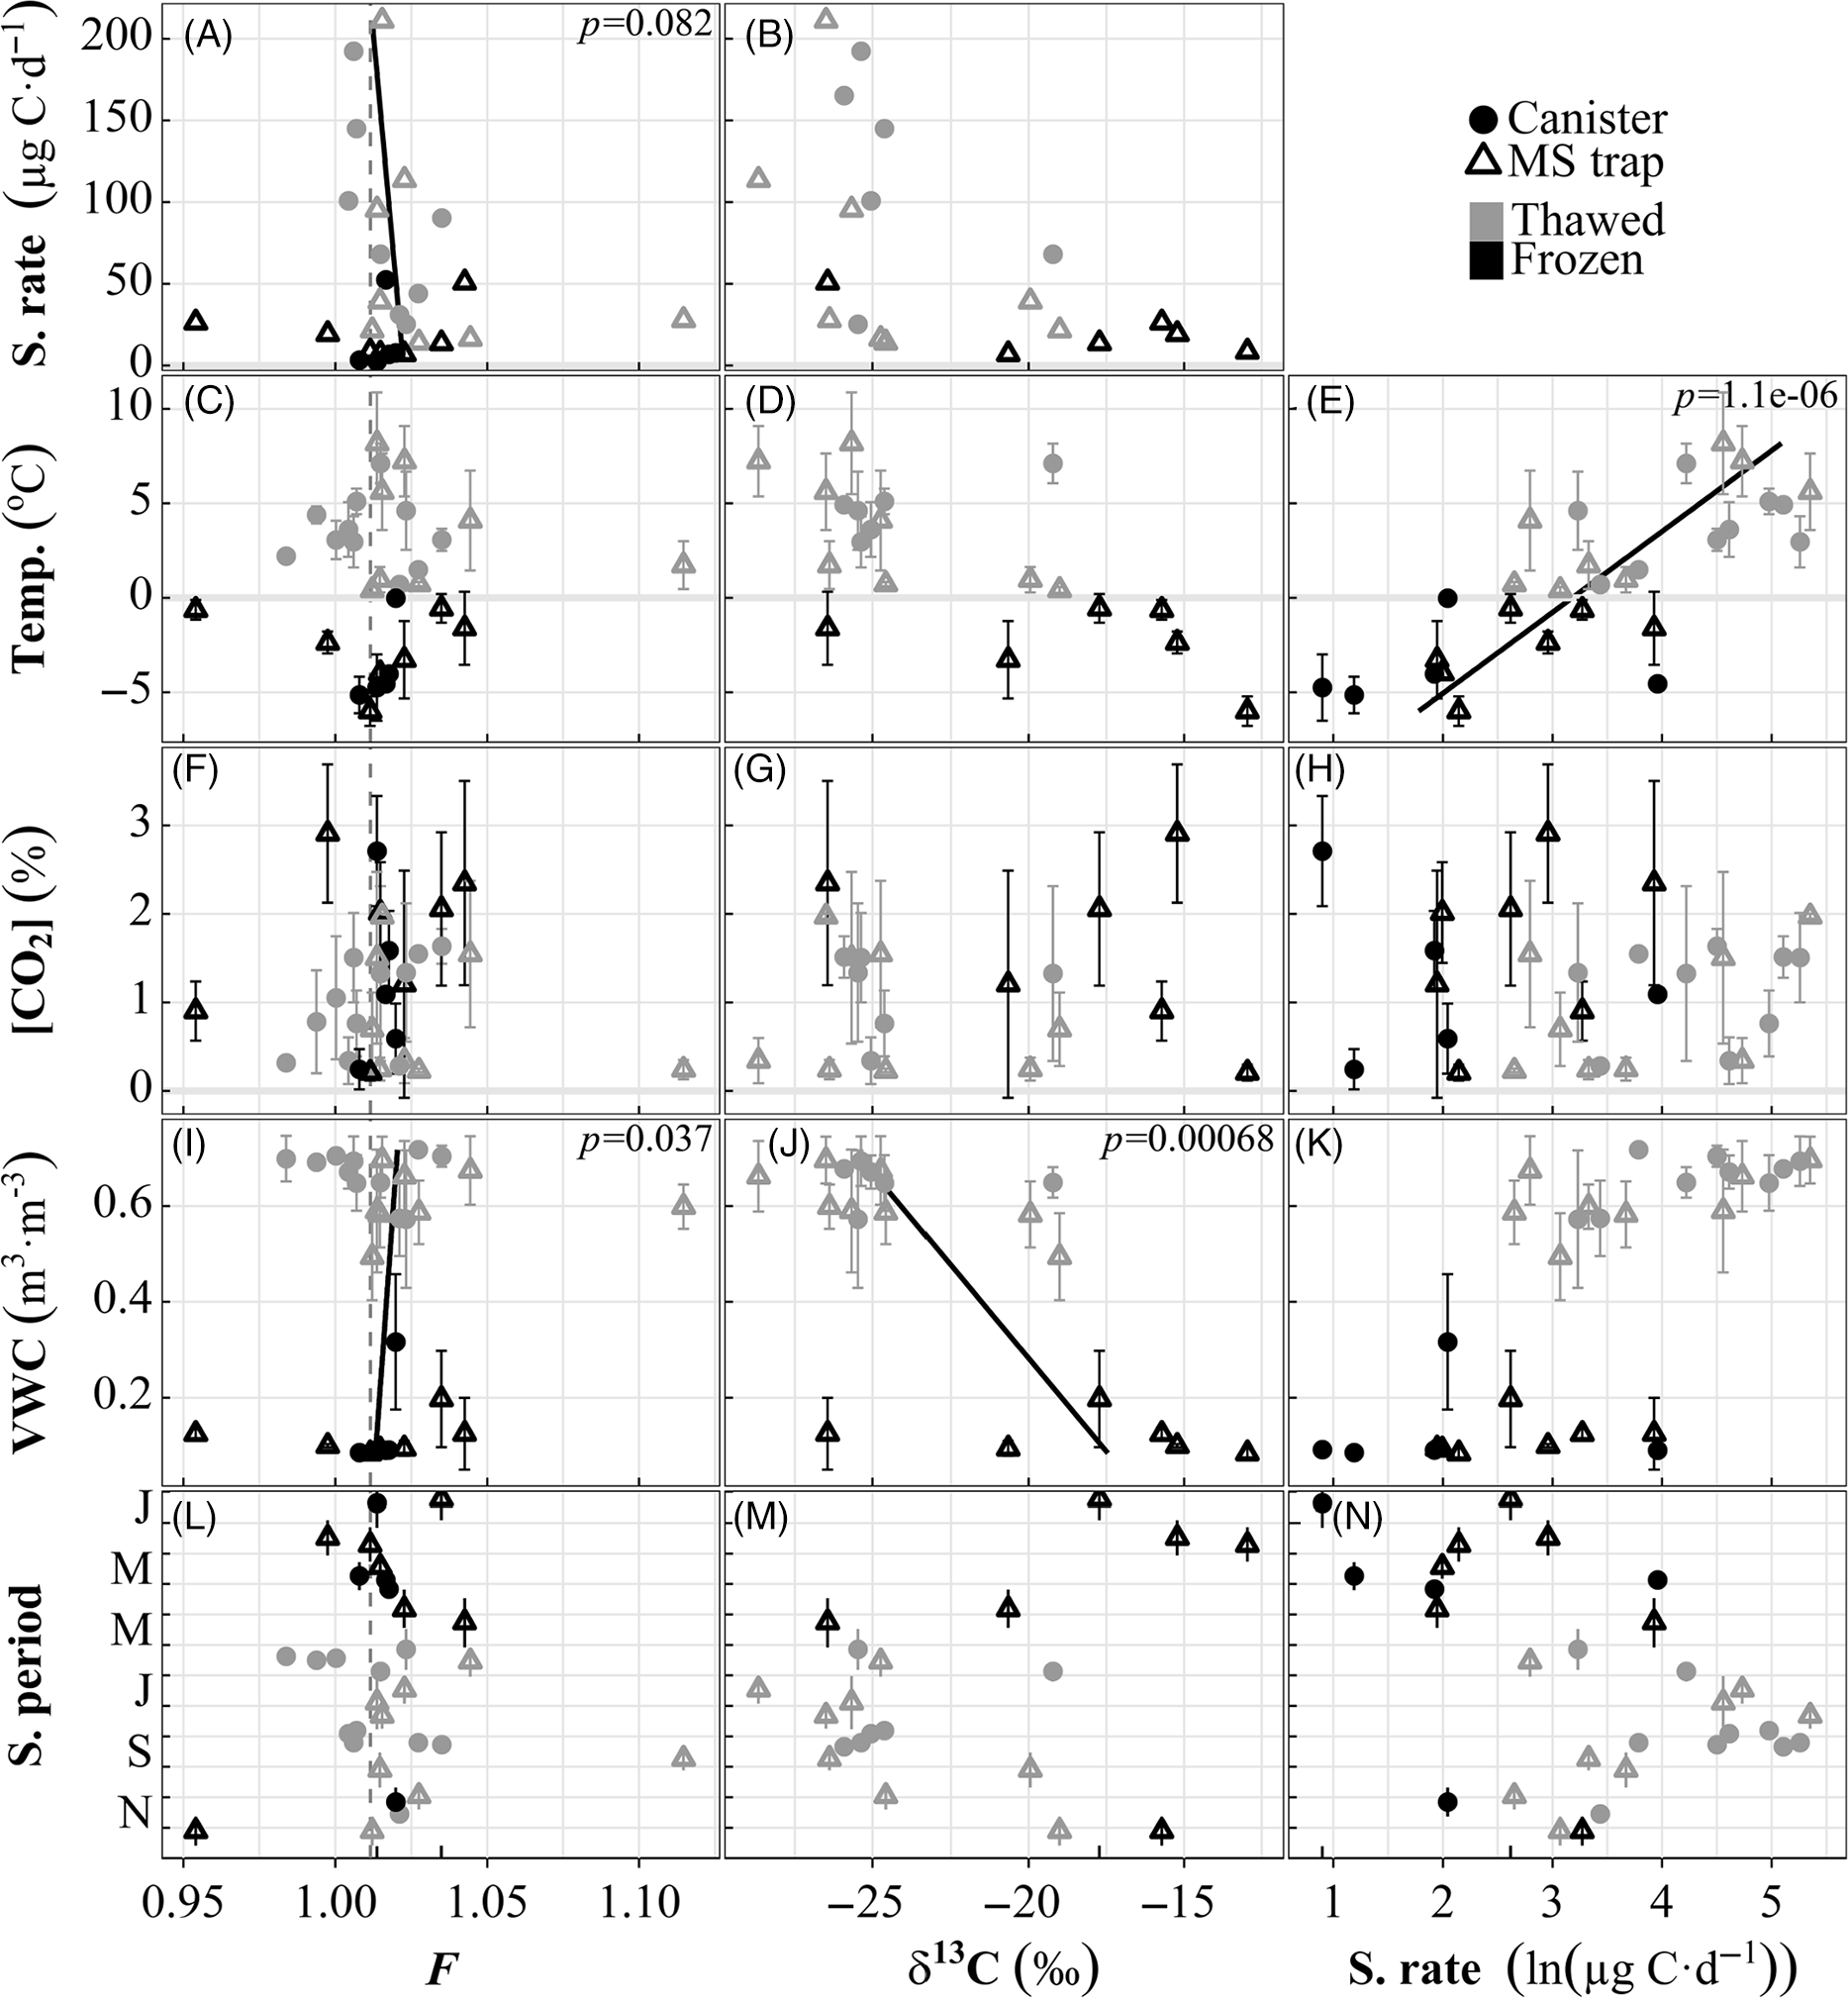
(3) Field sampling. In the field, at temperatures >0ºC, the response of the sampler’s CO2 uptake rate to varying CO2 (i.e. slope) was comparable to that in the lab (Figure 3B, open symbols). We observed more variable CO2 uptake rates (7.0–45 µg C day–1 lab vs. 2.5–210 µg C day-1 field) in the field, likely due to a much broader CO2 range (0.33–0.71% lab vs. 0.063-4.7% field) and changes in environmental conditions such as soil VWC (9.2–79%), temperature (–8.1–13ºC), and pore space volume with freeze-thaw cycles. While our calibrations focused on the most significant controls of sampling rate, future investigations should also consider soils with different textures to understand the influence of soil moisture and pore space volume. The approximate maximum adsorption capacity for 13X zeolite MS (25ºC at 100 kPa, without water vapor) is ˜4 mol CO2 kg–1 zeolite based on experimental data on adsorption equilibria (Wang and LeVan Reference Wang and LeVan2009), which equates to a maximum of 72 mg CO2-C given the 1.5 g of zeolite material used in our MS traps. The range of uncorrected yields captured on MS traps attached to 1st gen. access wells in this experiment was 0.087–5.3 mg CO2-C, and 0.56–13 mg CO2-C on 2nd gen. access wells using the same MS traps. The higher 2nd-gen. yields are likely due to more methodical coiling of Si tubing and the dual ports to the interior diffusion pathway, as well as greater sampling periods. Since all samples collected over the two-year period were less than half the capacity of the MS trap, we assume that sample uptake was linear over each sampling period.
Our three models of field-collected FCO2, δ13CO2, and sampling rate considered CO2, VWC, temperature, water state of matter, and collector type as predictor variables (Figure 4). The CO2, state of water, and collector used did not significantly influence any response. Sample collection rate was calculated as the total yield over the collection period, and was strongly responsive to temperature (Figure 4E). When samples collected at subzero temperatures are considered (as opposed to Figure 3B field samples), CO2 loses significance as a predictor of sampling rate, but still appears to have bimodal linear responses for frozen and thawed states, implying unique summer and winter controls on sampling rate (Figure 4H). We theorize that winter reductions in sampling rate are due to reduced microbial and plant respiration, followed by restriction of soil C transport when soil water freezes (Mikan et al. Reference Mikan, Schimel, Michaelson, Welker, Romanovsky, Fahnestock and Ping2006; Lee et al. Reference Lee, Schuur and Vogel2010). It is known that the availability of liquid water in soils near freezing temperatures is a strong control on microbial activity (Schimel and Clein Reference Schimel and Clein1995). Like Lee et al. (Reference Lee, Schuur and Vogel2010), we observe extremely high CO2 in the months before the start of the growing season—likely due to a reduction of the pore volume near the CO2-sensor—without a corresponding spike in sampling rate. The CO2 permeability of Si rubber is a direct function of temperature, in the same direction as the observed trend. However, the magnitude is much smaller than what we observe. According to (Robb Reference Robb1968), Si rubber has permeabilities of 323 and 293 cc cm s–1 cm2 cm Hg at temperatures of 28 and –40ºC, respectively. This equates to a linear slope of 0.14% permeability per ºC, while our observed range of CO2 sampling rate spans 3 orders of magnitude.
Although we do not see the same sampling-rate-dependent δ13C fractionation in the field that was evident in full-process replications, further work is needed to explore this effect. The VWC dependence of δ13CO2 (Figure 4J) could be related to physical or microbial processes. For example, kinetic fractionation occurs in the partitioning between gas-phase and dissolved CO2 (Thode et al. Reference Thode, Shima, Rees and Krishnxmurty1965), resulting in enrichment in the gas phase, which is inversely proportional to temperature. It is also known that microbial methanogenesis processes yield CO2 enriched in δ13C (Whiticar et al. Reference Whiticar, Faber and Schoell1986; Aravena et al. Reference Aravena, Warner, Charman, Belyea, Mathur and Dinel1993; Charman et al. Reference Charman, Aravena, Bryant and Harkness1999), which is also an inverse function of temperature. While we have observed local indicators of methanogenesis (blue-grey mineral soil, bubbles in nearby standing water), and the environent is likely suitable (anoxia caused by frequent inundation and/or continuous winter snowpack), we did not directly collect any methane.
Soil FCO2 is not strongly correlated to any predictor variables (all p>0.03), but does show some seasonality and the model is improved when predicted by VWC and sampling rate (Figure 4L, I, and A respectively). The sampling rate correlation is logical, as maximum sampling rates are observed during the peak growing season (Figure 4N), when autotrophic respiration (modern F) is greatest. FCO2 of field samples during the growing season (1.021 ± 0.031 mean ± sd, n = 15, June-September) varied similarly to the observed FCO2 of traditional soil respiration chambers (1.040 ± 0.026‰ mean ± sd, n = 39) measured during campaigns. The sampler signature at 20 cm depth is near enough to the soil surface to be close to representative of the growing season isotopic flux but is also able to capture older C (oldest sample F = 0.954‰, November/December 2018) during the non-growing season. As plant respiration slows at the end of the growing season and soil water freezes to ice, heterotrophs become confined to their local environment. This corresponds with a change in available substrate from more modern, labile C (i.e. plant exudates and litter from the growing season) (Grogan and Chapin Reference Grogan and Chapin1999) to older C which is potentially still easily degradable and high in carbohydrates (Mueller et al. Reference Mueller, Rethemeyer, Kao-Kniffin, Löppmann, Hinkel and Bockheim2015), due to a history of physical vertical mixing from freeze-thaw cycles common to tundra ecosystems (Schimel and Clein Reference Schimel and Clein1995; Bockheim Reference Bockheim2007). Winter and shoulder-season (i.e. spring and autumn) fluxes of ancient C have also been seen in high-latitude forests (Winston et al. Reference Winston, Sundquist, Stephens and Trumbore1997; Hirsch et al. Reference Hirsch, Trumbore and Goulden2002; Czimczik et al. Reference Czimczik, Trumbore, Carbone and Winston2006), peatlands (Garnett and Hardie Reference Garnett and Hardie2009), and tundra (Hartley et al. Reference Hartley, Garnett, Sommerkorn, Hopkins and Wookey2013; Hicks Pries et al. Reference Hicks Pries, Schuur and Crummer2013; Lupascu et al. Reference Lupascu, Czimczik, Welker, Ziolkowski, Cooper and Welker2018b). Our sampler offers a device capable of capturing a continuous year-round record of soil CO2 isotopes in permafrost environments.
CONCLUSIONS
We present a novel sampler designed for time-integrated, year-round collection of soil-respired CO2 and subsequent C isotope analysis in remote environments that facilitates a deeper understanding of C cycling in soils, i.e., plant and microbial contributions to soil-atmosphere CO2 fluxes and microbial C sources. Soil CO2 diffuses into the sampler via a water-proof Si membrane and accumulates in lightweight, compact MS traps, but can also be collected in evacuated canisters. The CO2 collection rate is proportional to soil temperature. The deployment of the sampler in Arctic tundra demonstrates its ruggedness and suitability for use in organic and mineral soils and sediments with a wide range of moisture and temperature conditions.
ACKNOWLEDGMENTS
We thank the Toolik Field Station Science Support and Environmental Data Center teams, D. Helmig (CU Boulder), and the KCCAMS staff and C. McCormick (UCI) for their logistical and technical support. Funding was provided by the U.S. NSF OPP (#1649664 to C.I.C., #1650084 to J.M.W. and E.S.K.).


 Open access

