


1. INTRODUCTION
The discovery of deforming sediments underlying ice streams prompted a fundamental change in the understanding of ice-sheet dynamics. With the incorporation of pervasively deforming beds, ice stream velocities of hundreds to thousands of meters per year under low driving stresses could be explained (e.g., Alley and others, Reference Alley, Blankenship, Bentley and Rooney1986; Boulton and Hindmarsh, Reference Boulton and Hindmarsh1987). Meters-thick sediment deformation has been interpreted from geophysical and ice borehole data under the Whillans Ice Stream, Antarctica (Alley and others, Reference Alley, Blankenship, Bentley and Rooney1986, Reference Alley, Blankenship, Rooney and Bentley1987; Blankenship and others, Reference Blankenship, Bentley, Rooney and Alley1986; Engelhardt and others, Reference Engelhardt, Humphrey, Kamb and Fahnestock1990). Yet pervasive, distributed deformation can hypothetically only occur in tills with coarse clasts by the transmission of applied stresses at depth through grain-to-grain contact (Iverson and others, Reference Iverson, Hooyer and Hooke1996; Tulaczyk, Reference Tulaczyk1999) or vertical water pressure fluctuations that can transmit deformation to greater depths (Iverson and others, Reference Iverson, Hooyer and Baker1998; Tulaczyk, Reference Tulaczyk1999; Tulaczyk and others, Reference Tulaczyk, Kamb and Engelhardt2000; Damsgaard and others, Reference Damsgaard2015). In-situ experiments (Engelhardt and Kamb, Reference Engelhardt and Kamb1998) and laboratory observations (Tulaczyk, Reference Tulaczyk1999; Tulaczyk and others, Reference Tulaczyk, Kamb and Engelhardt2000) suggest centimeter- to decimeter-scale horizons of intense deformation and basal sliding over a thin water film, rather than pervasive meter-scale deformation. Laboratory geotechnical studies show that sediment deformation is constrained to thin discrete failure planes (Kamb, Reference Kamb1991; Iverson and others, Reference Iverson, Hooyer and Baker1998; Tulaczyk and others, Reference Tulaczyk, Kamb and Engelhardt2000; Hiemstra and Rijsdijk, Reference Hiemstra and Rijsdijk2003). However, most laboratory and model experiments do not capture realistic till properties, such as heterogeneous size and nonspherical shape of grains (e.g., Anderson and others, Reference Anderson, Kurtz, Domack and Balshaw1980; Anderson, Reference Anderson1999; Evans and others, Reference Evans, Phillips, Hiemstra and Auton2006), that can influence the degree and style of bed deformation.
Tills have been historically classified as either ‘deformation till’ or ‘lodgement till’, based on the inferred process of till deposition (Boulton, Reference Boulton1979). Diamicton interpreted as deformation till has low shear strength (<20–40 kPa: Evans and others, Reference Evans, Pudsey, Ó Cofaigh, Morris and Domack2005; Mosola and Anderson, Reference Mosola and Anderson2006) and high porosity and water content (40–59% and 20–34%: Evans and others, Reference Evans, Pudsey, Ó Cofaigh, Morris and Domack2005). Deformation till is thought to be confined to glacial troughs and is commonly associated with streamlined bedforms. Till classified as lodgement is thought to be deposited by the plastering of sediment entrained at the base of slow-flowing ice onto a rigid or semi-rigid bed; it is characterized by high shear strength (>20–40 kPa: Evans and others, Reference Evans, Pudsey, Ó Cofaigh, Morris and Domack2005; Mosola and Anderson, Reference Mosola and Anderson2006) and low porosity and water content (27–39% and 12–19%: Evans and others, Reference Evans, Pudsey, Ó Cofaigh, Morris and Domack2005) due to overconsolidation and dewatering. However, with more direct observations, temporal and spatial variations in till forming processes have been attributed to shearing of the bed by overriding ice and incorporation of basal water into till pore spaces (Evans and others, Reference Evans, Phillips, Hiemstra and Auton2006; Piotrowski and others, Reference Piotrowski, Larsen, Menzies and Wysota2006). While grain-scale processes are important, placing these types of observations into a wider spatial context is critical for understanding how ice/bed interactions influence glacial dynamics and for representing these processes at larger scales in ice-sheet models.
To investigate the processes of till formation and bed deformation at a regional scale, we examine the relationships between till characteristics, glacial landforms and bed conditions using an extensive dataset of high-resolution geophysical data and sediment cores from the Ross Sea. Sediment cores acquired during Nathaniel B Palmer (NBP) cruises are used to determine if there are regional trends in till distribution and character and any associated down-core variability in till properties that might reflect the nature of till deformation. We specifically target cores collected in a context with known glacial landforms, including glacial lineations and grounding zone wedges, that are comprised of till and assumed to have undergone subglacial deformation.
2. BACKGROUND
2.1. Antarctic continental shelf tills and associated landforms
Tills collected from sediment cores on the Antarctic continental shelf are matrix-supported diamictons that are typically massive, with textural homogeneity (Anderson, Reference Anderson1999) although they can display micromorphological variability (e.g., Menzies, Reference Menzies2000; Menzies and others, Reference Menzies, van der Meer and Rose2006; Reinardy and others, Reference Reinardy, Hiemstra, Murray, Hillenbrand and Larter2011). In contrast, glacimarine sediments, deposited in the time following retreat of grounded ice, show variability associated with marine currents, biogenic sedimentation, meltwater input and iceberg turbation (Anderson and others, Reference Anderson, Brake and Myers1984; Dunbar and others, Reference Dunbar, Anderson, Domack and Jacobs1985; Anderson, Reference Anderson1999; Domack and others, Reference Domack, Jacobson, Shipp and Anderson1999; Licht and others, Reference Licht, Dunbar, Andrews and Jennings1999; Prothro and others, Reference Prothro, Simkins, Majewski and Anderson2018). In high-resolution seismic profiles collected across the continental shelf, tills overly unconformities with relief indicative of glacial erosion, and they display transparent and homogeneous acoustic character (e.g., Shipp and others, Reference Shipp, Anderson and Domack1999). Ross Sea tills are thickest in troughs, locally approaching 80 m, and thin abruptly against banks and trough flanks (Shipp and others, Reference Shipp, Anderson and Domack1999), consistent with other observations around Antarctica (Bart and Anderson, Reference Bart and Anderson1995; Klages and others, Reference Klages2014). These till units were constructed throughout multiple phases of subglacial deformation during the last glacial cycle. A modern ‘snapshot’ shows deforming sediments below the contemporary Whillans Ice Stream with an average thickness of 6 m (Alley and others, Reference Alley, Blankenship, Rooney and Bentley1987).
Tills recovered in sediment cores are often hard to distinguish from other diamictons formed in glaciated continental shelf settings (e.g., Licht and others, Reference Licht, Dunbar, Andrews and Jennings1999; Prothro and others, Reference Prothro, Simkins, Majewski and Anderson2018); therefore, the importance of geomorphic context in identification of tills and other facies is increasingly recognized (e.g., Bart and Cone, Reference Bart and Cone2012; McGlannan and others, Reference McGlannan, Bart, Chow and DeCesare2017; Prothro and others, Reference Prothro, Simkins, Majewski and Anderson2018). Glacial lineations (Fig. 1a) and grounding zone wedges (Fig. 1b) form as a result of subglacial sediment deformation and mobilization (e.g., Wellner and others, Reference Wellner, Heroy and Anderson2006; Dowdeswell and others, Reference Dowdeswell, Ottesen, Evans, Ó Cofaigh and Anderson2008; King and others, Reference King, Hindmarsh and Stokes2009; Batchelor and Dowdeswell, Reference Batchelor and Dowdeswell2015). Modern observations document glacial lineation formation underneath currently active ice streams (King and others, Reference King, Hindmarsh and Stokes2009; Schroeder and others, Reference Schroeder, Blankenship, Young, Witus and Anderson2014); however, the exact mechanism of lineation formation is still debated (Tulaczyk and others, Reference Tulaczyk, Scherer and Clark2001a; Fowler, Reference Fowler2010; Spagnolo and others, Reference Spagnolo2014). Lineations have been mapped extensively on the deglaciated continental shelf within paleo-ice stream troughs and range from 1 to 9 m in amplitude (Spagnolo and others, Reference Spagnolo2014 and references therein) and, on the Antarctic shelf, are associated with the seismic facies interpreted as the deformation till layer above the Last Glacial Maximum (LGM) glacial unconformity (e.g., Shipp and others, Reference Shipp, Anderson and Domack1999; Ó Cofaigh and others, Reference Ó Cofaigh, Pudsey, Dowdeswell and Morris2002, Reference Ó Cofaigh2005; Heroy and Anderson, Reference Heroy and Anderson2005; Livingstone and others, Reference Livingstone2012). Lineation orientations also match paleo-flow lines established from detailed provenance analysis, indicating consistency in flow across the observable portion of the trough (Anderson, Reference Anderson1999; Licht and others, Reference Licht, Hennessy and Welke2014).
Glacial landforms on the Ross Sea continental shelf imaged during cruise NBP1502. Depth in meters is converted from two-way travel time using a fixed sound velocity of 1500 m s−1. Locations are shown in Figure 2. (a) Glacial lineations in Glomar Challenger Basin. (b) Grounding zone wedges in Pennell Trough, with lineated topsets.
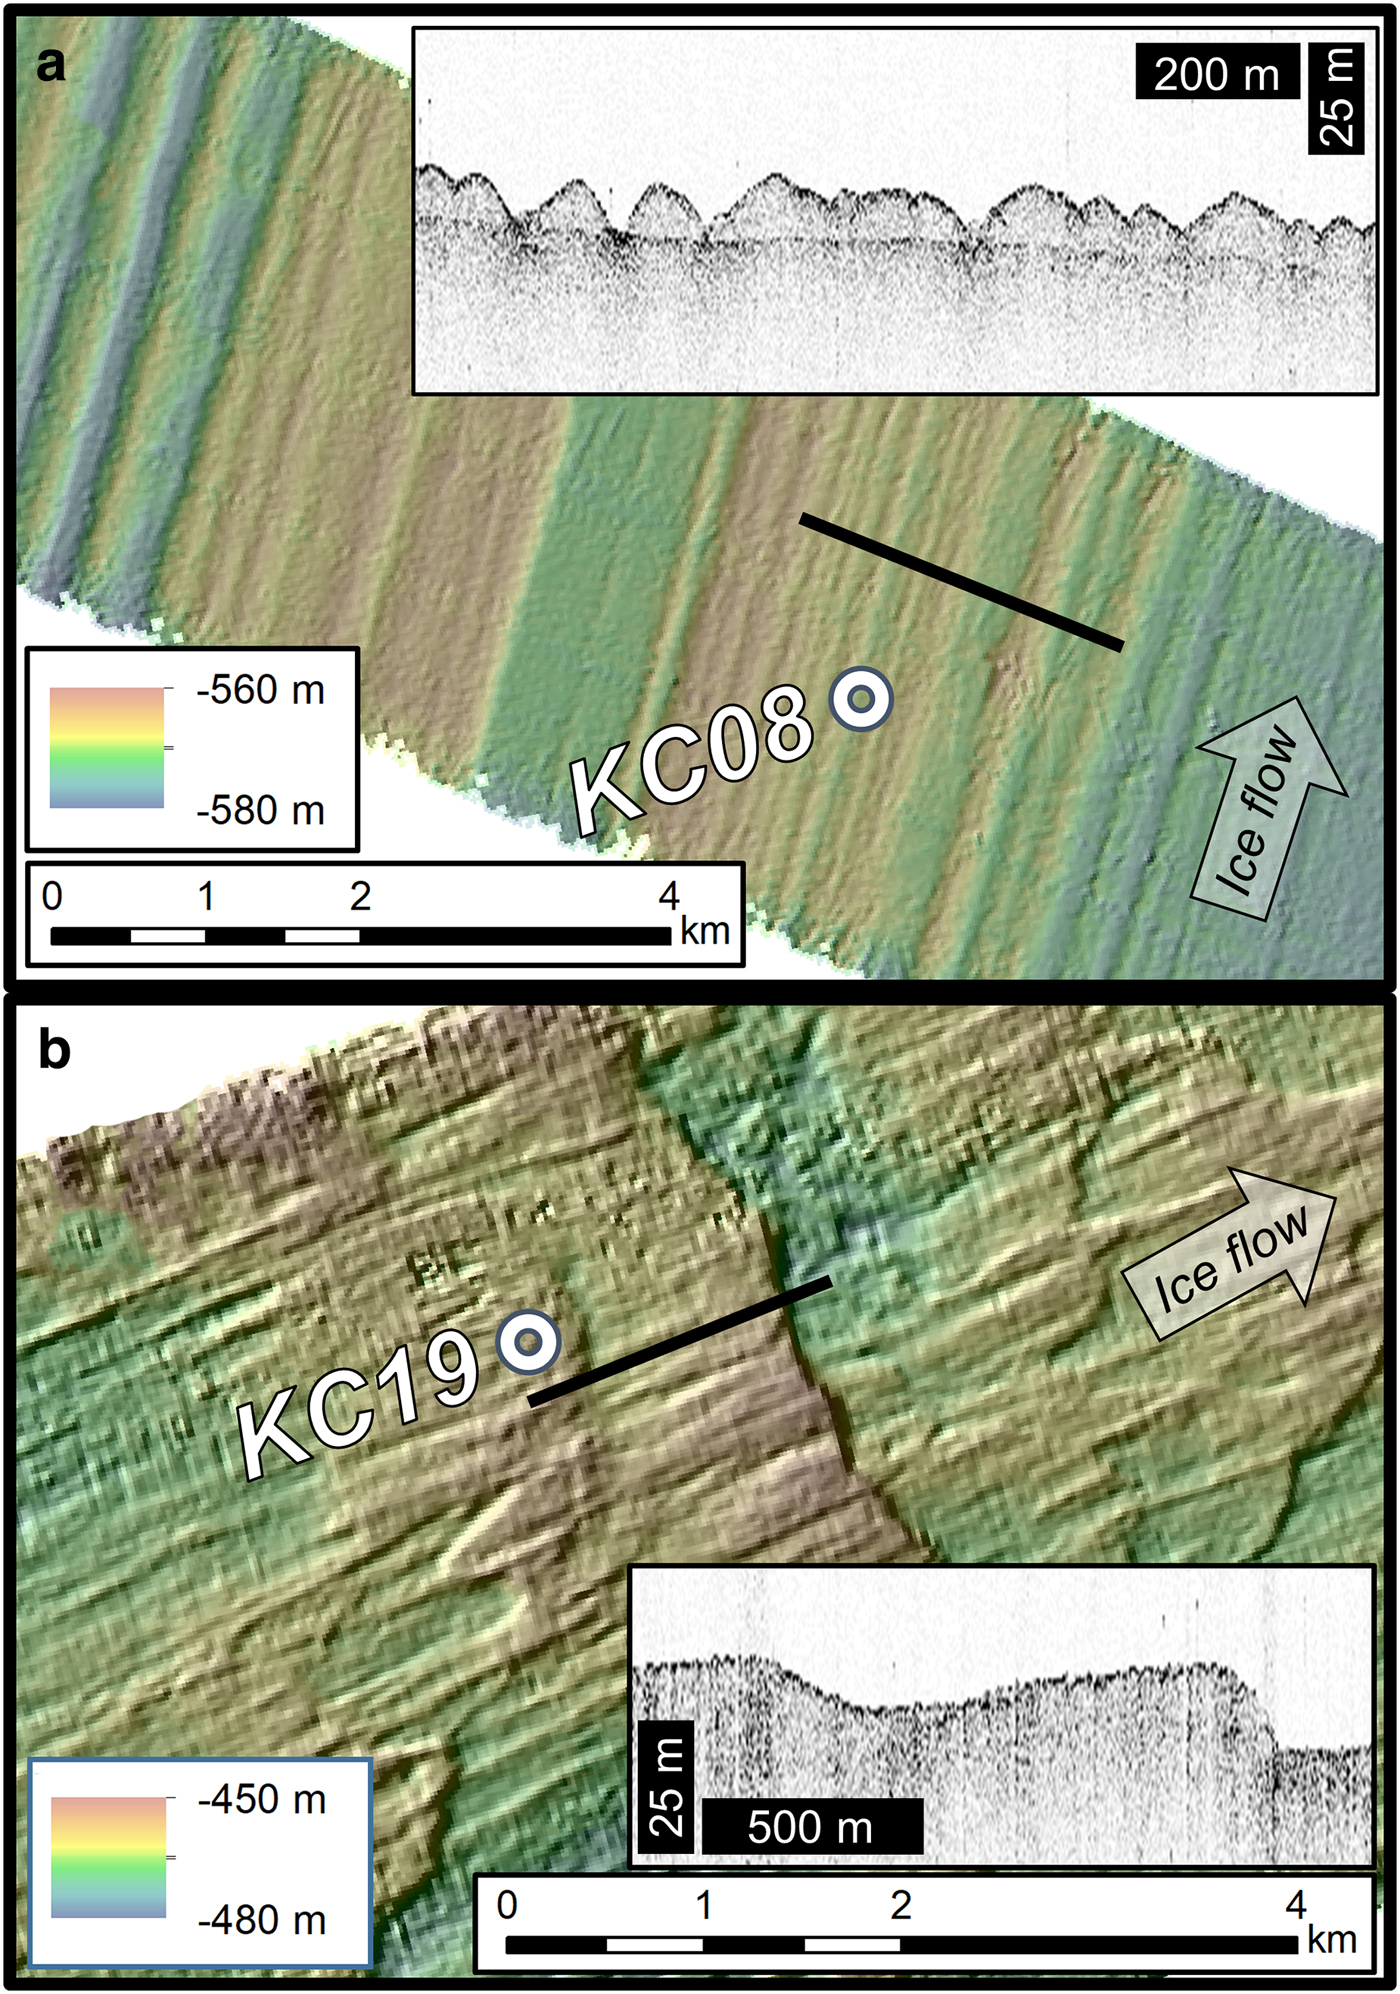
Grounding zone wedges are deposited during periods of grounding-line position stability, marking the downstream extent of ice contact with the bed. They aggrade and prograde as sediment is delivered to the grounding line through subglacial bed deformation, and form foreset slopes beyond the point of ice decoupling through basal melt-out and gravity flow processes that lead to the overall asymmetric shape of these landforms (e.g., Alley and others, Reference Alley, Blankenship, Rooney and Bentley1989, Reference Alley, Anandakrishnan, Dupont, Parizek and Pollard2007; Anderson, Reference Anderson1999; Anandakrishnan and others, Reference Anandakrishnan, Catania, Alley and Horgan2007; Dowdeswell and others, Reference Dowdeswell, Ottesen, Evans, Ó Cofaigh and Anderson2008, Dowdeswell and Fugelli, Reference Dowdeswell and Fugelli2012; Batchelor and Dowdeswell, Reference Batchelor and Dowdeswell2015). Some grounding zone wedges are overprinted by glacial lineations that extend across the topset to the topset-foreset break (Fig. 1b), which represents the downstream limit of grounded ice (e.g., Bart and Cone, Reference Bart and Cone2012). Both glacial lineations and grounding zone wedge topsets are associated with explicit subglacial conditions; thus, sediment cores from these landforms contain sediments that can be used to study till properties with the utmost certainty that tills were sampled (e.g., McGlannan and others, Reference McGlannan, Bart, Chow and DeCesare2017; Prothro and others, Reference Prothro, Simkins, Majewski and Anderson2018).
2.2. Ross Sea study area
Ice stream drainage across the Ross Sea continental shelf was strongly regulated by underlying geology and physiography. These ice streams preferentially occupied north-south oriented rift basins, eroding six distinct paleo-ice stream troughs and depositing younger sedimentary strata along trough axes (Hinz and Block, Reference Hinz and Block1984; Cooper and others, Reference Cooper1991; Anderson and Bartek, Reference Anderson, Bartek and Kennett1992; Muto and others, Reference Muto, Christianson, Horgan, Anandakrishnan and Alley2013). Most of the eastern Ross Sea occupies a single large rift basin (Eastern Basin) with near-surface stratigraphy comprised seaward-thickening unconsolidated Plio-Pleistocene sediments (Alonso and others, Reference Alonso, Anderson, Diaz, Bartek and Elliot1992; Anderson and Bartek, Reference Anderson, Bartek and Kennett1992). The far eastern side of the Ross Sea is occupied by the relatively narrow Little America Basin, which contains a succession of sediment-filled troughs that are up to 20 km across and 100–150 m deep (Sorlien and others, Reference Sorlien2007). The western Ross Sea is more geologically varied, with narrow rift basins filled with older and more consolidated strata outcropping near the seafloor (Anderson and Bartek, Reference Anderson, Bartek and Kennett1992; Brancolini and others, Reference Brancolini, Cooper, Coren, Cooper, Barker and Brancolini1995). Differential erosion of these strata has resulted in seafloor physiography characterized by high-relief banks and troughs. These physiographic highs, along with volcanic seamounts and eroded intrusives at/near the seafloor, caused more circuitous ice drainage patterns (Halberstadt and others, Reference Halberstadt, Simkins, Greenwood and Anderson2016). During the LGM, West Antarctic ice streams flowed across the eastern Ross Sea and terminated at the continental shelf break while East Antarctic ice streams reached within 150 km of the shelf break in the western Ross Sea. These two regions experienced different styles of deglaciation (Halberstadt and others, Reference Halberstadt, Simkins, Greenwood and Anderson2016). Landward of the LGM grounding zone wedges, the seafloor in the western Ross Sea is imprinted with relatively small but numerous grounding line landforms (Simkins and others, Reference Simkins, Greenwood and Anderson2018) indicative of complex recession patterns, suggesting that a steep-profiled ice sheet retreated rapidly in troughs and remained grounded on banks (Anderson and others, Reference Anderson2014; Halberstadt and others, Reference Halberstadt, Simkins, Greenwood and Anderson2016). Conversely, the eastern Ross Sea is dominated by extensive glacial lineations and a few large grounding zone wedges that formed as paleo-ice streams thinned and decoupled from the bed in large, discrete back-stepping events (Mosola and Anderson, Reference Mosola and Anderson2006; Bart and Cone, Reference Bart and Cone2012; Bart and others, Reference Bart, Anderson and Nitsche2017a).
3. METHODOLOGY
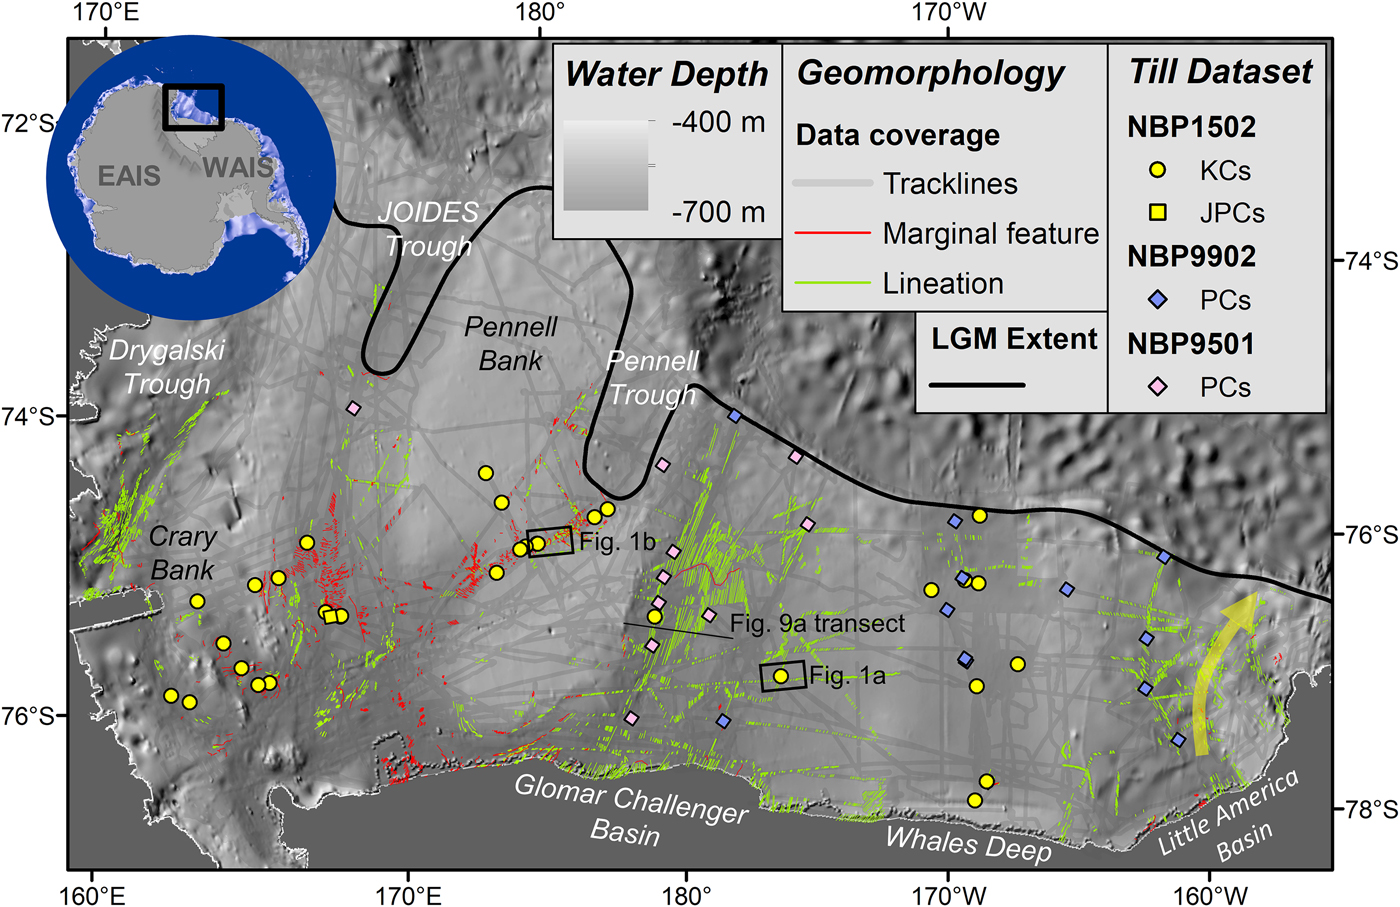
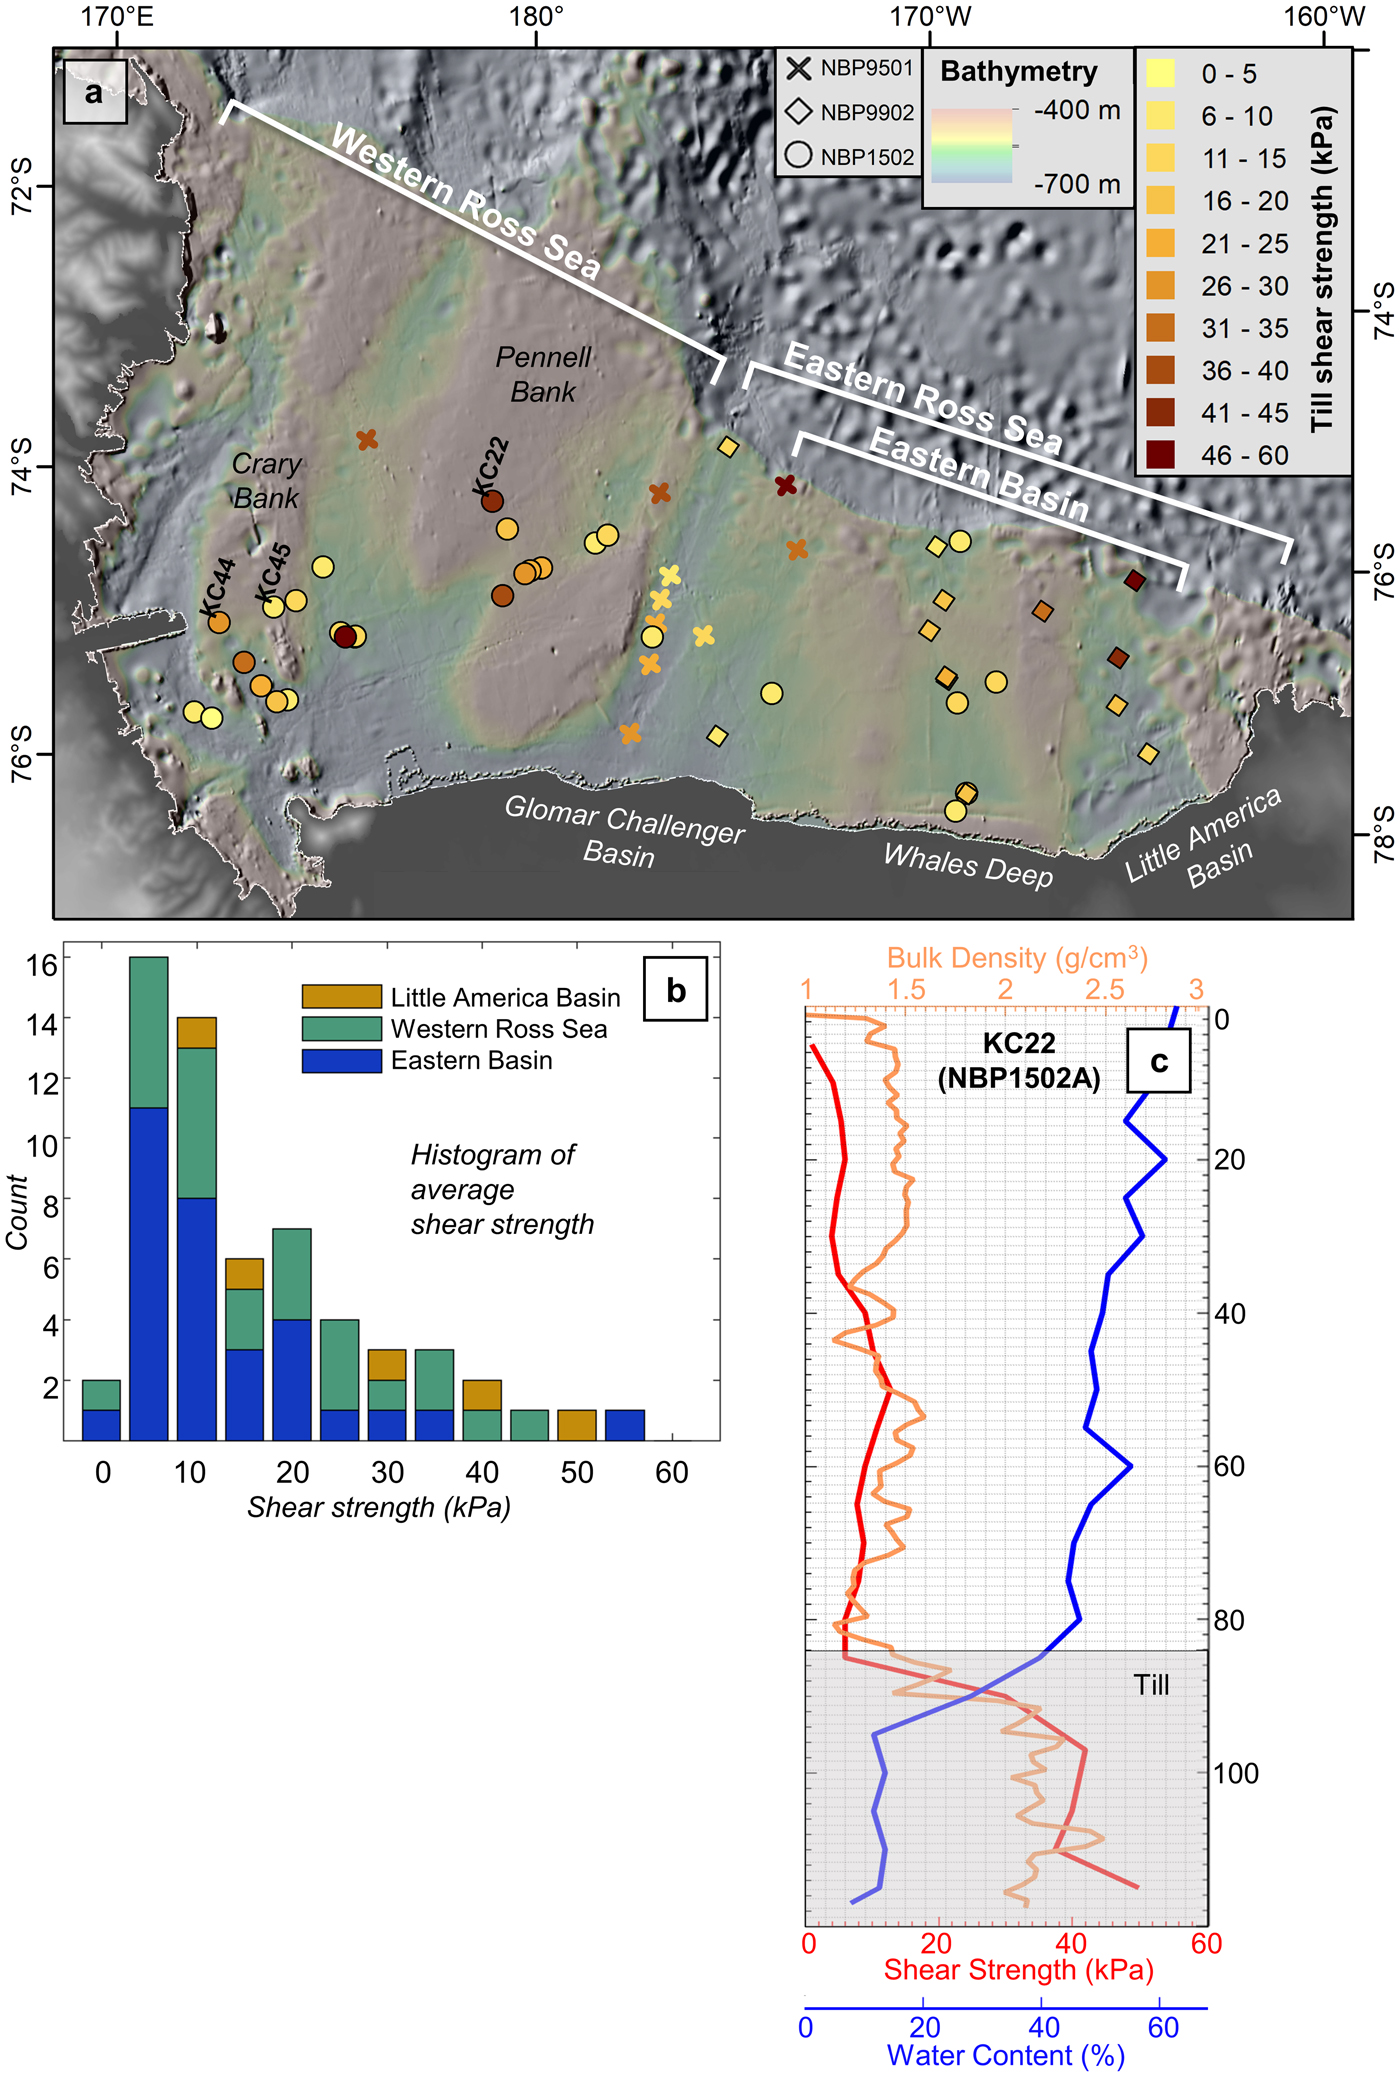
Legacy high-resolution seismic reflection data (Anderson and Bartek, Reference Anderson, Bartek and Kennett1992; Shipp and others, Reference Shipp, Anderson and Domack1999) were used to map the strata underlying the LGM glacial unconformity in the Ross Sea (Halberstadt and others, Reference Halberstadt, Simkins, Greenwood and Anderson2016). These observations provide stratigraphic context for examining till properties and the nature of sediments likely incorporated into the deforming bed. During cruises NBP1502A and NBP1502B, high-resolution multibeam bathymetry data were collected using a Kongsberg EM-122 system in dual swath mode with a 12-kHz frequency and gridded at 20 m. From this framework, a large dataset of 32 targeted sediment cores was collected across the Ross Sea within a geomorphic framework (Fig. 2). Cores include piston and Kasten core types, ranging in length from 30 to 395 cm.
All till samples collected from the Ross Sea are plotted according to their core type and cruise. The Last Glacial Maximum grounded ice limit, along with the distribution of geomorphic features, was mapped by Halberstadt and others (Reference Halberstadt, Simkins, Greenwood and Anderson2016). Cruise tracklines are shown to demonstrate the coverage of swath bathymetry available for geomorphic analysis. The yellow arrow denotes a flow direction discussed in the text. The continental bathymetry is from Bedmap2 (Fretwell and others, Reference Fretwell2013).
Till facies were identified based on diagnostic criteria that include broad, unsorted grain size distribution (diamicton), low quantities of in situ fossils, low organic carbon content and homogeneity in grain size and composition within units (see Anderson, Reference Anderson1999 for more detail). Acoustic sub-surface profiler surveys from a Knudsen CHIRP echosounder aided the identification of till units at sites where a visible surface marked the transition from till to glacimarine sediments, providing a core-depth estimate for the upper till boundary. Sedimentological interpretations of till units were supported by geomorphic context interpreted from multibeam bathymetry data.
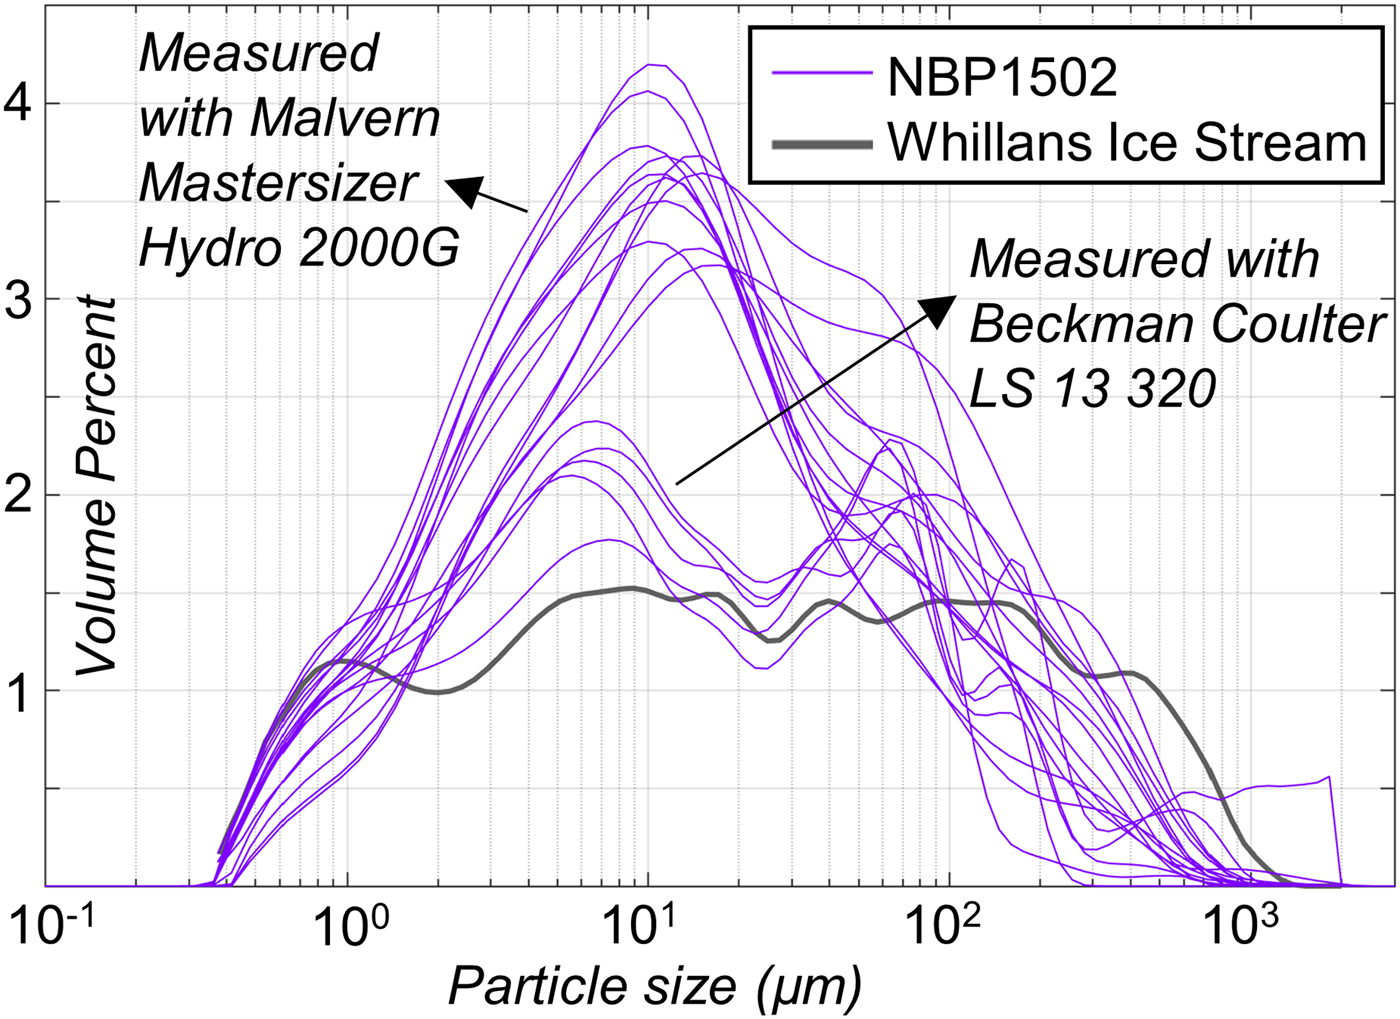
Grain-size for NBP1502A cores was measured using laser particle diffraction analysis with a Malvern Mastersizer Hydro 2000G. Samples were treated with sodium metaphosphate to deflocculate clays, placed on a magnetic stirrer to homogenize grains and introduced into the machine using a 2 mm pipette. Grain size was measured for NBP1502B cores using a Beckman Coulter LS 13 320 after deflocculation and sonication. Grain size samples for both cruises were filtered through a 500 µm sieve, to measure only matrix material.
Water content samples were collected onboard cruise NBP1502 across a core depth of ~2 cms at each sampling site, generally at 5-cm intervals downcore. A hand-held torvane (diameter of 3–5 cm) was used to measure shear strength at 5-cm intervals down-core immediately following core collection. For clay-rich deposits, the torvane measurements have an accuracy of 1 kPa (0.01 kg-f cm−2), although slight differences in the angle of application and rate of applied shear resulted in variations in repeat measurements of ~5 kPa. The measurement encompasses both the resistance to shearing due to friction between particles and resistance due to the cohesion of clay particles. For representing down-core variability, we report the minimum and maximum values from each till unit with more than three measurements. The spatial distribution of till shear strength is reported using the average shear strength value throughout each down-core till unit.
We also incorporate torvane measurements of shear strength from tills recovered on cruises NBP9902 and NBP9501 (Fig. 2). These cruises collected swath bathymetry data using a SeaBeam 2112 multibeam echosounder, which provides the geomorphic context for the NBP9902 and NBP9501 tills. Till facies were identified using similar criteria as mentioned above and uphold similar shear strength patterns as NBP1502 cores.
4. RESULTS
4.1. Down-core sedimentological and geotechnical till properties
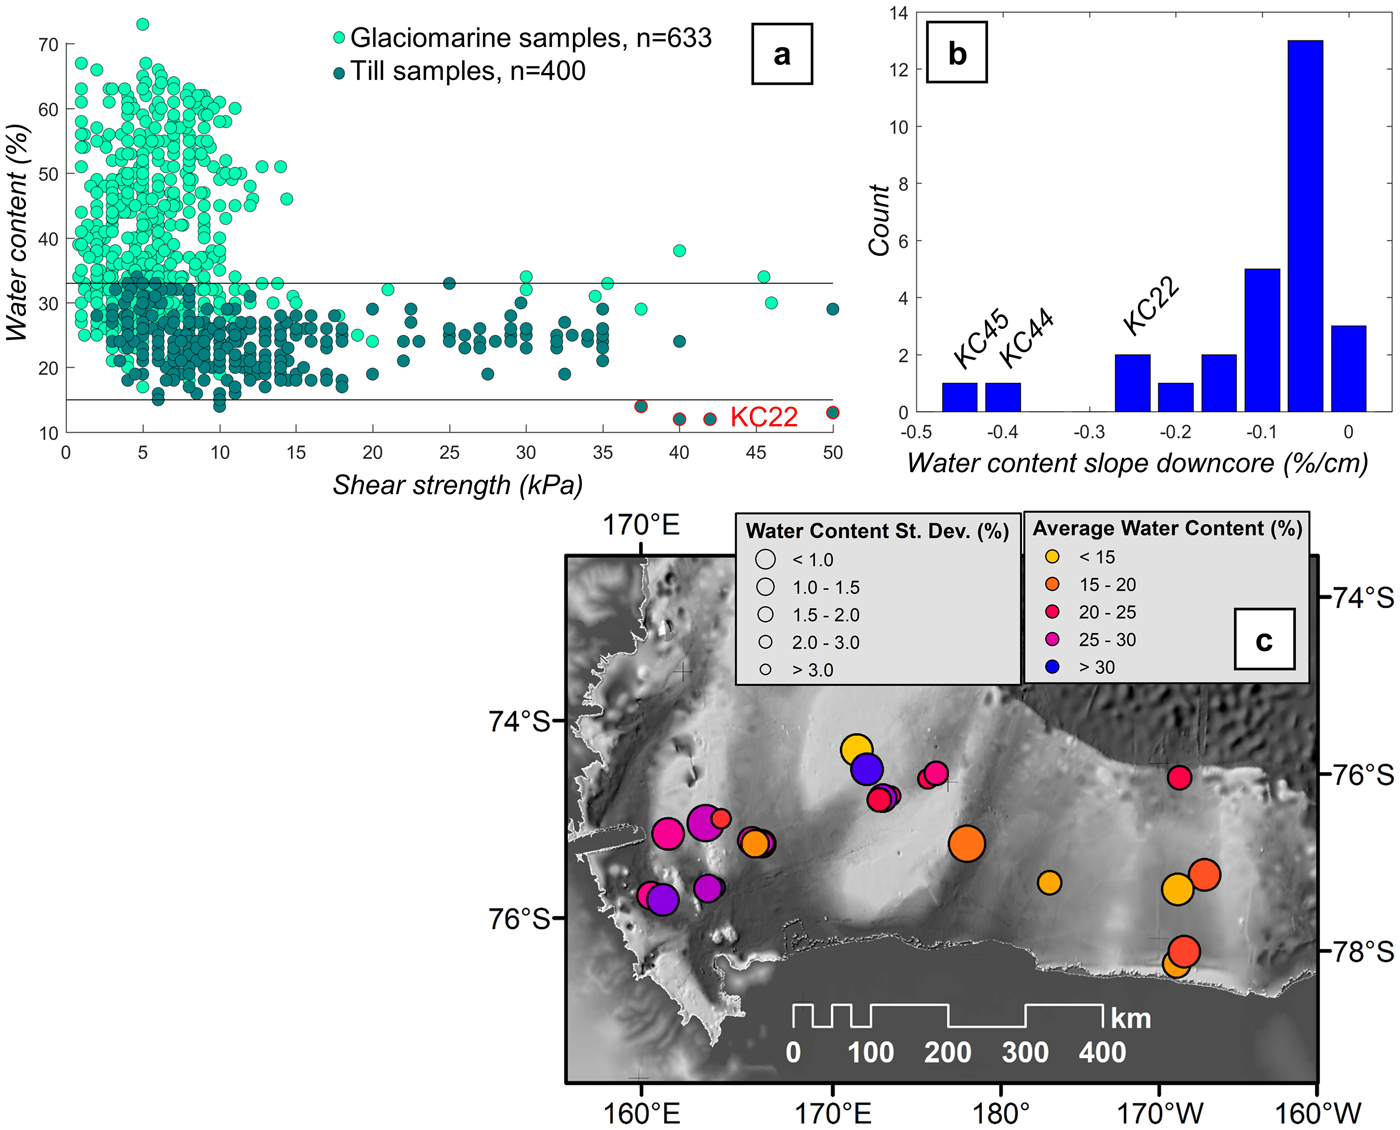
Grain-size measurements throughout each till layer collected from across the Ross Sea are remarkably similar in terms of mean, mode and overall distribution (Figs 3a, b). X-ray images of the cores reveal corresponding macroscopic homogeneity within till units, lacking any obvious clast-to-clast contact (e.g., Fig. 3c). Water content variability for all tills is relatively limited (15–33%), compared with glacimarine sediments across the Ross Sea (Fig. 4a). Most of the till units surveyed had little change in down-core water content (SD = 1–3%) and little to no evidence of down-core dewatering (Fig. 4b). Despite homogeneous till grain size and relatively consistent water content, shear strength measurements range between 0 and 80 kPa (0–0.8 kg-f cm−2; Fig. 5). The amount of downcore shear strength variability is greatest in the western Ross Sea and Little America Basin. In the Eastern Basin, tills have relatively homogeneous shear strength (shown by comparing minimum and maximum shear strength values, Fig. 5a). Down-core shear strength excursions for both high and low shear strength intervals do not correspond to water content anomalies or changes in bulk density, which could indicate sediment consolidation. A bulge-shape shear strength profile, with an abrupt increase at the top of the till unit, has been interpreted to reflect stronger ice-bed coupling immediately preceding retreat (Christoffersen and Tulaczyk, Reference Christoffersen and Tulaczyk2003; Ó Cofaigh and others, Reference Ó Cofaigh, Evans, Dowdeswell and Larter2007); however, this distinct profile was not clearly displayed by any of the Ross Sea tills.
KC19 (cruise NBP1502A) has extremely homogeneous grain size and water content throughout the till unit, yet displays shear strength variability. Geomorphic context from swath bathymetry and acoustic profiling (Fig. 1b) aids till interpretation. (a) Down-core sedimentologic analyses are shown. (b) The till unit is clearly differentiated from open-marine sedimentation based on grain size measurements throughout the core. (c) X-ray images reveal macroscopic homogeneity lacking clast-to-clast contacts.

(a) Each shear strength measurement is plotted with respect to the water content measurement at the same core depth for all NBP1502 cores. Water content variability in tills is small compared to glaciomarine sediments. Till water contents generally fall between 15 and 33% (bounding lines shown). Till samples with the lowest water contents, denoted with red circles, are from KC22 (NBP1502A bank-top core from Pennell Bank; location shown in Fig. 7). (b) For each till unit with more than three water content measurements, a linear best-fit slope was calculated to assess the change in water content with depth. This is plotted as a histogram, showing that most cores do not significantly dewater with depth. The two cores with the highest dewatering trends were collected from Crary Bank (see Fig. 7 for locations). (c) Average water contents are lower and more uniform in the Eastern Basin. There does not seem to be a regional trend in downcore water content variability, represented by the standard deviation of a population sample.
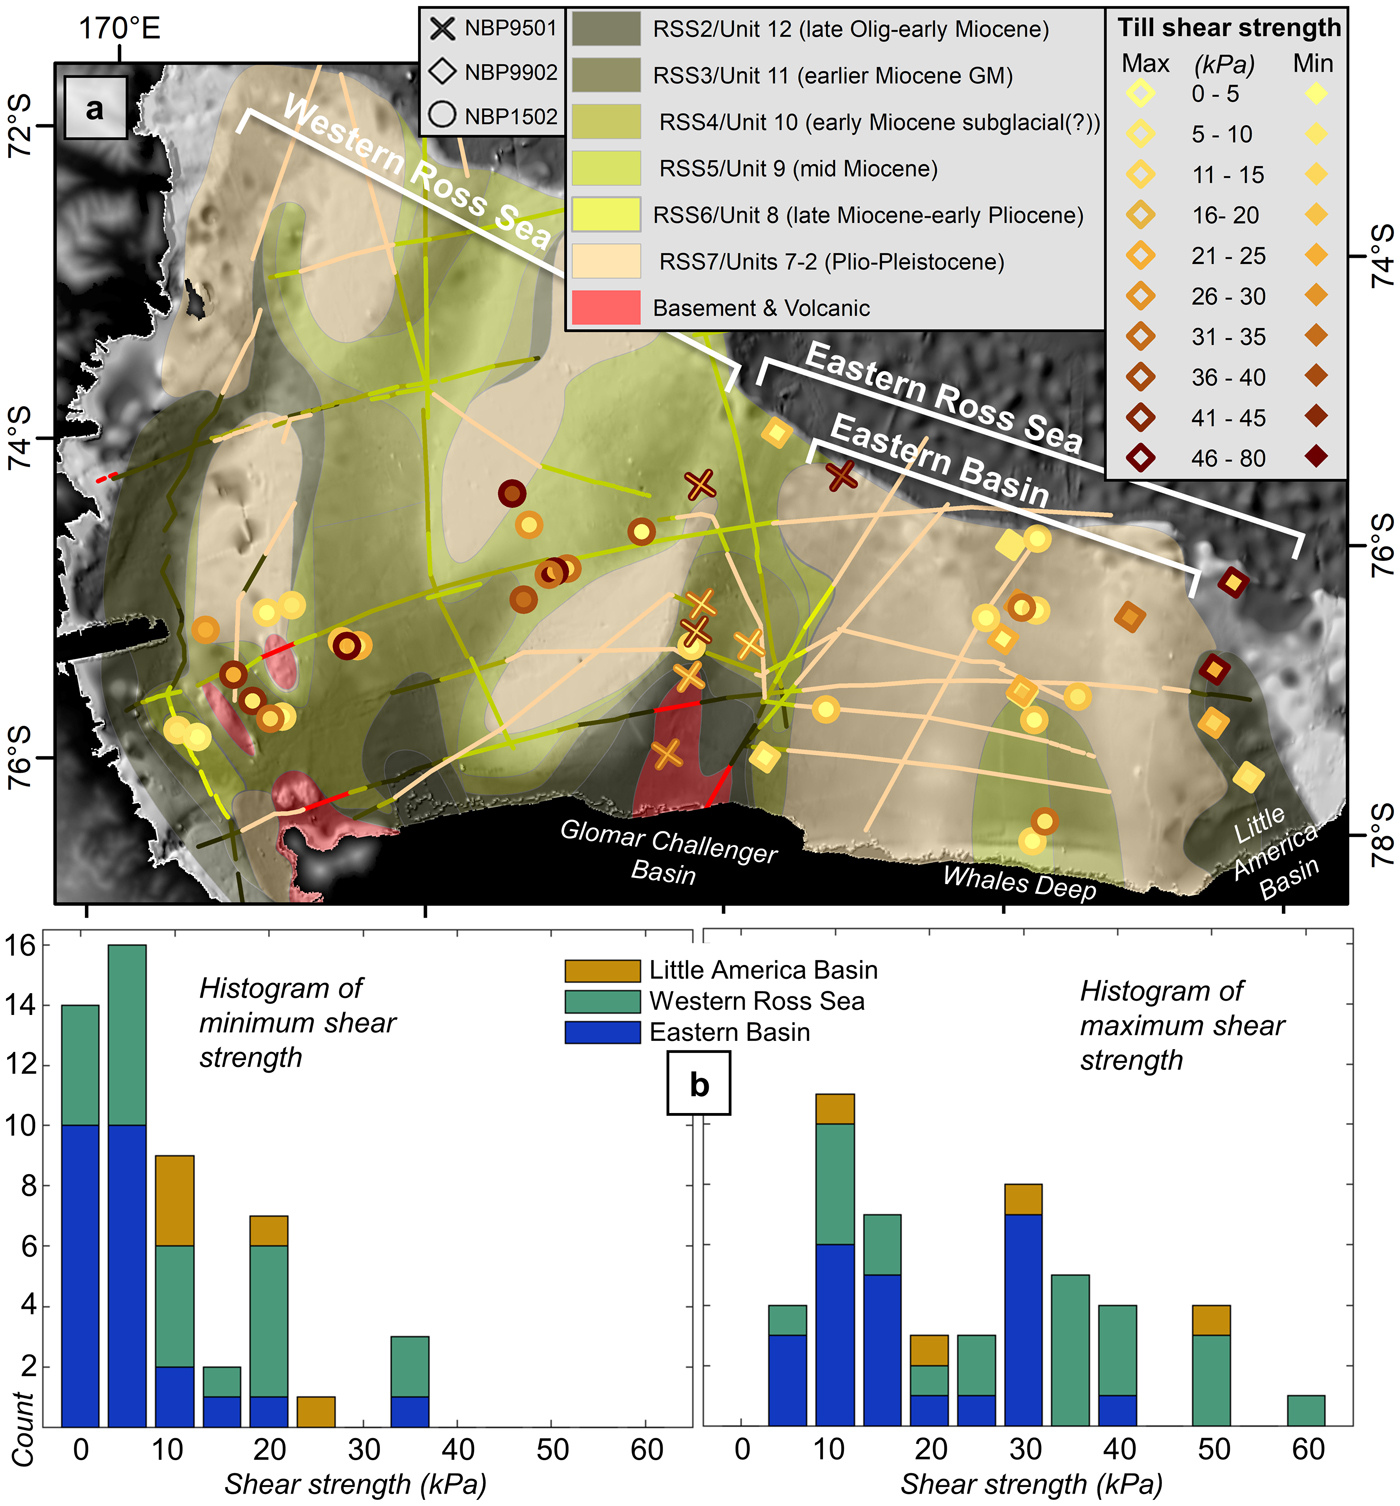
(a) Seafloor strata below the LGM unconformity were mapped by Halberstadt and others (Reference Halberstadt, Simkins, Greenwood and Anderson2016) from legacy seismic lines with interpreted seismic units (Anderson and Bartek, Reference Anderson, Bartek and Kennett1992; Brancolini and others, Reference Brancolini, Cooper, Coren, Cooper, Barker and Brancolini1995). Complex, older, and more consolidated strata outcrop in the western Ross Sea, with volcanic islands and seamounts in the southern region. Thick and unconsolidated Plio-Pleistocene strata fill most of the eastern Ross Sea, although the western side of Glomar Challenger Basin contains older and more variable geologic strata. On the other side of the eastern Ross Sea, lithified late Oligocene through Miocene deposits characterize the Little America Basin. Till shear strength variability is represented by minimum and maximum shear strength values for each till unit with greater than three measurements. (b) Minimum and maximum values are tabulated into histograms.
4.2. Spatial variability of till properties
As well as being homogeneous down-core, till properties are spatially consistent throughout the Ross Sea. Figure 6 shows grain size distributions for NBP1502 till units, and includes a comparison with a till sample collected from the actively deforming bed beneath the Whillans Ice Stream in West Antarctica (Begeman and others, Reference Begeman, Tulaczyk and Fisher2017), which flowed into Glomar Challenger Basin during the LGM (Bart and Owolana, Reference Bart and Owolana2012; Anderson and others, Reference Anderson2014). NBP1502 tills contain a peak in fine silt at ~10 µm, while the modern Whillans till is more poorly sorted; however, both the continental shelf samples and Whillans till share the same grain-size range. Thus, we interpret these data to demonstrate textural similarity based on their consistent grain-size range.
Particle size distributions for all NBP1502 tills display the same size range, demonstrating textural consistency. Each curve is an averaged particle size distribution from all measurements throughout the till unit. We attribute the grain-size differences to procedural and instrumental differences. Ross Sea tills collected on the continental shelf are compared with a sample of modern till near the Whillans Ice Stream grounding zone, from Begeman and others (Reference Begeman, Tulaczyk and Fisher2017).
Till water content in the eastern Ross Sea is more spatially uniform and slightly lower on average than in the western Ross Sea (Fig. 4c). The four low water content outliers (<15%) have high shear strengths and were sampled from a core collected on a bank top (NBP1502A KC22). Cores collected within or near channels do not display significantly different water contents.
Average shear strengths of each till unit vary considerably in the western Ross Sea and Little America Basin but are consistently low in the Eastern Basin (Fig. 7). Trough-by-trough differences are not observed from this dataset. Despite the difference in core acquisition methods between cruises, shear strength analyses show no appreciable difference between types of coring techniques or between cruises. The majority of NBP1502 cores were acquired with a gravity-based Kasten corer, which only penetrates the uppermost till unit, and presents a possible recovery bias towards tills that may have experienced more and/or longer periods of deformation.
(a) Average shear strength of each till unit is plotted according to cruise. (b) Average shear strength of each till unit is displayed as a histogram. (c) The down-core profile of shear strength, bulk density and water content for the bank core KC22 (NBP1502A) suggests possible compaction and dewatering.
Till properties are examined within the context of seafloor geology below the LGM unconformity, which could have influenced till grain size and local availability of sediment for incorporation into the deforming bed. In the Eastern Basin, cycles of glacial erosion and deposition have exposed older and well-consolidated strata on the inner shelf seafloor and deposited thick layers of younger (Plio-Pleistocene) unconsolidated sediments on the outer shelf (Fig. 5a, Anderson and Bartek, Reference Anderson, Bartek and Kennett1992; Alonso and others, Reference Alonso, Anderson, Diaz, Bartek and Elliot1992). While till shear strengths do not directly correlate to distinct geologic units, the Eastern Basin contains tills with generally lower shear strengths than tills in surrounding areas with older and more consolidated seafloor geology (Fig. 5a).
In the Ross Sea, an acoustic reflection underlies a field of lineations in Glomar Challenger Basin (Fig. 1a) and a few grounding zone wedges (Bart and others, Reference Bart, Krogmeier, Bart and Tulaczyk2017b), but this reflection is not observed continuously across the Ross Sea. Shipp and others (Reference Shipp, Anderson and Domack1999) interpret shallow sporadic acoustic reflectors as part of the erosional unconformity marking the advance of the LGM ice sheet. It is not known whether this unconformity is a soft-till/stiff-till boundary as found in other locations around the Antarctic margin (e.g., Ó Cofaigh and others, Reference Ó Cofaigh, Evans, Dowdeswell and Larter2007), or separates till from underlying older glacial or glacimarine sediments. The intermittent appearance of this reflection may, however, indicate a more local change in till deposition that can be explained by a regional glacial unconformity produced by ice advance.
4.3. Glacial landforms as indicators of subglacial conditions
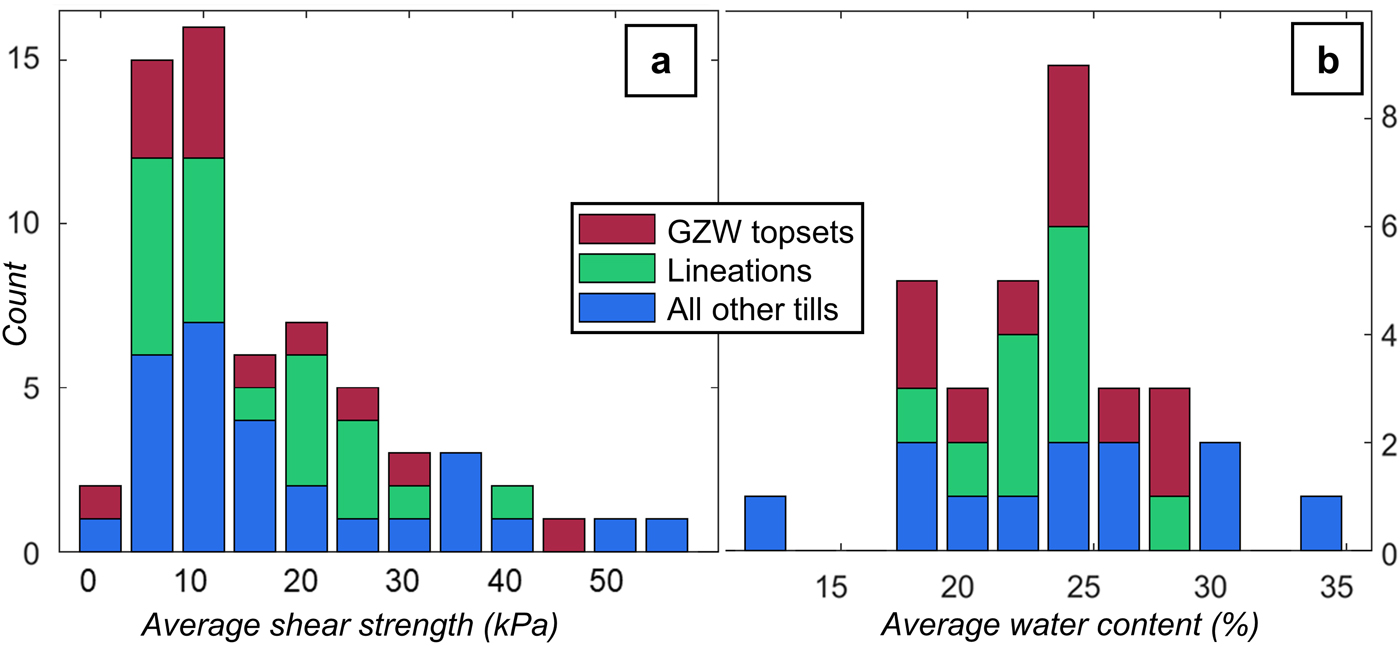
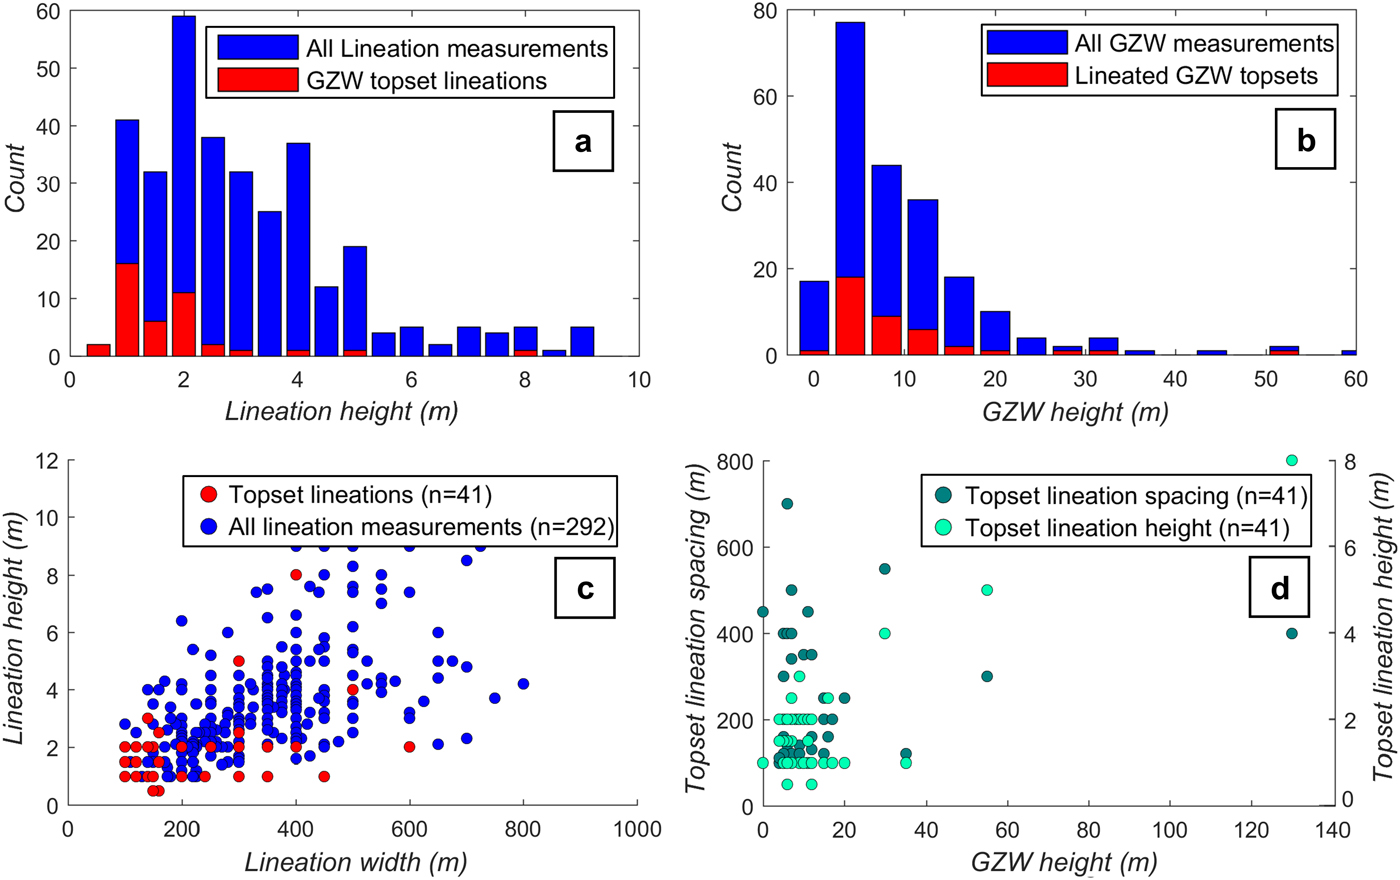
Till units were acquired from glacial lineations and grounding zone wedge topsets, as well as within or on the banks of subglacial channels. Glacial lineations and grounding zone wedges can provide a glimpse into the nature of the deforming bed at the time of landform construction. Cores selectively acquired from these landforms sampled tills that do not have significantly different shear strengths or water contents from tills collected elsewhere on the Ross Sea continental shelf (Fig. 8). We also measured grounding zone wedge height and glacial lineation width, amplitude and spacing to investigate whether morphological variability might reflect local changes in subglacial processes. Lineation amplitudes range from 1 to 9 m and widths are generally 100 times greater than the amplitude, ranging from 100 to 800 m. Lineation amplitudes do not display any significant trend across paleo-ice stream troughs (Fig. 9a), nor do shear strengths from sediment cores (Fig. 9b). Many grounding zone wedges in the Ross Sea exhibit lineations that extend across the wedge topset to the crest of the wedge (Fig. 1b). Almost all the lineations on grounding zone wedge topsets are small (amplitudes < 2m) compared compared with the entire set of lineation measurements (Figs 10a, c); however, the presence of topset lineations does not appear to correlate with wedge morphology, such as landform amplitude or width (Figs 10b, d). Generally, the tills near subglacial channels are not demonstrably different from the rest of the dataset, lacking clear lithologic evidence of dewatering associated with pore water syphoning into a channelized drainage system (e.g., Walder and Fowler, Reference Walder and Fowler1994).
Till samples collected from environments where subglacial deformation formed grounding zone wedges (GZWs) and glacial lineations do not display different properties from tills lacking clear geomorphic evidence for deformation. Till properties include (a) shear strength and (b) water content. Cores that sample lineations on grounding-zone wedge topsets are double-counted.
Neither lineation morphology nor the distribution of shear strength correlates with paleo-ice stream velocities, inferred to be fastest at the center of paleo-ice stream troughs. (a) Lineation peaks were auto-detected (following Simkins and others, Reference Simkins, Greenwood and Anderson2018) along a transect across Glomar Challenger Basin; transect location is shown in Figure 2. Lineation width and height does not display a clear trend across this trough. (b) Shear strength is not correlated with position in the Ross Sea paleo-ice stream troughs, where 0% refers to the center of the trough and 100% the outermost edge.

(a, c) Lineations on grounding zone wedge (GZW) topsets are among the smallest lineations measured, with amplitudes generally <2 m; lineations with amplitudes >2 m are likely furrows misinterpreted as lineations. (b, d) Grounding zone wedges with lineated topsets have a similar distribution of heights as the entire set of wedge measurements. The amplitude of topset lineations remains small, even on larger wedges.
5. DISCUSSION
5.1. Till grain size consistency and source
Ross Sea tills have a matrix that is finer than tills from offshore Wilkes Land, the Weddell Sea and the Antarctic Peninsula continental shelf (Anderson and others, Reference Anderson, Kurtz, Domack and Balshaw1980). This grain size character likely reflects the overall fine-grained nature of the recycled glacial sediments filling Ross Sea troughs and the relatively long ice stream runout distances from bedrock sources (Anderson, Reference Anderson1999). Despite variations in the upstream source material and a wide range of consolidation and age of underlying seafloor strata, till grain size is consistent across both the western and eastern Ross Sea (Fig. 6). Although the grain-size measurements shown in Figure 6 to some degree reflect differences in methodology, all NPB1502 till samples display a similar grain-size range and we thus interpret textural consistency. The modern Whillans till, collected ‘upstream’ of the Ross Sea tills in our dataset, is extremely poorly sorted; we assume this reflects the closer proximity of this till to its erosional source, restricting the distance across which the sediment can be reworked and sorted. Greater sorting of NBP1502 till samples may also result from incorporation of sorted marine sediments into the continental shelf tills (Anderson, Reference Anderson1999).
Tills across most of the Ross Sea retain geochemical signatures of upstream geological units (Licht and others, Reference Licht, Lederer and Swope2005, Reference Licht, Lederer, Farmer, Swope and Andrews2006, Reference Licht, Hennessy and Welke2014). Based on the observation of reworked microfossils, Ross Sea tills also incorporate older glacimarine deposits (e.g., Bart and others, Reference Bart, Sjunneskog and Chow2011; McGlannan and others, Reference McGlannan, Bart, Chow and DeCesare2017). These combined observations imply that tills are being sourced from upstream catchments with a considerable range in transport distance and local glacimarine deposits. Yet, the overall observed grain-size consistency of tills from across the Ross Sea suggests that subglacial processes, rather than the source material, are controlling till grain size and thus pore space and maximum water content. This observation suggests a common process of erosion and/or comminution, and sediment transport that involved significant sediment mixing.
5.2. Variability in till-forming processes
Despite textural homogeneity, till shear strength varies spatially across the Ross Sea. Average shear strength measurements form a continuum (Fig. 7b), rather than clustering into separate groups. Thus, Ross Sea tills cannot be categorized into discrete shear strength end-members (‘deformation till’ and ‘lodgement till’). This work adds to a growing body of literature moving away from this dichotomy, suggesting a range of simultaneous processes acting on the bed, such as lodgement, plowing, and shear deformation (e.g., Benn, Reference Benn1994; Evans and Twigg, Reference Evans and Twigg2002; Evans and others, Reference Evans, Phillips, Hiemstra and Auton2006; Piotrowski and others, Reference Piotrowski, Larsen, Menzies and Wysota2006, Livingstone and others, Reference Livingstone2016). We attribute our observations of both spatial and down-core shear strength variability to the corresponding variability in small-scale hydrologic processes, creating a mosaic of deforming and stable spots at the bed (e.g., Piotrowski and others, Reference Piotrowski, Larsen and Junge2004; Damsgaard and others, Reference Damsgaard2015). In low-permeability tills, sediment strengthening can occur as grains compact under applied stresses or through shear deformation that causes pore spaces to dilate (Iverson and others, Reference Iverson, Hooyer and Baker1998; Tulaczyk and others, Reference Tulaczyk, Kamb and Engelhardt2000; Iverson, Reference Iverson2010; Damsgaard and others, Reference Damsgaard2016). When meltwater is able to fill pore spaces, effective pressure approaches zero; stresses are not strongly translated into subglacial environments, and basal friction is reduced. However, the channelization of meltwater can dewater nearby sediments and increase basal friction (Schoof, Reference Schoof2010; Schroeder and others, Reference Schroeder, Blankenship and Young2013). We interpret transient deformation through time and space due to small-scale hydrologic variability; these fluctuations result in spatial and down-core shear strength variability in tills despite grain size consistency.
Although we describe the observed shear strength variability in paleo-ice stream troughs as a reflection of the availability and distribution of meltwater within an ice-bed mosaic of deforming and stable spots (replacing the ‘lodgement till’ versus ‘deformation till’ paradigm), sediment deposits on banks appear to resemble the classic ‘lodgement’ till. One bank-top core was acquired from Pennell Bank (KC22 from NBP1502A, Fig. 7a) where dispersive flow during the last glacial cycle (Shipp and others, Reference Shipp, Anderson and Domack1999; Halberstadt and others, Reference Halberstadt, Simkins, Greenwood and Anderson2016) was sluggish and, therefore, did not generate large-scale subglacial deformation. KC22 exhibits a sharp shear strength increase at the till upper boundary and some of the highest measured till shear strength values, a trend mirrored by the bulk density data and followed inversely by water content (Fig. 7c), suggesting consolidation and a lodgement-style formation. Two other bank-top cores (KC44 and KC45 from NBP1502A, Fig. 7a) were collected from Crary Bank, where geomorphic evidence for cross-bank ice flow (Greenwood and others, Reference Greenwood, Simkins, Halberstadt, Prothro and Anderson2018) suggests that subglacial deformation may have occurred. These tills record down-core variability and average shear strengths similar to the rest of the western Ross Sea, with water contents that only slightly decrease or do not change across the till upper boundary (although they do significantly decrease with depth; Fig. 5b). Although KC22 was our only fully analyzed ‘true’ bank till (our other bank-top cores were collected on older cruises with only a few shear strength measurements and no water content data), we suggest that bank tills may have a different depositional regime that can be identified from multiple sedimentologic measurements.
We interpret the maximum water content value from our dataset (~33%, Fig. 4a) to represent a threshold where till pore spaces are saturated. This is consistent with recent laboratory experiments on modern Whillans Ice Stream till samples that measure porosities of 28.1–31.8% (Leeman and others, Reference Leeman, Valdez, Alley, Anandakrishnan and Saffer2016), slightly lower than our pore-water-content threshold measured ‘downstream’ in the Ross Sea, although previous porosity measurements (40%, Tulaczyk and others, Reference Tulaczyk, Kamb and Engelhardt2001b) and seismically-inferred porosities (40%, Blankenship and others, Reference Blankenship, Bentley, Rooney and Alley1986; 37%, Luthra and others, Reference Luthra, Anandakrishnan, Winberry, Alley and Holschuh2016) are slightly higher.
5.3. Influence of regional ice flow behavior on till properties
Average shear strength is spatially variable, and regional trends emerge (Figs 5a, 7a) although differences in till properties between individual Ross Sea troughs are not observed. The western Ross Sea is characterized by high-relief banks and troughs, and experienced frequent small-scale grounding line retreat as the ice sheet back-stepped onto banks and seamounts. Geomorphic analysis suggests that the western Ross Sea experienced a complex deglacial history involving ice stream flow-switching (Greenwood and others, Reference Greenwood, Gyllencreutz, Jakobsson and Anderson2012, Reference Greenwood, Simkins, Halberstadt, Prothro and Anderson2018), meltwater production (Simkins and others, Reference Simkins2017) and likely ice stream stagnation which has been associated with till heterogeneity (Luthra and others, Reference Luthra2017). Conversely, the eastern Ross Sea has a more subdued topography, which imposed less topographic influence on ice flow. Large, isolated grounding zone wedges record rapid, large-scale grounding line retreat events that left behind well-preserved linear features (Mosola and Anderson, Reference Mosola and Anderson2006; Bart and Cone, Reference Bart and Cone2012; Bart and others, Reference Bart, Anderson and Nitsche2017a, Reference Bart, Krogmeier, Bart and Tulaczykb; Simkins and others, Reference Simkins, Greenwood and Anderson2018).
Regional shear strength trends broadly correspond to these differences in ice stream retreat behavior. In the Eastern Basin, where ice streams are inferred to have been low-profile and fast-flowing (Halberstadt and others, Reference Halberstadt, Simkins, Greenwood and Anderson2016), tills have low and homogeneous shear strengths (Fig 5a). We hypothesize that rapid retreat in the Eastern Basin generally preserved low-shear strength till, along with the pristine lineations at the seafloor. Conversely, more variable shear strengths in the western Ross Sea may reflect complex patterns of deglaciation inferred from a seafloor dominated by recessional geomorphic features (Simkins and others, Reference Simkins, Greenwood and Anderson2018). We further hypothesize that lower-shear strength till formed in the western Ross Sea under full glacial conditions, but was subsequently modified by slowly- or episodically-decoupling ice. Possible consolidation and dewatering could have left behind higher-shear strength tills. We invoke a similar explanation to describe the uniform water contents in the Eastern Basin; the more complex history of till formation in the western Ross Sea is consistent with more variable water contents in tills collected there (Fig. 4c). We suggest that efficient transport during long ice stream runout distances produces spatially homogeneous water contents, which were preserved in the eastern Ross Sea but modified in the western Ross Sea during complex retreat.
5.4. Influence of seafloor geology on till properties
Tills collected from regions of consolidated and older substrates in the western Ross Sea and Little America Basin generally have intervals of high shear strength, displaying significant spatial and down-core shear strength and water content complexity relative to tills of the Eastern Basin, which contains young, unconsolidated Plio-Pleistocene sediments (Fig. 5a; Hayes and Frakes, Reference Hayes and Frakes1975; Anderson and Bartek, Reference Anderson, Bartek and Kennett1992). Troughs on either side of the Eastern Basin are floored by older, Miocene-aged strata (Chow and Bart, Reference Chow and Bart2003; Bart, Reference Bart2004) but still contain fields of continuous linear features (Glomar Challenger Basin and Little America Basin). In Little America Basin, older seafloor strata may have influenced ice stream behavior: geomorphic evidence of ice flow over its eastern bank (yellow arrow, Fig. 2) implies that this paleo-ice stream was not able to drain all of the incoming ice (Halberstadt and others, Reference Halberstadt, Simkins, Greenwood and Anderson2016) and diverted ice into a neighboring trough. Because the Little America Basin ice stream flowed over older, more consolidated strata, it may not have been able to develop flow velocities as high as in the rest of the eastern Ross Sea, inferred from the stiffer tills in this area (Figs 5a, 7a). We suggest that till properties and seafloor geology are intimately interconnected with ice stream behavior and important for sediment availability, but we cannot establish a causal relationship based on this dataset.
5.5. Geomorphic indicators of subglacial processes
Consistently low shear strengths have previously been linked to a history of subglacial deformation (e.g., Benn and Evans, Reference Benn and Evans1996), but we observe no link between shear strength and subglacial deformation. Areas of bed deformation expressed by lineations and grounding zone wedges contain tills that are remarkably similar to areas without landforms associated with bed deformation (Fig. 8). Either most of the sampled tills experienced intense subglacial deformation comparable to lineation and grounding zone wedge formation, or deformation processes associated with different geomorphic environments do not necessarily dictate till properties at a currently observable scale.
Lineation morphology can also characterize the subglacial environment. Lineation elongation is thought to correlate with ice stream velocity; for example, the greatest lineation lengths correspond to fastest inferred paleo-ice stream velocities at the center of Marguerite Trough (Ó Cofaigh and others, Reference Ó Cofaigh, Pudsey, Dowdeswell and Morris2002; Livingstone and others, Reference Livingstone2016). Modeling experiments also suggest that lineation amplitude is correlated to ice stream velocity and basal shear stress (Jamieson and others, Reference Jamieson2016). We assess lineation amplitudes and spacing across each Ross Sea trough where continuous multibeam data are available (Fig. 9a, an example of trough transect), but find no trend in lineation morphology (Fig. 9a) nor till shear strength (Fig. 9b) across Ross Sea paleo-ice stream troughs. The eastern Ross Sea was characterized by many fast-flowing ice streams likely seamed together (e.g., Anderson and others, Reference Anderson2014), preventing the formation of significant shear margins, so we suggest that the difference between outer-trough and inner-trough flow velocities was not large enough to noticeably affect lineation morphology. Regardless of the mechanism, we find that neither lineation geometry nor shear strength distributions are reliable indicators of ice stream velocity in the complex Ross Sea.
Lineation amplitudes can vary across short distances throughout the Ross Sea, implying corresponding spatial variability in the thickness of the subglacial deforming layer. The western Ross Sea is characterized by hundreds of back-stepping moraines and grounding zone wedges of different size and spacing, also indicating variable rates of sediment delivery to the grounding line (Simkins and others, Reference Simkins, Greenwood and Anderson2018).
5.6. Grounding zone processes
Glacial landforms record the dynamics of the deforming layer at the point of ice-bed decoupling. The final stage of grounding zone wedge growth prior to decoupling is often marked by a single flowset of lineations that extends to the topset-foreset break. These overprinting lineations indicate that sediment deformation is occurring up to the wedge crest, at which point the ice fully decouples from a deforming bed. Although lineations not affiliated with grounding zone wedges elsewhere in the Ross Sea are up to 15 m in amplitude, these lineations are limited to 2 m or less in amplitude (Figs 10a, c) and formed over the same (or lesser) time as grounding zone wedge construction. These lineations do not scale with host grounding zone wedge size (Figs 10b, d), suggesting that neither occupation time nor sediment flux to the grounding line, both factors that likely dictate grounding zone wedge size, serve as the dominant control on lineation amplitude. This 2 m amplitude threshold may constrain the thickness of the deforming layer at the point of decoupling if we assume that lineation amplitude provides as a minimum estimate of till thickness. However, we recognize that lineation formation mechanisms are still disputed, and some theories hypothesize that lineation growth could exceed till thickness (e.g., instability theory; Fowler and Chapwanya, Reference Fowler and Chapwanya2014).
Sediment cores from grounding zone wedges were also examined for evidence of tidal processes at the grounding line. Till properties on grounding-zone wedges may be influenced by cyclical loading on the bed from tidal fluctuations (e.g. Bindschadler and others, Reference Bindschadler, King, Alley, Anandakrishnan and Padman2003), especially on a low-slope continental shelf, leading to till compaction and strengthening (Walker and others, Reference Walker2013). Ice-penetrating radar over the modern grounding zone at Whillans Ice Stream reveals a high-reflectivity zone extending a few km inland of the grounding line that has been attributed to tidal flexure and till compaction (Christianson and others, Reference Christianson2013, Reference Christianson2016). This zone of compacted till might, therefore, occur on grounding zone wedge topsets where we acquired till samples. However, wedge topset tills do not display any evidence of tidal flexural compaction, such as high shear strength and low water contents at the top of the till or throughout the unit. Likewise, we do not observe any sedimentary evidence for tidal current winnowing in upper till units on grounding zone wedges.
6. CONCLUSIONS
This study combines high-resolution bathymetric data with subsurface geophysical and sediment core data collected from the Ross Sea continental shelf. By integrating analyses of glacial landform morphology and till characteristics, we challenge commonly-accepted paradigms surrounding subglacial processes and till properties. Specific observations from this investigation include the following:
(1) The lack of discrete clusters of ‘deformation’ and ‘lodgement’ till end-members implies that paleo-ice stream trough beds hosted a transient mosaic of sediment deformation and stable spots, producing tills that represent an amalgamation of subglacial processes.
(2) The maximum till water content value from our Ross Sea dataset (33%) is interpreted as a saturation threshold. Additional meltwater input would lead to the evacuation of subglacial meltwater via water films and channelized meltwater drainage. Regions containing tills with water contents approaching this threshold may have hosted active meltwater systems during deglaciation.
(3) Regional till properties reflect deglacial and geological differences across the Ross Sea. In the Eastern Basin, ice streams flowing over unconsolidated Plio-Pleistocene sediments decoupled from the bed in large-scale rapid events, preserving pristine linear landforms and till with low and homogeneous shear strengths and consistent water contents. Conversely, western Ross Sea tills have highly variable shear strengths and water contents, reflecting the complex deglaciation of slowly and episodically-decoupling ice flowing over more consolidated and older seafloor substrates. Thus, till properties can record ice-sheet behavior at a regional scale.
(4) Analysis of geomorphic landforms reveals that low shear strengths are not linked to a history of intense deformation. Till properties of glacial lineations and grounding zone wedges are indistinguishable from tills elsewhere in the Ross Sea based on shear strength and water content. Measurements of glacial lineation morphology and till shear strength across paleo-ice stream troughs do not correspond to inferred fastest ice flow in the trough center. Neither lineation geometry nor shear strength distributions should be used to interpret Ross Sea subglacial deformation intensity or history.
(5) Spatial variability of lineation amplitudes across the Ross Sea reflects the corresponding variability in deforming processes at the sub-ice stream scale. Lineation amplitudes on grounding zone wedge topsets constrain the maximum deforming bed thickness to 2 m at the point where ice decouples from the bed at the grounding line. This bed thickness estimate can be used for evaluating sediment fluxes and understanding landform genesis.
This characterization of till properties and the paleo-deforming bed at a sub-ice stream scale sheds light on enigmatic subglacial processes and provides important context for the deforming bed beneath the modern ice sheet and glaciated continental shelves elsewhere.


 Open access