


As we described in Chapter 2, in the late 1980s and early 1990s, when scholars began to identify the concentration of crime at micro geographic places in cities, they naturally turned to opportunity theories of crime. Routine activities theory (Cohen and Felson, Reference Cohen and Felson1979; Felson and Cohen, Reference Felson and Cohen1980), situational crime prevention (Clarke, Reference Clarke1983, Reference Clarke1995), and crime pattern theory (Brantingham and Brantingham, Reference Brantingham and Brantingham1993, Reference Brantingham, Brantingham, Wortley and Mazerolle2013) all focused on the specific places where crime occurred and naturally lent themselves to the new approach of studying hot spots of crime. In contrast, the dominant community theories of the Chicago School and the renewed interest in community and crime that began to emerge in the 1980’s (Reiss and Tonry, Reference Reiss and Tonry1986) appeared to have little relevance for approaches that focused on specific places in communities. Consequently, early scholarship on crime and place paid little attention to traditional sociological perspectives which emphasized social structure and social context as a key to understanding crime problems.
In this chapter, we examine directly whether social structure and social context influence crime on street segments by building statistical models that examine their relationship to crime, while taking into account key elements of opportunities for crime at place. We use crime data from the last year of our study because, as we explain later, this allows us to develop models in which it is plausible to establish causality between our measures of social structure and social context and crime outcomes. Our findings reinforce the importance of including social structure and social context in understanding crime rates in places, while also confirming that opportunities for crime play a key part in producing crime at a micro geographic level.
4.1 Measuring Crime at Street Segments
In Chapter 1, we described our sampling of street segments, which was based on crime calls to the police in 2012. We used crime calls because we wanted to gain the broadest view of crime that was possible. Including citizen- and police-initiated calls to the police provided information on perceived citizen views of crime, as well as crime observed by the police while on patrol or while carrying out other duties. In our sample of streets, about 85 percent of crime calls were generated by citizens across the years of our study.
When using crime calls for service as a measure of crime outcomes on the streets in this chapter, we examine only citizen-initiated crime calls. Citizen-initiated calls tell us how people who live, work or are visiting the street, assess the crime problem. It reflects a community perspective on crime less filtered by the police (Koper et al., Reference Koper, Taylor, Liu and Wu2022; Lum et al., Reference Lum, Koper and Wu2022). At the same time, it is important to recognize that citizen calls to the police may over or underestimate actual crime occurring on the streets in our study. There are a number of studies for example, that identify underreporting of crime among disadvantaged minority groups and the poor (Desmond et al., Reference Desmond, Papachristos and Kirk2016). Prior studies also show that citizen attitudes toward the police will affect the likelihood that crimes will be reported by citizens (Sunshine and Tyler, Reference Sunshine and Tyler2003; Tyler and Jackson, Reference Tyler and Jackson2014). There has generally been found a positive relationship between perceptions of police legitimacy, for example, and the likelihood that a crime is reported (Kochel et al., Reference Kochel, Parks and Mastrofski2013; Kuen, Reference Kuen2024). A recent study suggests that policing strategies that use community policing approaches will lead to increased citizen reporting of crime (Weisburd, Wilson, et al., Reference Weisburd, Wilson, Gill, Kuen and Zastrow2024).
While citizen-initiated crime calls provide an important view of crime on our streets, it is important to recognize specific limitations of this measure of the crime problem. First, many of these crime calls to the police are not found to be crimes by the police after investigation, usually after a police car has been dispatched and the officers have spoken to witnesses or observed the events firsthand. Taylor et al. (Reference Taylor, Koper and Woods2011) explain that crime-related calls often report a higher number of events “mostly because these data represent an unfiltered account that might include behavior that is not criminal but is initially reported as criminal or incidents that cannot be verified” (p. 174). However, the absence of evidence may also reflect the police arriving too late to confirm the incident rather than proving that no crime took place. Weisburd et al., (Reference Weisburd, Uding, Kuen and Dong2024) recently found in Brooklyn Park, MN, that only 30% of citizen-initiated calls ended up being defined as crime incidents by the police. In our sample, about 20% of citizen-initiated crime calls in 2017 were eventually found to be crimes and resulted in official reports by the Baltimore City Police.Footnote 1 Despite these limitations of citizen-initiated calls to the police, Sherman et al. (Reference Sherman, Gartin and Buerger1989, p. 36) argue that “calls to the police provide the most extensive and faithful account of what the public tells the police about crime, with the specific errors and biases that that entails.”
As we noted in Chapter 1, most studies of hot spots of crime have utilized crime incident data for identifying crime rates at places (see Weisburd, Zastrow, et al., Reference Zastrow2024) because of data availability and because such data are often viewed as more accurate indicators of crime. Crime incidents are crimes that have been screened by the police (usually after a response by patrol officers to a crime call) and found to be crimes. In turn, the police provide a description of the type of crime based on their response or other type of investigation. This means that crime incidents screen out noncrime events that are mistakenly identified as crimes (e.g., suspicious persons on the street that turn out to be neighbors or calls for gunshots that turn out to be backfires from a car). At the same time, underreporting of crime and police incorrectly screening citizen-initiated crime events are important sources of bias in crime incident databases.
We think both measures have weaknesses but represent two potentially useful indicators of crime on our streets. Outside of victimization surveys which generally do not sample at the micro geographic level, crime calls and incidents remain the best official measures of the crime problem at crime hot spots (and non–hot spots). Citizen-initiated calls provide a view of crime that is generated primarily by citizens. Crime incidents provide a view of crime that represents both citizen- and police-initiated events while reflecting events through the eyes of the police in terms of what is defined as a crime, and how a crime is categorized. It is important to note in this regard that the two datasets are highly correlated in our study. The correlation (r) between citizen-initiated calls and crime incidents in 2017 was 0.73 in our sample of 447 streets.
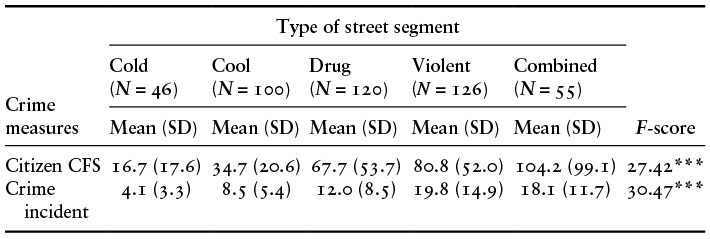
Table 4.1 shows the average number of citizen-initiated crime calls and crime incidents in 2017 by the type of street segment. As is apparent, the general trends observed in our selection year (2012) are reflected in these two measures. The highest call and incident numbers are found in the hot spots, and the lowest average crime calls and incidents are found in our cold spots. But it is notable that the overall averages of crime calls and incidents have declined for all of the street types for both calls and incidents during this period (see Chapter 1, Table 1.1). For crime calls, the decline reflects in part the exclusion of police-initiated calls, which accounted for 17% of the total calls on our streets in 2017, and also a general decline of about 20% in calls to the police in the city during that period. For the crime incident categories, this decline reflects, in particular, a 77% decline in the reported incidents for drug crime in the city overall between these two years. We suspect this decline was directly related to decriminalizing small amounts of marijuana in 2014 by the State of Maryland, and by the Baltimore City Council (Smith, Reference Smith2014 [2019]), and to reductions in proactive police activity, especially for minor crimes, after Freddy Gray (Vestal, Reference Vestal2025).
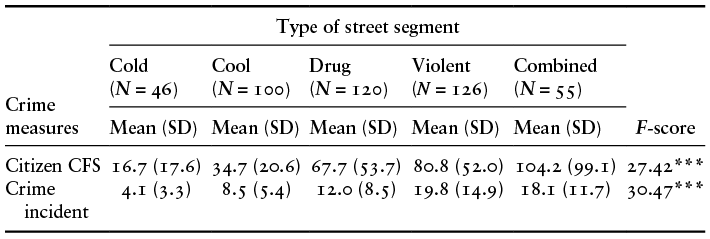
Note: Mean (SD) = 63.3 (59.6) for citizen-initiated CFS and Mean (SD) = 13.3 (11.6) for crime incident;
*** p < 0.001.
But we think it also important to recognize that our sampling on the highest crime streets in the selection year for crime hot spots, naturally led to what statisticians refer to as “regression to the mean,” or the natural tendency of very high numbers of events, in our case crime incidents and calls, to decline to lower levels. This is reflected in the fact that a number of street segments switched the categories we defined in creating our original sample. Using the original sampling approach, including citizen- and police-initiated calls, none of the cold spots identified in 2012 became hot spots as we define them – streets in the top 3 percent of drug or violent crime calls in the city – in 2017. But six of the 100 cool spots in 2012 could be defined as drug or violent crime hot spots in 2017.
There were 18 hot spots (out of 301 hot spots in the study) in 2012 when our study began that became cold spots in 2017. This is a dramatic change, going from the top 3 percent of streets for violence and/or drugs to a street with very little to no crime. Using our physical observation data and images provided by Google Earth, we attempted to identify what happened on these specific streets. In general, we noticed changes in dwelling units becoming vacant or vacant lots going under construction. In one case, a liquor store had closed. One of our sampled streets was particularly notable; centrally located near the Inner Harbor, just east of the city center, this street had 25 drug calls, 18 violent calls, and 139 other calls for service in 2012. When data collection began there was an old thirty-nine-bedroom, two-bath flop house, called the Victory House, located on the corner of the segment. In 2016, the building was condemned and shut down due to uninhabitable living conditions and was eventually demolished in 2017. In 2017, new construction of a ten-luxury unit apartment building began in place of the Victory House, and the neighborhood was described as one of Baltimore’s “trendiest” and up-and-coming neighborhoods. During that year, there was one call to the police for violence and zero calls for drug crimes. On another combined hot spot, a large housing project that made up one side of our street segment was demolished around 2017, and there were only three calls for service for violence and none for drugs in that year.
More than half (56%) of the hot spots in 2012 no longer met the 3% threshold for being hot in 2017. While the hot spots did not meet the 3% threshold for drugs or violence, many of these streets did not fall very far from that threshold. Roughly 60% of these hot spots in 2012 met a threshold of being in the top 5% in 2017 and 80% of the hot spots remained in the top 10% for drugs and/or violence.Footnote 2 The correlation between 2012 total crime calls and 2017 total crime calls at street segments is 0.58, which is considered a strong relationship (Cohen, Reference Cohen1988). Nonetheless, these data suggest that we should not overstate the stability of crime trends at micro geographic places over time (see Haberman, Reference Haberman2017). There is important variability in crime rates over time in our sample, and in the next sections we try to explain that variability using measures of social structure and social context, and opportunities for crime.
4.2 Explaining Crime Calls and Crime Incidents
In trying to identify the factors that explain crime in our sample we face two key methodological problems. The first is causal ordering. Can we establish that the variables that we define as influencing crime come before crime itself? In this case the longitudinal nature of our data provides an advantage over commonly used cross-sectional analyses. We can measure variables collected in the first wave of our study (2013/2014) to predict crime in wave 3 (2017) of our study. But even if crime in our analyses is constrained to come after the independent or predictor variables in our analyses, it may be that crime influenced those relationships prior to wave 1 of our study. This could cause us to overestimate the impacts of the independent variables we examine.
One way to address this issue is to look at change during the observation period, or what is sometimes called residualized change. In this case, our model asks whether the measurement of street characteristics in wave 1 influences the changes in crime rates at the street segments between wave 1 and wave 3. While there is no perfect solution to the causal problem in longitudinal data, this approach provides a strong ability to make causal statements in the absence of randomization for a single factor of interest (García et al., Reference García, Salmerón, García and García2020). At the same, there is generally a cost to statistical solutions such as these, and this example is no different. By looking only at change between waves 1 and 3, we are limiting the amount of variability we observe, and this influences our ability to observe significant effects in our models. There is simply less variability to explain in our model using a residualized change outcome than if we simply explained outcomes in one time period. Recognizing this, our significant findings below reflect the most important variables of interest, but our approach may to some extent limit our ability to observe more marginal influences on crime.
The second methodological problem is that social variables are highly correlated with one another, and therefore it is necessary to use multiple regression approaches to identify specific influences. The limitation here is that such models assume we have identified the key influences on crime. Any estimate we gain might be influenced by a factor that was not included. To address this problem, we include a large number of variables that have been identified as important in understanding crime rates at street segments. In this regard, we think that our data are unique in being able to cover the key theories that have been developed in this area. Such data are generally absent in studies of micro geographies because they are ordinarily unavailable at that level.
Finally, our sampling approach requires us to take into account that our street segments were “nested” within larger communities. To fail to address this issue would lead to overestimation of the statistical significance of our findings. We address this problem by using multilevel models, which account for the sampling design of our study.Footnote 3 The street segment corresponds with level 1 in the model – at this level we measure crime rates. We use community statistical areas or CSAs described in Chapter 3 to account for the clustering of street segments in communities. In formal terms, CSAs serves as the level 2 in our analysis.
We estimate two models for understanding crime at street segments. In the first, we seek to explain citizen-initiated crime calls in 2017. In the second model, we examine crime incidents in 2017 as the outcome. We account for the clustering of street segments within communities through a random effect for community statistical areas.Footnote 4 Since the dependent variables are calls for service or crime incident counts and these counts are typically over-dispersed, multilevel negative binomial regression models are used (Weisburd, Wilson, et al., Reference Weisburd, Wilson, Wooditch and Britt2022).Footnote 5
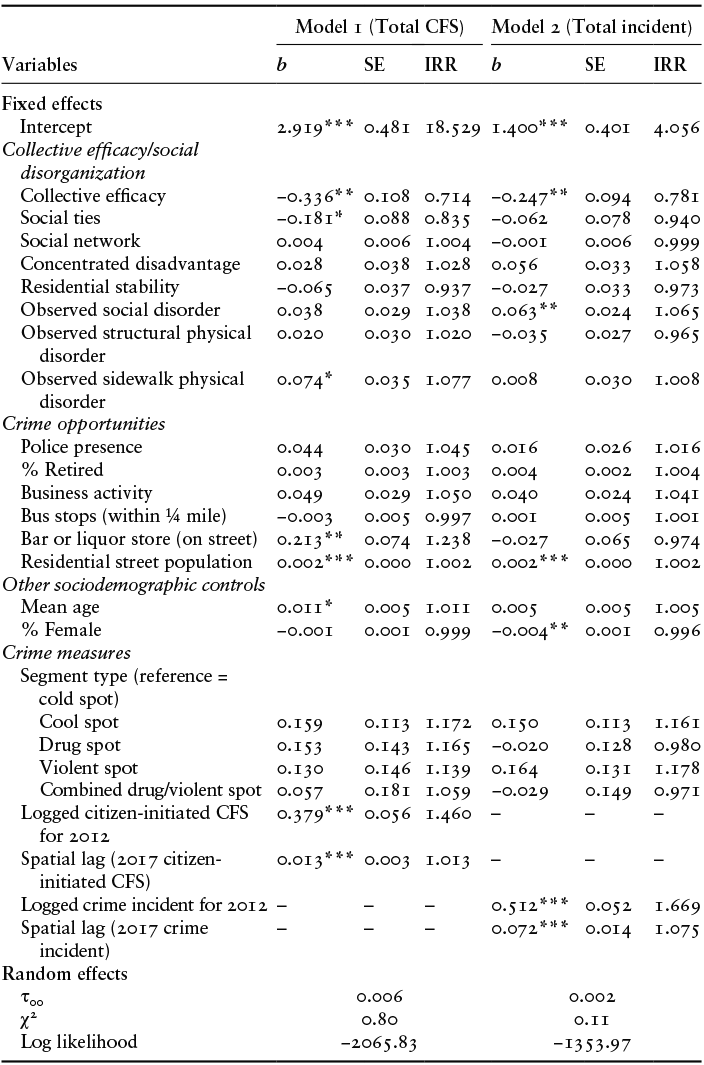
We report both the regression coefficients in these models as well as the Incidence Rate Ratio (IRR) (see Table 4.3). The IRR provides an intuitive measure of effect size, representing the proportional change in the rate of the dependent variable associated with a one-unit change in the independent variable. For example, an IRR of 1.25 indicates that a one-unit increase in that variable is expected to result in a 25 percent increase in the rate of crime, holding all other variables constant.
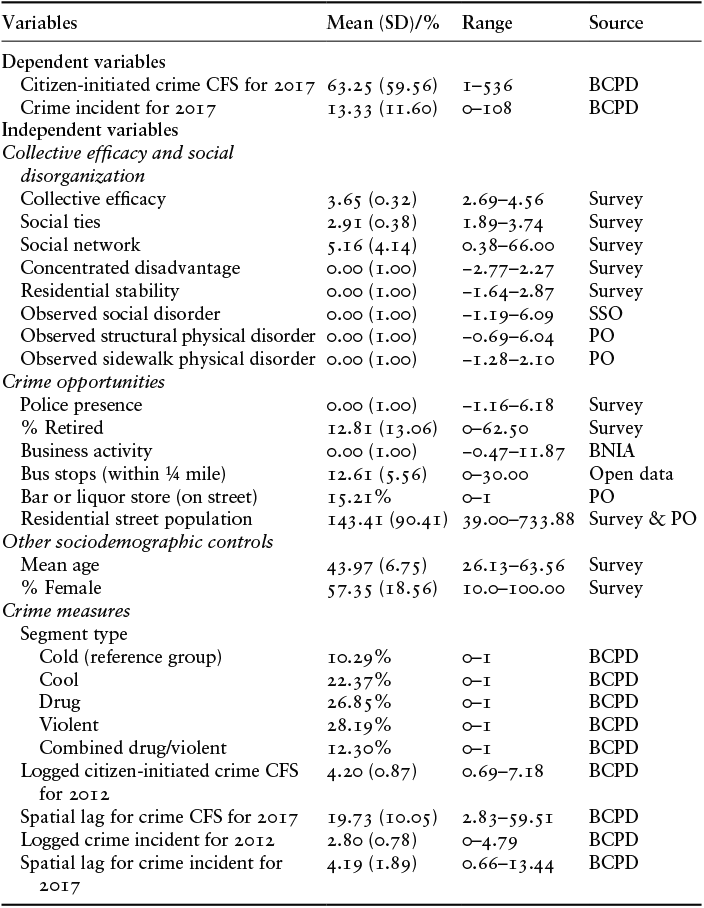
The models estimated below use a series of independent variables to explain these crime levels. The variables are all measured in wave 1 of our survey because we want as much as possible to keep a causal ordering to our models. We are most interested in variables of social structure and social context, but nonetheless, it is important to account for other measures of the street environment, especially of opportunity features of places, as control variables, to make sure that measures of social structure and social context remain salient after accounting for other possible explanations of crime changes. Table 4.2 includes basic descriptive information on the dependent and independent variables in our models (see Table A2.1 for factor analysis results of composite variables).Footnote 6
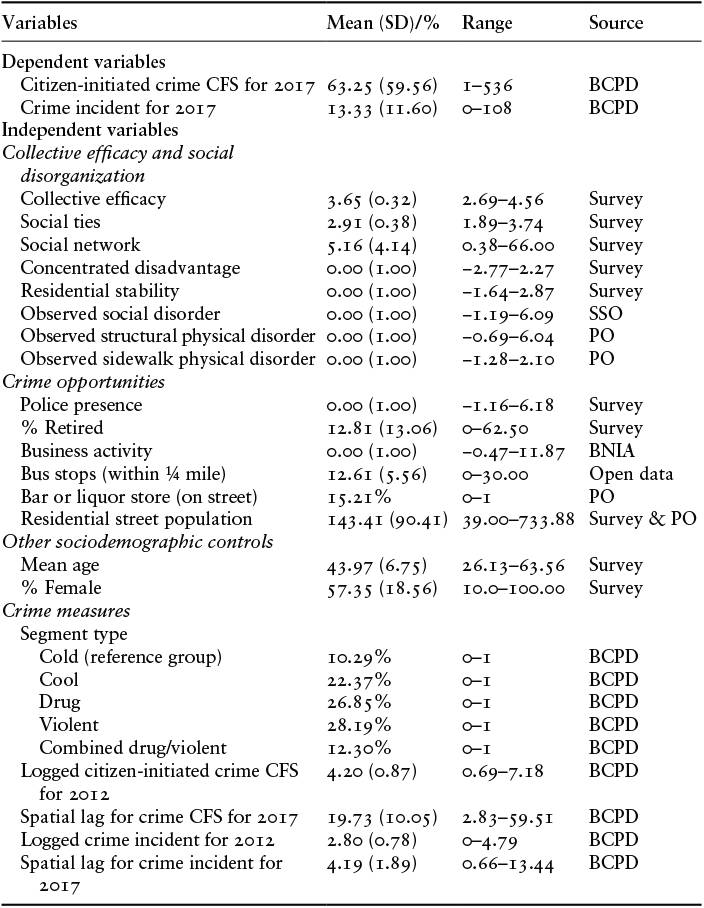
Note: N = 447; BCPD = Baltimore City Police Department; BNIA = Baltimore Neighborhood Indicators Alliance; SSO = systematic social observation; PO = physical observation.
4.3 Measures
4.3.1 Measures of Social Structure and Social Context
In previous chapters we described in detail our main measures of social structure and social context, and why they have been seen as indicators of social disorganization in communities. We have also discussed how social disorganization theory expects these measures to predict crime in communities. Accordingly, we include in our models our measure of informal social control (collective efficacy), which has been found in previous chapters to vary significantly across the different types of places in our study. We include as well, other measures described in Chapter 2 that reflect structural variables that are indicators of social disorganization and low informal social control, including concentrated disadvantage and residential stability.Footnote 7 Our measures of social ties and social networks among residents are also included in the models. These variables are all seen as causes of crime in social disorganization theory (e.g., see Sampson and Groves, Reference Sampson and Groves1989). Additionally, we include three measures associated with broken windows theory (Wilson and Kelling, Reference Wilson and Kelling1982) described in Chapter 2 that are commonly seen as reflecting social disorganization in communities, though we have measured them at the street-segment level: observed social disorder, observed structural physical disorder, and observed sidewalk physical disorder.Footnote 8 These measures are all considered to be related to crime levels, and we examine them here to assess their influence on crime at street segments.
4.3.2 Measures of Opportunities for Crime
A key opportunity feature for understanding counts of crime on a street is residential street population. Simply stated, if a street has more residents, there is a greater opportunity for crime and victimization. It is often true that researchers will calculate a crime rate by dividing the number of crimes by the resident population. However, we think that residential street population is a characteristic of a street that creates more opportunities for crime, particularly through the presence of more potential offenders and suitable targets on a street (Felson, Reference Felson, Figlio, Hakim and Rengert1986) and accordingly should be measured as a variable that explains crime rates rather than a part of the crime rate itself (see Weisburd et al., Reference Weisburd, Groff and Yang2014; Weisburd, White, et al., Reference Weisburd, White, Wire and Wilson2021). We estimate residential population based on survey findings in wave 1 of our study.Footnote 9 Estimates of the street-level population have been found to be the single most important predictor of crime outcomes at micro geographic places in prior studies (Felson, Reference Felson, Figlio, Hakim and Rengert1986; Weisburd et al., Reference Weisburd, Groff and Yang2014).
We also include the percent of people retired on the street. Routine activities theory has generally seen household members who spend more time at home, such as retired people, as potential guardians on the street (Cohen and Felson, Reference Cohen and Felson1979; Garfalo and Clark, Reference Garofalo and Clark1992; Lynch and Cantor, Reference Lynch and Cantor1992). However, the percent of retired people also might influence perceptions of the presence of “suitable targets” that are found on the street as retired individuals are more likely to live alone and be seen as weak or “easy targets” (Hirschel and Rubin, Reference Hirschel and Rubin1982; Kennedy and Silverman, Reference Kennedy and Silverman1990; Nelsen and Huff-Corzine, Reference Nelsen and Huff-Corzine1998).
Opportunity theories of crime at place generally focus on the extent to which characteristics of streets are “crime attractors” or “crime generators” (Brantingham and Brantingham, Reference Brantingham and Brantingham1995). Crime generators are places that include large numbers of potential victims and offenders. Crime attractors are places that have specific types of criminal opportunities that are known to potential offenders. In practice, many locations serve as both crime attractors and crime generators – for example, transportation nodes, which bring together large numbers of potential victims and offenders, and offer specific place-based crime opportunities for robberies or related crimes.
Commercial activity has long been viewed as an important crime attractor (Groff and Lockwood, Reference Groff and Lockwood2014; McCord and Ratcliffe, Reference McCord and Ratcliffe2009; Weisburd et al., Reference Weisburd, Groff and Yang2014). We purchased from the Baltimore Neighborhood Indicators Alliance business data for our 449 street segments for the year 2013; and we combined two measures to capture business activity – the number of businesses on the street and the number of employees associated with these businesses (eigenvalue = 1.80, factor loadings >0.95; see Table A2.1).
The number of bus stops is also considered an important facilitator for encouraging the convergence of victims and offenders (Irvin-Erickson and La Vigne, Reference Irvin-Erickson and La Vigne2015). Locations of bus stops were obtained from the state of Maryland’s city data files and used to create a measure of the number of bus stops (within ¼ mile) of the street. Another important crime attractor in prior studies has been the presence of bars or liquor stores (Roman et al., Reference Roman, Reid, Bhati and Tereshchenko2008). We used our physical observations to identify streets that had either type of crime attractor (coded dichotomously, 1 = yes; 0 = no).
Finally, we include observed police presence as an indicator of capable guardianship on the street segments. To create a measure of police presence, we used a factor score developed from two measures from the survey that asked the respondents the number of police cars they see driving on their block on an average day and how often they see police walking on their block – “everyday,” “a few times a week,” “a few times a month,” or “less than once a month” (Bradford et al., Reference Bradford, Jackson and Stanko2009). The two measures at the street-level loaded on a single factor (eigenvalue = 1.43; factor loadings >0.85). But we think it is important to note that this measure reflects citizen awareness of police presence, not the actual levels of police presence on the streets we study.
4.3.3 Crime Measures
Based on the original design of the study, we also accounted for the street segment type from the original sampling frame, with cold streets serving as the reference category.Footnote 10 To examine the effect of independent variables on residualized change in crime from 2012 to 2017, we included logged citizen-initiated calls for 2012 and logged crime incidents for 2012 in the respective models. In both cases, we apply a logarithmic transformation to the measures due to the highly skewed counts in the data. At the same time, we recognize that the inclusion of logged crime in 2012 and the hot spot type from our sampling of streets in 2012 creates potential multicollinearity in the models. Accordingly, we ran reduced models without the type of hot spot indicator as well. The results were very similar to those we report later (see Table A4.2). We account for potential area effects of crime in 2017 by including a spatial lag term at ¼ mile for both citizen-initiated crime calls and crime incidents.Footnote 11 The spatial lag term acknowledges directly that the relationships observed at street segments may be affected by the crime levels in the area surrounding a street segment.Footnote 12
4.3.4 Other Measures
We also include two other sociodemographic variables, mean age of respondents on the street and percent female respondents. It is important to recognize that these indicators confound actual rates of these traits on the street with the specific characteristics of respondents we were able to interview. As indicated in Table 4.2 the sample is 57 percent female, and the average age of respondents in our survey in wave 1 was 44 years (SD = 6.75).
4.4 Findings
The results from our analyses are provided in Table 4.3. Looking first at our model of citizen-initiated calls to the police (Model 1), we find collective efficacy to be a strong and highly significant variable (p < 0.01) in understanding variation in citizen-initiated crime calls across the street segments. A one-unit increase in collective efficacy (which ranges between 2.69 and 4.56 among street segments) is predicted to lead to about 30 percent reduction in crime calls (IRR = 0.71). This suggests that informal social control is a key factor in understanding crime rates at street segments, after accounting for opportunity and other measures in our model. Social ties in this model is also a significant variable (p < 0.05), where a one-unit increase in social ties (which range between 1.89 and 3.74) is associated with a 16.5 percent decrease in calls for service. Neither concentrated disadvantage nor residential stability were statistically significant, but given our conservative use of a residualized model, we note that residential stability is marginally significant (p = 0.074) with higher residential stability related to lower crime rates. Observed social disorder and observed structural physical disorder measures were not significant in predicting calls for service, though in each case more disorder is related to more crime in the sample. However, observed sidewalk physical disorder (which ranges from −1.28 to 2.10) significantly predicted citizen-initiated crime calls (p < 0.05), with a one-unit increase corresponding to a 7.7 percent increase in crime calls.
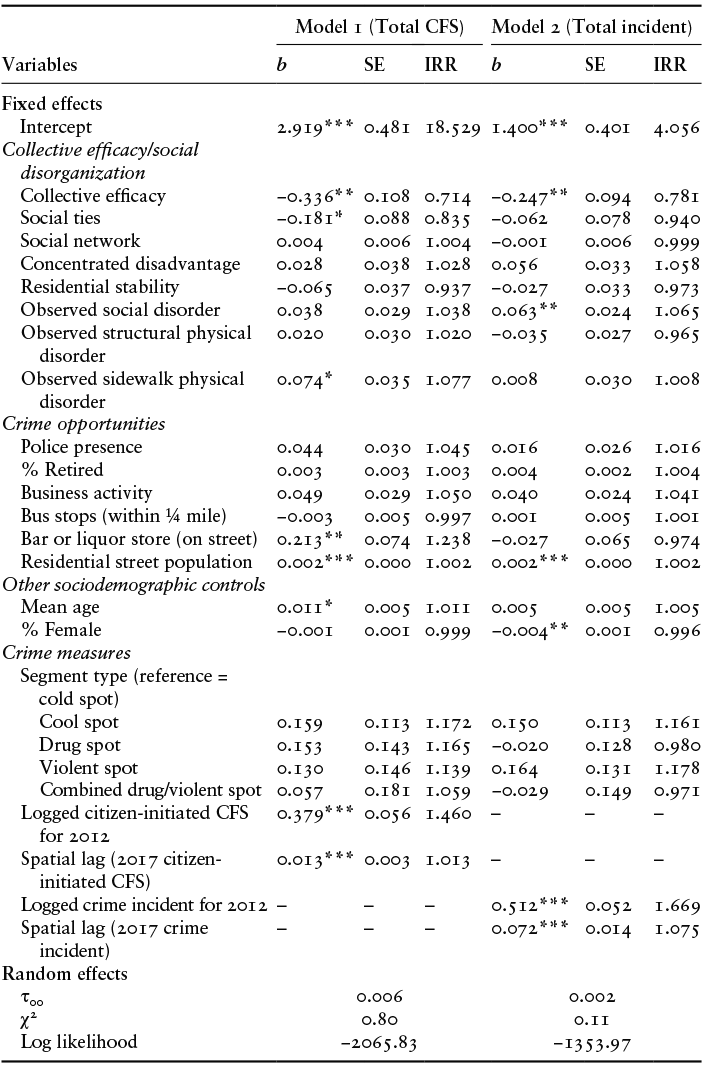
Note: N = 447; Incidence Rate Ratio (IRR) = exp(b);
* p < 0.05, **p < 0.01, ***p < 0.001.
Of the opportunity measures, two achieve statistical significance at conventional levels in our model of citizen-initiated calls to the police: street population (p < 0.001) and the presence of a bar or liquor store (p < 0.01). In the case of a bar or liquor store, the presence of one of these crime attractors, is associated with a 23.8% increase in the level of calls for service on the street. In the case of population on the street, a one person increase in population, is predicted to increase crime by 0.2%. This does not seem at first glance to be a large impact but given that the estimated populations on the streets vary between 39 and 734, there is a great deal of potential for street population to increase crime rates. The business activity factor is positively related to crime calls and is marginally significant (p = 0.088).
As expected, the logged citizen-initiated call counts for 2012 have a highly significant (p < 0.001) and strong impact on citizen reported crime calls in 2017. For a one-unit change in the natural log of the independent variable, there is a 46% increase in citizen-initiated calls for service in 2017. To make this easier to understand, a 100% increase (or doubling) in the call counts in 2012 corresponds to an almost 46% increase in citizen-initiated crime calls in 2017. There is also a strong and significant (p < 0.001) relationship between crime calls on streets near our sample streets and crime call counts in 2017. The higher the average level for crime calls nearby our sampled streets (in 2017), the higher the level of crime calls on the street. This suggests the importance of including a spatial lag term in our model.
We do not find our sampling definition of street type in 2012 to have a significant impact on crime calls in our model, according to the Wald test (p = 0.476). However, when we exclude logged citizen-initiated calls in 2012, type of street is statistically significant (p < 0.001), suggesting they are measuring somewhat similar constructs (see Table A4.2). We decided to still include the street type measure in our final model to account for our sampling design (Winship and Radbill, Reference Winship and Radbill1994). Mean age of people surveyed is statistically significant in this model (p < 0.05) with a one-year increase in average age for respondents leading to a 1 percent increase in crime calls. Lastly, the proportion of women in our street samples did not have a significant impact on crime.
Turning to the crime incident model (see Model 2), we again find that collective efficacy has a strong and significant (p < 0.01) impact on crime. In this case, a one-unit increase in collective efficacy predicts a 22.0 percent decrease in crime. Concentrated disadvantage does not meet the conventional 0.05 significance threshold, but it is in the expected direction and marginally significant (p = 0.092). Observed social disorder is also statistically significant in this model (p < 0.01) and has almost twice as large an impact on crime as in the citizen-initiated call model. In this case, a one-unit increase in social disorder (which varies between −1.19 and 6.09 among our street sample) leads to a 6.5 percent increase in crime. The influence of observed physical disorder, both structural and sidewalk, is small and not statistically significant.
Residential street population again has a very strong and significant impact in this model (p < 0.001). Its impact is similar to what we observed in the citizen-initiated call model. In this case, a bar or liquor store is not significantly related to crime. Of the other opportunity measures, none have a significant impact at the conventional 0.05 level, however two variables, percent retired (p = 0.084) and business activity, evidence marginal significance levels (p = 0.096). Business activity is in the expected direction with more business activity leading to more crime. A higher percent of retirees is related to more crime, perhaps reflecting, as noted earlier, their potential for victimization rather than their participation in guardianship. Because these results do not reach traditional significance levels, we note them, but do not want to make strong arguments about them.
In this model, logged crime incident counts in 2012 also have a very large and statistically significant impact on crime incidents in 2017 (p < 0.001). A one-unit increase in the logged crime incidents in 2012 leads to a larger increase in crime in this model, roughly 67%. Put simply, a 100% increase in the crime incident counts in 2012 corresponds to a 67% increase in crime incidents in 2017. According to the Wald test, street segment type did not significantly predict crime incidents in 2017 (p = 0.467); however, when excluding the logged crime incident in 2012, street type became statistically significant (p < 0.001), again suggesting that these variables measure somewhat similar constructs (see Table A4.2). The spatial lag term is again statistically significant (p < 0.001) and its effect is somewhat larger than in the citizen-initiated call model.Footnote 13 In this model, the mean age of the respondents is not statistically significant. However, gender is statistically significant (p < 0.01), with a 1% increase in the proportion of women on a street segment predicted to lead to about a 0.4% decrease in crime incidents.
4.5 What Our Results Mean
4.5.1 The Importance of Social Structure and Social Context in Understanding Crime at Street Segments
The most important findings of our analyses pertain to the salience of social structure and social context in understanding crime rates at street segments. Our most direct measure of informal social control, collective efficacy, has a very strong and significant impact on crime when explaining citizen-initiated crime calls for service to the police or crime incidents, even after accounting for key opportunity measures. And the strength of the impact of collective efficacy is very similar in both models, suggesting that it is important in explaining both citizen assessments of crime on the street, and official police reporting of crime. Contrary to assumptions among place-based scholars that traditional social disorganization theories are not relevant to explaining crime at the micro geographic level, our data suggest strong and significant effects on both of our measures of crime at the street-segment level. Braga and Clarke (Reference Braga and Clarke2014), as we noted earlier, argue in critiquing the position that social disorganization is important to understanding crime at place, that “(i)t is always dangerous to extend the application of theory (in this case, collective efficacy) beyond its intended domain (in this case, neighborhoods)” (p. 489). We think our data contradict this view, and provide strong evidence that informal social control, measured as collective efficacy, is as important at the street-segment level in understanding crime, as it is in communities (Armstrong et al., Reference Armstrong, Katz and Schnebly2015; Mazerolle et al., Reference Mazerolle, Wickes and McBroom2010; Morenoff et al., Reference Morenoff, Sampson and Raudenbush2001; Sampson et al., Reference Sampson, Raudenbush and Earls1997).
At the same time, we think it is important to recognize that the boundaries between social disorganization theory and opportunity theory are not always clear. Stronger informal social control on the street encourages guardianship and can result in reduced opportunities for crime on the street as people engage in activities to prevent crime. In turn, the police and other formal guardians cannot be a substitute for the guardianship that ordinary citizens exercise that discourages crime and disorder (Wilson and Kelling, Reference Wilson and Kelling1982). Formal guardians like the police cannot be everywhere, and citizens who have “eyes on the street” (Jacobs, Reference Jacobs1961) can play an important role in preventing crime. But this informal social control can also be seen simply as increasing capable guardianship as described in opportunity theories.
Braga and Clarke (Reference Braga and Clarke2014) make this point in regard to the collective activities of business owners on nonresidential streets:
At the micro place level, it may be more appropriate to articulate the potential for informal social control by the more straightforward concepts of guardianship and effective place management drawn from opportunity theories of crime. This is especially true of hot spots located on nonresidential streets. In Boston, only 1 percent of the city’s street segments and intersections experienced 50 percent of the total number of commercial robberies between 1980 and 2008 (Braga, Hureau, and Papachristos, Reference Braga, Hureau and Papachristos2011). These chronic commercial robbery hot spots were often nonresidential business strips located on major thoroughfares that facilitated easy access to customers. Business strips may have few residents, if any, but the level of robbery could be powerfully influenced by individual and collective action of business owners on the street. For instance, Business Improvement Districts are local private–public organizations that take monetary assessments from business owners and make investments by place promotion, street cleaning, and public safety. Key crime control activities involve the abatement of physical disorder and improved guardianship of the business area by nonpolice security guards. BIDs have been found to be effective in reducing crime in small areas
We think that Braga and Clarke’s description of informal social control in opportunity theories of crime makes clear why our contribution is adding new knowledge to our understanding of crime at the micro geographic level. Collective efficacy is not defining the ways in which place management is carried out on the street by nonpolice agents (Linning and Eck, Reference Linning and Eck2021; Eck and Madensen-Herold, Reference Eck, Madensen-Herold, Nagin, Cullen and Jonson2018), or even the specific activities carried out by residents or business owners on a street. Rather, it tells us something about the overall potential level of informal social control that can be found on that street.
Informal social control in this context is different from immediate acts to prevent crime on a street. Higher levels of informal social control can lead to action, which in turn, may be directed to reduce opportunities for crime. But informal social control that provides the foundation and possibility for collective action is different from activities to reduce opportunities for the immediate prevention of crime. It pushes us to consider the perceptions of informal social control among residents of a street, rather than the actions that they take. Higher levels of informal social control might lead to efforts at target hardening, organizing with neighbors to gain help from the city to improve the street, or even private efforts by citizens to keep “eyes on the street.” It may lead residents to engage the police to become more involved in solving crime problems on their street as well. More generally, we think it is important for criminologists to recognize the importance of informal social control, as distinct from the immediate situational interventions for opportunity reduction on a street. Informal social control may lead residents to engage in situational prevention efforts, or even the introduction of capable guardians such as private security. But informal social control is about the increased cohesion and willingness to intervene that may lead to those outcomes.
Our models show informal social control is weaker on hot spot street segments, and this is also reflected in our qualitative data. A number of residents on hot spots streets did not like their neighbors. Many were fearful, kept to themselves, and did not look out for others. When asked about relationships with neighbors, a female resident of a drug hot spot said, “I don’t want to know people who trade drugs or hold illegal weapons,” referring to the neighbors on the street. A different resident on this drug hot spot also said, “if people don’t care about the cleanness of the area, then I too won’t care about it.” On a violent hot spot, a resident said, “there’s a lot of problems and that people are scared in Baltimore – scared of each other.”
In prior chapters, we provided quantitative evidence of lower informal social control on hot spot streets. At the same time, we have already emphasized in prior chapters that just because informal social control is weaker on hot spots streets does not mean that it is not nonexistent. In Chapter 2, we saw that levels of informal social control could be meaningful on hot spot streets despite the relative deprivation of those levels as compared to non–hot spots. One resident of a crime hot spot told us, “I stay at home taking care of my kids and sometimes the neighbors’ kids, helping neighbors out with housework and lawn care, and helping people out with other things they needed as well.” At the same time, she said, “if I could change something in the neighborhood, it would be to reopen the recreation centers that closed and have more block parties and things for people to do together.” She was not sure if the people in her neighborhood would want to or if they would be up for it, but she said, “I would like to see that again.”
This interview also reflected the importance of social ties in the production of crime, a significant variable in our model of citizen-initiated calls, and the fact that such ties “take time” to develop (Sampson et al., Reference Sampson, Raudenbush and Earls1997). She noted that “people used to look out for each other, but as new people moved in, they wanted nothing to do with their neighbors.” She further described a time when she went to introduce herself to her neighbors when they moved in to offer to help, and she said, “they looked at me funny.” Reflecting our earlier observation that social ties were not necessarily stronger on non–hot spot streets, residents we spoke to on one non–hot spot segment shared similar experiences – they did not know most of their neighbors besides the older lady who lived next to them. They liked the area, though “there isn’t a lot of social activity and people mainly keep to themselves.”
Social ties have a significant impact on citizen-initiated calls to the police, but little or no impact on crime incidents. We suspect that this difference develops from the fact that our call measure is one generated by residents, and without investigation by the police. When neighbors frequently chat, visit, and help each other, they can exchange information, provide assistance, and defuse minor issues before they escalate into situations that would otherwise prompt a call. In this way, supportive ties act as a buffer: people turn to trusted neighbors for advice or help instead of resorting to external authorities. Consequently, stronger social connections can lower the likelihood that residents initiate police contact, even if they do not necessarily affect the number of crime incidents officially recorded by the police on a street.
While we find that concentrated disadvantage is only marginally significant in predicting crime incidents, it has long been seen as an important factor in understanding crime in neighborhoods both directly (Mazerolle et al., Reference Mazerolle, Wickes and McBroom2010; Kubrin and Hipp, Reference Kubrin and Hipp2025; Wickes and Hipp, Reference Wickes and Hipp2018) and through its impacts on levels of collective efficacy (Sampson, Reference Sampson2012; Sampson et al., Reference Sampson, Raudenbush and Earls1997; Wickes and Lanfear, Reference Wickes, Lanfear, Oberwittler and Wickes2025). Our interviewees noted the impact of high disadvantage and the corresponding lack of opportunities for young people on a street segment. In a drug hot spot, one man explained to us that “drugs are done by younger generations in this area, on a large scale, and I blame the government for not doing enough to protect those kids from being drawn to drugs.” He went on to say, “(t)here are no recreational facilities or a swimming pool or a library for those kids to spend their time at, so they will have to find another way.” On another drug hot spot, a young female resident talked of the lack of opportunities for young people and the attractions of drug dealing for getting ahead. She noted that “for kids it was tempting to get into drugs and other activity because they see drug dealers living the life, while their parents and others struggle, and it seems easy to do drugs and make good money. Without anyone to tell them differently or any role models, they’ll start dealing.”
Observed social disorder is significantly related to crime incidents, but not to citizen-initiated crime calls, though the relationships in the sample are both in the direction of social disorder increasing crime. Of the observed physical disorder measures, only sidewalk disorder is statistically significant in the citizen-initiated call model. Our indictors of sidewalk or “street” physical disorder are more related to disorderly behaviors, such as youth loitering and the resulting litter and broken glass. Physical disorder at this level may incite residents to call the police, compared to structural disorder like boarded-up buildings, which may be viewed as beyond the responsibility of the police. At the same time, calling the police for physical indictors of sidewalk disorder will be unlikely to result in a crime report (i.e., crime incident), whereas the behaviors linked to physical disorder (e.g., social disorder) may involve criminal activity and translate to a crime incident. This is an important caveat to note regarding our findings – social disorder and crime in our models could be measuring similar outcomes (Sampson and Raudenbush, Reference Sampson and Raudenbush1999). Nonetheless, given that we are controlling for crime levels in 2012, our data suggest that social disorder is measuring something beyond official crime rates.
In this context, social disorder on hot spots streets was often linked to drug dealing in our qualitative interviews. One resident of a violent crime hot spot told us, for example, that “the main problem in the area is drug addicts … that drug addicts hang out in the area, and drug dealers come by to sell to them because they know they’re here.” Similarly, on another drug hot spot, a resident talked about how the drug dealing brought the users to the area – “Drug dealers in the neighborhood walked around with the names of drugs on the back of their t-shirts. They were mostly from the area but brought users into the area who came to buy them. They knew who the dealers were, everyone did, and it was clear with their t-shirts.”
4.5.2 Crime Opportunities and Crime Rates at Street Segments
The main contribution of our work has been to highlight the importance of social structure and social context in understanding crime at street segments. Our inclusion of opportunity variables was primarily to see whether social structure and social context remained important even after opportunities for crime had been taken into account. In both the citizen-initiated call model and the crime-incident model, the population of the street is a very important predictor of crime on the street. This follows prior studies (Weisburd et al., Reference Weisburd, Groff and Yang2012, Reference Weisburd, Groff and Yang2014) and is easily understood as we noted earlier. We might speculate as well that this finding relates to our observations earlier that tearing down of high-residence problem properties appears to lead to large scale changes in crime rates at places. The presence of a bar or liquor store in the case of the citizen-initiated call model was also found to increase crime. We noted earlier in the chapter that one hot spot street in wave 1 became a cold spot at the same time a liquor store was closed. Police presence does not have a significant relationship to crime in our models. Again, as we noted, our measure of police presence is perceptual and does not actually reflect levels of police presence on the street.
More generally, there are many studies that show that opportunity theory is relevant to explaining crime at a micro geographic level (e.g., see Bernasco and Block, Reference Bernasco and Block2011; Groff and Lockwood, Reference Groff and Lockwood2014; Irvin-Erickson and La Vigne, Reference Irvin-Erickson and La Vigne2015; Roncek and Meier, Reference Roncek and Maier1991). However, we do not think our study design is an optimal one for developing an understanding for how opportunity influences crime at place. This is the case in good part because opportunity theories generally require measures of opportunity to intersect in place and time. In this context, our models, likely do not capture the dynamic elements of the intersection of people, both victims and perpetrators, with the (lack of) capable guardians at specific places at specific times (Cohen and Felson, Reference Cohen and Felson1979). Indeed, we suspect that a study would have to be focused particularly on these co-occurrences to fully capture the opportunity dimension in understanding crime rates at places (e.g., see Dong et al., Reference Dong, Morrison, Branas, Richmond and Wiebe2020). Braga and Clarke (Reference Braga and Clarke2014) refer directly to this problem in an earlier critique of quantitative modelling of crime at street segments (see Weisburd, Groff, and Yang, Reference Weisburd, Groff and Yang2012):
However, future research should include possible measures of the convergence of these three basic elements, such as Felson’s (1998) concept of juvenile hangouts. These measures would allow an analysis of what is arguably the central preoccupation of routine activity theory – the ebb and flow of these elements at different times of the day, of the week, and of the year. The ratios of ambient to residential populations at different times, especially day and night, and measures of pedestrian flows and vehicular traffic would be measures of these processes
While we agree fully with this concern, such dynamic models will require research that is framed at the outset to capture the complex mechanisms involved in opportunity theories of crime.
4.5.3 The Relative Stability of Crime at Place over Time
In both regression models, crime in 2012 was found to be a very significant and very strong predictor of crime in 2017. This is not surprising given prior work showing the stability of crime rates on street segments over time (Andresen and Malleson, Reference Andresen and Malleson2011; Schnell and McManus, Reference Schnell and McManus2022; Weisburd et al., Reference Weisburd, Bushway, Lum and Yang2004, Reference Weisburd, Groff and Yang2012). This does not mean that hot spots of crime, or cold spots, always meet the exact thresholds of crime across time as we noted earlier, but during the time period we are referring to, the level of crime in 2012 is on average very highly predictive of crime in 2017.
This suggests, we believe, the degree to which it often takes relatively long periods of time to change the underlying social features of places. While police may quickly alter the opportunity structures of places through guardianship, it is likely to take much longer to alter the social factors that lead to crime occurring on a street. Collective efficacy or concentrated disadvantages are not likely to change quickly on streets in a city. Gentrification in turn, may change the social context of places as more affluent residents move in and long-time less advantaged residents move out (Atkinson, Reference Atkinson2000). But it may take years for the impacts of changes to be felt. We might expect changes to be quicker because of the addition or subtraction of crime attractors on a street, for example, the closing of a liquor store or the reduction of vacant buildings on the street. And indeed, in several of the hot spots that became much cooler over time, we saw housing complexes demolished, vacant buildings reduced, or in one case, a liquor store closed. But more generally, we think future studies should examine crime trends at street segments not just over the period we have studied, but over decades.
4.5.4 Other Variables
We do not have a direct interpretation of the significance of age in the citizen-initiated calls model. Perhaps this variable represents to some degree the willingness of citizens to call the police as they get older. Perhaps the average age on the street represents higher risks of victimization as people get older. We only interviewed residents twenty-one years or older, and the average age of residents in our study was in the mid−40s. This variable in this context may simply represent increased risks of victimization by age. Older residents of hot spots often talked about younger residents not interacting much with neighbors, perhaps reflecting lower levels of informal social control not captured directly by our measure of collective efficacy.
Similarly, we are not clear about the meaning of our results for the percent of women respondents in our survey. When the percentage of female respondents on a street was higher, crime incidents were reduced significantly. Women were somewhat more likely to be interviewed than men (57 percent of the sample are women), and we do not know whether this reflects our sampling or whether it reflects the actual division of adult men and women on these streets. Perhaps this result reflects the lower likelihood of women being involved in crime or their potential role as guardians who have “eyes on the street.”
Finally, the strong impact of our spatial lag term points to the influence of nearby streets on crime on specific street segments. Above and beyond the influences we have already reviewed, the placement of streets near other streets with high crime rates is likely to lead to increased crime. In our view, this is not surprising – street segments do not exist in a vacuum, they are influenced by the streets around them. But this implies that above and beyond any broad community influences on crime at the street segment, there are local influences of streets nearby. Again, this points to the importance of bringing the resolution of our study of crime to the immediate surroundings of crime hot spots.
4.6 Conclusions
We think our data provide strong evidence for the importance of bringing social structure and social context into our understanding of why crime occurs in crime hot spots. Even after focusing on crime over time, and taking into account important features of opportunity structures at places, the clustering influence of communities (through random effects), and nearby streets (through a spatial lag term), informal social control, and structural measures of social disorganization are found to be salient for explaining crime rates at places. These findings suggest not simply the importance of recognizing social structure and social context in understanding crime but also the potential of these mechanisms for improving crime prevention efforts.
If informal social control is a key cause of crime at street segments, it is time to focus in on enhancing informal social control as a means of preventing crime. Can we develop programs to increase informal social control at crime hot spots? As we detail in Chapter 8, we think this is possible, and should be a focus of crime prevention efforts in the future. In our view, it is time to recognize that formal social controls of the police are not the only way to develop crime prevention programs at crime hot spots. Policing is of key importance to residents of hot spot streets (Weisburd, Uding, et al., Reference Uding, Porter, Dong and Moon2024; Zastrow, Reference Zastrow2024), and an essential service for people who live in places with high levels of social disorder and violence. But our findings here suggest that informal social controls should play a much more central role in crime prevention efforts at crime hot spots than it has to date.

 Open access