


1. Introduction
Agriculture, in most cases, requires a significant start-up investment to begin operations as well as to continue operations. Credit is one of the important factors in agriculture because it allows farmers to have access to capital and meet their obligations as required during various stages of the production cycle. Production in agriculture is peculiar to a production cycle involving a significant time gap between the input use and the output produced due to the biological processes, which are also subjected to whims of weather, pests, and diseases (Conning and Udry, Reference Conning and Udry2005). In that, the feasibility of financial markets could complement by generating value through loans characterized by cash or goods exchange now with an undertaking of repayment in the future. This promise can be backed up with added limitations, which define the rights and behavior of the parties involved. However, this promise can occasionally be broken by the borrower. This imperfect information (asymmetry) situation has financiers evaluating prospective borrowers in order to decide who is likely to settle loans as promised. Financiers, on the other hand, follow up on which funds are used in order to confirm that they are used for activities that guarantee loan payment (Dowd, Reference Dowd1992; Von Pischke, Reference Von Pischke1991). From the farmers stand point, payment for materials and purchase of inputs such as seeds, fertilizer, and labor should be met, in most cases, readily through cash, liquid assets, or line of credit (if available) during the respective stages of preparation, planting, cultivation, and harvesting. Note that these payments are required to be completed during times when limited or no income is earned from agriculture, while most cash income from farming is earned typically after some time of crop harvest or livestock sale. In addition to the initial investment, farmers have challenges to meet liquidity requirements in the production process during time lag between planting and harvesting. However, with limited access to credit, the quantities and the combination of inputs used by the farmers might not be optimum, which may lead to suboptimal productivity and outcome. The marginal impact of sufficient credit, therefore, permits input level used to be close to the best level, hence increasing performance and output (Feder et al., Reference Feder, Lau, Lin and Luo1990). In addition, agricultural financing is unique in that farming is a high-asset but low-income activity with relatively low return on investments. Agricultural consolidation and structural changes have increased the need for capital pushing farms to increase their sizes to maintain continued profitability.
It should be noted that agriculture is an important sector for rural economic development. Access to credit enhances farmers’ abilities to adequately use resources in order to increase productivity and to purchase inputs to expand the scale of operation (Adera, Reference Adera1995; Akwaa-Sakyi, Reference Akwaa-Sakyi2013). Ahma (Reference Ahma, Djurfeldt, Aryeetey and Isinika2010) argues that access to credit allows the farmers to venture into new areas of economic activities, increase their sources of capital, and manage risks associated with agriculture. As important as access to credit is for farmers, a number of challenges embody the adequate credit access at a competitive rate. Furthermore, lower return on investment causes limitations to undertake profitable investments or to take maximum advantage of market opportunities leading to reduced revenue and growth opportunities. High transaction costs attached to information gathering, strict collateral requirement, and credit history are important constraints affecting mostly small farmers as well as entrepreneurs (Boucher, Guirkinger, and Trivelli, Reference Boucher, Guirkinger and Trivelli2009; Fletschner, Guirkinger, and Boucher, Reference Fletschner, Guirkinger and Boucher2010; Guirkinger, Reference Guirkinger2008; Guirkinger and Boucher, Reference Guirkinger and Boucher2008).
While we find a large number of studies on credit and rural financial markets focused in the context of developing countries, credit and rural financial problems are not an exception in developed countries. Blancard et al. (Reference Blancard, Boussemart, Briec and Kerstens2006) found that credit and investment constraints were binding on French farmers’ profit function—unconstrained farmers having access to financial markets performed significantly better. Moreover, in various studies analyzing U.S. agricultural finance context, scholars have found binding financial constraints on production and profit, such as, binding credit constraints (Lee and Chambers, Reference Lee and Chambers1986), binding cash flow constraints among New York dairy farmers (Tauer and Kaiser, Reference Tauer and Kaiser1988), binding credit constraints for some sampled California rice growers (Färe, Grosskopf, and Lee, Reference Färe, Grosskopf and Lee1990), and assets and debt constraints (Whittaker and Morehart, Reference Whittaker and Morehart1991). In a recent study, specifically analyzing new farmers’ data from Alabama, Hartarska and Nadolnyak (Reference Hartarska and Nadolnyak2012) found evidence that the new farmers (those initiating operations after 2005) were significantly financially constrained. Moreover, Briggeman, Towe, and Morehart (Reference Briggeman, Towe and Morehart2009) showed that production is lower by 3% in credit constrained farmers compared to credit unconstrained farmers in the United States.
Even though external financing is very common among farmers, there are several factors that hinder these farmers from obtaining finance. One important factor is the cost of external financing due to capital market imperfections as a result of information asymmetry between borrowers and lenders (Girante, Goodwin, and Featherstone, Reference Girante, Goodwin and Featherstone2008)—transaction cost can also come in the form of loan application preparation, value of collateral evaluation, or credit use monitoring all of which can increase the overall cost of borrowing and can result in a wedge between effective interest rate and contracted interest rate. Also, the farmers may be afraid of losing their collateral as a result of the risky nature of the industry, hence they get discouraged from getting credit, even though the credit is needed and the market rate is favorable (Carter, Reference Carter1988). An increase in interest rate resulting from an increase in demand for credit and imbalanced supply could also make some farmers credit constrained (Stiglitz and Weiss, Reference Stiglitz and Weiss1981). Other factors may include the lack of assets used for collateral (Boucher, Guirkinger, and Trivelli, Reference Boucher, Guirkinger and Trivelli2009), the limited supply of capital market, inadequate institutions to offer credit services, and demographic characteristics such as the education level of farmers.
Access to credit and financial markets play an important role in rural American farmers’ performance. Potential growth and development of rural areas in the United States have shown to have significantly strong links between agricultural lending (Hartarska, Nadolnyak, and Shen, Reference Hartarska, Nadolnyak and Shen2015; Johnson, Reference Johnson2009). However, access to credit and proper functioning rural financial markets continues to be an issue, affecting new farmers and land values in the United States (Hartarska and Nadolnyak, Reference Hartarska and Nadolnyak2012; Mishra, Moss, and Erickson, Reference Mishra, Moss and Erickson2008).
Reviewing historical perspectives and genesis of America’s farm credit system specifically in rural areas, Turvey (Reference Turvey2017, p. 17) writes “spillover effects from the liberalization of financial markets has not, in many jurisdictions, provided the required spillover effects for institutional development in rural areas. Binding liquidity constraints limit farm profitability and investment, and even when there is access to credit collateral risk and risk-rationing can limit demand”; “despite great progress in developing capital markets, the promised development of institutional capacity and spillover effects into increased access and use of credit has not materialized in many jurisdictions.”
Moreover, there is also segmentation in the rural financial market (Nadolnyak, Shen, and Hartarska, Reference Nadolnyak, Shen and Hartarska2017). The major financial institutions—Farm Credit System (FCS) and commercial banks are considered the major lenders for agricultural loans in the United States—tend to serve well-equipped farmers with a high degree of credibility, while farmers with lower incomes with low-collateral ability face significant challenges. Bank market structure in the United States has been characterized by consolidation and mergers, where a limited number of financial institutions dominate the market; there are fewer and larger banks and FCS institutions (Dodson and Ahrendsen, Reference Dodson and Ahrendsen2017). Discussing the two parallel facts: (1) higher profitability of banks who are providing farm loans and (2) the higher demand for agricultural credit in farm-dependent counties possibly crowding out nonfarm demands, Kilkenny and Jolly (Reference Kilkenny and Jolly2005) postulate that banks providing farm credit may engage in credit rationing towards farmers and away from nonfarm borrowers. Commercial lenders focus on lending to larger commercial farms. Many smaller farms face difficulties as loan sizes requested by small farms may not be economical for commercial lenders. In this regard, Dodson and Ahrendsen (Reference Dodson and Ahrendsen2016) discussed debt usage by small and large farmers, particularly noting that there has been a significant drop in debt held by farms with less than $100,000 in production (a drop by 10% between 1996 and 2014), while debt held by larger farms with more than 2 million in production increased significantly (around 20% between 1996 and 2014). Medium- and large-scale farmers have greater flexibility in regards to medium- and long-term credit financing, however making long-term investments by small farmers and entrepreneurs is usually very rare. This may prevent small farms from an introduction to new technologies, modernization of equipment, and provision of greater opportunities for profit, leading to inhibited growth and productivity. The Farm Service Agency (FSA)’s direct and guaranteed loans aimed at a specific class of borrowers has served small farms and farms with temporary financial difficulties to some extent through direct loans (Dodson and Ahrendsen, Reference Dodson and Ahrendsen2017). However, full functionality and sustainability of these direct programs to meet increased loan demands of small farms is debatable at least from two viewpoints—first, in the face of limited budgetary and staffing resources of FSA and second, overall policy level discussion about mainstreaming distinct credit mechanism of part-time, full-time, and beginning farmers (Dodson and Ahrendsen, Reference Dodson and Ahrendsen2017).
Small farmers do not have sufficient internal capital to fund their farm operations due to limited resources at their disposal. Access to sufficient credit is important for their farm operations (Dicken, Reference Dicken2007). Typically, a small share of small operations use debt to finance their operations, and the share of farms using structured farm debt increases with farm size (Harris et al., Reference Harris, Johnson, Dillard, Williams and Dubman2009). However, the overall demand for loans by small farms is increasing over the years as U.S. agriculture is characterized by a large number of small farms. Credit constraints have direct as well as indirect impact on farm productivity and efficiency. Directly, credit constraints can affect the farmer’s purchasing power to buy inputs, fund operating expenditures in the short run as well as farm related investments decisions in the long run. Indirectly, it can affect the risk behaviors of farmers, which also influences the farmer’s technology choice and adoption (Boucher, Guirkinger, and Trivelli, Reference Boucher, Guirkinger and Trivelli2009; Eswaran and Kotwal, Reference Eswaran and Kotwal1990). According to Binswanger and Deininger (Reference Binswanger and Deininger1997), an imbalanced circulation of initial capital in the presence of imperfect financial markets with difficulty in credit access, specifically in immature credit markets, can prevent small farmers from making productive decisions and investments; the credit constrained farmer is more likely to invest in less risky and less productive rather than in riskier and more productive technologies (Dercon, Reference Dercon1996). This type of risk behavior limits the farmer’s work and efforts from getting the optimum conceivable output. Moreover, the impact of credit constraints on productivity is well documented in the literature (e.g., Barry and Robinson, Reference Barry, Robison, Gardner and Rausser2001; Blancard et al., Reference Blancard, Boussemart, Briec and Kerstens2006; Färe, Grosskopf, and Lee, Reference Färe, Grosskopf and Lee1990; Lee and Chambers, Reference Lee and Chambers1986; Petrick, Reference Petrick2005).
Although there are previous studies on credit access, impact, and efficiency, an updated review of rural agricultural finance and studies about the credit role, constraint, and actual impact on financial performance are limited, specific to small farms. There are no recent studies adequately addressing these aspects in Tennessee, which ranks 32nd among the states in the United States for total agricultural production and is listed as one of the economically competitive states in the country. In this study, we use small farms in Tennessee as an example to examine these issues using a primary survey. We have defined small farms as those operations with less than $350,000 gross farm income, following farm typology definitions of the Economic Research Services (ERS, USDA).
Agriculture in Tennessee is dominated by small farms having less than $350,000 gross annual farm income. Tennessee has around 69,983 farm operations with 10,900,000 acres of farm operated lands (Census of Agriculture, 2017). Tennessee has a strong crop, livestock, and poultry based agricultural production that contributes to the state’s economy: In 2017, Tennessee’s soybean, corn, wheat, and tobacco brought around $1,385 million in cash receipts, while broiler poultry and hay brought $443.9 million and $130.7 million cash receipts, respectively (Census of Agriculture, 2017). Small farms contribute to the state’s total production of agricultural commodities such as soybean, hay, broiler poultry, goats, hogs, cotton, and tobacco, as well as on the production of fresh marketable fruits and vegetables. Tennessee ranks third in the nation for fresh-market tomatoes and fourth in the nation for meat goat production (Tennessee Farm Bureau, 2019), predominantly produced by small farms. Noting the above statistics, it is evident how important small farmers are to Tennessee’s economy as well as to the United States indirectly. However, 66,406 male and 26,054 female principal operators of 69,983 farm operations in Tennessee make on average of $10,911 net cash farm income per operation—in terms of net cash farm income, only 3,798 operations indicated net annual gain of more than $50,000, while 1,293 operations indicated net annual loss of more than $50,000 (Census of Agriculture, 2017). While this fact is noteworthy, several factors may contribute to the differences in performance of the farm operations and operators, including demographic characteristics, farm size, technology adoption and use, income and enterprise diversification, debt/asset structures, and access to capital market.
Using the primary survey data from small farmers in Tennessee, we investigate whether credit constraint significantly affects financial performances. To examine this we: (a) assessed problems related to credit and loans of small farms, (b) assessed factors influencing credit constraint and the effect of each factor on the likelihood of the small farmer being credit constrained, and (c) estimated the impact of credit constraint on financial performance. Credit constraint implies that farmers either have access to partial credit or no credit access at all when credit is desired. This study hypothesizes that being credit constrained affects financial performance of these farmers as their capacity to fully fund resources for agriculture is limited, and they tend to use suboptimal inputs. This affects their level of productivity and gross sales. We have used gross farm sales as an indicator of financial performance in this study.
1.1. A review of current government policies in rural financing
The agricultural sector in the United States is characterized by a large number of small farms. Rural farmers, both small and large, requiring finance for their agricultural activities rely on rural financial institutions. However, the rural capital market is characterized by imperfections, including information asymmetries. The government intervenes in the agricultural capital market in several ways by making available guarantees to banks for loans, establishing credit organizations solely for agricultural purposes, and providing subsidies to farmers. The questions to be asked are: Are these programs set up as a result of failure in the capital market or as a result of pressure from people to provide subsidies for the agricultural sector? Do the policies resolve issues? Does it induce market distortion? If it induces market distortion, how can these distortions be quantified and do they have effect on efficiencies and incentives? In Section 1.1, we review agricultural financing and government support in the United States.
One important government intervention in the credit sector is the creation of specialized agricultural credit institutions such as the FCS, the FSA, and State Agricultural Development programs. The FSA provides finance to rural farmers through multiple loan programs and land contract programs ranging from guaranteed loans to direct loans. The FSA provides microloans, emergency loans, marketing assistance loans, farm storage facility loans, and rural youth loans for youths between 10 to 20 years to start and manage income generating plans. FSA also provides Noninsured Crop Disaster Assistance Program (NAP) for producers of non-insurable crops that do not qualify for federal crop insurance, which is a risk management tool intended to reduce financial losses in situations when natural disasters lead to a loss of production or prevent planting. In the currently defined plan, NAP covers losses exceeding 50% of projected production and 55% of average market price; up to 65% of projected production and 100% of average market price (USDA/ERS, 2017). FCS loan funds directly to individuals to purchase land and farm equipment, as well as for operations and insurance purpose (FCS, 2016). FSA’s guaranteed and direct loans are aimed to provide loans for different segments of loan borrowers. Guaranteed loan somehow ensures conventional agricultural lenders such as commercial banks to entice them to underwrite riskier borrowers. However, it also has the mechanism to directly underwrite loans. FSA direct loans are primarily targeted at beginning farmers and small farmers with limited resources, including some portfolios to serve socially disadvantaged farmers, emergency loans, and economic emergency loans. Moreover, Federal Deposit Insurance Corporation (FDIC) insured institutions (commercial banks, savings associations, etc.) also provide agricultural loans. Looking at the recent composition of farm income and wealth statistics presented by the USDA, ERS (Farm Sector Balance Sheet, 2019), FDIC-insured institutions and FCS, each make up around 40–41% of all agricultural lending, the FCA makes around 3%, and the rest (15–16%) is by other institutions (such as life insurance companies, credit unions, and Farmer Mac, etc.).
2. Conceptual and theoretical model
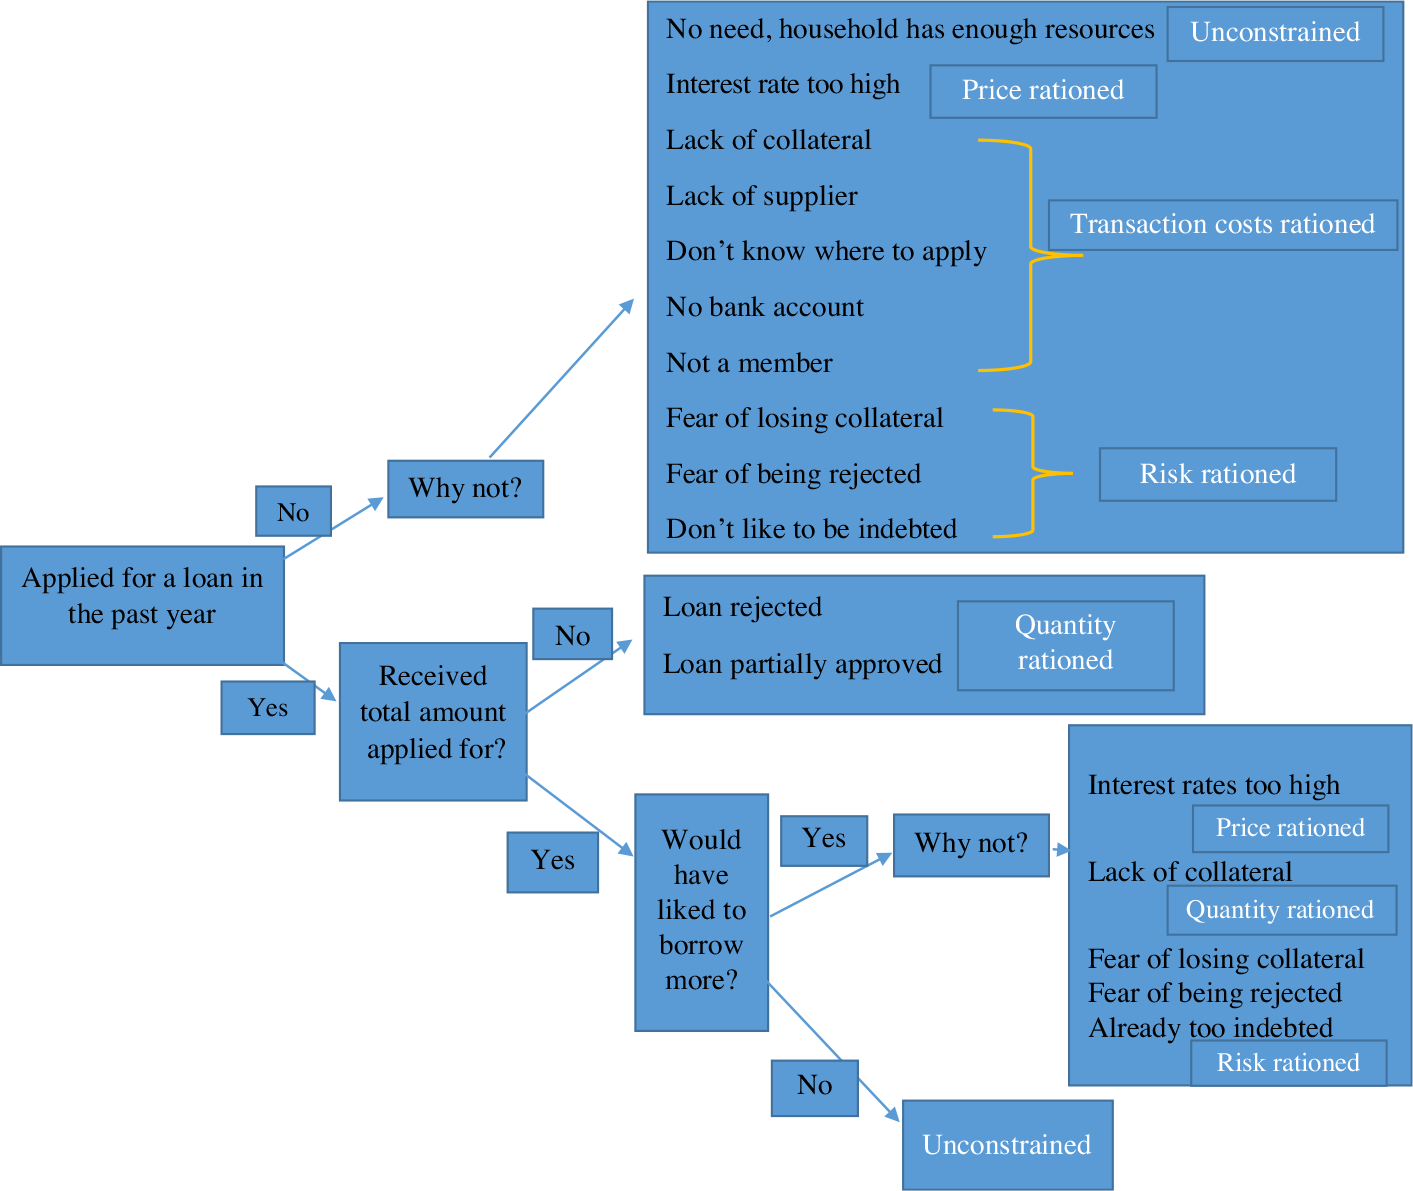
Figure 1 explains the conceptual model defining credit constrained farmers. This conceptual diagram is adapted from Ali, Deininger, and Duponchel (Reference Ali, Deininger and Duponchel2014). Figure 1 conceptually shows that an unconstrained farmer is one who applied for a loan, received the total amount applied and desired, and was satisfied. However, farmers can fall into capital (credit) constraint in several ways. The first scenario is that a farmer can apply for a loan and either get rejected or get partial approval. This implies that the quantity of the loan was rationed (quantity rationed). Hence, a farmer who did not receive the applied loan at all and a farmer who wanted more loan but did not receive as much as expected, are both credit constrained. The second scenario of credit constraint is that the farmer applied for a loan of a certain amount and was approved, but he/she would have liked to borrow more. The farmer did not ask/apply as desired due to factors such as high interest rate, lack of collateral, fear of losing collateral, fear of being rejected, and/or already too far in debt. The third scenario of being credit constrained is the farmer who did not apply for a loan but would have liked to. The farmer did not apply due to factors such as high interest rate, lack of collateral, lack of supplier, lack of information of where to apply, no bank account, not a member (in the case of a cooperative), fear of losing collateral, fear of being rejected, etc. In summary, a farmer can be credit constrained due to price factor, risk factor, or transaction cost factor (Bethuel, Reference Bethuel2018). Capturing these different aspects in the credit constraint definition is important. Specifically, the second and third scenario is in line with the essence of “discouraged borrowers” as referred to in Jappelli (Reference Jappelli1990, footnote 2), who indicated that completely “omitting this group may lead to biased estimates of the probability that consumers are credit constrained.” Therefore, we have tried to capture the essence of discouraged borrowers in our definition of credit constraint (our definition of credit constraint variable is described in Section 5.1). Moreover, in the discussion of credit markets in the United States and consumers in general, Jappelli (Reference Jappelli1990) showed that both consumer and lender characteristicsFootnote 1 determine the probability of credit rationing.
Showing the conceptual framework of credit constraint.
The theoretical framework presented below and used in this study links farmer’s credit access with farm performance. This model conceptualizes that the receipt of credit enhances the net revenues attainable from resources and market prospects, it derives the model via farmers’ maximization of utility of net revenue (NR). Productivity and efficiency differences among farmers can be due to binding credit constraints. Following Khanal and Regmi (Reference Khanal and Regmi2018), assume a farm household with existing land L and nonland variable inputs (such as labor, fertilizer, seed, and other) captured in X. The farm production function can be represented as  $(f\left( {X,\;L,\;{Z^q}} \right))$ where $({Z^q})$ is the vector of production shifters. Assuming p and w are the market price per unit for output and inputs, respectively, the farm’s NR can be represented as:
 $$NR = pf\left( {X,\;L,{z^q}} \right) - wX$$
 Let us assume that the farm has some income level Y at the beginning of the process of production. The farmer allocates C for consumption with unit price, p. If  $(Y \ge pC + wX)$, then the farmer can self-finance consumption and production events and is able to get a maximal NR level without using external financial resources. However, in most circumstances, farmers have the ability to pay only a fraction of production and consumption expenditures from their own income.Footnote 2
Assume that the farmer is able to pay only fraction s, with  $(0 \lt s \lt 1)$ of variable inputs. Then the (1 − s) portion of variable inputs should come from outside financing—typically loaned from either formal or informal lenders. Lenders will determine the credit, K, to grant to the farmer charging the interest rate on the requested loan. Under these circumstances and the model assumptions, the farmer’s problem is to maximize the utility of profit U(NR) as follows:
 $$Max\;U\left[ {NR\left( X \right)} \right] = U\left[ {pf\left( {X,A,{z^q}} \right) - swX - \left( {1 - s} \right)wX} \right]$$
Subject to:
 $$\left( {1 - s} \right)wX \le K\left( {{z^c},{z^q}} \right) + \left( {Y - pC - swX} \right)$$
 $$0 \le K\left( {{z^c},{z^q}} \right) \le \rho A$$
 The equations show that the expenses on variable inputs X are restricted by the farmer’s initial income Y, consumption expenditures  $(pC)$, and the credit limit, $(K\left( {{z^c},{z^q}} \right))$. The maximal quantity of credit available to the farmer can be determined by both production characteristics, $({z^q})$, as well as consumption shifters, $({z^c})$ (factors influencing consumption such as household size, financial condition, and wealth). Additionally, equation (4) shows that the farmer’s credit limit constraint is determined by the value of asset owned (A having unit price $(\rho )$). The optimality condition for this is obtained by first order conditions. As derived and shown in Khanal and Regmi (Reference Khanal and Regmi2018) under the binding credit constraint condition, a lower optimal level of input demanded by the farmers implies a higher credit constraint—a sub-optimal production leading to sub-optimal financial performance.
3. Econometric framework
Consistent with our theoretical and conceptual model, we used econometric methods to empirically test the hypotheses and estimate: (a) the relationship of credit constraint with a set of socioeconomic and demographic variables including access to information and perceived risk of the farm and marginal likelihood of being credit constrained, and (b) the impact of credit constraint on financial performance. To accomplish these, we used: (a) probit model where credit constraint is the dependent variable with different factors influencing credit constraint, and (b) the propensity score matching (PSM) estimator to approximate and quantify the impact of credit constraint on financial performance of small farms.
3.1. Probit model
Our model to estimate determinants of credit constraint in multiple regression frameworks can be shown in generic form as:
 $$y = f\left( {{X_1},{X_2},{X_3},{X_4} \ldots \ldots \ldots {X_n}} \right),$$
where the dependent variable y is the credit constraint and  $({X_1},{X_2},{X_3},{X_4} \ldots \ldots \ldots {X_n})$ represents a set of independent variables influencing the farmer’s likelihood of being credit constrained. Credit constraint is a binary variable having the value 1 if credit constrained and 0 if not. Due to the nature of the dependent variable, a nonlinear model is appropriate to estimate the relationship. The most widely used methods are probit and logit as these methods effectively transform the regression model so that the fitted values and estimated probabilities lie between (0, 1) interval (Gujarati, Reference Gujarati2009). The logit and probit are comparatively the same in most applications, the key difference between the two is due to the nature of their distribution, which is accounted for by the Cumulative Distribution Function (CDF). Probit takes a normal distribution, while logit has a logistic (slightly flatter tails) distribution. The choice of probit versus logit regression depends, therefore, chiefly on the distribution assumption one makes. Following the majority of agricultural economic studies, we assume standard normal distribution of the error term and choose probit method to estimate our model and compute marginal effects. Probit is a nonlinear model estimated using the maximum likelihood method (for detail, see, e.g., Gujarati, Reference Gujarati2009). The marginal effect is defined as the effect a unit change in each independent variable (x) used in the study has on being credit constrained which is the outcome variable (y). In generic terms, Marginal effect = dy/dx. In case of the probit model, marginal effect is generically shown as (Cameron and Trivedi, Reference Cameron and Trivedi2010):
 $$Marginal\;effec{t_{probit}} = {{{\partial y}}\over{{\partial {x_j}}}} = {\beta _j}\emptyset \left( {x'\beta } \right),$$
where  $({\beta _j})$ is the coefficient on variable $({x_j})$ from probit regression and $(\emptyset \left( . \right))$ denotes the standard normal density.
3.2. Propensity score matching estimator
The PSM estimator estimates the effect of treatment that is given to a group in the presence of a counterfactual control group. The mean or mean-based estimates such as OLS provide a biased and inconsistent estimate if there is the presence of selection bias. In our case, we need to account for selection bias because assigning the surevy respondent to the treatment (credit constraint) is not random and credit constrained farmers are likely to have characteristically different from unconstrained (Briggeman, Towe, and Morehart, Reference Briggeman, Towe and Morehart2009). PSM is suggested as an appropriate method (Abadie and Imbens, Reference Abadie and Imbens2002; Abadie and Imbens, Reference Abadie and Imbens2011) to compute more accurate impacts controlling for selection bias in nonexperimental settings (Abadie et al., Reference Abadie, Drukker, Herr and Imbens2004; Abadie and Imbens, Reference Abadie and Imbens2011; Dehejia and Wahba, Reference Dehejia and Wahba2002; Rosenbaum and Rubin, Reference Rosenbaum and Rubin1984). PSM has been increasingly used in recent agricultural economics studies aiming to estimate causal effects using cross-sectional data (Briggeman, Towe, and Morehart, Reference Briggeman, Towe and Morehart2009; Joo, Khanal, and Mishra, Reference Joo, Khanal and Mishra2014; Khanal and Mishra, Reference Khanal and Mishra2016; Khanal, Mishra, and Koirala, Reference Khanal, Mishra and Koirala2015; Mendola Reference Mendola2007; Sitienei, Mishra, and Khanal, Reference Sitienei, Mishra and Khanal2016; Verhofstadt and Maertens, Reference Verhofstadt and Maertens2014). PSM is based on balancing the distribution of observed attributesFootnote 3 of credit constrained and credit unconstrained farmers and computing difference after matching based on observed attributes—discovers a counterfactual or matching propensity based on the set of covariates. Since similar groups are formed conditional on their basic characteristics, PSM assumes that the only factor that causes the performance difference between treatment and control counterfactual group after matching is the treatment variable, referred to as the assumption of “ignorability,” “selection on observables,” or “unconfoundness” (Briggeman, Towe, and Morehart, Reference Briggeman, Towe and Morehart2009; Imbens, Reference Imbens2004; Uematsu and Mishra, Reference Uematsu and Mishra2012). Although we cannot directly test this assumption, empirical studies test the balancing between observed distribution of covariates across treatment and control groups after matching to ensure no systematic differences between distributions and to examine overlap (common support) of covariates. The balancing property can also be tested with mean absolute standard bias (MASB) between credit constrained and unconstrained farmers (Rosenbaum and Rubin, Reference Rosenbaum and Rubin1985). A MASB below 20% is generally suggested to qualify the matching process. Additionally, pseudo R 2 and P values of likelihood ratio of joint insignificance from logit/probit models before and after matching can be evaluated for matching quality (Sianesi, Reference Sianesi2004).
PSM is applied in two steps: the first step is that a probit model is estimated with the binary treatment variable (credit constrained or unconstrained status of farmers). Starting with this first stage of regression, the PSM evaluates the propensity scores of each observation. The propensity score of each farmer measures his or her tendency to be credit constrained. The magnitude of a propensity score is between 0 to 1; the larger the score, the more likely the farmer is credit constrained. The second step, based on estimated propensity scores, two balanced groups are formed. Note that the balancing is based on the likelihood of being credit constrained, as explained through farm performance factors. Farmers in each group have like propensity scores. The two groups can then be compared in regard to their performance based on several matching methods such as “nearest neighbor matching,” “radius based matching,” or “kernel based matching.” The difference in the performance between the matched treated and control observations follows a t-test for statistical significance. By calculating probabilities from a first-stage probit and then forming the treatment and control groups based on these probabilities, PSM minimizes the selection bias that might have existed in the observed data.
4. Sampling procedure and data collection
Primary data were collected from Tennessee farmers through a structured questionnaire, which was administered by sending a survey link via e-mail. An electronic survey method was chosen because it is considered to be cost effective and quick to administer. Survey and personal interview methods are expensive and slow (Dillman, Smyth, and Christian, Reference Dillman, Smyth and Christian2009). To achieve a high-response rate from online correspondences, e-mail reminders were sent three weeks after the survey was sent, followed by second and third reminders at two-week intervals after the first reminder. In total, each farmer received at least three reminders and sometimes even more, depending on their response time. This is in line with the study by Dillman (Reference Dillman1991) that repeated contacts often increase response rate.
Contact information for farmers are collected by extracting e-mail addresses and phone numbers obtained from the Pick Tennessee Products organization database.Footnote 4 The Pick Tennessee Products database has various categories of producers representing different agricultural enterprises such as fruits, vegetables, herbs and mushroom, honey, meats, poultryFootnote 5 and eggs, dairy, certified organic, as well as agritourism. The database included east, west, and middle regions and was also further categorized based on counties in Tennessee. The total number of farmers’ e-mail addresses and contacts were extracted using a stratified random sampling method based on counties, as well as different categories among the agricultural farms listed. In total, we sent the survey to 720 farms: 250 to the east, 250 to the middle, and 220 to West Tennessee in 2017 and received 104 responses. The questionnaire was pre-tested to evaluate the validity and clarity and to evade repetitive questions by sending the questionnaire to a small subsample of contacts (those not in the selected 720) in West Tennessee to observe their responses and modify some questions.
5. Results and discussion
5.1. Descriptive statistics
Table 1 presents summary statistics of the dependent and independent variables used in this study. The sample used for the analysis consisted of 100 observations, omitting 4 responses that indicated >350,000 in gross farm income, from the 104 survey responses obtained. Variable description, mean, standard deviation, minimum value, and maximum value are shown in Table 1.
Summary statistics of variables used in the study

Annual gross sales (or gross farm income from agricultural activities in farm types such as those involved in agritourism) is measured in U.S. dollars. The annual mean gross sale in our sample is $43,900 with a standard deviation of $55,316, which indicates that the majority of small farms are very small (Table 1). A larger standard deviation also suggests that there is a wider range of gross sales within the small farms. Further looking at the distribution of gross sale (gross income) variable, our data shows that 92% of sampled households generate below $100,000 gross sales while only 8% generate between $100,000 to $350,000. This indicates that Tennessee has a vast majority of very small to moderately small farms within the categories of small farms. Mean gross sales (incomes) in our sample is comparable with recent Tennessee Census data (Census of Agriculture, 2017), which shows that the largest portion among farmers were dominated by very small farmers—out of 69,983 operations, remarkably high 65,701 (93.8%) farm households generate farm sales below $100,000, followed by 1,639 (2.3%) generating $100,000 to $250,000; only 1,632 (2.3%) operations have farm sales above $500,000.
In our study, the credit constraint variable is represented as a dummy variable, where 1 implies being credit constrained, and 0 implies not constrained. According to the conceptual framework shown in Figure 1 and Bethuel (Reference Bethuel2018), a farmer can be credit constrained due to various reasons such as quantity rationing, transaction cost rationing, or risk rationing. Quantity rationing constraints occur from both the demand and supply sides. On the demand side, this occurs when the farmer is unable to make available quality and quantity of collateral required by the lender. On the supply side, however, this issue arises as a result of the lenders’ unwillingness to increase interest rates to clear out excess demand (Stiglitz and Weiss, Reference Stiglitz and Weiss1981). Given our primary survey data and response and keeping the view from previous studies about multifaceted ways of credit constraint, we defined credit constraint variable following a similar theme and somehow capturing the essence of “discouraged” or hesitant (Jappelli, Reference Jappelli1990) borrowers (farmers) in loan or lending mechanism. Specifically, we defined credit constraints in this study: (1) if the farmer indicated any difficulty in obtaining agriculture-related loans, (2) if indicated “not being able to get loans as required or desired level for farm operation,” and (3) if the farmer indicated that she/he had applied for agricultural loans and felt the following challenges or was hesitant to apply due to any of the following challenges: (a) high interest rate, (b) complicated procedures and paperwork to apply, (c) collateral requirements are problematic, (d) few institutions providing ag loans in rural areas, (d) lack of established line of credit, (e) no loan provided due to uncertainty in agriculture, or (f) no information about where to get loans. From Table 1, our study shows that more than half of our respondents (approximately 59%) are credit constrained, following this definition. Figure 2 shows the breakdown of the response for each of these reasons of credit constraint. Credit constrained farms consisted of 30% farms that applied for agricultural loans and faced some sort of difficulties, 28% farms that did not obtain the loan as desired or required level, and around 42% either hesitated to apply in the face of the challenges mentioned earlier or experienced these challenges considering application (Figure 2).
Distribution of credit constrained small farm households by credit related response, Tennessee, 2017.

We collected information on some demographic and farm-specific characteristics of sampled farm households. As shown in Table 1, our sampled farm households were dominated by male operators (68%) with an average age of 53 and 14 years of education and had around $55,930 of average annual household income. Around 43% of sampled farm household’s operator or spouse were engaged in off-farm works. We have included farm land acreage holdings in our models as an indicator of a farm asset. Farm land acreage holdings ranged from as low as 0.25 acres to as many as one hundred acres of land, 60% of the farms had specialized production (more than 50% of agricultural production coming from one agricultural enterprise), and 85% of farms plan to continue farming over the next 5 to 10 years. Looking at the types of specialized farms in our data, it shows that fruits and nuts, poultry and egg, and vegetable dominated farms (with >50% share) were the highest (each around 15%) followed by goat farms (5%).
Around 84% of sampled households used a smartphone with Internet access for their agricultural activities. A large percentage of sampled households owned and used a smartphone with Internet access, probably because 51% of principal operators in the survey were below 54 years—relatively younger principal operators tend to use modern technologies. We also asked about the respondent’s familiarity and satisfaction level with the existing agricultural lending mechanism and the rural financing in Tennessee. An average of 1.22 on the 0 to 2 rating suggests that the higher proportion of respondents indicated familiarity and satisfactory level.
Our enterprise diversity score variable indicates the number of enterprises adopted (with at least 5% of agricultural production coming from each enterprise). The score ranged from 0 to 9, indicating that up to 9 enterprises were adopted by sampled farm households. A higher diversification score implies higher agricultural enterprise diversification. On average, small farmers adopted 2 agricultural enterprises. Finally, we included a variable related to “risk perception” of the operation, by asking “considering your farm operation’s overall performance and challenges, how do you rate your operation’s level of risk?” The risk perception variable ranges on a scale of very high (5), high (4), moderate (3), low (2), very low (1), and no (0). On average, sampled households indicated a moderate level of risk perception with a mean value of 3.1 (Table 1).
5.2. Results from econometric analyses and tests
We examined two research questions through econometric analyses: first, credit constraint and factors influencing credit constraint and second, impact of credit constraint on financial performance (gross sales).Footnote 6
5.2.1. Probit regression results: Factors influencing credit constraint
Table 2 shows the probit regression result of the factors that determine small farmers’ likelihood of being credit constrained. Overall, the model is significant as indicated by the chi-square statistic value of 40.43 (P value 0.0001), and a good model fit indicated by pseudo R 2 of 0.41. Particularly, a relatively higher 0.41 of pseudo R 2 (for nonlinear models like probit) indicates a well explanatory power of independent variables included in the model. We found that demographic, socioeconomic, and farm-related variables, namely gender, off-farm work participation, land acreage holdings, use of a smartphone with Internet access, specialized production, and level of satisfaction with existing credit institutions in Tennessee significantly influenced credit constraint. The magnitude of the relationship of each independent variable with dependent variables is computed and presented as marginal effects. In other words, the marginal effect of the respective variable presents the variable’s contribution on the likelihood of being credit constrained.
Results of probit regression and marginal effect of the determinants of credit constraint

Note: Asterisks (*, **, and ***) denote significance at the 10%, 5%, and 1% levels, respectively.
Our results in Table 2 show a significant gender effect on credit constraint. A negative coefficient and marginal effect of gender in Table 2 suggests that if the principal operator of the farm is male, he is less likely to be credit constrained (5% level of significance). The magnitude of marginal effect suggests that the likelihood of credit constraint is 0.31 points (31%) lower for male operators as compared to female operators. This finding is consistent with previous studies that found a positive impact for a male farmer to credit access as males are described to have more involvement in farming, have a higher probability of owning resources such as land which can be used as collateral in accessing loans (Bembridge, Reference Bembridge1984; Dlova, Fraser, and Belete, Reference Dlova, Fraser and Belete2004). Moreover, a significantly negative coefficient of land acreage holding variable suggests that farm households with large acreage holdings are less likely to be credit constrained. Farm land is an important asset and the relationship is consistent with our expectation. Marginal effects show that the likelihood of credit constraint decreases by 8% with additional acres of farm land holdings.
Another variable strikingly significant is the engagement in off-farm work. Operator or spouse’s off-farm work participation decreases the likelihood of being credit constrained by around 40%. The negative relationship is expected because off-farm work and generated income is expected to provide farmers with quick liquid capital to offset their debt (Barrett, Reardon, and Webb, Reference Barrett, Reardon and Webb2001; Reardon, Crawford, and Kelly, Reference Reardon, Crawford and Kelly1994) making them less credit constrained. Additionally, a farmer’s off-farm work participation may improve the likelihood of loan repayment because the farmer having off-farm income does not likely divert a loan meant for agricultural activities to other purposes since those expenses will be taken care of by earnings from an off-farm income (Ojiako and Ogbukwa, Reference Ojiako and Ogbukwa2012). Additionally, we found that ownership of a smartphone with Internet access decreases the likelihood of being credit constrained (results are significant at the 10% level). This is plausible because a farmer who uses a smartphone with Internet access has the ability to track market and loan information. Farmers who use smartphones with Internet access could obtain first-hand information about where and how to get a loan (Ayamga, Sarpong, and Asuming-Brempong, Reference Ayamga, Sarpong and Asuming-Brempong2006). Smartphone and Internet access enhance abilities to get farm related news and information, better and quicker communication, and access to the market that may reduce information asymmetry (Khanal and Mishra, Reference Khanal and Mishra2016). Smartphones with Internet allow use and access to social media and may help to engage as a customer of the bank community and make arrangements for low-volume loans for disaggregated networks in the rural counties.
Also, our results suggest that specialized farm operations with more than 50% of agricultural production from one enterprise are less likely credit constrained, as compared to other farm operations. One plausible reason is that farms with specialized operations have specific capital, equipment, and production infrastructure and perhaps seem better in collateral ability for lenders. Finally, consistent with our expectation, if a farm operator is familiar and satisfied with existing rural financial institutions in Tennessee, the likelihood of being credit constrained decreases by 0.32Footnote 7 (32%), and this result is significant at 1% or higher levels.
5.2.2. Impact of credit constraint on financial performance: Propensity score matching estimator results
We estimated the impact of credit constraint on financial performance using an appropriate PSM method, as described in Section 3.2. The estimated impacts are presented in Table 3. PSM computes impacts by creating appropriate counterfactual based on propensity scores and accounting for self-selection bias. This way, it enables the computation of the appropriate impact due to treatment (in our case, credit constraint) through measures such as average treatment effects for treated (ATT). Propensity scores were computed using the same set of covariates as the probit model. For the robustness of our findings, we used three different matching methods to compute the ATT, namely, nearest neighborhood matching (NNM), radius based matching (RBM), and kernel based matching (KBM). The matching procedure for each matching algorithm (NNM, RBM, KBM) were tested for balancing property. Figure 3shows treated on-support, treated off-support, and untreated regions. “Treated: On support” category includes credit constrained farmers with suitable matching pairs, which indicates the overlapping of distribution of propensity scores (common support) for credit constrained and unconstrained farmers. Observations in common support regions have comparable propensity scores, which we use in PSM to create a counterfactual group. Table A1 of the Appendix shows the covariate characteristics before and after matching, which show a significant reduction in the selection bias (percentage bias) in each covariate after matching. Mean of each covariate after matching between treated and control groups in mean comparison test is shown to be nonsignificant by P value—indicating the treatment and counterfactual were alike after the match (Table A1). Additionally, pseudo R 2 and P value of the likelihood ratio became statistically nonsignificant, indicating that there is no difference in observed attributes for these subsamples after matching (Table A2). Low bias values after matching, lower than the threshold of 20% for all matching algorithms (Rubin, Reference Rubin2008), indicates that the balancing property is satisfied.
Impact of credit constraint on financial performance (gross sales) of small farmers

Note: Asterisks (*, **, and ***) denote significance at the 10%, 5%, and 1% levels, respectively.
Common support and propensity scores for treated and untreated.

In each estimation presented in Table 3, we found differences in financial performance between credit constrained and their counterfactual counterparts—ATT estimates are significantly different and can be attributed as the impact solely due to credit constraint. Our financial performance measure, annual gross sales, of credit constrained farmers using NNM is $26,875, while that of credit unconstrained farmers is $78,312.50 with a difference in annual gross sales of –$51,437.50. The difference is statistically significant at the 1% level or higher. Using Radius Based Matching (RBM), the annual gross sales of credit constrained farmers is $41,627.91, while that of credit unconstrained farmers is $62,000 with a difference in annual gross sales of –$20,372—the difference is statistically significant at the 1% level or higher. Finally, using Kernel Based Matching (KBM), the annual gross sales of credit constrained farmers is $27,109.19, while that of credit unconstrained farmers is $76,976.71 with a difference in annual gross sales of –$49,867.52. The difference is statistically significant at the 5% level or higher. These difference between treated and control is average treatment effects considered as the impact attributable to credit constraint.
5.2.3. Constrained borrowing and the impact on financial performance
We further estimated specific impacts relating to different situations/reasons within credit constraint. Specifically, Figure 2 clearly shows two groups of credit constrained farmers that can be referred to as “constrained borrowers”: (a) those who applied for agricultural loans but faced some difficulty in the process (constrained borrowing 1), and (b) those who did not get agricultural loans as required or desired level (constrained borrowing 2). We separately examined the impact of these constrained borrowing on the financial performance. The estimated ATT impact are presented in Table 4. Table 4 shows that the impact of constrained borrowing 1 on gross sales is not statistically significant between the treated and control groups. However, the impact of constrained borrowing 2 is noticeable and statistically significant between treated and control groups. Our ATT estimates on the impact of constrained borrowing 2 (Table 4 lower panel results based on NNM, RBM, and KBM) suggest that around $32,000 to $39,000 lower in gross sales compared to unconstrained farmers can be attributable to the reason farmers not being able to receive agricultural loans as required or desired level.
Impact of different situations of credit constraint (constrained borrower situations) on financial performance (gross sales) of small farmers

Note: Asterisks (*, **, and ***) denote significance at the 10%, 5%, and 1% levels, respectively.
Overall summarizing our findings on impact, our ATT estimates from NNM, RBM, and KBM suggest that farmers who are credit constrained have gross sales around $20,000 to $51,000, below those who are credit unconstrained. Additionally, when further looking at the impact over specific situations within credit constraint, we found that constrained borrowers not able to obtain agricultural loans as required or desired level likely perform lower in gross sales—around $32,000 to $39,000 lower, as compared to unconstrained farmers. Overall our finding is consistent and comparable with Briggeman, Towe, and Morehart (Reference Briggeman, Towe and Morehart2009), who found that ATT matched estimates of the impact of credit constraint on the value of farm sole proprietorship-production is around –$39,658 using PSM Kernel-based matching. Using the same method, the estimated impact on crop specific value of production of sole proprietorship was estimated around –$53,955. Acknowledging the difference in the nature of nation-wide data of farm sole proprietorship of Briggeman, Towe, and Morehart (Reference Briggeman, Towe and Morehart2009) with our Tennessee specific small farm sample data, it is reasonable to claim that our results are comparable.
Our results indicate that mitigating the credit constraints and improving access to credit to credit-constrained small farmers and mitigating constrained borrowing by enabling agricultural loan borrowers to obtain loans fully at their required or desired level could enable them to achieve higher gross sales. Our impact results are consistent with our conceptual and theoretical model that derives the role of access to capital on financial performance. Finally, our findings are in support with some previous empirical studies that depict effects of credit constraints or the role of access to capital on farm household’s efficiency, productivity, production, or economic/financial returns (Feder et al., Reference Feder, Lau, Lin and Luo1990; Guirkinger and Boucher, Reference Guirkinger and Boucher2008; Khanal and Regmi, Reference Khanal and Regmi2018).
6. Discussion and conclusions
We estimated factors influencing credit constraint and the impact of credit constraint on financial performance using an appropriate procedure based on the treatment effects method. To do so, we collected primary data by administering a survey to small farm households in Tennessee, following standard survey and sampling methods. Results from mean comparison and mean based estimators cannot be interpreted as the sole impact due to credit constraint as these methods do not account and control for several characteristic differences that are apparent between credit constrained and unconstrained farm households. To avoid this limitation, we used an innovative PSM estimator in this study, which overcomes this limitation by appropriately accounting for selection bias and heterogeneity. We computed impacts on financial performances (using gross sales as an indicator) that are attributable due to credit constraints of small farm households.
Using probit regression, we found the significant effects of gender, off-farm work participation, farm land acreage holdings, farm specialization/concentration, accessibility to a smartphone with Internet access, and farmers’ satisfaction level about existing financing institutions in Tennessee on farmer’s likelihood of credit constraint. Our results from the PSM estimator suggested that financial performances of credit constrained small farmers were significantly lower than unconstrained small farms—that is attributed to an adverse impact of constrained capacity to credit and capital and constrained borrowing.
The demand and use of credit by farmers is an effective tool in better financial performance. There is a corresponding ripple effect with increases in farm household income to the local and national economy if small farmers are able to improve their standard of living, increase disposable income, and continue farm production. Based on our findings, some mechanism to ease the credit access and lending process for agricultural loans for small farms irrespective of gender, land acreage holdings, and specialization help boost their financial performance. This study also found the importance of Internet access and off-farm work participation in making farmers less credit constrained. Hence, extension agents should engage and encourage farmers to use tools such as income diversification through off-farm jobs, and combating information asymmetry through the use of the Internet and smartphones to mitigate the adverse effects of capital constraints on financial performance. Additionally, inferences from our study also indicate that improving the capacity and method of agricultural lending in rural institutions may enhance credit access and financial performance of small farmers.
Acknowledgments
We thank two anonymous reviewers. Their comments have been helpful in shaping our paper.
Financial support
Principal author’s time contribution in this study is supported by the Evans-Allen funds: TENX-1623-GFSHPP, Accn#1009664 and TENX-2031-GFSHPP, Accn# 1021233. We acknowledge USDA/NIFA for the fund support.
Appendix
Test for selection bias after matching

Statistical test to evaluate bias-reduction after matching


 Open access