


1. Introduction
Firn is the porous transition phase between seasonal snow and ice on ice sheets and glaciers. Strictly, firn is the snow that has lasted through a melt season and not yet densified to become glacier ice. Knowledge of firn properties and processes is important for numerous applications in cryospheric sciences, including ice-core interpretation (e.g. Arnaud and others, Reference Arnaud, Barnola and Duval2000; Johnsen and others, Reference Johnsen2000) and ice-sheet mass-balance estimation (e.g. Arthern and Wingham, Reference Arthern and Wingham1998; Smith and others, Reference Smith2020). On mountain glaciers, understanding the evolution of firn density is important because (1) firn processes influence surface meltwater hydrology and (2) converting measurements of surface elevation change to mass change requires knowing the firn density. Firn density can be directly calculated from firn cores by measuring volume and mass of a core sample. Firn density can then be used to calculate firn air content (FAC), which is a measure of the integrated porosity in the firn column. Quantifying changes in FAC captures the surface elevation change attributable to firn densification.
Firn exists on glaciers and ice sheets in a variety of climates. It can be broadly classified as dry (where there is no surface melt) or wet (where there is surface melt). The area that experiences surface melt can be further delineated into the percolation and wet-snow zones (Benson, Reference Benson1962), with the delineation between the two sometimes referred to as the upper limit of runoff. The percolation zone is characterized by snow and firn temperatures below 0$^\circ$ C, limited liquid water and no runoff (all melt refreezes in the snow and firn). The magnitude of the refreezing is limited by the volume of liquid water input (meltwater and rain).
The wet-snow zone is characterized by snow that has reached 0$^\circ$ C by the end of the melt season and having sufficient liquid water input that some of that liquid flows off the glacier as runoff. At the colder limit of the wet snow zone, most of the melt is refrozen as internal accumulation (the latent heat in the melt volume is approximately equal to the cold content of the snow and firn). At the warmer limit of the wet-snow zone, most of the snow from the previous accumulation season melts and runs off. The meltwater percolates through the snow and firn along a hydraulic gradient. Some of this liquid will be retained in the pore matrix due to capillary forces (Colbeck, Reference Colbeck1974; Coléou and Lesaffre, Reference Coléou and Lesaffre1998); this is referred to as the irreducible water saturation. The remaining water will either find its way to the glacier bed via a crevasse or moulin and become glacial runoff (Fountain, Reference Fountain1996; Poinar and others, Reference Poinar2017), or it will fill the pore space and become a firn aquifer (Miller and others, Reference Miller2020; Ochwat and others, Reference Ochwat, Marshall, Moorman, Criscitiello and Copland2021). In this work, we refer to melt and rain water that does not run off as being retained, whether as liquid in the pore space or as refrozen ice mass.
Despite the importance of meltwater runoff in glacier systems, there have been relatively few studies characterizing the firn below the runoff line in the wet-snow zone (Machguth and others, Reference Machguth, Tedstone and Mattea2023) and its implications for glacier mass balance. A lack of observations contributes to an incomplete understanding of the physics, magnitude and timescales of meltwater retention and runoff in firn zones on mountain glaciers. For example, one study on Kaskawulsh Glacier in the Canadian Yukon showed 86% meltwater retention within the firn from 2005 to 2017 (Ochwat and others, Reference Ochwat, Marshall, Moorman, Criscitiello and Copland2021). A series of studies from the accumulation zone of Lomonosovfonna, Svalbard showed high-spatial variability in ice lens stratigraphy (Marchenko and others, Reference Marchenko2017a) and water content in the firn (Marchenko and others, Reference Marchenko, van Pelt, Pettersson, Pohjola and Reijmer2021). However, it is not clear how these findings from cold settings extend to other glacier settings, for example maritime climates that are characterized by high accumulation, mild temperatures and large melt fluxes. The incomplete understanding of these firn processes across climates and timescales limits the scientific community's ability to accurately quantify the fate and transport of glacier surface melt, and to model these processes accurately.
Firn porosity decreases with depth and time due to firn densification, which can occur due to changes in firn volume or mass. Compaction (vertical strain) is driven by grain-scale processes and viscous deformation due to overburden stress (Morris and Wingham, Reference Morris and Wingham2014). Percolation of meltwater into the porous firn can increase the density without a volume change by adding mass to the firn. Strictly, for firn density (i.e. the solid-ice portion only) to increase via mass influx, percolating meltwater must refreeze in the firn, but firn-density data from wet-firn zones often include the solid and liquid mass components due to the challenges of differentiating those components in measurements.
Firn porosity furthermore can play an important role in geodetic mass-balance calculations. Geodetic methods use repeat measurements of glacier surface elevation to quantify glacier-volume change. Converting these volume-change measurements to mass change requires knowledge of the material density. Previous work (Huss, Reference Huss2013) suggested that a uniform volume-to-mass conversion factor of 850 ± 60 kg m−3 is appropriate for many glacier-volume-change studies but emphasized that this conversion factor is not applicable for short (<5 years) timescales, unstable mass-balance gradients and small volume changes. These limitations are driven primarily by uncertainty in firn densification (i.e. changes in porosity). For example, Ochwat and others (Reference Ochwat, Marshall, Moorman, Criscitiello and Copland2021) showed that local surface lowering of 0.73 m, measured in the accumulation zone over 12 years (~0.06 m a−1) on Kaskawulsh Glacier in the Yukon, can be attributed entirely to firn densification due to compaction with no associated change in mass.
Despite the importance of firn for geodetic glacier mass balance and hydrology of glacierized mountain basins, continuous, long-term direct measurements of firn-density structure and meltwater processes on mountain glaciers do not, to our knowledge, exist. In this paper, we present firn-density and stratigraphy data from cores drilled each spring and fall at a site on Wolverine Glacier, Alaska from 2016 to 2022. We use the data to analyze how the snow and firn density in the accumulation zone of this temperate, high-accumulation glacier evolve on seasonal and interannual timescales. Specifically, we seek to address the following questions: (1) Is densification due to compaction, meltwater refreezing, or both? (2) Is meltwater retained (as liquid or solid), or does it run off, and on what timescale? (3) How does the FAC vary in time, and what are the implications of this variability for geodetic mass balance? Additionally, we examine assumptions about snow and firn-density change that are implicit to using a volume-to-mass conversion factor, and we use our data as an illustrative example to help quantify what constitutes a small volume change when using the 850 ± 60 kg m−3 density conversion factor suggested by Huss (Reference Huss2013).
2. Data and methods
2.1 Setting
Wolverine Glacier is in the Kenai Mountains of southeast Alaska (60.421$^\circ$ N, 148.86$^\circ$
 W; Fig. 1). Its proximity to the Gulf of Alaska gives it a maritime climate. The mean annual temperature at a near-glacier weather station at 990 m elevation from 1968 to 2017 was 0.2$^\circ$
 C, and the annual precipitation was 2.2 m water equivalent (m w.e.), 76% of which fell as snow (Baker and others, Reference Baker, Peitzsch, Sass, Miller and Whorton2019). In 2016 the glacier area was 15.86 km2, the terminus was located at an elevation of ~450 m, and its upper reaches were at 1680 m. The mean equilibrium line altitude (ELA) from 2016 to 2022 was 1271 m (McNeil and others, Reference McNeil2016).
Map of Wolverine Glacier, Alaska (2020 outline) showing elevation hill shade and contours (black lines) in m. The green star shows the location of site EC, and black dots show the locations of mass-balance stakes. The inset map shows glacierized terrain in Alaska (blue) according to the Randolph Glacier Inventory 6.0 (RGI Consortium, 2017) and the location of Wolverine Glacier on the Kenai Peninsula (red dot).

The U.S. Geological Survey began measuring mass balance on Wolverine Glacier in 1966, and measurements have continued to present day (McNeil and others, Reference McNeil2016; O'Neel and others, Reference O'Neel2019). Mass balance is measured with the glaciological method using a network of stakes (Fig. 1, black dots). In addition to the mass-balance measurements, two off-glacier automatic weather stations measure temperature and precipitation, and a stream gage measures basin outflow beyond the terminus of the glacier.
In 2016, a new measurement site, EC, was established in the center of the accumulation zone at 1350 m (Fig. 1, green star). The 2016–22 means of the winter (b w), summer (b s) and annual (b a) point mass balances at EC were +3.35, −1.95 and +1.40 m w.e., respectively (Table 1). The 2016–21 horizontal velocities at EC averaged 17.9 m a−1 (SD = 0.9 m a−1) (McNeil and others, Reference McNeil2019). We did not measure horizontal strain rates at EC, but we estimate the horizontal divergence rate to be a maximum of 0.015 a−1. This is based on velocity measurements at site C, 760 m downstream, which averaged 29.3 m a−1.
Site EC point mass balance in m w.e. (winter balance b w; summer balance b s; annual balance b s) from 2016 to 2022

The values are the balances on the dates the cores were drilled (Table 2) which do not necessarily correspond to the true mass minima and maxima. Mean b w, b s and b a are listed in the final row.
2.2 Firn core data
Since 2016, firn cores to ~25 m depth have been recovered at EC at the end of the accumulation season (typically late April/early May, referred to herein as spring cores) and end of the melt season (typically early September, referred to herein as fall cores). Table 2 lists the dates the cores were drilled and each core's maximum depth.
Site EC firn core dates and depths from 2016 to 2022
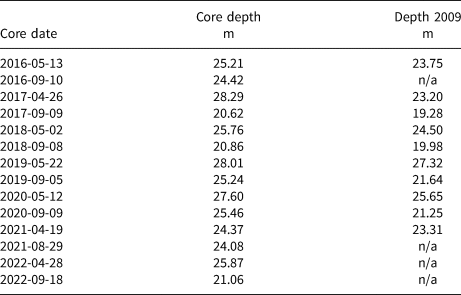
Core date is the date the core was drilled, core depth is the depth of the core bottom below the surface and depth 2009 is the depth of the 2009 horizon, listed as n/a where it was not identified. Additional cores were drilled in summer 2016 (2 June, 12 July, 16 August) and summer 2017 (16 June, 22 July) but those are not used in the present analyses.
Each firn core was drilled using a FELICS drill (Ginot, Reference Ginot2002) and processed in the field for density, presence of ice lenses and annual layering. We conducted density measurements by measuring each core section's volume and mass. We calculated volume by measuring the length of each recovered core section. The core diameters were highly consistent; we measured the diameter of random core sections to verify the consistency. Long (up to 1 m) sections of recovered core were cut into shorter sections and measured. The resulting depth–density profiles have a vertical resolution of ~30 cm.
The cores were also visually inspected to record the depth and thickness of ice lenses. We identified any dusty or dark layers in the firn, which were interpreted as end-of-melt season horizons, that is the surfaces at the end of previous melt seasons. We refer to the most recent melt season's horizon as the previous summer surface (PSS). Annual layers were sometimes difficult to identify, thus not all years’ horizons were visible in all cores. In many of the cores, a discrete layer of tephra from a series of volcanic eruptions of Redoubt Volcano in spring 2009 (Wallace and others, Reference Wallace, Schaefer and Coombs2013) was clearly visible. Table 2 lists the 2009 horizon depths for the cores in which it was identified. Ice lens stratigraphy is not analyzed in this paper but is included in the firn-core data set (Stevens and others, Reference Stevens2023).
In post-field processing, we calculate the cumulative snow and firn mass (i.e. the snow-water equivalent, SWE, with unit m w.e.) as a function of depth, and the FAC (unit m), which is the sum of the firn's porosity ϕ between depths z 1 and z 2, given by

where ρ i is the ice density (900 kg m−3) and ρ(z) is the firn density at depth z. Change in FAC is the pertinent quantity for converting a measured elevation (volume) change to mass change. We use the same equation and change the nomenclature to snow air content (SAC) to refer to the air content in the seasonal snow.
There is uncertainty in the density calculations from volume and mass measurements. Core sections often break unevenly and core diameters may vary slightly, which we estimate add uncertainties of ±1 and ±0.1 cm to the core length and diameter measurements, respectively. We estimate the mass measurements have uncertainty of ±5 g based on the gradation of our scale. These uncertainties yield a density uncertainty on a typical core section (e.g. 30 cm long, 500 g mass, 5.7 cm diameter) of ~8% (and thereby FAC and SWE uncertainties for that section of ~8%). If we assume that these measurement errors are random, the uncertainty in the FAC and SWE of the full firn column is ~1.1%, based on the standard error. If the measurements are correlated, the uncertainty in the full-column FAC and SWE is 8%. We use this conservative assumption in reporting our results. The positions of the annual horizons have very little uncertainty (estimated 2 cm) because they are identified by dirty layers. The depth of the bottom of the borehole is measured on every drilling drive, and the positions of the identified horizons are measured as the distance above the core section bottom, which corresponds to the borehole bottom. There is virtually no uncertainty in identifying the year of the horizons; given the mass and thickness of annual layers at EC, we can be confident in assigning a year to dirty layers because we know the mass of firn above it, which corresponds closely with the sum of the ensuing years’ accumulations.
We do not have concurrent core data from sites near EC that would allow us to quantify the uncertainty in our measurements due to spatial variability. We expect that this uncertainty is small, because EC was chosen to minimize spatial variability in accumulation magnitude. Ground-penetrating radar surveys showed that there is <5% accumulation variability over the 300 m upstream of EC (McGrath and others, Reference McGrath2018). The site is near the middle of a large planar area, the surface slope is low, there are few slope aberrations and there are no crevasses nearby. As such, we do not expect substantial uncertainty due to the fact the firn in our cores has flowed from upstream.
2.3 Firn core comparisons
Research on the dry-snow zone of ice sheets often cannot carefully delineate between snow and firn because there is not a clear stratigraphic boundary between the two. Here, we use ‘snow’ to refer to material from the most recent accumulation season and ‘firn’ to refer to the material that lasted through a melt season (i.e. snow that did not melt during the previous melt season and had new snow accumulated on top of it). For our fall cores, we consider the remaining snow to be firn and refer to it as ‘new firn’ for clarity.
The term ‘layer’ can be vague in the context of firn and snow science. Here, we use the term ‘temporal layer’ to refer to the firn between two isochrones. For example, the firn between the 2017 fall surface and the 2009 Redoubt horizon is the 2017–2009 temporal layer. Temporal layers advect downward relative to the surface, meaning that they exist within a material-following (Lagrangian) reference frame. Alternatively, we refer to the firn between two fixed depths as a parcel of firn. Parcels of firn exist in a fixed (Eulerian) reference frame. We use the term ‘horizon’ in both contexts, to refer either to the firn at a specific depth or to a specific isochrone; for example the 5 m horizon or 2017 horizon.
We leveraged the depth–density and depth–age data to examine firn evolution both in the Lagrangian and the Eulerian frameworks. The Lagrangian method is useful for tracking how the firn changes on seasonal timescales and how discrete temporal layers evolve through time. The Eulerian method is useful for tracking changes in the firn's bulk properties on interannual timescales.
For the Lagrangian approach, we identified the temporal layers bound by the 2009 Redoubt horizon and the PSS in the spring and fall cores. We used the data to analyze how temporal layer mass, thickness and density evolve over the course of a melt season. In some cases, we were also able to identify temporal horizons from years prior to the previous season (e.g. we identified the 2016 horizon in the core from fall 2018), which provide a record of temporal-layer evolution on annual to multi-year timescales.
In the Eulerian approach, we used the 7 years of cores to examine how the air content in parcels of snow and firn changes on interannual timescales. This method has been used in numerous other studies (e.g. Vandecrux and others, Reference Vandecrux2019; Rennermalm and others, Reference Rennermalm2022) to investigate firn changes on ice sheets, but this type of analysis has not been frequently applied to mountain glaciers, likely because of the lack of data.
3. Results
3.1 Firn densification
We first examine firn densification using the layer-tracking (Lagrangian) method. Figure 2 shows EC firn depth–density profiles from the spring and fall cores of 2017, 2018, 2019 and 2020. In each of those cores we identified the 2009 Redoubt horizon as well as the previous year's end-of melt-season horizon, except for spring 2019, when we did not identify the 2009 horizon. To plot the spring 2019 core, we estimate the depth of the 2009 horizon by assuming that the thickness of the 2018–2009 layer did not change during summer 2019. Using the temporal layers delineated by these age horizons (Fig. 2), we track firn-density evolution over seasonal and annual timescales.
Spring (blue) and fall (orange) depth–density profiles for 2017 (a), 2018 (b), 2019 (c) and 2020 (d). Height (y-axis) is plotted relative to the 2009 horizon. Horizontal lines denote the height of annual horizons identified in the cores, and the dashed horizontal line shows the location of the fall surface. Vertical colored lines illustrate temporal layers defined by the 2016 and 2009 annual horizons (A1, red) and the 2018 and 2009 annual horizons (A2, purple). The asterisk on the 2019.05.22 core indicates that the 2009 Redoubt horizon was not identified in the spring 2019 core.

3.1.1 Seasonal timescales
Table 3 shows the temporal layer thickness, mass and density between the 2009 horizon and the PSS for the 2017 (referred to as layer S1), 2018 (S2) and 2020 (S3) cores in spring and fall and how those quantities changed over the course of the summer melt season. The layer thicknesses decreased during summer 2017, 2018 and 2020 by −0.16, −0.03 and −0.22 m, respectively. The layer masses increased slightly in 2017 and 2020 (+0.26 and +0.33 m w.e.), ostensibly due to retention of surface meltwater and rain. The combined compaction and mass gains yielded summer firn density increases in the PSS-2009 layers of +22 and +25 kg m−3 in summers 2017 and 2020, respectively. Note that we are considering the density to include liquid and solid mass.
Temporal layers tracked over seasonal (S1, S2, S3) and annual to multi-annual (A1, A2) timescales

Annual horizons defining the top and bottom each layer are listed, e.g. seasonal layer 1 (S1) is bounded by the PSS and the 2009 horizon. The year corresponding to the PSS is listed in parentheses. Note that S1 is identical to A1 on 2017.09.09.
The mass increases observed in S1 and S3 are <20% of the surface meltwater mass fluxes. However, the horizontal divergence we estimate for EC (1.5 × 10⁻² a−1) is large enough that we expect it to contribute to layer thinning (Horlings and others, Reference Horlings, Christianson, Holschuh, Stevens and Waddington2021). This layer thinning should not, in theory, contribute to density change (Oraschewski and Grinsted, Reference Oraschewski and Grinsted2022), and thereby it will effectively reduce the mass in the firn layers. A simple calculation based on the method of Horlings and others (Reference Horlings, Christianson, Holschuh, Stevens and Waddington2021) suggests this mass reduction should be ~1.5% a−1, or 0.5% over the course of a 4 month melt season. For S1 and S3, 0.5% mass decreases amount to ~0.059 and 0.075 m w.e., respectively. If we account for this theoretical mass loss from thinning (noting that our data do not enable us to definitively state that it occurred), the mass increases from retention are 23% (S1) and 21% (S3) of the surface meltwater mass fluxes.
Our measurements show that in summer 2018 the mass of the PSS-2009 layer decreased by −0.09 m w.e., resulting in a density decrease of −3.82 kg m−3. This slight mass loss falls within measurement uncertainty, but if real could be attributed to horizontal divergence, draining of liquid water that was present in the spring, or spatial variability.
The small mass changes that we observe in the temporal layers over the course of a summer are less than the range of uncertainty for the measurements, which means that we cannot say with certainty that mass changes in the layers occurred. Regardless, our measurements indicate that net mass increases in the firn due to meltwater retention during summers at EC is minimal (<3%; Table 4).
Thickness, mass and density change of the temporal layers

The time period (Δt) over which we calculate thickness, mass and density change is demarcated by core date 1 and core date 2.
3.1.2 Annual timescales
We also quantify how the thickness and mass of temporal layers change over the course of annual timescales by identifying common temporal layers in multiple fall cores. We identified the 2016 horizon in the fall 2017, 2018 and 2020 cores, which we refer to as temporal layer A1 (red vertical line in Fig. 2). Similarly, we identified the temporal layer bounded by the 2018 and 2009 horizons (referred to as A2; purple vertical line in Fig. 2) in fall 2018, 2019 and 2020. Table 3 shows the thickness, mass and density of A1 and A2 on each observation date, and Table 4 shows how those quantities changed between observations.
From fall 2017 to fall 2018, the thickness of A1 decreased from 17.08 to 16.1 m (−6.1%), and the mass in the layer decreased from 12.04 to 11.74 m w.e. (−2.6%), yielding a density increase of 24 kg m−3 (1%). The fall 2018 mass is near the spring 2017 mass (11.78 m w.e.), suggesting minimal meltwater retention on an annual timescale. In the 2 years from fall 2018 to fall 2020, the thickness decreased further to 14.93 m (−7.9%) and the mass increased slightly to 11.85 m w.e. (+1.0%), netting a density increase of 65 kg m−3 (8.9%). In the 3 years between the first and last fall observations of A1, the thickness decreased by 14% and the mass decreased by 1.6% (Table 4). The density increase in those 3 years was 89 kg m−3 (12.6%).
The first fall observation of A2, unlike A1, extended all the way to the surface and thus included the new firn. This difference is because the 2009 horizon was not identified in the 2016 cores. In the first time interval from fall 2018 to fall 2019 (for which there is no congruent A1 observation), the mass of A2 increased from 14.06 to 14.5 m w.e. (+3.0%) and the thickness decreased from 19.98 to 18.85 m (−6.0%), for a density increase of 65 kg m−3 (9.2%). However, like A1, we observed net thinning and mass loss in A2 on multi-year timescales. From fall 2019 to fall 2020, the thickness decreased to 17.91 m (−5.3%) and the mass decreased to 13.94 m w.e. (−4.0%), yielding a density increase of 10 kg m−3 (1.3%). In the 2 years between the first and last fall observations of A2, the thickness decreased by 11.6% and the mass decreased by $-0.9\%$ , netting a density increase of 75 kg m−3 (10.7%).
As mentioned above, we expect horizontal divergence to reduce the mass in the layers. While our data do not allow us to precisely calculate this mass loss and thusly the mass of meltwater retention in A1 and A2 on yearly and longer timescales, the relatively small mass changes (and net losses on 2 to 3 year timescales) are within the range of uncertainty. As with the seasonal layers, this suggests that there is minimal retention of meltwater on year and longer timescales. The decreases in the thicknesses of A1 and A2 and the relatively small changes in layer mass indicate that the densification at EC is due primarily to vertical strain driven by overburden stress.
3.2 Snow meltwater retention
We next examine densification of the parcel of seasonal snow that persists through the melt season, that is the new firn. We illustrate our definition of this seasonal-snow stratigraphy using the spring and fall 2018 cores (Fig. 3). In fall 2018, there was 1.64 m of snow above the PSS, defining the parcel of seasonal snow that we inspect for snow meltwater retention. To facilitate comparison between the spring and fall cores, we make an endmember assumption that there was no vertical compaction within the seasonal snow parcel (new firn) during the summer. The mass of this parcel increased from 0.87 m w.e. to 0.96 m w.e., and its density from 528 to 586 kg m−3 over the 2018 summer melt season (Table 5).
The 2018 spring and fall depth–density profiles with height plotted relative to the PSS. The shaded area shows the parcel of seasonal snow that remains in the fall, highlighting the density increase that occurs in the summer.

Mass and density of the parcel of seasonal snow between the PSS and the fall snow height horizon for each year of observation

Fall snow height is the height of the surface above the PSS at the end of summer, shown in as the shaded region in Figure 3.
To estimate the upper limit of meltwater retained in the seasonal snow, we repeated this process of assuming no vertical compaction within the seasonal snow parcel for each year of observation. Mass and density in the seasonal snow parcels increased from spring to fall in all observed years (Table 5). With our zero-compaction assumption, changes in density are entirely due to mass change. As such, the observed mass increases in the seasonal snow parcels are an upper limit on the meltwater volume that has been retained.
To estimate the lower limit of meltwater retained in the seasonal snow, we use the theoretical irreducible saturation S wi of 7% of porosity (Colbeck, Reference Colbeck1974), calculated using the spring density. The irreducible saturation ranges from 0.04 to 0.11 m w.e. (Table 6). This lower limit of meltwater retention accounts for only 2–6% of the seasonal meltwater budget (b s). This suggests that up to 98% of the meltwater influx into the new firn is free liquid water that can either refreeze, fill the pore space beyond the irreducible saturation, or drain.
Meltwater characteristics of the parcel of seasonal snow between the PSS and the fall snow height horizon for each year of observation (i.e. the new firn)

S MI is the estimated mass (m w.e.) of irreducible saturation (7% of spring porosity). The second column shows S MI as a fraction of the summer meltwater production b s. The third column shows the observed mass increase as a fraction of the summer meltwater production.
Table 6 shows that the mass increases observed in the seasonal snow parcels were between 4 and 15% of the summer meltwater (b s). This suggests that a majority (>85%) of the summer meltwater production either percolates downward below the PSS into the firn or flows laterally out of the snow. As the firn below the PSS retains up to ~25% of the seasonal meltwater flux (Section 3.1.1), our results suggest that at least 60% of the meltwater at EC runs off from the site during the summer it is produced. Our data do not allow us to determine whether this liquid runs off laterally to be retained elsewhere in the firn or englacially, or if it runs off from the glacier entirely.
The above calculations are made under the assumption that the only liquid water input is from surface melt (i.e. the available liquid water flux equals b s). In reality, site EC also receives liquid input from rainfall, and potentially from summer snowfall that subsequently melts (and is thereby not included in calculations of b s). Although we do not have reliable data of how much rain fell at EC, considering the addition of rain as liquid input in the above analyses would corroborate our finding that a majority of the liquid input (i.e. melt and rain) is evacuated from the site during the summer.
3.3 Air content evolution
We next examine the evolution of snow and air content at EC using the Eulerian approach, that is in the snow and firn between fixed depth horizons. Table 7 shows the fall and spring SAC and FAC for several snow and firn parcels and the summary statistics. We refer to the sum of the FAC and SAC from the surface or the PSS depth Z PSS (i.e. z 1 = 0 or z 1 = Z PSS in Eqn (1)) to depth Z (z 2 = Z in Eqn (1)) as FACZ; Table 7 indicates whether the upper horizon is the surface or the PSS.
FAC and SAC for the spring and fall cores

All units are in m. Column headers specify the season, whether the value is SAC or FAC, and the upper and lower horizons of the parcel used to calculate the air content. The lower horizon of the FAC columns is the depth below the PSS except for FAC20, which is the depth below the surface. Fall and spring FAC15 is the sum of the air content from the surface to 15 m below the PSS, including SAC. SD is standard deviation.
Figure 4a shows the depth–density profiles of the seven spring cores. The blue line shows the parcel ranging from the surface to the PSS. The porosity in this parcel comprises the spring SAC. Note that the thickness of this parcel varies each year (i.e. the blue line is an example but not representative of all years). The orange line shows the parcel ranging from the PSS to 15 m below the PSS. We highlight this parcel for the spring cores because all spring cores extended at least 15 m beyond the PSS except for the 2016 core, which was drilled to 14.75 m below the PSS. An additional 25 cm of firn at this depth adds a negligible amount (~0.01 m) of FAC.
Depth-density profiles from firn cores in spring (a) and fall (b). The spring cores are plotted relative to the PSS (0 = PSS), and the fall cores are plotted relative to the glacier surface (0 = fall surface). Horizontal grayscale lines in (b) show the PSS for each year, corresponding to the legend in panel (a). Vertical blue, orange and green lines in (a) and (b) show the depth intervals where air content was calculated. Spring SAC is calculated from the surface to the PSS (a; blue), spring FAC is calculated from the PSS to 15 m depth below the PSS (a; orange) and fall FAC is calculated from the surface to 20 m depth (b; green). (c) Spring snow (blue), spring firn (orange) and fall firn (green) air content, with error estimates, at site EC.

The spring SAC from the surface to the PSS had a mean value of 3.5 m. This is a similar magnitude to the spring FAC from the PSS to 15 m below the PSS, which had a mean value of 3.4 m. However, the SAC varies substantially more through time (SD = 0.8 m; blue dots and line in Fig. 4c with ±8% error bars) than the FAC (SD = 0.2 m; orange dots and line in Fig. 4c with ±8% error bars). This is due to interannual variability in the depth of the snow, which ranged from 5.3 m in 2020 to 10.5 m in 2016. The bulk density of the spring snow ranged from 437 kg m−3 in 2017 to 494 kg m−3 in 2019. This is illustrated by the snow depth–density data above the PSS in Figure 4a.
Figure 4b shows the depth–density profiles for the seven fall cores. The green vertical line shows the parcel spanning the surface to 20 m below the surface. The air content in that parcel (FAC20) approximately represents the air content of the entire snow and firn column, as the density at 20 m depth was typically near 900 kg m−3. The mean FAC20 (green dots and line in Fig. 4c with ±8% error bars) from 2016 to 2022 was 4.0 m, and the SD was 0.4 m.
The horizontal grayscale lines in Figure 4b show the PSS depth for each core and highlight the variability in the depth of the snow remaining at the end of summer (i.e. the new firn). We refer to the air content in this new firn as fall SAC. The mean fall SAC was 0.8 m, less than half of the mean spring SAC of 3.5 m. This suggests that, on average, 2.7 m of the spring SAC disappears due to melt removing material and densification reducing porosity.
We also calculate the air content from the surface to 15 m below the PSS for spring and fall (FAC15) to understand seasonal variability of firn porosity considering both snow and deeper firn. The mean spring FAC15 was 6.9 m, and the mean fall FAC15 was 3.8 m. Although there is additional air content below the lower horizon, these statistics provide an approximation of the seasonal variability in full-column air content. On average, spring FAC15 is 1.8 times greater than fall FAC15.
There is no temporal trend in spring SAC, spring FAC or fall FAC (Fig. 4c) from 2016 to 2022.
4. Discussion
4.1 Firn densification and meltwater retention
Our data suggest that up to 40% of the summer meltwater can be retained each summer at EC, partitioned between the snow (4–15%) and the firn (up to 25%). This indicates that a portion of summer meltwater percolates below the PSS, and that there is temporary meltwater storage above the irreducible saturation in the snow and firn. As evidenced by the presence of ice lenses in the firn cores, some of this water refreezes when the winter cold wave diffuses through the firn before new (dry) accumulation insulates the firn from cold surface temperatures. However, the observations also show that the mass in temporal layers decreased on annual timescales. This mass decrease can be explained by horizontal divergence fluxing mass out of the firn column. Additionally, we might expect progressive drying out of the firn through time due to drainage (when liquid water content is above the irreducible saturation) and to decreasing pore space (which decreases the irreducible saturation and thusly the volume of liquid retained).
The mass decreases we observe in the temporal layers between one fall and the next suggest that there is little or no sustained meltwater retention in the firn at site EC (either as liquid or refrozen mass). The firn may temporarily retain a meltwater volume greater than the irreducible saturation if meltwater is flowing into the firn faster than the firn's hydrologic network can remove it, but drainage of any excess liquid will occur over time due to gravity-fed drainage and pore space reduction (which reduces the irreducible volume). This result implies that on annual and longer timescales, densification in the firn is primarily driven by vertical strain (compaction) rather than mass addition from surface meltwater and rain.
Measuring mass balance using snow and firn cores only measures the total mass, that is it does not differentiate between liquid and solid mass. Our measurements suggest that the liquid component at site EC is mostly a transient mass addition. Previous research (e.g. Trabant and Mayo, Reference Trabant and Mayo1985) has focused on calculating the mass of internal accumulation resulting from ice lens formation. Our results show that despite the ice lenses adding mass as internal accumulation, at EC as much or more mass leaves the firn column from horizontal divergence and net runoff of liquid than is added as internal accumulation. That is, the mass of any internal accumulation is less than the sum of mass loss from runoff and horizontal divergence. This finding shows that the firn at EC is temperate and far downslope from the percolation/wet-snow zone boundary. More broadly, this suggests that transient meltwater storage in end-of-season snow (i.e. the new firn) can potentially lead to overestimation of annual mass balance on mountain glaciers in the wet-firn zone, as glaciological measurements in the wet-firn zone are likely to include some amount of liquid water, which may later drain from the firn. On colder glaciers or at higher elevations we would expect that internal accumulation below the PSS would increase, and eventually outweigh transient meltwater storage.
We do not see evidence of a perennial firn aquifer at EC. Aquifers have been reported on Kaskawulsh Glacier in the Yukon (Ochwat and others, Reference Ochwat, Marshall, Moorman, Criscitiello and Copland2021) and observed in other high-accumulation/high-melt areas such as in southeast Greenland (Forster and others, Reference Forster2014) and Svalbard (Christianson and others, Reference Christianson, Kohler, Alley, Nuth and Pelt2015), though these have typically been found at greater depths (e.g. 35 m on Kaskawulsh) than the close-off depth at EC (~20–25 m). The presence of aquifers or changes in aquifer size have the potential to store significant mass that is not accounted for in geodetic or glaciological mass-balance measurements. Site EC has a 2$^\circ$ slope, and as such there is likely a hydraulic gradient sufficient to drive meltwater flux. Density profiles consistently indicated that we cored past pore close-off (assuming a pore close-off density of ~830 kg m−3), so it is unlikely that there is substantial additional water storage below our cores. This does not preclude the possibility of firn aquifer formation elsewhere on Wolverine Glacier. However, given the characteristics of site EC and Wolverine Glacier it seems unlikely that any firn aquifer elsewhere on the glacier could have a significant extent. The potential for firn aquifers on similar temperate mountain glaciers is likely limited to small features, but this does not negate the possibility that larger aquifers may exist on glaciers with larger, flatter and less crevassed accumulation zones with similar thermal regimes, or on glaciers with higher elevation or otherwise colder accumulation zones.
Firn densification at EC occurs mostly due to compaction. As mentioned, some portion of meltwater does refreeze into ice lenses, which increases layer mass and density, but broadly the masses of the temporal layers are relatively constant on the seasonal and annual timescales we measured, with changes in mass never exceeding 15% of the summer meltwater that drains from the surface (Table 3). Layer thinning is likely dominated by vertical strain from overburden stress, but horizontal divergence also contributes. Our data do not allow us to resolve firn compaction rates on finer vertical and broader spatial scales to understand how this finding relates to temperate firn in other settings, but research on the compaction rate of temperate firn and how percolating water affects that rate is needed to improve firn modeling on mountain glaciers and on ice sheets, where the wet-snow zone is increasing in size.
The uncertainty in our measurements has the potential to change the values we report but does not change the broader conclusions we draw from the data. Measurements of age-horizon depths are certain due to the clear distinction of past summer surfaces, and therefore we expect relatively small uncertainty in the layer thickness changes we observe. However, there is temporal variability in the rates (e.g. layer S2 thinned by a much smaller percentage than S1 and S3), which we attribute to horizontal spatial variability in the snow surface (e.g. sun cups) that is buried at the end of the melt season. Still, the data show that layer thicknesses decreased in all instances, consistent with what is expected due to firn compaction and horizontal divergence. There is also likely horizontal spatial variability in temporal layer mass due to small-scale variability in accumulation rates, surface features and meltwater refreezing upstream of EC. Given the characteristics of the glacier near EC (Section 2.2) and the relative consistency in the temporal layer masses, we expect this variability to be small.
In the seasonally tracked temporal layers (S1, S2 and S3), the mass changes are within the measurement uncertainty (8%). We therefore cannot rule out the possibility that during the summers the mass of the snow and firn does not change at all (or that it retains more than 40% of the summer meltwater and rainfall). The small mass changes we observe on 1 year and greater timescales are also within the uncertainty. That we consistently observe that mass changes in layers are small strongly suggests that meltwater is not being retained as liquid or internal accumulation. Further research at additional sites and on additional glaciers would help quantify the volume and timescales of meltwater retention and runoff on mountain glaciers.
4.2 FAC variability and geodetic volume-to-mass conversion
Our data show that there is no trend in snow and FAC at site EC between 2016 and 2022 but that it varies on seasonal and interannual timescales. Fall-to-fall elevation changes at EC of 1 m can be attributed entirely to FAC variability (Table 5). These results illustrate the challenges that can arise using geodetic measurements to calculate glacier mass balance, because substantial changes in air content can affect the material density assumptions used to translate elevation change to mass change. In this section, we analyze the assumptions about FAC change that are implicit when using a fixed density conversion factor to convert glacier volume change to mass change (e.g. Huss, Reference Huss2013). We then use our FAC data from EC to illustrate how knowledge of FAC variability can better constrain the uncertainty in the conversion factor.
Converting volume change to mass change requires knowledge of the material density change. Many geodetic mass-balance studies (e.g. Brun and others, Reference Brun, Berthier, Wagnon, Kääb and Treichler2017; Zemp and others, Reference Zemp2019; Shean and others, Reference Shean2020; Jakob and others, Reference Jakob, Gourmelen, Ewart and Plummer2021; Jakob and Gourmelen, Reference Jakob and Gourmelen2023) use a fixed density conversion factor f ΔV (Huss, Reference Huss2013) to convert glacier volume change ΔV to mass change ΔM:

Huss (Reference Huss2013) suggested that f ΔV = 850 ± 60 kg m−3 for a wide range of conditions. Physically, f ΔV is the average density of the volume change over the glacier, and using a fixed value for f ΔV is therefore an estimate of the average density of volume change.
At the point scale, a measured height change Δh on the glacier surface can be converted to point mass change Δm if the change in FAC, ΔFAC, is known:

where ρ i is the ice density, assumed to be 900 kg m−3, and da is the area (Horlings and others, Reference Horlings, Christianson, Holschuh, Stevens and Waddington2021), which in altimetry studies could be the pixel size or in point balance measurements the area over which the measurements are considered representative.
Equation (3) can be integrated over the glacier area to calculate total glacier mass change (assuming the existence of gridded height-change and FAC-change data). This method is often used to convert altimetric elevation measurements to mass change at the ice-sheet scale (e.g. Medley and others, Reference Medley, Neumann, Zwally, Smith and Stevens2022). Equating the integrated Eqn (3) with Eqn (2), f ΔV can be related to the average glacier height change $\Delta \overline {h}$ and average FAC change over the glacier $\Delta \overline {{\rm FAC}}$
 :
:

The full derivation of Eqn (4) from Eqns (2) and (3) is included in Appendix A.
Equation (4) shows that the conversion factor method implies a linear relationship between surface elevation change and FAC change (Fig. 5). Specifically, with f ΔV = 850 kg m−3, it is implied that for a −1 m glacier-wide mean elevation change, $\Delta \overline {{\rm FAC}}$ changes by −0.055 m. With f ΔV = 790 kg m−3 and $\Delta \overline {h} = -1$
 m, the implied $\Delta \overline {{\rm FAC}}$
 is −0.12 m. A ${\Delta \overline {{\rm FAC}}}/{\Delta \overline {h}}$
 ratio of >12% will lead to f ΔV being <790 kg m−3. Note that Eqn (4) is independent of the timescale. Also note that if there is snow on the glacier, $\Delta \overline {{\rm FAC}}$
 includes FAC and SAC.
Graphical representation of Eqn (4) shows the theoretical relationship between FAC change, height change and density conversion factor f ΔV used in geodetic mass-balance studies. Red lines show the 850 kg m−3 value (solid) and ±60 kg m−3 error bounds (dashed) of f ΔV suggested by Huss (Reference Huss2013). The plot shows the mean FAC change ($\Delta \overline {{\rm FAC}}$ ) implied by different values of mean height change ($\Delta \overline {h}$
 , grayscale) and f ΔV. The plot only shows negative theoretical height changes; positive height changes would be symmetric about the y-axis at $\Delta \overline {{\rm FAC}} = 0$
 .
.

The implicit assumption of a positive correlation between $\Delta \overline {{\rm FAC}}$ and glacier-wide mass balances is likely good, especially for large $\Delta \overline {h}$
 , which typically corresponds with long timescales. However, FAC is only one contributing factor to the glacier-wide average surface elevation and can vary independently of $\Delta \overline {h}$
 . For example, FAC at EC increased from 2020 to 2022 despite negative glacier-wide mass balances. Huss (Reference Huss2013) specifically identified conditions in which using a conversion factor of 850 ± 60 kg m−3 is appropriate. These are, ‘in the case of periods longer than 5 years, with stable mass-balance gradients, the presence of a firn area, and volume changes significantly different from zero’. The range in $\overline {{\rm FAC}}$
 for a glacier represents how much the surface elevation can be expected to change due to air content change rather than mass changes, and this range can be used in Eqn (4) to quantify how large a volume change must be for ±60 kg m−3 to be a reasonable estimate of uncertainty in the conversion factor. We use our FAC measurements from EC to illustrate.
For example, assume that the range in fall FAC (~1 m) observed at EC from 2016 to 2022 is representative of mean FAC change in Wolverine Glacier's accumulation area, and that its accumulation-area ratio (AAR) is 0.5. Then, the estimated $\Delta \overline {{\rm FAC}}$ is 0.5 m. Inserting this value into Eqn (4) shows that $\Delta \overline {h}$
 must be at least 4.1 m for the ±60 kg m−3 uncertainty in $\Delta \overline {{\rm FAC}}$
 to be a conservative estimate. That is, a ‘volume change significantly different from zero’ for Wolverine Glacier is at minimum ±4.1 m for ±60 kg m−3 to be an accurate assessment of the uncertainty. Broadly, the density component of a geodetic uncertainty for any glacier is likely too small if it is less than the plausible range in $\overline {{\rm FAC}}$
 for that glacier. For our example on Wolverine Glacier, with a range in FAC of 1 m and an AAR of 0.5, a geodetic mass balance has an uncertainty of ±0.5 m attributable to FAC variability, independent of the timescale or magnitude of the height change.
Equation (4) can be used to estimate the uncertainty in $\Delta \overline {{\rm FAC}}$ as a function of $\Delta \overline {h}$
 for any glacier if the AAR and FAC variability in the accumulation zone can be estimated. Figure 5 is a parameter space plot for Eqn (4) showing the relationship between average glacier height change, average FAC change, and the density conversion factor. The 850 ± 60 kg m−3 conversion factor encompasses a wide range of average FAC changes when $\Delta \overline {h}$
 is large and negative. When $\Delta \overline {h}$
 is small and negative, the appropriate density conversion factor is often <790 kg m−3. The right side of Figure 5 shows that large height decreases accompanied by modest $\overline {{\rm FAC}}$
 increases require f ΔV > 910 kg m−3. It is unlikely that $\Delta \overline {{\rm FAC}}$
 and $\Delta \overline {h}$
 would have opposite signs on long timescales (i.e. that average FAC would increase while the overall glacier thins), but it is quite possible on shorter timescales for this to be the case.
Our analyses do not suggest that use of the 850 kg m−3 conversion factor is incorrect; rather, they underscore that the commonly used ±60 kg m−3 uncertainty is not universally appropriate. For glaciers with small accumulation areas, low snowfall variability, or large height changes, ±60 kg m−3 may be an overly conservative estimate of uncertainty. For glaciers with larger accumulation areas and significant snowfall variability, which likely includes many glaciers with maritime climates, ±60 kg m−3 is likely too small an estimate of the uncertainty unless accompanied by average height changes of several meters or more. The uncertainty in geodetic mass change calculations for these glaciers must be considered carefully.
We acknowledge that using Eqn (4) to calculate geodetic mass change uncertainty presents practical challenges because the FAC variability must be known or estimated. At present, measurements of firn density on mountain glaciers spanning a variety of climates are lacking. Drilling firn cores is time and labor intensive at a single site, and accurately estimating FAC variability across a glacier's accumulation area may require cores from numerous sites. Future efforts might be able to use radar measurements to estimate density at high-spatial resolution (e.g. McGrath and others, Reference McGrath2022). Numerical firn-densification models have been applied widely on the ice sheets (e.g. Medley and others, Reference Medley, Neumann, Zwally, Smith and Stevens2022) to correct altimetry measurements for FAC change, and have shown promise in simulating firn evolution on mountain glaciers (e.g. Marchenko and others, Reference Marchenko2017b; Ochwat and others, Reference Ochwat, Marshall, Moorman, Criscitiello and Copland2021). The ability of current firn models to accurately predict FAC change on a high-spatial resolution grid has not been tested, but is worthy of future study. Even without producing a gridded FAC change product (which would allow us to use Eqn (3) and negate the need for a density conversion factor), firn models may be able to produce accurate estimates of glacier wide FAC change and variability, which could allow for glacier-specific conversion factors or glacier-specific uncertainty bounds. Alternatively, it may be possible to develop parameterizations to estimate FAC variability given a glacier's geometry and recent climate history, though this would necessitate compiling firn core data from glaciers spanning a variety of climates. Likewise, it may be possible to coarsely estimate FAC variability given the AAR (which can be estimated using aerial imagery), accumulation rate and melt rate of a glacier, which would provide a rough estimate of the uncertainty bounds on a geodetic mass change calculation. Despite the challenges of calculating FAC, our analyses demonstrate the need for increased knowledge of firn evolution on mountain glaciers to better calculate mass balance using geodetic methods.
The multi-meter variability in the SAC (Fig. 4; Table 7) at EC demonstrates the potential perils of differencing DEMs that were not collected at or near the end of the melt season. Our results show the SAC interannual variability is a similar magnitude to the underlying FAC, but the SAC is transient. This could substantially affect geodetic mass-balance estimates derived from elevation data collected in different seasons (e.g. one DEM acquisition from a spring and one from a fall), where one may have substantial air content due to the presence of seasonal snowfall, even on timescales >5 years. A worst-case scenario would be using elevation data collected in a fall that had low FAC and calculating a geodetic mass balance using data collected in a spring after a large snow year with high SAC (or vice versa). For example, at EC the difference between lowest fall FAC15 and the highest spring FAC15 was 5 m. Although collecting and differencing DEMs in this scenario may be unlikely in practice, it demonstrates how large elevation changes due to air-content change can be.
5. Summary and conclusions
We have presented direct measurements of firn-density evolution from Wolverine Glacier, Alaska collected in the spring and fall seasons from 2016 to 2022. These data are unique among firn observations for their length (7 years) and temporal resolution (spring and fall). Our results demonstrate how firn properties (FAC) and processes (meltwater retention and runoff) can play an important role in glacier mass-balance calculations.
We leveraged annual layer identification in firn cores to investigate how firn in the accumulation zone of a mountain glacier evolves seasonally and interannually. Our results show that the firn at site EC on Wolverine Glacier is in the wet-snow zone. Most meltwater runs off, and as such firn densification is due primarily to compaction. Importantly, end-of-season mass-balance measurements can include both solid ice and liquid water mass that accumulated, but cannot account for any transient liquid water that will drain over time as the new firn is buried by subsequent accumulation. Our measurements indicate that the mass of this water drainage can be equal to or greater than any internal accumulation due to ice lenses. At EC and similar sites (high precipitation, high melt), fall measurements of glaciological mass balance, which typically only measure the mass of the remaining snow at the end of summer, and not the firn below, have the potential to overestimate annual mass gains because they include this liquid water, rather than underestimate mass gains due by omitting internal accumulation as previous authors have suggested.
The firn and snow air content at Wolverine Glacier exhibit substantial variability on a 5 year timescale. This variability has direct implications for geodetic mass-balance calculations, which often use a conversion factor of 850 ± 60 kg m−3 to convert volume change to mass change. Our data illustrate that at Wolverine Glacier, a ‘volume change significantly different from zero’ (Huss, Reference Huss2013) is an average elevation change of at least 4.1 m, and for elevation changes less than that the conversion factor has uncertainties larger than ±60 kg m−3. More broadly, ±60 kg m−3 underestimates the uncertainty in the conversion factor if the glacier-average FAC variability is greater than 12% of the glacier-average height change, regardless of timescale. We suggest that geodetic mass-balance calculations using a density conversion factor should have a minimum uncertainty equivalent to the AAR times the local firn air content variability, which at Wolverine Glacier results in a minimum uncertainty of ±0.5 m regardless of the height change. Further investigations of firn with different accumulation zone characteristics (e.g. further upslope from the equilibrium line altitude on a similar high-accumulation, high-melt glacier) and in different climate zones (e.g. on drier, colder glaciers) are needed. Such studies will improve understanding of the role firn plays in mountain glacier hydrology and reduce uncertainties in geodetic mass-balance calculations.
Data
The firn core data are available at https://doi.org/10.5066/F7610XHQ.
Acknowledgements
We acknowledge the efforts of the many people who helped drill and process firn cores in the field. We acknowledge Shad O'Neel for his contribution in securing support for firn coring on Wolverine Glacier. This research was supported by the U.S. Geological Survey Ecosystems Climate R&D Program. Any use of trade, firm or product names is for descriptive purposes only and does not imply endorsement by the U.S. Government.
Author contributions
C. Max Stevens curated the data, executed data analysis and visualization, and led the manuscript writing. C. Max Stevens, Caitlyn Florentine and Louis Sass interpreted the results. Louis Sass developed the firn-core drilling program. All authors aided in field work to collect the firn core data. All authors contributed to manuscript writing, review and editing.
Appendix A. Deriving the relationship between the density conversion factor and height and mass changes
From Huss (Reference Huss2013), the total (glacier-wide) volume change ΔV is converted to total mass change ΔM with conversion factor f ΔV:

If we assume that the change in glacier area is negligible (i.e. the volume change is due to height change and not areal change at the margins), $\Delta V = \overline {\Delta H}\times A$ , where A is the glacier area and $\overline {\Delta h}$
 is the average height change over the glacier.
The glacier height change at a point j, Δh j, can be converted to mass change Δm j if the change in FAC, ΔFAC j, is known:

where da j is a small area (or could be pixel size in DEM differencing).
To get the total glacier mass change ΔM from Eqn (A2), we integrate the point mass changes over the glacier area:

The average height change over A is the integral of the height changes divided by the area:

The mean FAC change $\overline {\Delta FAC}$ can likewise be calculated by exchanging ΔFAC j for Δh j in Eqn (A4). Recognizing that the denominator in Eqn (A4) equals A,

Substituting Eqn (A5) (for Δh and ΔFAC) into Eqn (A3), we get:

Equating Eqns (A1) and (A6) (substituting $\overline {\Delta h} A$ for ΔV in Eqn (A1)) and rearranging, we get an equation relating the density conversion factor to the mean FAC change and mean height change:


 Open access