

Introduction
Abiotic stresses such as heat, cold, drought and salinity are major constraints to agricultural productivity, with drought being particularly severe in Sub-Saharan Africa due to climate change (Orimoloye et al. Reference Orimoloye, Olusola, Ololade and Adelabu2021). Drought reduces soil water availability, limiting water uptake, cell expansion and photosynthetic activity, thereby causing global yield losses estimated at USD 10 billion annually (Mutava et al. Reference Mutava, Prasad, Tuinstra, Kofoid and Yu2011). In Malawi, where agriculture is predominantly rainfed, 24 of 29 districts are prone to severe drought, leading to substantial yield reductions in staple crops, including common bean (Phaseolus vulgaris L.) (Ricker-Gilbert et al. Reference Ricker-Gilbert, Jumbe and Chamberlin2014; Asfaw et al. Reference Asfaw, McCarthy, Lipper, Arslan and Cattaneo2016).
Common bean is an important source of dietary protein in Sub-Saharan Africa (Rubiales and Mikic Reference Rubiales and Mikic2015; Muhamba et al. Reference Muhamba, Joseph and Tarimo2019), but it is highly sensitive to both drought and nutrient-limited soils, with over 60% of production at risk (Beebe et al. Reference Beebe, Rao, Cajiao and Grajales2008, Reference Beebe, Rao, Devi and Polania2014). Its productivity is further constrained in nutrient-limited soils, which are widespread across the region. Phosphorus deficiency in particular can compound drought susceptibility by impairing root growth, water uptake and photosynthetic efficiency, making combined tolerance to both stresses especially important for smallholder farming systems in Malawi (Suriyagoda et al. Reference Suriyagoda, Ryan, Renton and Lambers2014). Some lines from Latin America and Africa exhibit drought tolerance, either by escaping stress (Harb et al. Reference Harb, Krishnan, Ambavaram and Pereira2010) through early maturity or by tolerating low tissue water content (Qayyum et al. Reference Qayyum, Al, Sher, Bibi, Ahmad, Shen and Jenks2021), but the physiological mechanisms underlying drought tolerance in Malawian common bean lines remain poorly understood.
To elucidate the mechanisms of stress adaptation in Malawian common bean lines, a suite of morphological, physiological and biochemical traits was evaluated. Growth parameters such as shoot and root biomass, leaf area and leaf thickness provide insight into plant water-use strategies and biomass allocation under stress, and have been widely used to characterize drought responses in grain legumes (Poorter et al. Reference Poorter, Niinemets, Poorter, Wright and Villar2009; Yuan et al. Reference Yuan, Yang, Li, Liu and Han2016). Relative water content (RWC) and membrane stability index (MSI) were included as indicators of cellular water retention capacity and membrane integrity under osmotic stress, respectively, both of which are closely linked to drought tolerance (Kamanga Reference Kamanga2024; Thayo et al. Reference Thayo, Kaderu, Mwale, Chimungu and Kamanga2025). Chlorophyll concentration was measured as a proxy for photosynthetic efficiency, as drought-induced reductions in chlorophyll often signal compromised carbon assimilation capacity (Ashraf and Harris Reference Ashraf and Harris2013; Yuan et al. Reference Yuan, Yang, Li, Liu and Han2016). Macro- and micro-nutrient analyses were also conducted, given that ions such as K+ and Na+ contribute to osmotic adjustment and turgor maintenance under water deficit (Munns and Tester Reference Munns and Tester2008; Lu Reference Güler, Sağlam, Demiralay and Kadioğlu2012; Blum Reference Blum2017), while micro-nutrients including Zn2+, Mn2+, Fe2+ and Cu2+ play essential roles in enzyme activation, antioxidant defence and maintenance of cellular metabolism during abiotic stress (Hummel et al. Reference Hummel, Hallahan, Brychkova, Ramirez-villegas, Guwela, Chataika, Curley, Mckeown, Morrison, Talsma, Beebe, Jarvis, Chirwa and Spillane2018). Together, these traits provide complementary mechanistic insight for identifying superior germplasm for drought tolerance breeding programs.
This study, therefore, aimed to identify drought-tolerant common bean lines adapted to low-phosphorus soils in Malawi, elucidate their physiological mechanisms of tolerance and provide a pre-breeding foundation for future improvement programs. To achieve this, the study was designed as a two-phase experiment: first, a large-scale evaluation of 270 common bean lines for tolerance to low soil phosphorus, and second, a focused drought tolerance assessment of 30 selected lines. This staged screening approach enabled the identification of germplasm with combined tolerance to nutrient and water stress. The design differs from our previous work on salinity stress tolerance in 30 common bean genotypes (Thayo et al. Reference Thayo, Kaderu, Mwale, Chimungu and Kamanga2025), as the present study focuses on nutrient–water stress interactions and evaluates a broader set of pre-breeding lines relevant to Malawian production environments.
Materials and methods
Plant materials
A total of 270 common bean (Phaseolus vulgaris L.) lines were used in this study (Supplementary Table S1). The germplasm comprised 99 landraces, 13 local cultivars and 158 pre-breeding lines collected from Malawian breeding programmes and local collections. These lines represent a diverse genetic resource for evaluating tolerance to abiotic stresses. Based on performance under low phosphorus, 30 lines were selected for drought evaluation, consisting of 20 phosphorus-tolerant and 10 phosphorus-sensitive genotypes, of which 1 was a local cultivar, and 29 were pre-breeding lines.
Experimental design
Experiment 1: Screening for tolerance to low soil phosphorus
This field experiment was conducted in 2023 at two sites in Malawi: Mzimba and Mchinji, representing contrasting agro-ecological zones. The objective was to identify lines with differential tolerance to low soil phosphorus. The trial followed a split-plot design with three replications at each site, with phosphorus treatment as the main plot factor and bean genotypes as subplots. Two phosphorus levels were applied as follows: Low phosphorus at 4.68 g per planting station (4.26 g CAN (27% N) + 0.42 g muriate of potash, 60% K) and High phosphorus at 5 g NPK fertilizer (23:10:5) per planting station. Seeds were sown on 30 m2 plots at each site. Plants were harvested 90 days after emergence at physiological maturity. Based on shoot and root growth performance, 30 genotypes showing contrasting responses were selected for further drought evaluation.
Experiment 2: Drought screening and physiological characterization
The drought evaluation involved the 30 selected common bean lines. Experiments were conducted in a greenhouse at the LUANAR Crop and Soil Science Research Farm between 2024 and 2025. The greenhouse provided protection from rainfall and pest infestation while allowing ambient temperature, humidity and light conditions to closely match those of the natural outdoor environment. Because environmental conditions in the greenhouse were not artificially controlled, the experiments were repeated across multiple growing seasons to capture natural temporal variation in drought responses. The objective was to identify drought-tolerant genotypes and elucidate physiological mechanisms underlying stress adaptation. The drought evaluation was conducted in three sequential screening stages between 2024 and 2025 (Supplementary Table S3), each replicated three times. In the first stage (January–March 2024), all 30 selected lines were screened morphologically under drought conditions to identify contrasting genotypes based on shoot dry biomass and stress indices. In the second stage (July–September 2024), 12 lines representing a range of drought tolerance and sensitivity were selected for a more detailed physiological assessment. In the third stage (January–March 2025), three genotypes, two drought-tolerant (Kha 30 and Kha 76) and one drought-sensitive (Chuma), were selected for in-depth physiological and biochemical characterization. Each stage was established and managed as an independent experiment to account for temporal variation in drought responses.
The design was a split-plot with water regime as the main plot factor (control: 65–80% pot water capacity (PWC); drought: 35–50% PWC) and genotypes as subplots. Seeds were planted in 10-L pots with soil, and fertilizer (5% N:10% P:10% K) was applied three days after germination. At 21 days after emergence, plants were subjected to the drought treatments. Soil moisture was monitored daily by weighing pots and adjusting water content as required. PWC was determined following Kamanga (Reference Kamanga2020).
Detailed physiological and biochemical measurements, including macro- and micro-nutrient concentrations, MSI, RWC, chlorophyll content and growth analysis parameters, were conducted exclusively on the three lines selected in the final screening stage: Kha 30, Kha 76 and Chuma. These lines were chosen based on their contrasting Drought Tolerance Index (DTI) and Drought Susceptibility Index (DSI) values from the preceding screening stages and represent the most drought-tolerant and drought-sensitive genotypes identified in this study.
Growth parameters
Growth parameters, including shoot and root length, biomass, leaf area and leaf thickness, reflect plant water-use strategies and biomass allocation under stress (Poorter et al. Reference Poorter, Niinemets, Poorter, Wright and Villar2009; Yuan et al. Reference Yuan, Yang, Li, Liu and Han2016). Morphological traits evaluated included seed weight (SW), shoot and root length, shoot and root dry weights (DWs), leaf area, leaf thickness, root collar diameter and number of branches and pods. Leaf area was measured using ImageJ (version 1.53e) and leaf thickness using a MultispeQ. Measurements were taken at three stages: before drought stress, biweekly during stress and at termination upon onset of senescence. Pod traits were recorded only at the final harvest.
Stress indices
Degree of tolerance for the low soil phosphorus experiment was identified as used in Kamanga et al. (Reference Kamanga, Echigo, Yodoya, Mohammad, Mekawy and Ueda2020), while stress sensitivity and tolerance of bean lines were quantified using the DSI according to Fischer (Reference Fischer1978), and the DTI according to Lambers et al. (Reference Lambers, Chapin and Pons2008), based on shoot DW as follows:
 \begin{equation*}{{DSI}} = \frac{{1 - \left( {\frac{{{Ys}}}{{{Yp}}}} \right)}}{{{SI}}}\end{equation*}
 \begin{equation*}{DI} = 1 - \frac{{{MYs}}}{{{MYp}}}\end{equation*}
 \begin{equation*}{DTI} = \frac{{\left( {{Ys*}\left( {\frac{{{Ys}}}{{{Yp}}}} \right)} \right)}}{{{MYs}}}\end{equation*}
 \begin{equation*}{Degree\ of\ tolerance} = \frac{{{Growth\ under\ low\ phosphorus}}}{{{Growth\ under\ high\ phosphorus}}}\end{equation*}
In the formulas, Yp and Ys represent mean cultivar weights under control and stress, while MYp and MYs are the corresponding means across all cultivars. Drought intensity was also calculated.
Membrane stability index
The MSI was used to quantify cellular integrity under osmotic stress, providing an indicator of drought-induced membrane damage (Kamanga, 2024). The root MSI was assessed using a method outlined in Kamanga (2024) with slight modifications. Fresh roots were washed, cut into 1–2 cm segments and immersed in 50 mL of distilled water for 24 h at room temperature. Electrical conductivity (EC₁) was then measured using an AZ8302 meter. Samples were autoclaved at 105°C for 15 min to kill tissues, and EC₂ was recorded. MSI was calculated from EC values of stressed and control plants as follows:
 \begin{equation*}{MSI} = \left[ {\frac{{1 - \frac{{TE{C_1}}}{{TE{C_2}}}}}{{1 - \frac{{CE{C_1}}}{{CE{C_2}}}}}} \right]{{\times }}100\end{equation*}
 \begin{equation*}{{MI}} = 100 - {{MSI}}\end{equation*}
where TEC1 and TEC2 are electrical conductivities under treatment/stress conditions before and after autoclaving, respectively, whereas CEC1 and CEC2 are electrical conductivities for control plants before and after autoclaving, respectively.
Leaf RWC
Leaf RWC was measured as an indicator of plant water retention capacity under drought stress (Sade et al. Reference Sade, Gebremedhin and Moshelion2012). RWC was measured at the conclusion of the experiment by recording the fresh weight of a leaf from each sample. The leaves were then immersed in 50 mL of distilled water in Falcon tubes and kept overnight to reach full turgidity, after which the turgid weight was recorded. Subsequently, samples were oven-dried at 80°C for 72 hours to obtain the DW. Leaf RWC was then calculated according to Sade et al. (Reference Sade, Gebremedhin and Moshelion2012), as follows:
 \begin{equation*}{{RWC}} = \left[ {\frac{{{{FW}} - {{DW}}}}{{{{TW}} - {{DW}}}}} \right]{{\times}}100\end{equation*}
Extraction and quantification of macro- and micro-nutrient elements
Macro- and micro-nutrient analyses were conducted because ions such as K+ and Na+ contribute to osmotic adjustment and turgor maintenance under water deficit (Munns and Tester Reference Munns and Tester2008; Lu Reference Güler, Sağlam, Demiralay and Kadioğlu2012; Blum Reference Blum2017), while micro-nutrients, including Zn2+, Mn2+, Fe2+ and Cu2+ play essential roles in enzyme activation, antioxidant defence and maintenance of cellular metabolism during abiotic stress (Hummel et al. Reference Hummel, Hallahan, Brychkova, Ramirez-villegas, Guwela, Chataika, Curley, Mckeown, Morrison, Talsma, Beebe, Jarvis, Chirwa and Spillane2018). Macro- and micro-nutrient contents were quantified using dry ashing (Gomonda and Khumbanyiwa Reference Gomonda and Khumbanyiwa2015). Oven-dried leaf and root samples (0.5 g) were combusted at 500°C for 2 h, digested with HCl, filtered and diluted to 100 mL. Concentrations of Na+, K+, Ca2+, Mg2+, Fe2+, Cu2+, Zn2+ and Mn2+ were determined by atomic absorption spectrophotometry (Varian Spectra AA–20) at appropriate wavelengths.
Chlorophyll content
Chlorophyll content was measured using a MultispeQ V 2.0 meter (PhotosynQ, Michigan, USA) under the SPAD (Soil plant analysis development) protocol. The absorbance was measured at 650 nm (red) and 940 nm (infrared) with a 12-second integration time. Chlorophyll was measured from the fully expanded top third leaves of the plant in SPAD units.
Statistical analyses
Chlorophyll concentration was measured as it reflects the effects of drought stress on photosynthetic efficiency (Ashraf and Harris Reference Ashraf and Harris2013; Yuan et al. Reference Yuan, Yang, Li, Liu and Han2016). Data were analyzed using linear mixed models suitable for a split-plot design. Fixed effects included phosphorus, water treatment and genotype; random effects included replication, site (for field) and experimental cycle (for drought). Post-hoc comparisons were performed using Tukey’s HSD at P ≤ 0.05, and estimated marginal means were calculated. Analyses were conducted in GenStat (v23) and RStudio (v4.3.1).
Results
Growth and yield of common bean lines under low soil phosphorus
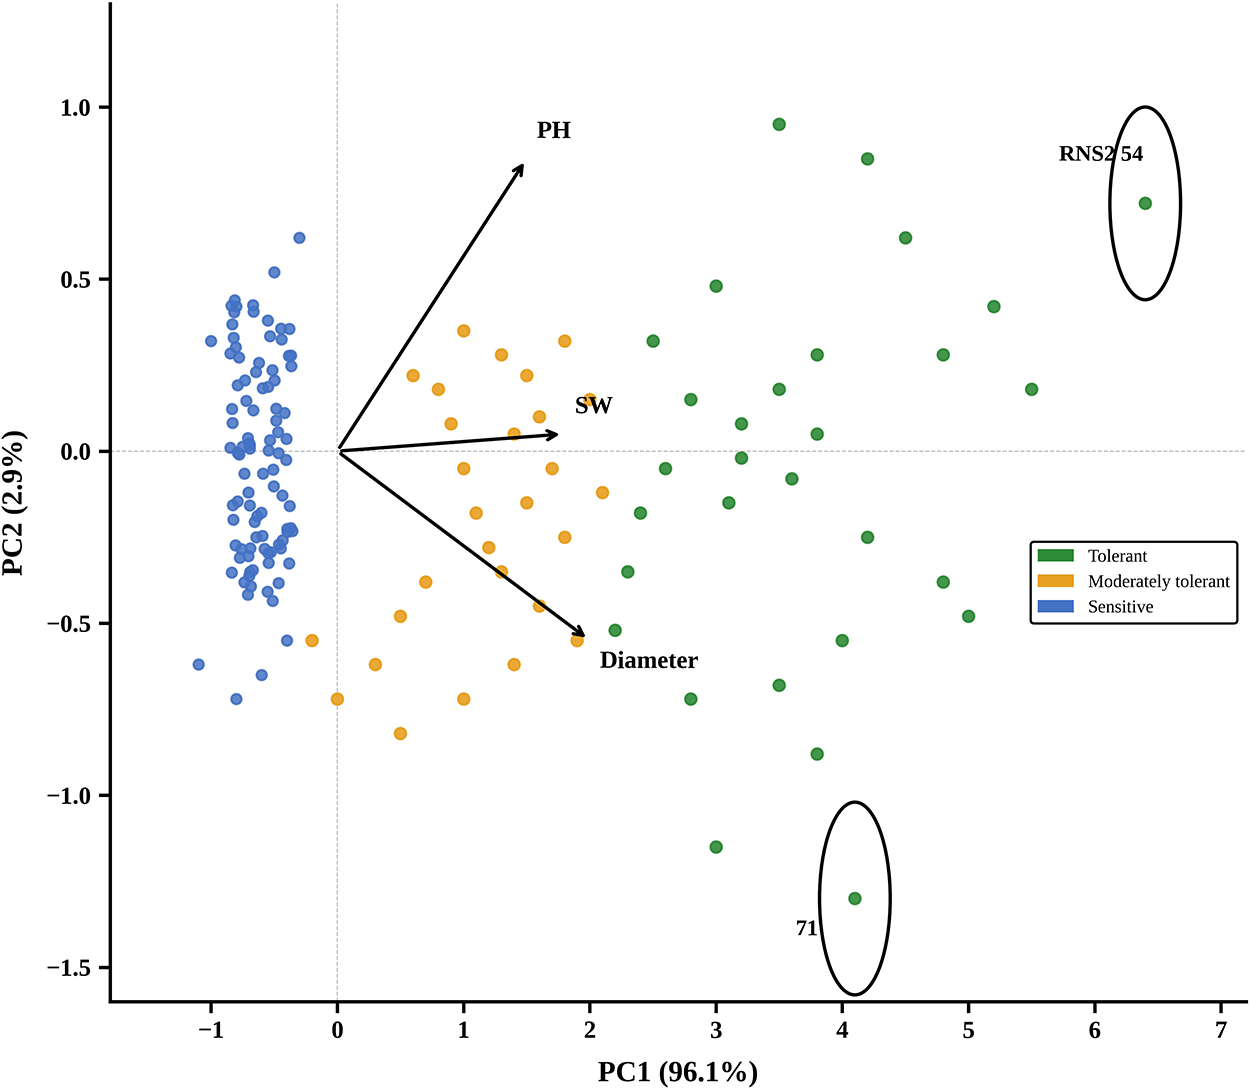
The 270 common bean lines exhibited significant variation in plant diameter, height and SW under low soil phosphorus (P 0.05 < 0.001). Compared with the control, most lines showed reductions in all traits, although the extent of response varied widely among lines. Common bean line 56 was among the most sensitive, showing pronounced reductions across all traits under low soil phosphorus, whereas line RNS2 54 showed the greatest enhancement in growth, indicating tolerance (Supplementary Table S2).
Traits correlation under low soil phosphorus
Correlation analysis was conducted to evaluate the relationships between SW and plant height (PH), and between SW and diameter. SW was positively correlated with PH (R 2 = 0.95) and diameter (R 2 = 0.91; Supplementary Figure S1).
Principal component analysis
Tolerance indices of the correlated traits were used to categorize the 270 common bean lines into three clusters (low soil phosphorus tolerant (green cluster), sensitive (blue cluster) and moderately tolerant (brown cluster)). Lines with a degree of tolerance below 0.50 were classified as sensitive, indicating retention of less than half their growth performance under low phosphorus relative to the control. Those with values between 0.50 and 1.00 were classified as moderately tolerant, while lines with a degree of tolerance above 1.00, indicating maintenance or enhancement of growth under low phosphorus, were classified as tolerant. The first principal component (PC1) explained 96.1% of the total variation, indicating that PC1 largely drove differences among lines. PC2 accounted for only 2.9% of the variation and contributed minimally to genotype discrimination. The biplot vectors indicate that PH, SW and diameter contributed almost equally to PC1, as shown by their similar arrow lengths and directions. The principal component analysis (PCA) clustered genotypes into three groups: tolerant (green), moderately tolerant (orange) and sensitive (blue), with lines RNS2 54 and 71 being the most distinct from the rest. This led to the selection of 30 common bean lines (20 tolerant and 10 sensitive to low soil phosphorus) for the drought stress experiment (Fig. 1).
Principal component analysis clustering 270 common bean lines into 3 groups (the green cluster represents the tolerant lines, the orange cluster represents the moderately tolerant lines, while the blue cluster represents sensitive lines) under low soil phosphorus. The biplot vectors (arrows) indicate the direction and magnitude of contribution of each trait (PH; SW; diameter) to the principal components. Genotypes near the tip of an arrow have relatively high values for that trait. Lines RNS2 54 and 71 are highlighted with circles as they were the most distinct from the rest of the genotypes, being positioned furthest along PC1, and were selected as representative tolerant and sensitive lines, respectively, for further evaluation.

Growth measurements under drought stress
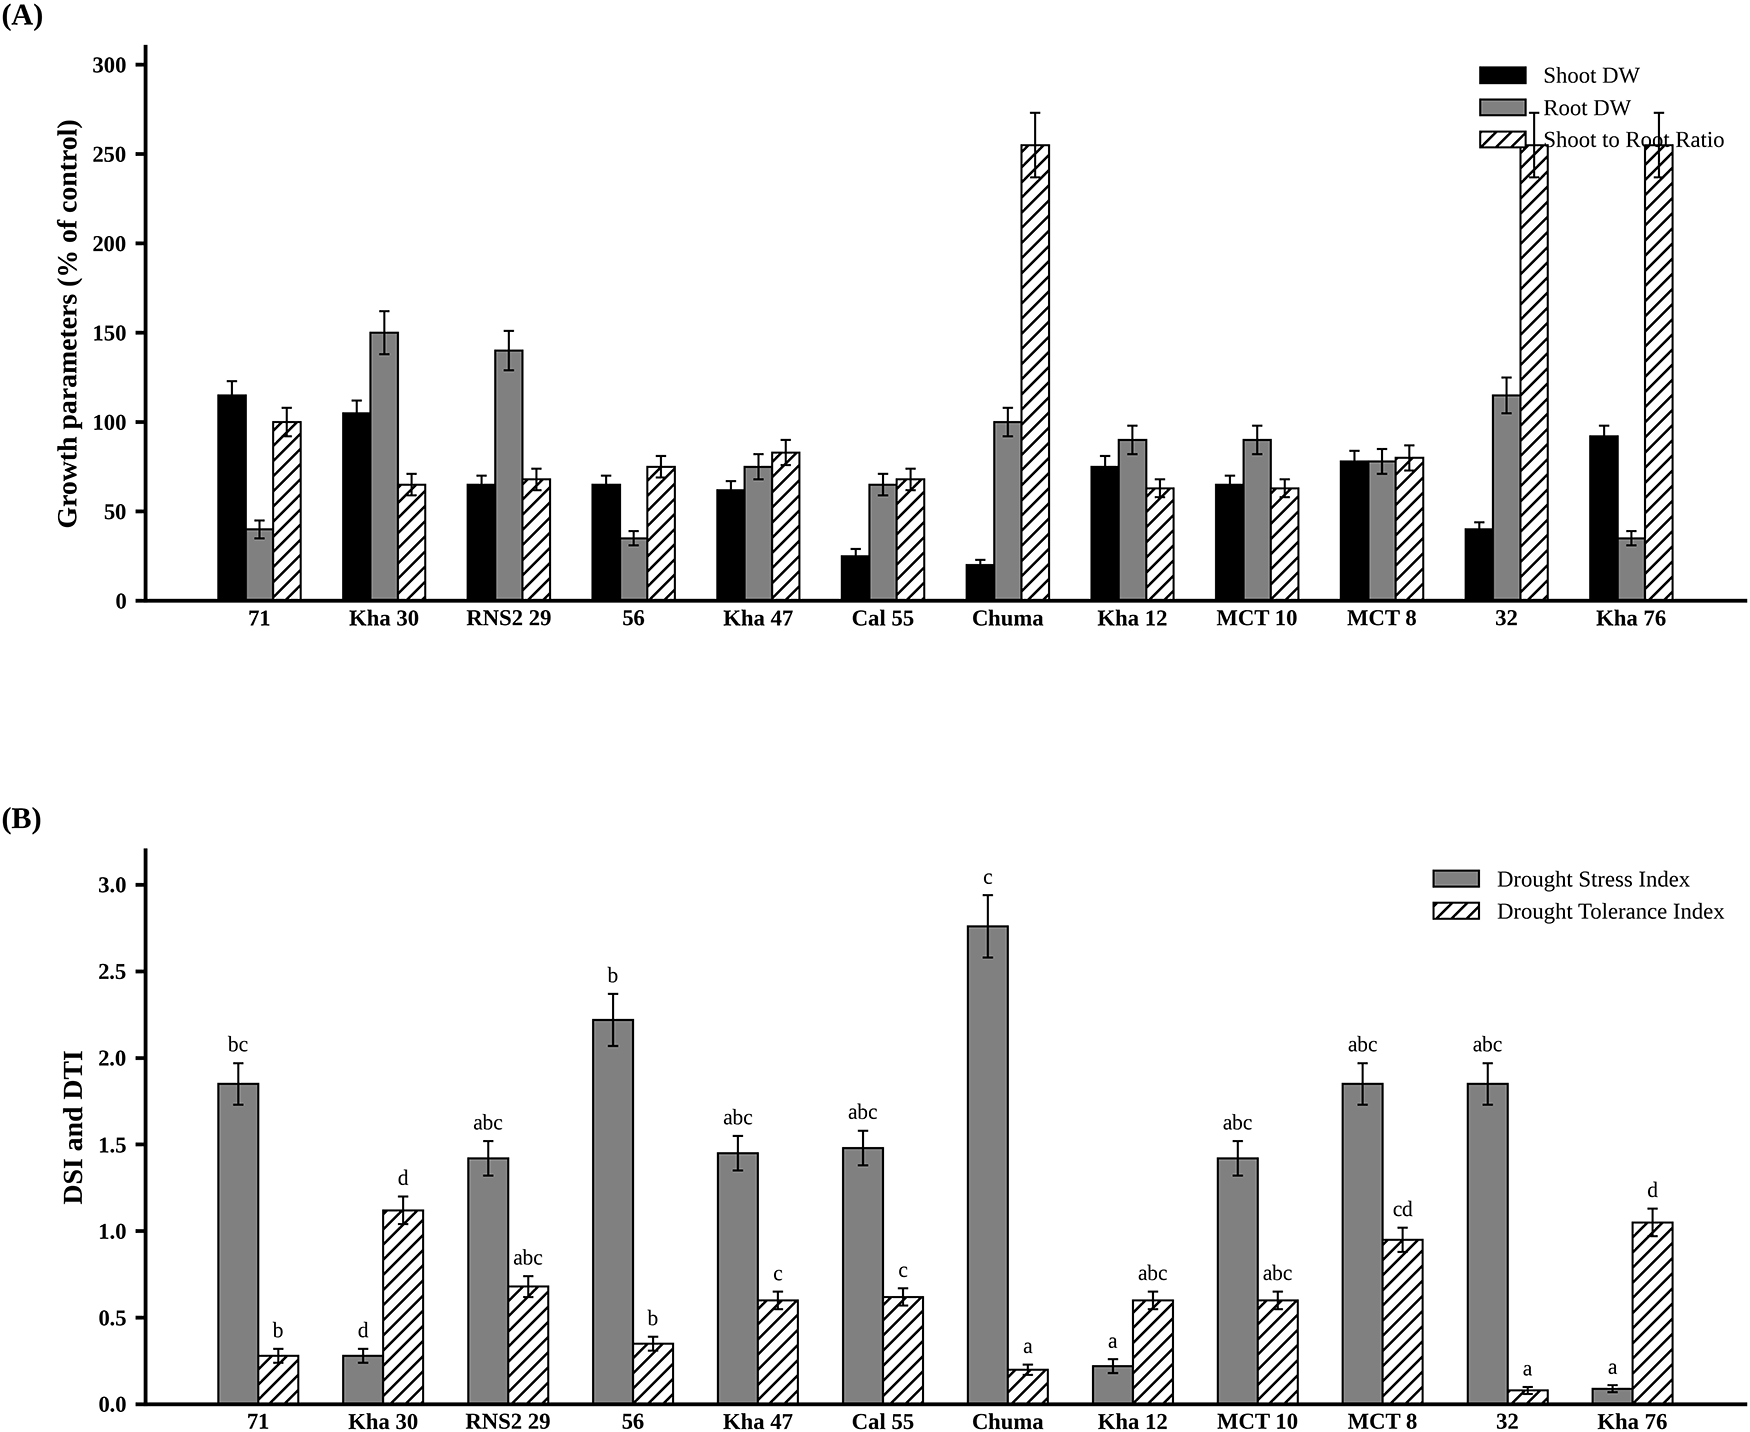
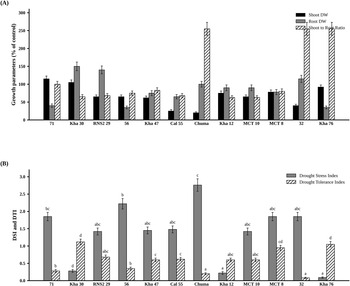
Significant variation in shoot-dry biomass and shoot-to-root ratios was observed among the 30 lines under drought stress (P < 0.001). Kha 30 and Kha 76 maintained the greatest shoot-dry biomass relative to their controls, while Chuma recorded the lowest. Lines 71 and 32 showed the highest shoot-to-root ratios, whereas Kha 30 and Chuma exhibited the lowest (Fig. 2A).
Growth responses of 12 common bean lines under severe drought stress relative to their respective controls (A), along with drought tolerance indices (B). Data are shown for 12 lines representing the range of drought responses from the first physiological screening stage; these were selected from the 30 lines based on contrasting DTI and DSI values. Values represent means ± standard error from three replicates after 28 days of severe drought exposure. Data were analyzed using ANOVA (analysis of variance) at the 0.05 significance level.
Stress tolerance and susceptibility indices
Significant variations (P 0.05 < 0.001) in drought tolerance and susceptibility were observed among the common bean lines. Kha 30 and Kha 76 emerged as the most drought-tolerant, recording the highest DTIs of 1.12 and 1.05, respectively, and the lowest DSI of 0.21 and 0.09, respectively. Conversely, Chuma was the most drought-sensitive line, exhibiting the lowest DTI (0.20) and the highest DSI (2.76) (Fig. 2B).
Based on DTI and DSI rankings from the morphological screening, 12 lines representing a range of drought responses were advanced to the first physiological screening stage (July–September 2024). From these three lines, Kha 30 and Kha 76 (most tolerant) and Chuma (most sensitive) were selected for comprehensive physiological and biochemical characterization in the final screening stage (January–March 2025).
Growth analysis parameters
Specific leaf area and leaf area ratio
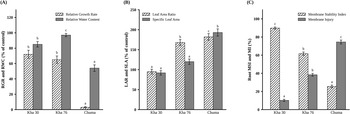
Growth traits of three common bean lines selected based on stress-response indicators were assessed to elucidate the physiological mechanisms underlying drought tolerance (Hunt et al. Reference Hunt, Causton, Shipley and Askew2002). Specific leaf area (SLA) and leaf area ratio (LAR) were determined with respect to their respective controls. SLA and LAR differed significantly among lines (P < 0.001). Lines with higher drought tolerance indices (Kha 30 and Kha 76) exhibited lower SLA and LAR compared with the drought-sensitive line Chuma (Fig. 3B). These results indicate that drought-tolerant lines reduced SLA and LAR under stress, whereas the susceptible line showed increases relative to its control.
Growth analysis traits and MSI of selected common bean lines exposed to severe drought stress for 28 days. (A) RGR and RWC, (B) SLA and LAR and (C) MSI and RI. Data are shown for three lines selected for in-depth characterization based on contrasting stress indices: two tolerant lines (Kha 30 and Kha 76) and one sensitive line (Chuma). Values represent means ± standard error from three replicates after four weeks of severe drought exposure. RGR, RWC, SLA and LAR are expressed as percentages of their respective controls. Different letters denote significant differences within groups. Data were analyzed using ANOVA at the 0.05 significance level.

Relative growth rate
The relative growth rate (RGR) of the selected common bean lines was also assessed using shoot DW to validate the stress indicators. RGR was significantly reduced under drought in all lines (P < 0.001). However, comparing the tolerant with the sensitive, the sensitive common bean line Chuma was the most affected by the stress in terms of RGR, with an RGR of less than 5%, whilst the tolerant lines Kha 30 and Kha 76 had higher RGR (over 50%) relative to their controls (Fig. 3A). This suggests that tolerant lines maintained comparatively higher growth rates even under stress conditions.
Relative Water Content
Tolerant and sensitive lines were significantly different (P 0.05 < 0.001) in leaf RWC. Lines Kha 30 and Kha 76 maintained higher RWC compared with the susceptible line Chuma (Fig. 3A).
Membrane Stability Index
Root MSI differed significantly among lines (P < 0.001). Kha 30 and Kha 76 recorded higher MSI values (89.83% and 61.66%, respectively) than Chuma (25.50%), and Chuma also exhibited the highest root injury percentage (74.50%) among the tolerant lines (Fig. 3C).
Leaf macro-nutrient element concentration
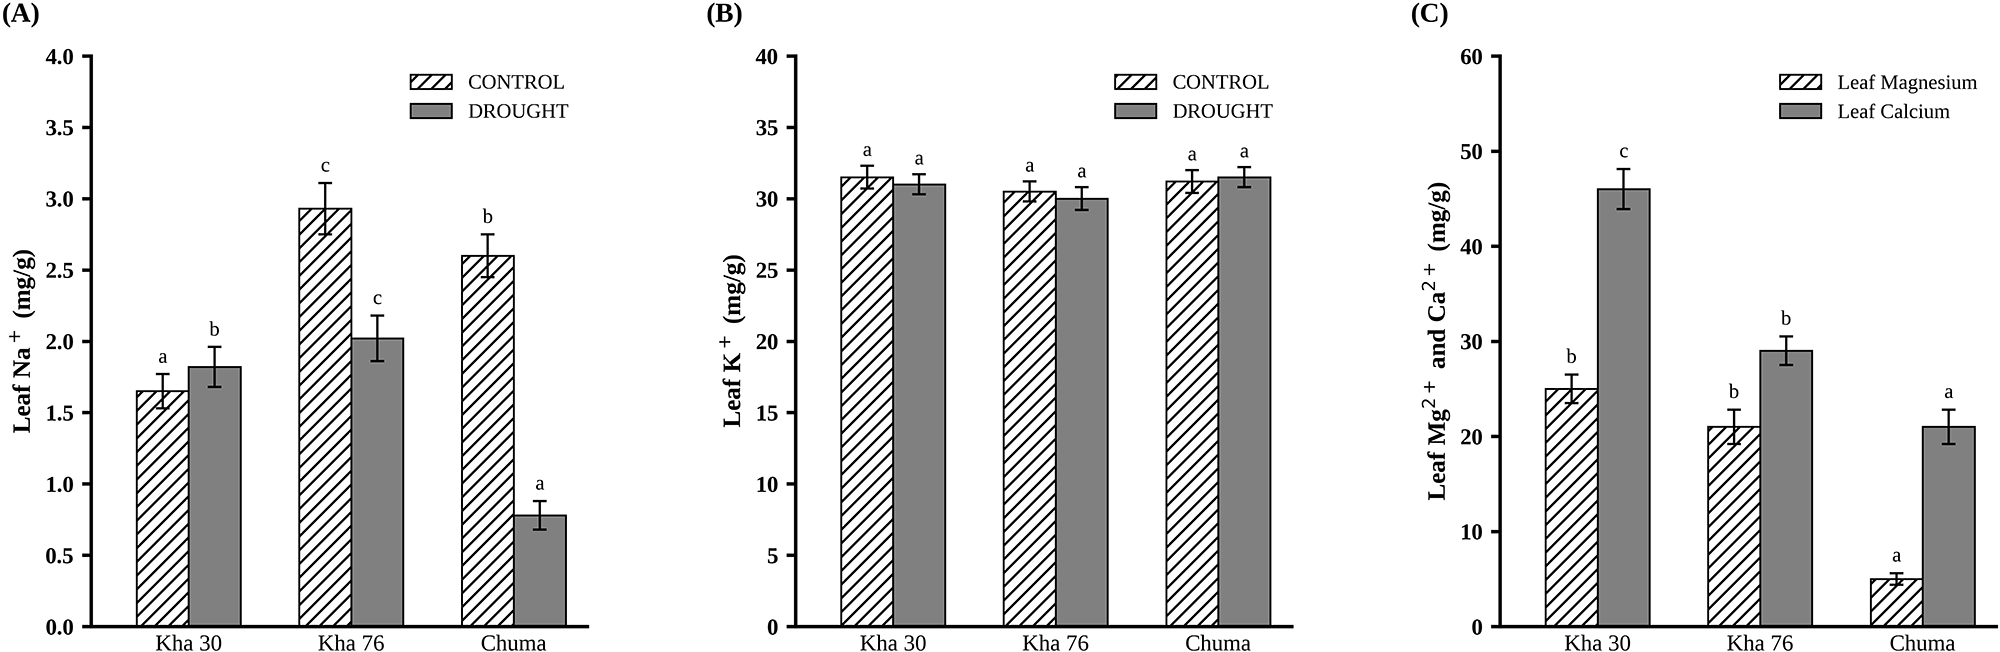
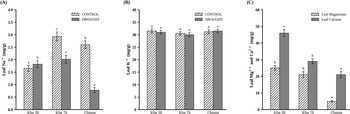
Na+ concentration differed significantly between control and drought conditions (P < 0.001). Under drought stress, the tolerant common bean lines Kha 30 and Kha 76 had higher Na+ concentrations of 1.79 mg/g and 2.02 mg/g, respectively, than the sensitive common bean line Chuma, which had a concentration of 0.78 mg/g (Fig. 4A). Under both control and drought conditions, there were no significant differences in leaf K+ concentration (Fig. 4B). In addition, drought-tolerant common bean lines also had higher accumulation of Mg2+ (25 mg/g) and Ca2+ (47 mg/g) than a sensitive common bean line, Chuma (Fig. 4C).
Leaf concentrations of Na+ (A), K+ (B) and Mg2+ and Ca2+ (C) in common bean seedlings grown under control and drought stress conditions. Plants were exposed to severe drought for 28 days. Results are presented as means ± standard error from three replicates after four weeks of treatment. Data are shown for three lines selected for in-depth characterization based on contrasting stress indices: two tolerant lines (Kha 30 and Kha 76) and one sensitive line (Chuma). Different letters denote significant differences among treatments. Data were analyzed using ANOVA at the 0.05 level of significance.
Root Na+ and K+ concentration
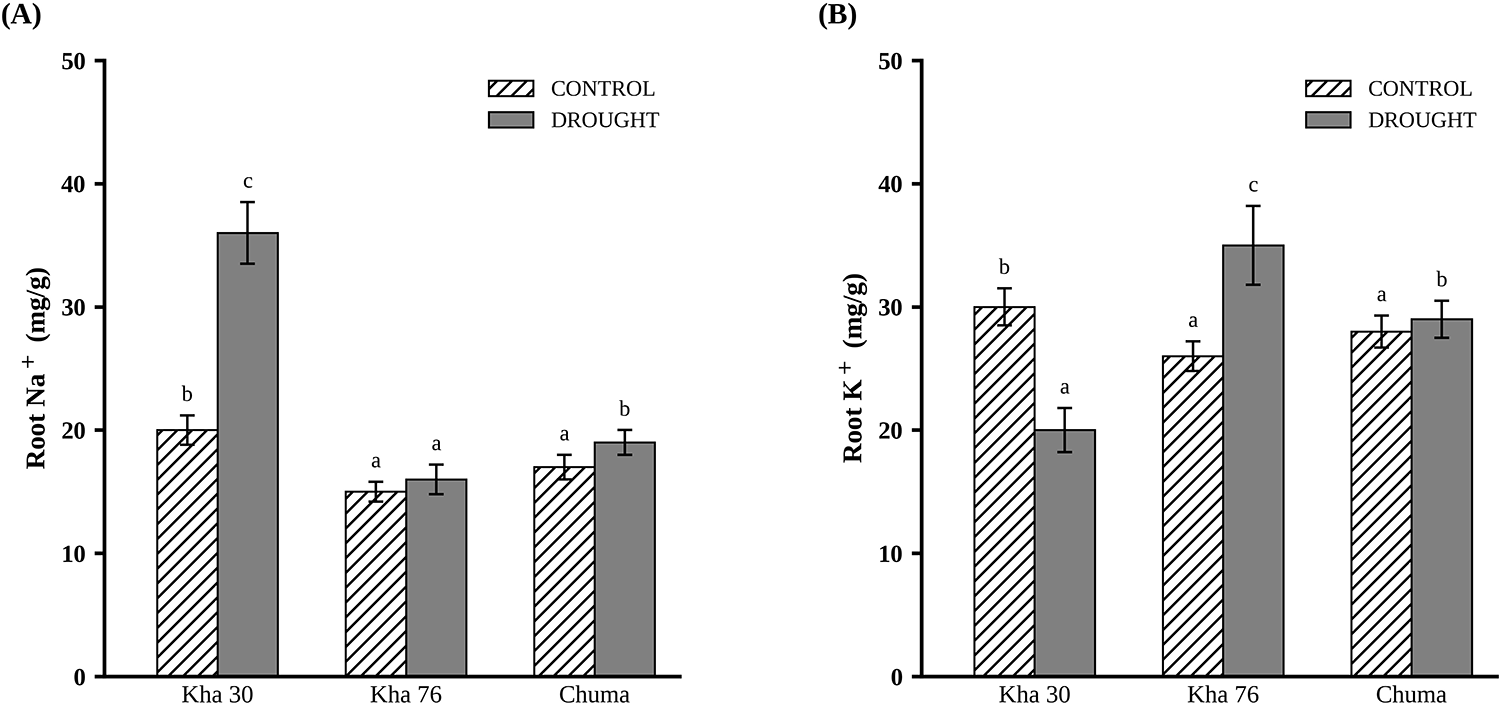
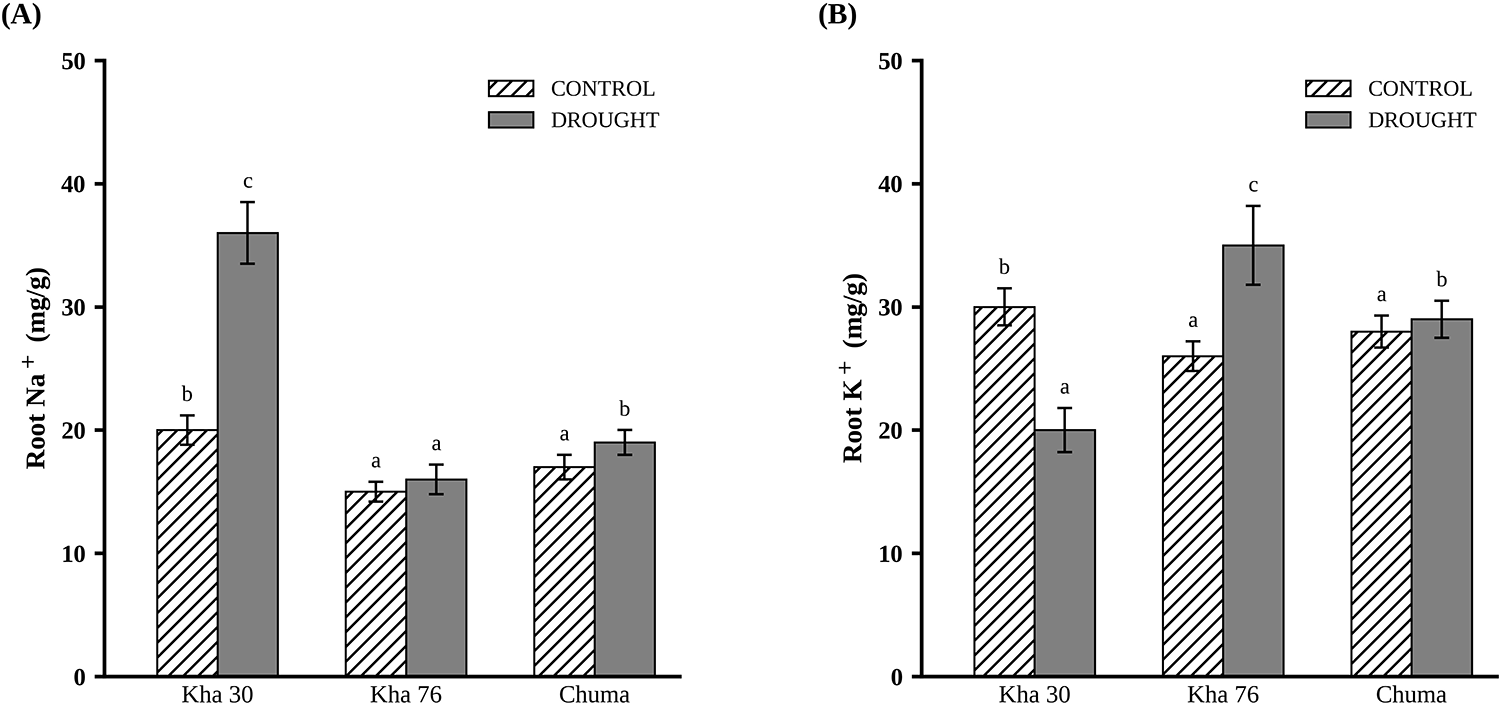
Under drought stress, root Na+ and K+ concentrations differed significantly among lines (P < 0.001). Kha 30 had the highest root Na+ concentration, and Kha 76 had the highest root K+ concentration, both compared with the sensitive line Chuma (Fig. 5A, B).
Root Na+ (A) and K+ (B) concentrations under control and drought stress conditions. Values represent means ± standard error from three replicates after 28 days of severe drought exposure. Data are shown for three lines selected for in-depth characterization based on contrasting stress indices: two tolerant lines (Kha 30 and Kha 76) and one sensitive line (Chuma). Different letters indicate significant differences within treatments. Data were analyzed using ANOVA at the 0.05 significance level.
Leaf micro-nutrients under drought stress
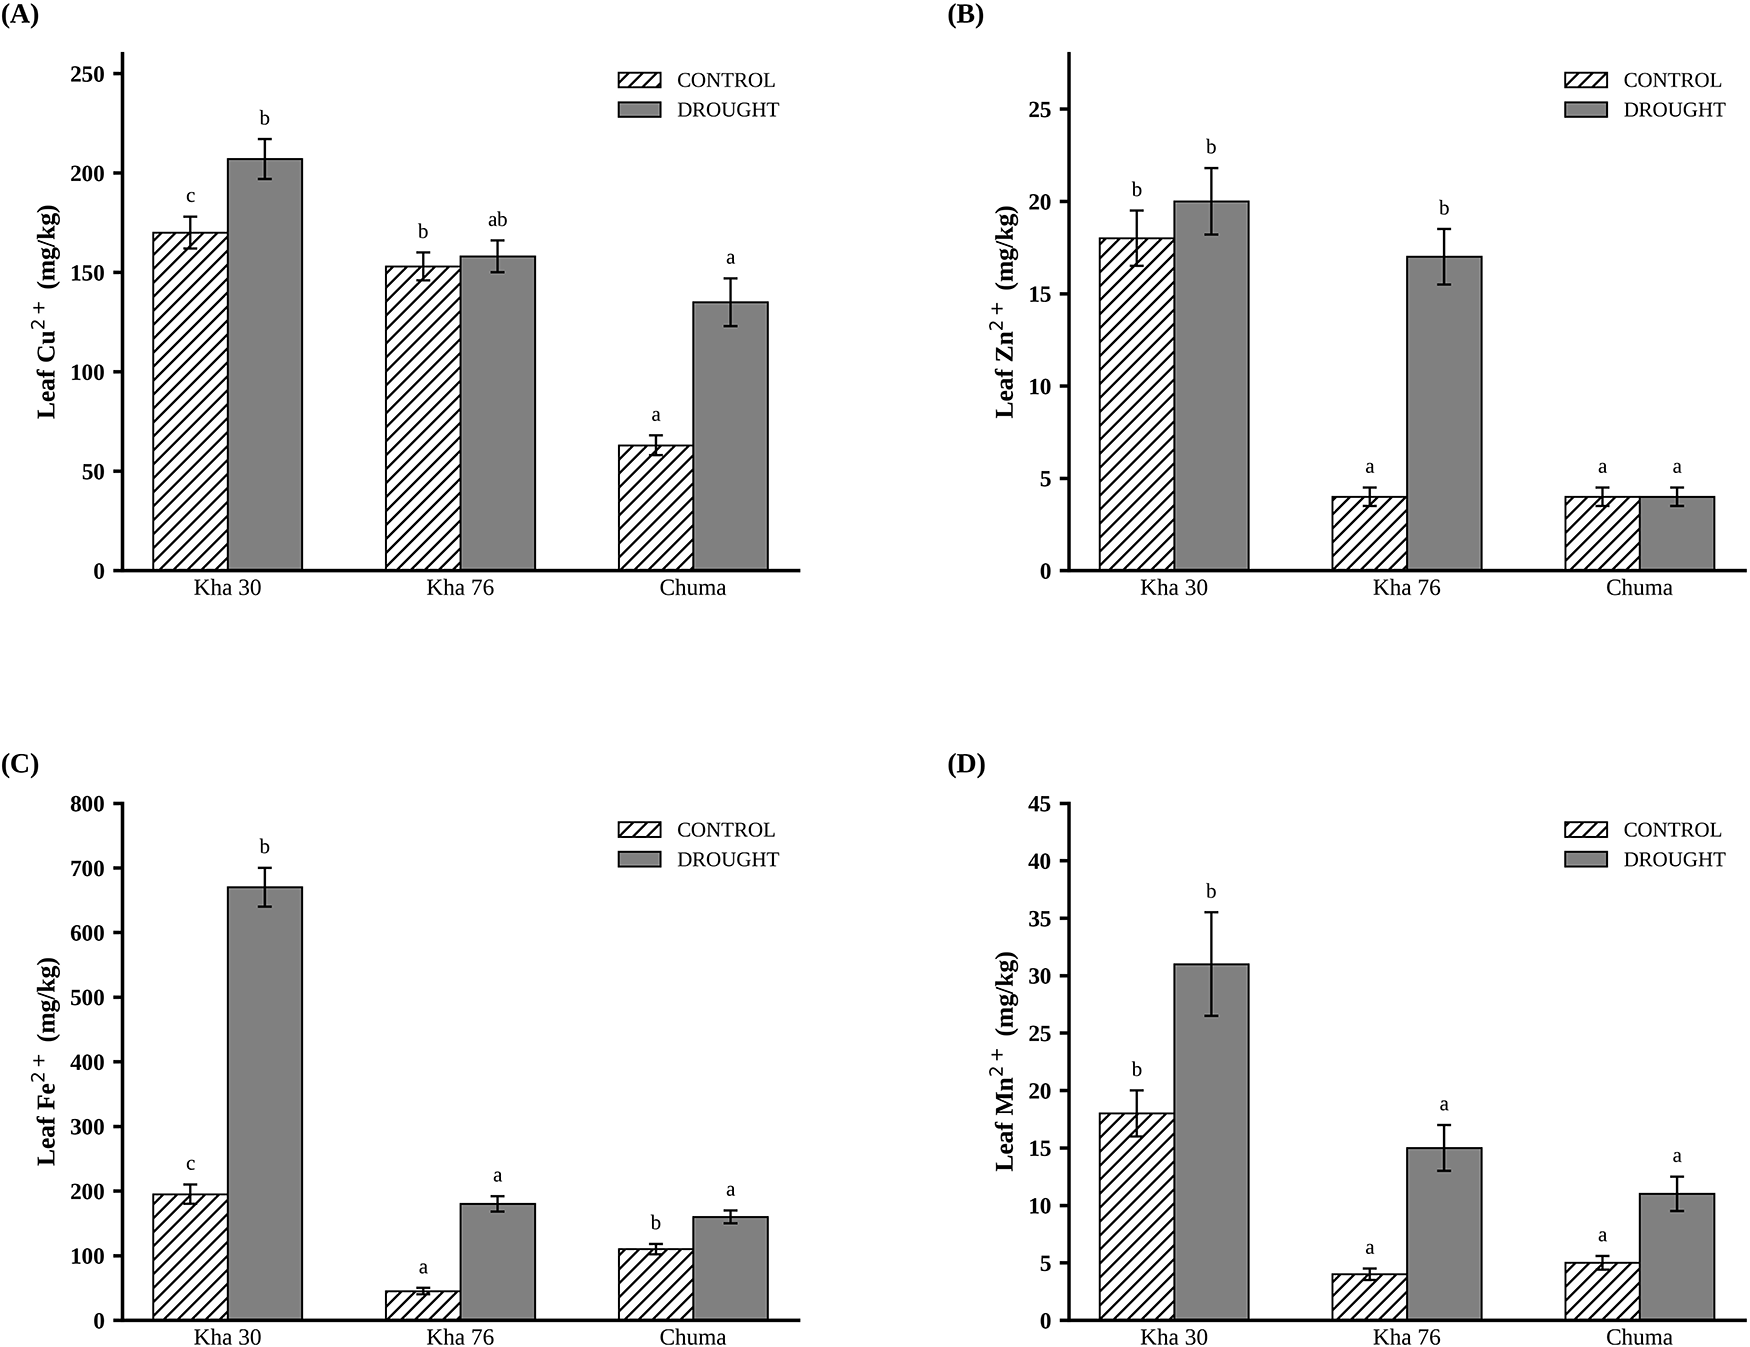
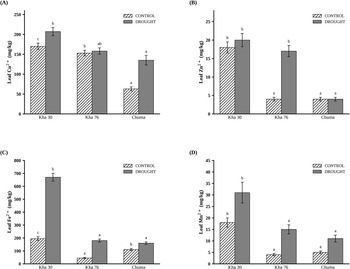
Leaf Cu2+, Zn2+, Fe2+ and Mn2+ concentrations were significantly higher in Kha 30 than in Chuma under drought stress (P < 0.001; Fig. 6).
Leaf micro-element nutrients. Leaf Cu2+ (A), leaf Zn2+ (B), leaf Fe2+ (C) and leaf Mn2+ (D) under control and drought stress. Values are presented as means ± standard error from three replicates after 28 days of severe drought exposure. Data are shown for three lines selected for in-depth characterization based on contrasting stress indices: two tolerant lines (Kha 30 and Kha 76) and one sensitive line (Chuma). Different letters denote significant differences within groups. Data were analyzed using ANOVA at the 0.05 significance level.
Chlorophyll content
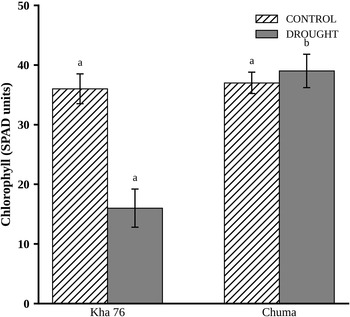
Chlorophyll content differed significantly between lines under drought stress (P < 0.001). Kha 76 had the lowest chlorophyll content while Chuma had the highest (Fig. 7).
Chlorophyll content of common bean lines under drought and control conditions. Values are presented as means ± standard error from three replicates after 28 days of severe drought exposure. Data are shown for two lines, one tolerant (Kha 76) and one sensitive (Chuma), for which chlorophyll measurements were conducted in the final screening stage. Different letters denote significant differences within groups. Data were analyzed using ANOVA at the 0.05 significance level.

Discussion
This study identified common bean lines with combined tolerance to low soil phosphorus and drought stress, highlighting physiological traits that underpin stress adaptation in Malawian germplasm. Among the 30 lines evaluated, Kha 30 and Kha 76 consistently exhibited superior performance under drought, maintaining higher growth rates, RWC and mineral nutrient accumulation compared to the sensitive line Chuma. These findings advance previous research (Thayo et al. Reference Thayo, Kaderu, Mwale, Chimungu and Kamanga2025) by linking morpho-physiological traits to drought adaptation in pre-breeding lines, whereas earlier work focused on salinity tolerance in a smaller germplasm set.
Drought stress primarily induces osmotic stress, restricting water uptake, cell expansion and photosynthetic activity through stomatal closure (Chaves et al. Reference Chaves, Flexas and Pinheiro2009). Plants mitigate these effects by accumulating osmolytes that maintain cell turgor under low moisture (Farooq et al. Reference Farooq, Fujita and Basra2009; Blum Reference Blum2017). In the present study, drought-tolerant lines accumulated higher levels of inorganic osmolytes (K+, Na+, Mg2+, Ca2+) than the sensitive line (Fig. 4). This pattern supports osmotic adjustment at a lower metabolic cost than organic solutes (Munns and Tester Reference Munns and Tester2008; Blum Reference Blum2017) and contributed to maintenance of RWC and growth (Fig. 3A), consistent with prior observations in common bean (Lu Reference Güler, Sağlam, Demiralay and Kadioğlu2012). Stress indices (SSI (stress susceptibility index) and STI) further confirmed these lines as drought-tolerant, corroborated by sustained RGRs under water deficit (Figs. 2B, 3A).
Leaf traits also contributed to stress resilience. The drought-tolerant line Kha 76 exhibited reduced chlorophyll content, whereas the sensitive line Chuma maintained higher levels (Fig. 7). This likely reflects a protective downregulation of photosynthetic activity to limit photooxidative damage under osmotic stress (Ashraf and Harris Reference Ashraf and Harris2013; Yuan et al. Reference Yuan, Yang, Li, Liu and Han2016). In addition, drought-tolerant lines had thicker leaves, indicated by lower SLA and higher leaf mass per area (Fig. 3B). Leaf thickening reduces transpiration and improves water-use efficiency, a well-documented drought-adaptive mechanism (Pastenes et al. Reference Pastenes, Pimentel and Lillo2005; Poorter et al. Reference Poorter, Niinemets, Poorter, Wright and Villar2009).
Mineral nutrition under drought also differentiated tolerant and sensitive lines. Micro-nutrients such as Mn2+ and Zn2+ are crucial for enzymatic activity, hormone regulation and antioxidant defence. Kha accumulated higher levels of Mn2+ (31 mg/kg DM) and Zn2+ (20 mg/kg DM) than Chuma (10 and 3 mg/kg DM, respectively) (Fig. 6), supporting growth under stress. Maintenance of nutrient uptake under drought reflects functional root systems and efficient osmotic adjustment, consistent with findings in common bean and wheat (Hummel et al. Reference Hummel, Hallahan, Brychkova, Ramirez-villegas, Guwela, Chataika, Curley, Mckeown, Morrison, Talsma, Beebe, Jarvis, Chirwa and Spillane2018; Hao et al. Reference Hao, Liu, Wang, Zhao and Guan2024).
At the cellular level, drought induces the accumulation of reactive oxygen species (ROS), which can cause oxidative stress and membrane damage (Sharma et al. Reference Sharma, Jha, Dubey and Pessarakli2012; Hasanuzzaman and Nahar Reference Hasanuzzaman and Nahar2021). The MSI was significantly higher in Kha 30 and Kha 76 than in Chuma (Fig. 3C), indicating enhanced ROS regulation and antioxidant defence. This mechanistic insight links membrane integrity and stress tolerance and complements observations from our previous salinity study (Thayo et al. Reference Thayo, Kaderu, Mwale, Chimungu and Kamanga2025), emphasizing that MSI is a robust indicator of drought adaptation in pre-breeding lines.
The identification of Kha 30 and Kha 76 as drought-tolerant pre-breeding lines with combined tolerance to low soil phosphorus opens several avenues for future research. In the short term, these lines should be evaluated under field conditions across multiple agro-ecological zones in Malawi to validate their performance beyond greenhouse settings. Crossing these lines with high-yielding but drought-sensitive cultivars would allow assessment of the heritability of the identified tolerance traits, particularly membrane stability, osmolyte accumulation and micro-nutrient retention. Molecular characterization of Kha 30 and Kha 76, including marker-assisted screening for drought-related quantitative trait loci, would further accelerate their integration into formal breeding pipelines. Additionally, given that phosphorus deficiency and drought co-occur in many smallholder farming systems in Sub-Saharan Africa, future studies examining the combined effects of these stresses on yield components under field conditions would strengthen the pre-breeding case for these accessions.
Conclusion
This study successfully characterized and screened Malawian common bean (Phaseolus vulgaris L.) germplasm for drought tolerance, identifying Kha 30 and Kha 76 as tolerant genetic resources under water-limited conditions and in low soil phosphorus, offering immense potential for drought tolerance breeding programs. In contrast to the sensitive line, Chuma, Kha 30 and Kha 76 consistently exhibited better drought tolerance and susceptibility indices, higher biomass production and stable growth. The ability of these lines to maintain key adaptive traits under drought provides strong evidence of their robustness and agronomic potential.
Notably, the combined assessment of growth, allocation patterns and stress-related traits enabled the differentiation of drought-tolerant and drought-sensitive germplasm, demonstrating the value of trait-based screening approaches for identifying useful genetic resources. The consistent performance of Kha 30 and Kha 76 across multiple drought-response indicators highlights their suitability as valuable parental materials for common bean improvement programs targeting drought-prone agro-ecologies.
From a genetic resources perspective, these findings contribute to documenting, utilizing and valorizing locally adapted common bean germplasm in Malawi. The identified drought-tolerant lines represent promising candidates for pre-breeding, cultivar development and conservation, thereby supporting national and regional efforts to enhance the resilience of common bean production amid increasing climatic variability. Their targeted use in breeding programs could accelerate the development of drought-resilient cultivars suited to Malawi and similar environments in Sub-Saharan Africa.
Supplementary material
The supplementary material for this article can be found at https://doi.org/10.1017/S1479262126100690.
Acknowledgements
We acknowledge the support from the technical teams at the LUANAR Horticulture Department and the Crop and Soil Sciences Department, as well as agricultural extension workers in the Chioshya and Champhira EPAs, during the preceding screening field experiments, which were key to the success of this study.
Author contributions
D.T., J.G.C., V.M.M. and R.M.K. conceived the idea. D.T. and A.K. conducted the field experiments. D.T. analyzed the data and wrote the first draft. R.M.K., V.M.M. and J.G.C. supervised the work and reviewed the first draft. R.M.K. wrote the final version of the manuscript. V.M.M., J.G.C. and R.M.K. obtained the funding for this research.
Funding statement
This study was supported by a grant from the Food Systems in Malawi (FoodMA) Common Bean Sub-Grant awarded through the Lilongwe University of Agriculture and Natural Resources (LUANAR), Malawi.
Competing interests
The authors declare that there are no conflicts of interest in this submission.
Data availability statements
All data supporting the findings of this study are included in the manuscript and its Supplementary Materials.
Use of generative AI
The authors declare that generative AI tools were judiciously used to improve the clarity and precision of the manuscript, specifically Grammarly and ChatGPT (GPT-4o).


 Open access

