Management Implications
Hawai‘i’s nonnative flora is cosmopolitan in origin, and we uncovered no evidence to suggest that regulating or inspecting imports from any one continent would prevent most naturalizations. Similarly, Hawai‘i’s naturalized plants are native to various climatic zones, and although managers may currently recognize most of these species as invaders of tropical lowlands, our study shows that almost half could be equally at home in cooler, mid- to upper elevations that often host remnant native-dominated habitats. We recommend increasing efforts to reduce establishment opportunities for nonnatives in native-dominated habitats by limiting dispersal and disturbance. We also found that a relatively constant rate of new plant naturalizations over time is underpinned by fluctuations in naturalization rates among different introduction pathways. In particular, the naturalization rate for ornamental plants is increasing exponentially, while naturalization of agricultural species has declined, corresponding with a historic shift from agriculture to a tourism-based economy, which is associated with increased tourist and resident populations as well as general economic well-being. These trends may be especially relevant to other tropical islands that have undergone (or will soon undergo) similar socioeconomic changes. Hawai‘i should expect more ornamental naturalizations, which emphasizes the need for on-the-ground monitoring, because future invaders that have recently become popular in the horticultural trade could have no history of introduction or invasiveness to inform risk assessments. Finally, we found that many plants spread quickly within the archipelago, and although most recent introductions appear to be present on just one to two islands, the average rate of spread appears to be increasing. Thus, managers may capitalize on the limited distribution of new arrivals and prevent inter-island introductions if they act quickly (e.g., noxious weed list updates). However, the large number of species in this one to two island pool heightens the need for prioritization schemes that identify monitoring and control targets posing the greatest risk of becoming invasive.
Introduction
Plants are deliberately introduced outside of their native ranges more frequently than other taxonomic groups (Turbelin et al. Reference Turbelin, Malamud and Francis2017), and although preventing introductions is ideal, little guidance exists for managing the plethora of species that have already arrived. One silver lining is that areas rich in nonnative species offer a chance to analyze trends and identify factors that promote naturalizations. Regions that have experienced numerous past invasions may be in the best position to tailor their biosecurity efforts to avoid future threats as new invaders continue to increase worldwide (Seebens et al. Reference Seebens, Blackburn, Dyer, Genovesi, Hulme, Jeschke, Pagad, Pyšek, Winter, Arianoutsou, Bacher, Blasius, Brundu, Capinha and Celesti-Grapow2017). Furthermore, their invasion histories may offer useful lessons to areas that have so far experienced fewer invasions but may face increasing threats in the future (Brown et al. Reference Brown, Prieto, Corbin, Ness, Borroto-Páez, McCay and Farnsworth2021; Russell et al. Reference Russell, Meyer, Holmes and Pagad2017).
An increase in the number of new invaders over the past centuries is well documented in many regions (Seebens et al. Reference Seebens, Blackburn, Dyer, Genovesi, Hulme, Jeschke, Pagad, Pyšek, Winter, Arianoutsou, Bacher, Blasius, Brundu, Capinha and Celesti-Grapow2017), but few studies have investigated the temporal dynamics of these trends and how they correlate with socioeconomic activities (van Kleunen et al. Reference Kleunen, Xu, Yang, Maurel, Zhang, Dawson, Essl, Kreft, Pergl, Pyšek, Weigelt, Moser, Lenzner and Fristoe2020). This knowledge gap represents a significant problem for biosecurity efforts, as it is difficult to determine whether our perceptions about the types of species and pathways most in need of management match the current reality (Essl et al. Reference Essl, Dullinger, Rabitsch, Hulme, Hülber, Jarošík, Kleinbauer, Krausmann, Kühn, Nentwig, Vilà, Genovesi, Gherardi and Desprez-Loustau2011). More generally, questions have arisen about whether we should expect species to continue to naturalize at their historic rates at the regional scale (Meyerson and Mooney Reference Meyerson and Mooney2007). Increased regulation of imports and greater awareness of the negative impacts from nonnative species might result in a decreased rate of naturalization over time, whereas more frequent economic trade worldwide may result in increasing naturalization rates. Additionally, Seebens et al. (Reference Seebens, Blackburn, Dyer, Genovesi, Hulme, Jeschke, Pagad, Pyšek, van Kleunen, Winter, Ansong, Arianoutsou, Bacher, Blasius and Brockerhoff2018) propose that the rate of accumulation for nonnative species may begin to slow if species source pools are exhausted, and alternatively, a rise in emerging invaders may be explained by increased accessibility to new species source pools via the expansion of global trade networks. A shift or expansion in species source pools brought on by economic changes may maintain high rates of naturalization even in regions that already host large numbers of naturalized species.
The capacity for these species to spread once they arrive or remain locally naturalized is even less understood. This issue is particularly important for oceanic archipelagos, which offer discrete inter-island borders that should theoretically aid biosecurity efforts (Weigelt et al. Reference Weigelt, Jetz and Kreft2013). In the absence of policies that limit inter-island spread, it is important to determine whether spread within an archipelago is truly limited, or whether natural inter-island isolation is essentially erased by inter-island trade. Another challenge faced by high oceanic islands and mountain regions alike is that new plant species are often initially introduced to lowland regions, which are often heavily disturbed and populated by humans (Pauchard et al. Reference Pauchard, Kueffer, Dietz, Daehler, Alexander, Edwards, Arévalo, Cavieres, Guisan, Haider, Jakobs, McDougall, Millar, Naylor and Parks2009; Rojas-Sandoval et al. Reference Rojas-Sandoval, Ackerman and Tremblay2020). Meanwhile, less disturbed native-dominated habitats are more likely to persist at inaccessible upper elevations that correspond to cooler climates, which may be inhabited by numerous endemic species of conservation concern. This pattern warrants investigation into whether nonnative species can spread to cooler, higher-elevation areas dominated by natives. Some studies have attempted to address this question by developing species distribution models, but these analyses are often limited to a small number of species that are selected based on prior decisions about their invasive behavior or impacts. The lack of whole-flora analyses precludes an answer to whether native species at higher elevations are at risk of being supplanted by hundreds of nonnatives introduced at lower elevations over time.
In this study, we consider the entire nonnative flora of the Hawaiian Islands, an archipelago system particularly apt for such an analysis due to numerous nonnative species and a dynamic socioeconomic history. Additionally, Hawai‘i’s high proportion of endemic species and cultural richness adds urgency to finding biosecurity strategies that can address invasive species problems. The trends and origins of rapidly accumulating nonnative plants in Hawai‘i were examined between 1800 and 1980 by Wester (Reference Wester, Stone, Smith and Tunison1992), who noted a correlation between economic activities and introduction rates over time. Since then, the number of known naturalized plants in Hawai‘i has more than doubled and significant effort has been made to compile data on the naturalization status of species on each island (Imada Reference Imada2019; Wagner et al. Reference Wagner, Herbst and Sohmer1999). These new data, combined with the global digitization of herbarium specimens, allow for a more detailed analysis of naturalization rates and further allow us to examine the spread of species throughout the archipelago. First, we investigate the composition of Hawai‘i’s flora, asking: Do species tend to originate from certain plant families, continents, or climates, and how many are capable of growing at higher-elevation, cooler climate types where natives currently tend to dominate? Second, we analyze dates of first naturalization records alongside probable introduction pathways and corresponding socioeconomic events, asking: Have naturalization rates increased or decreased, and do these shifts correspond to socioeconomic changes? Finally, we investigate dates of first known introduction to consider the number of islands on which nonnative plants are present, asking: How does time or introduction pathway influence inter-island spread?
Materials and Methods
A list of naturalized species was compiled based on Imada (Reference Imada2019) for six islands in the Hawaiian archipelago: Kaua‘i, O‘ahu, Molokai, Lānai, Maui, and Hawai‘i. The island of Kaho‘olawe and all of the northwest Hawaiian Islands were excluded, because they are uninhabited and geographically less complex relative to the other islands. The island of Ni‘ihau was also excluded, because, while it hosts a small population of people, plant surveys are infrequent due to its private ownership. We defined “naturalized” as nonnative species that survive and reproduce naturally outside cultivation over many generations (Blackburn et al. Reference Blackburn, Pyšek, Bacher, Carlton, Duncan, Jarošík, Wilson and Richardson2011; Pyšek et al. Reference Pyšek, Richardson, Rejmanek, Webster, Williamson and Kirschner2004; Richardson et al. Reference Richardson, Pyšek, Rejmánek, Barbour, Panetta and West2000), and thus, 225 plants considered questionably naturalized according to Imada’s list (Reference Imada2019) were excluded from analyses.
Year of first collection and year of naturalization were retrieved for all naturalized plant species in Hawai‘i by examining digitized herbarium voucher labels and new naturalization reports (Evenhuis and Miller Reference Evenhuis and Miller2015), which often include biogeographic information and population status. Specimen data were retrieved by querying the Bernice Pauahi Bishop Museum (BISH), National Tropical Botanical Garden (PTBG) and Smithsonian U.S. National herbaria databases as well as the Global Biodiversity Information Facility (GBIF 2020), which included specimens from an additional 81 institutions. This compiled data set included 77,980 herbarium specimens of species on our naturalized checklist. Based on the recognized plant use(s) or non-use, each species was categorized according to its probable introduction pathway into Hawai‘i as follows: accidental, food/medicine/textile, forestry, and ornamental/landscaping. These pathways were inferred mainly using the CABI Invasive Species Compendium (CABI 2021) or other early records of plant use and descriptions on the voucher labels of early specimens. Continent of origin, plant family, and taxonomic data were obtained from the Plants of the World database (POWO 2019), and life forms were classified as shrub, herb, tree, vine, succulent, or aquatic based on descriptions from floras (eFloras 2017; Wagner et al. Reference Wagner, Herbst and Sohmer1999) to analyze the relative proportion of each category within Hawai‘i’s nonnative flora. We additionally explored other ways of categorizing continents of origin and compared the results for single versus multi-continent groupings. To determine whether plants introduced through certain introduction pathways were more likely to originate from multiple continents, we compared the observed versus expected number of species ranging across one, two, or more than two continents using a chi-square test of independence. Post hoc analyses of this test and all subsequent chi-square tests were Bonferroni adjusted for multiple comparisons.
Naturalization rates were examined by plotting the accumulation of species over time based on year of naturalization using the purrr (Henry and Wickham Reference Henry and Wickham2020) and ggplot2 (Wickham Reference Wickham2016) packages in R. We analyzed dates from 1910, which coincides with the beginning of plant voucher collection for local herbaria, until 2010, to exclude a potential lag time in depositing recently vouchered specimens. Rates of increase over time were calculated by dividing the increase in the number of naturalized plants by the time elapsed between dates. To determine whether naturalization rates have increased or decreased in recent years, we fit the data to linear, exponential, and saturating (logistic growth) curves using the nls function in the stats package in R v. 4.0.3 (R Core Team 2020) and compared models using the Akaike information criterion (AIC). To determine whether sampling effort may have affected our results, we considered the number of native plant vouchers deposited at the BISH annually as a proxy for sampling effort over time. We analyzed collection trends between 1910 and 2010 and compared the number of vouchers collected with the number of new naturalization reports at 1-, 5-, and 10-yr intervals.
To understand which factors may have affected naturalization rates, we reviewed the literature describing Hawai‘i’s economic history and compared potentially significant events with naturalization trends. We assessed possible economic drivers of naturalization rates for each introduction pathway by conducting linear regression analyses in R (R Core Team 2020). Our independent variables included population, tourism, and agriculture during 1900 to 2020, measured as the number of residents, the number of tourists, and acres of farmland in production per decade. For the first two, we derived data from the Hawai‘i Department of Business, Economic Development & Tourism (DBEDT 2020a, 2020b); for the third, we obtained data from the National Agricultural Statistics Service (NASS 2020). A fourth explanatory variable was real gross domestic product (GDP), which was adjusted for inflation to 2019 US dollars, with values before 1970 from Schmitt (Reference Schmitt1977) and thereafter from DBEDT (2020a). Where Shapiro-Wilks tests showed that data were not normally distributed, we log transformed these data before analysis. Additionally, we performed a Breusch-Godfrey test in conjunction with our linear regression analyses to ensure our inferences were not biased by serial autocorrelation of the residuals.
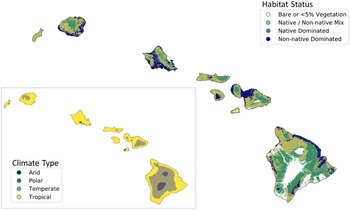
To understand the ability of nonnative plants to invade Hawai‘i’s remaining native ecosystems, we compiled native range climate data for each nonnative species based on the Köppen-Geiger climate classification (Beck et al. Reference Beck, Zimmermann, McVicar, Vergopolan, Berg and Wood2018). This system groups climates into five main classes: tropical (warm year-round; average monthly temperature >18 C + significant precipitation), arid (very little annual precipitation, calibrated according to temperature), temperate (cool; at least 1 mo between 10 and 18 C), continental (seasonally cold; with at least 1 mo <0 C), and polar (very cold; summers not >10 C). Köppen-Geiger classifications are based on temperature and precipitation rather than geography, meaning that elevation and latitude may interact to produce a range of climate types not predictable by latitude alone (Beck et al. Reference Beck, Zimmermann, McVicar, Vergopolan, Berg and Wood2018). For instance, this system could classify a climate as temperate whether it is from temperate latitudes (between subtropical and polar geographic zones) or from temperate elevations within tropical or subtropical geographic zones. The potential for each species to grow in each of these conditions was inferred by retrieving the Köppen-Geiger climate classification for individual occurrence records in their native range such that species were allowed to be classified as having more than one climate type. Native range descriptions were harvested from numerous floristic studies compiled in the Plants of the World database (POWO 2019) using the taxize package in R (Chamberlain et al. Reference Chamberlain, Szoecs, Foster, Arendsee, Boettiger, Ram, Bartomeus, Baumgartner, O’Donnell, Oksanen, Greshake Tzovaras, Marchand, Tran, Salmon, Li and Grenié2020b) to construct native range polygons based on geopolitical boundaries. Occurrence records within these polygons were retrieved from the Global Biodiversity Information Facility (GBIF 2020) using the rgbif package in R (Chamberlain et al. Reference Chamberlain, Barve, McGlinn, Oldoni, Desmet, Geffert and Ram2020a) and filtered to exclude cultivated species and duplicate records. If 10 or more occurrences were retrieved with accurate location data (<1 km uncertainty), the kgc package (Bryant et al. Reference Bryant, Wheeler, Rubel and French2017) was used to retrieve the Köppen-Geiger classification for each occurrence. Climate classifications based on fewer than 10 occurrences were double-checked against climate and range descriptions in floras and the Plants of the World database (POWO 2019) and cross-referenced with a 1-km-resolution map of Köppen-Geiger climates (Beck et al. Reference Beck, Zimmermann, McVicar, Vergopolan, Berg and Wood2018). We then compared the resulting data set for the nonnative flora to maps of native-dominated ecosystems in Hawai‘i (Jacobi et al. Reference Jacobi, Price, Fortini, Samuel and Berkowitz2017) combined with Köppen-Geiger climate types (Beck et al. Reference Beck, Zimmermann, McVicar, Vergopolan, Berg and Wood2018) (Figure 1) using the GeoPandas package in Python (Jordahl Reference Jordahl2014).
The main Hawaiian Islands, showing habitat status (data from Jacobi et al. Reference Jacobi, Price, Fortini, Samuel and Berkowitz2017) and climate type (inset; data from Beck et al. Reference Beck, Zimmermann, McVicar, Vergopolan, Berg and Wood2018), which shows the overlap between temperate climate and native-dominated ecosystems.

To investigate whether the rate of inter-island spread varied among introduction pathways, and whether these rates have changed over time, we calculated the average number of inter-island introductions per decade. This rate was based on records of first occurrence on each island, which allowed us to determine the length of time each species took to be recorded on a new island. The occurrence data set included the aforementioned herbarium specimens, as well as research-grade citizen scientist observations from iNaturalist via GBIF (2020), which added 137,209 observations. We further determined whether species introduced earlier have spread to more islands than recently introduced species by tallying the number of islands where a species is present and where it has naturalized by analyzing records binned by 25-yr time intervals, starting with the onset of consistent herbarium collection in 1910 and ending in 2010. To understand the extent to which species are simply present as opposed to fully naturalized, we relied on reports describing population status by field botanists on each island, compiled by Imada (Reference Imada2019). Species present in the occurrence data set but not reported as naturalized by field botanists were considered to be present, but not necessarily naturalized (e.g., only in cultivation). Thus, species were categorized as either “present” or “not present” on an island, with present species further subcategorized as “naturalized” or “not naturalized” species. The observed versus expected number of species for each time period was then compared using chi-square tests of independence. If time has no effect on a species ability to spread between islands, then we would expect the proportion of species on just one to two islands to be no larger for recently introduced species than for earlier introductions.
Results and Discussion
Composition and Origin of Naturalized Flora
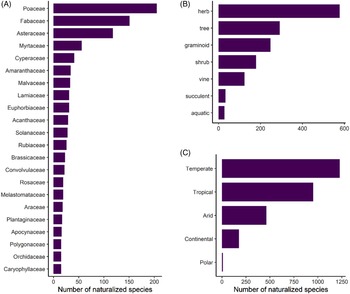
Naturalized species represent at least 55% of the total plant diversity throughout the archipelago (excluding species found only in cultivation), and thus Hawai‘i joins the ranks of 82 other islands or island systems (26% of all islands worldwide) known to host more naturalized species than native species (Essl et al. Reference Essl, Dawson, Kreft, Pergl, Pyšek, van Kleunen, Weigelt, Mang, Dullinger, Lenzner, Moser, Maurel, Seebens, Stein and Weber2019). The 1,488 species that have naturalized in the main Hawaiian Islands belong to 165 families and 789 genera, corresponding to a species density of 0.89 naturalized species per 10 km2. Of these taxa, 70% are eudicots (including basal eudicots), 26% are monocots, 3% are pteridophytes, and 1% are gymnosperms. Poaceae (206 species), Fabaceae (151 species), and Asteraceae (120 species) have the highest species richness, comprising 32% of all naturalized species. This composition is similar to both continental and insular floras in tropical or subtropical areas (Ansong et al. Reference Ansong, Pergl, Essl, Hejda, van Kleunen, Randall and Pyšek2019; Dodd et al. Reference Dodd, Burgman, McCarthy and Ainsworth2015; Rojas-Sandoval and Acevedo-Rodriguez Reference Rojas-Sandoval and Acevedo-Rodriguez2015), as well as patterns in the global naturalized flora. Although these families are among the most speciose families worldwide, others have calculated that Poaceae and Fabaceae are proportionally overrepresented relative to family size (Pyšek et al. Reference Pyšek, Pergl, Essl, Lenzner, Dawson, Kreft, Weigelt, Winter, Kartesz, Nishino, Antonova, Barcelona, Cabezas, Cardenas and Cardenas-Toro2017). An additional 22 families (13%) have 15 species or more (Figure 2A), while 50 families (31%) are represented by a single species. Twelve genera contain 10 or more species (1.5%), with the top 5 being Eucalyptus L’Hér. (Myrtaceae; 28 species), Cyperus L. (Cyperaceae; 22 species), Paspalum L. (Poaceae; 18 species), Euphorbia L. (Euphorbiaceae; 17 species), with Crotalaria L. (Fabaceae; 15 species) and Eragrostis Wolf (Poaceae; 15 species) tied for 5th place. However, the majority of genera (65%) contain a single naturalized species.
Number of naturalized plants in Hawai‘i as categorized by: (A) plant families containing >15 species; (B) life forms; and (C) Köppen-Geiger climate types within their native ranges. Numbers add up to be greater than the total number of naturalized plants because species can occur in more than one climate type.

Naturalized species in Hawai‘i display a diversity of life forms, with 39% being herbs, 19% trees, 17% graminoids, 12% shrubs, 9% vines, 2% succulents, and 2% aquatic (Figure 2B). These patterns mirror those observed elsewhere; for instance, naturalized species in Puerto Rico and the Virgin Islands are predominantly herbs and trees, although they have proportionally more woody species (trees + shrubs) in comparison to Hawai‘i, which has somewhat more herbs and grasses (Rojas-Sandoval and Acevedo-Rodriguez Reference Rojas-Sandoval and Acevedo-Rodriguez2015).
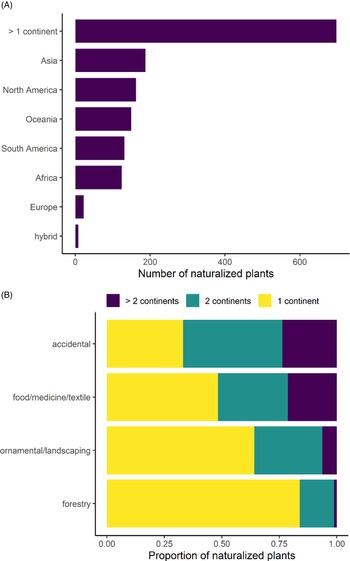
No continent emerges as a dominant donor of naturalized species, with 13% originating from Asia, 11% from North America, 10% from Oceania, 9% from South America, 8% from Africa, and 1% from Europe, and almost half of the species have native ranges that span multiple continents (47%; Figure 3A). This pattern is similar to that found by van Kleunen (Reference Kleunen, Dawson, Essl, Pergl, Winter, Weber, Kreft, Weigelt, Kartesz, Nishino, Antonova, Barcelona, Cabezas, Cárdenas and Cárdenas-Toro2015) when quantifying plant exchanges globally, albeit with fewer European introductions (20.3% Asia, 17.1% North America, 15% Europe, 14.3% Africa, 12.8% South America), revealing the cosmopolitan nature of Hawai‘i’s nonnative species source pool. The precise origin of naturalized species is difficult to determine, because species may be sourced from anywhere within their ranges (many of which span multiple continents), and they may not have arrived directly from their home continents. However, the lack of a single geographic region identifiable as a dominant donor of species in Hawai‘i (even when broader, multi-continental ranges were explored) contrasts studies of other nonnative floras. In New Zealand, for example, 49% of species are from Eurasia (Gatehouse Reference Gatehouse2008), and the Americas are the source of most of the nonnative species in Ghana (Ansong et al. Reference Ansong, Pergl, Essl, Hejda, van Kleunen, Randall and Pyšek2019) and the source of 50% of those in Puerto Rico and the Virgin Islands. Although the Americas are also the largest donor region for Hawai‘i (20%), they did not contribute much more than any other region. These comparatively even proportions indicate that a naturalized species in Hawai‘i has an almost equal likelihood of originating from any continent and that the nonnative flora likely includes a diverse array of ecological adaptations and evolutionary histories.
Number of naturalized plants in Hawai‘i as categorized by: (A) continent of origin and (B) the proportion of species from single or multiple continents per probable introduction pathway.

Our investigation into the climatic origins of Hawai‘i’s naturalized species revealed that more than 83% (1,240 species) are native to temperate climates according to the Köppen-Geiger system, but most of these species show broad climate preferences, of which 66% also occur in tropical climates within their native ranges (Figure 2C). Only 16% of species appear to be obligate tropical species, although the majority of all species (64%) occur in this climate type in their native ranges. Fewer species are native to arid (31%), continental (12%), and polar (<1%) climates (Figure 2C). Thus, most nonnatives are likely able to grow in tropical lowlands as well as in temperate areas in Hawai‘i. These findings are especially relevant alongside the patterns shown in Figure 1, where native-dominated ecosystems comprise only 37% of the land area in the main Hawaiian Islands, and 70% of these patches are classed as temperate, as they tend to persist at cool mid- to upper elevations (Beck et al. Reference Beck, Zimmermann, McVicar, Vergopolan, Berg and Wood2018; Jacobi et al. Reference Jacobi, Price, Fortini, Samuel and Berkowitz2017). Our data reveal that the current presence of intact, relatively uninvaded native ecosystems at these elevations is not explainable by a lack of nonnative species that can tolerate these climates, and these ecosystems could eventually be invaded by temperate species that have so far only established in Hawai‘i’s lowlands.
The majority (88%) of temperate patches in Hawai‘i are subclassified as having a temperate oceanic climate (Cfb), and 11% of the temperate patches are warm-summer Mediterranean (Csb), both of which are defined as having the warmest month averaging below 22 C, although the former has no dry season, while the latter has a dry summer season (Beck et al. Reference Beck, Zimmermann, McVicar, Vergopolan, Berg and Wood2018). In contrast, 95% of nonnative-dominated habitats exist in the tropical lowlands, and most species were likely introduced to these areas because they coincide with human settlements (as has been demonstrated for other islands; Rojas-Sandoval et al. Reference Rojas-Sandoval, Ackerman and Tremblay2020). One limitation of climate classes is that each class spans a range of environmental gradients, and it cannot be assumed that species are climatically suited to the entire binned classes as mapped onto Hawai‘i (Figure 1). For example, the humid subtropical temperate subclass (Cfa) accounts for merely 0.5% of native-dominated habitats in Hawai‘i and is defined as having no dry season and the warmest monthly averages above 22 C (i.e., warmer than the Cfb and Csb classes; Beck et al. Reference Beck, Zimmermann, McVicar, Vergopolan, Berg and Wood2018). Thus, species restricted to the Cfa class (or warmer) in their native range are unlikely to be able to spread throughout Hawai‘i’s native-dominated temperate zones, although we determined that only 12% of naturalized species were so restricted. Nonetheless, 59% of species broadly classified as temperate in our study exactly match the dominant climate subclasses of Hawai‘i’s native-dominated temperate areas (Cfb and Csb), amounting to 49% of total naturalized species. Therefore, almost half of Hawai‘i’s naturalized species are probably capable of invading temperate native-dominated areas, and perhaps more if some species can spread in climate types not found within their native ranges. These findings reflect those reported by Daehler (Reference Daehler2005), who found that hundreds of species have already naturalized above 1,200 m, which roughly corresponds to the beginning of the temperate zone.
However, it is worth noting that our climate class analysis may be subject to the sampling biases associated with GBIF occurrence records, where sampling is often denser in wealthier nations. The variety of climate classes occupied by species native to affluent countries in our analyses are likely better represented than species native to poorer ones, and this may have underestimated the number of species that occupy tropical climate classes (as many poor nations exist in tropical areas). However, this bias is likely less important for temperate climate classes, which are well represented in developed countries in North America, Europe, and Australia.
The majority of species were likely introduced deliberately, with 40% introduced for ornamental or landscaping purposes; 16% for food, medicine, or textiles; 6% for forestry; and another 4% as cultivated species that do not fit within these categories. Likely accidental introductions account for 31% of all species, while the introduction pathway of another 4% of species is unknown. Probable introduction pathway is associated with the number of continents covered by a species’ native range (χ2 (df = 6, N = 1357) = 164.43, P < 0.001), and post hoc tests revealed that accidental introductions are significantly more likely to have a native range that spans multiple continents, with just 33% of accidentals being native to a single continent, while 42% are native to two continents, and another 24% are native to more than two continents (Figure 3B). In contrast, plants selected for ornamental or landscaping purposes are significantly more likely to originate from single continents, with 64% from a single continent, while 29% and 6% are native to two and more than two continents, respectively. This trend is even more pronounced for forestry species, with 84% of species being native to a single continent and many of these introductions originating from Oceania.
This association between introduction pathway and native continental range suggests that introduction pathways may play different roles in how the homogenization of global biodiversity will unfold (McKinney and Lockwood Reference McKinney and Lockwood1999; Winter et al. Reference Winter, Schweiger, Klotz, Nentwig, Andriopoulos, Arianoutsou, Basnou, Delipetrou, Didziulis, Hejda, Hulme, Lambdon, Pergl, Pyšek, Roy and Kuhn2009) and should be investigated further. The tendency for accidentally introduced species to have multi-continental ranges may be explained by these species having a larger geographic donor area or life-history characteristics that enable them to spread widely. Nonetheless, accidentally introduced species tend to already be represented on multiple continents by their native ranges, while the opposite is true for ornamental and forestry species. Horticulturalists may be more likely to seek out seemingly unique ornamentals, which may correspond to these species being native to a limited geographic range. For example, we determined that 35 naturalized species in Hawai‘i are endemic to other islands (data not shown). Thus, horticulture may play a disproportionate role in spreading species whose native ranges are small, which challenges the notion that the agents of global biotic homogenization are exclusively species with large native ranges (McKinney and Lockwood Reference McKinney and Lockwood1999; Newbold et al. Reference Newbold, Hudson, Contu, Hill, Beck, Liu, Meyer, Phillips, Scharlemann and Purvis2018). Additionally, species that are rare worldwide may not always have a lower likelihood of being transported to another region, which has been assumed in models projecting global species accumulation rates (Seebens et al. Reference Seebens, Bacher, Blackburn, Capinha, Dawson, Dullinger, Genovesi, Hulme, Kleunen, Kühn, Jeschke, Lenzner, Liebhold, Pattison and Pergl2021). Further investigation into this phenomenon would be particularly interesting for islands, which host globally unique native (i.e., endemic) species.
Rates of Naturalization
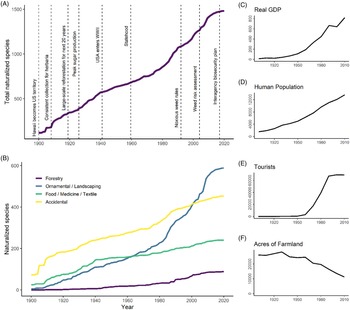
The increase in the number of naturalized species over time is roughly linear at an average rate of 12 species yr−1 during 1910 to 2010 (Figure 4A) or possibly increasing at a modest rate. Comparisons between trend line shapes revealed that the data fit an exponential model (AIC = 1,059) somewhat better than a linear line (AIC = 1,089), although the growth constant of the fitted exponential line was small (1.27% yr−1; data not shown). Given this small rate of increase alongside the uncertainty associated with the true timing of naturalization, we chose to interpret the overall trend as approximately linear, with the possibility that the naturalization rate has increased above 12 species yr−1 in the last 30 yr. Furthermore, we found no evidence to suggest that the increase in naturalized species reflects an increase in sampling effort over time, as the number of vouchers collected for herbaria was not correlated with the number of new naturalization reports (R2 = 0.03, P = 0.08). Collection for herbaria has not increased over time, but instead shows variation with peaks in 1925 to 1935 and the 1970s and 1980s as well as notable slumps in 1938 to 1945 and 1990 to 2005. Increases in plant families and genera are also roughly linear over time, corresponding to an average increase of 6 genera yr−1 and 1.2 families yr−1 (data not shown). The roughly linear accumulation of nonnative species in Hawai‘i is comparable to findings for other islands such as New Zealand, which shows a slight increase in the rate of naturalization after 1940 (Hulme Reference Hulme2020), but contrasts with Puerto Rico and the Virgin Islands, which show a marked deceleration after the early 1900s (Rojas-Sandoval and Acevedo-Rodriguez Reference Rojas-Sandoval and Acevedo-Rodriguez2015). Our data do not suggest that the overall rate of naturalized species accumulation is rapidly accelerating, which some have predicted due to expanded global trade networks in recent decades (Hulme et al. Reference Hulme, Pyšek, Nentwig and Vilà2009; Meyerson and Mooney Reference Meyerson and Mooney2007). We also did not find evidence that the number of nonnative species in Hawai‘i is beginning to approach saturation, which was recently projected for the Pacific Island region based on an analysis of potential species source pools and naturalization rates (Seebens et al. Reference Seebens, Bacher, Blackburn, Capinha, Dawson, Dullinger, Genovesi, Hulme, Kleunen, Kühn, Jeschke, Lenzner, Liebhold, Pattison and Pergl2021).
Naturalization of plants from 1900 to 2020, showing: (A) accumulation of all species, alongside events in Hawai‘i’s history that may potentially affect naturalization rates; and (B) accumulation of all species, categorized by their likely introduction pathway. (C–F) Changes in real gross domestic product (GDP in 2019-adjusted US$1 million), human population, tourists, and acres of productive farmland in Hawai‘i over time, each with y axis units divided by 100.

While the overall naturalization rate has remained relatively constant over time, naturalization rates associated with different introduction pathways have varied and correlate with historic socioeconomic activities (Figure 4B–F; Box 1). Notably, naturalization rates track a shift from an agriculture-based economy to one fueled by tourism. Plants introduced for food accumulated rapidly between 1910 and 1940, corresponding to 3.1 species yr−1, and then slowed to 1.24 naturalizations yr−1 between 1940 and 2010, a 60% rate decrease. Subsequent model comparisons for food plant naturalization over time supported a saturating curve (AIC = 803) as a better fit over the linear model (AIC = 891). Rate of naturalization for food plants was positively correlated with acres of productive farmland (R2 = 0.47, P = 0.020), which began to decrease in the early to mid-1900s. In contrast, the rate of naturalization of ornamentals during the study period fits an exponential growth curve (AIC = 842) over a linear model (AIC = 1,131), eventually overtaking food plants around 1960. Ornamental naturalizations then noticeably accelerated around 1980, increasing from 3 species yr−1 before 1980 to 10.2 species yr−1 after 1980 (a 240% increase), and their rate of naturalization is positively correlated with human population (R2 = 0.73, P < 0.001), GDP (R2 = 0.68, P = 0.002), and tourism (R2 = 0.68, P = 0.004). Thus, the approximately linear accumulation of species overall is maintained by recent increases in the rate of naturalization for ornamental species, which compensates for the decreasing food plant naturalizations. Breusch-Godfrey tests confirmed that serial autocorrelation did not exist in our residuals for these or any of the subsequent linear regression analyses examining the relationship between naturalization rate and socioeconomic variables.
Post-1900 socioeconomic events likely affecting plant naturalizations in Hawai‘i.
After Hawai‘i was annexed as a U.S. territory in 1900, the U.S. government recruited thousands of plantation workers from all over the world to tend sugarcane, which was Hawai‘i’s dominant industry in the early 1900s (La Croix Reference La Croix2019). Workers brought familiar food plants with them (La Croix Reference La Croix2019), including species consumed in Japan, Korea, the Philippines, Spain, Portugal, Puerto Rico, England, Germany, and Russia. The sugarcane industry peaked in 1926, while pineapple production was expanding, and accidental introductions during this time likely took the form of agricultural weeds, which were able to naturalize among vast tracts of land recently converted to agricultural use (Perroy et al. Reference Perroy, Melrose and Cares2016). Despite economic focus on crop production, plants cultivated commercially for direct human consumption were not very diversified (Perroy et al. Reference Perroy, Melrose and Cares2016). However, livestock forage trials were conducted at agricultural research stations on multiple islands in the early 1900s, and many grass species and other fodder plants were introduced that have since naturalized (Henke Reference Henke1945; Work Reference Work1946).
As a result of intensive agricultural practices and spread by feral ungulates, the declining state of native forests was increasingly noted in the early 1900s, raising concerns about the freshwater supply and soil erosion (Woodcock Reference Woodcock2003). To solve this problem, tens of millions of trees and other plants were planted in forest reserves from 1910 to 1960 (especially between 1919 and 1940), comprising more than 1,000 species (Skolmen Reference Skolmen1980). However, an increased naturalization rate for forestry trees is not detectable until well after this period (˜1960), and less than 10% of these forestry species are now considered naturalized (Imada Reference Imada2019).
The Great Depression in the 1930s, followed by World War II, was associated with economic stagnation, and fear of encountering enemy ships reduced oceanic trade, which may have resulted in fewer plant introductions (La Croix Reference La Croix2019). However, a flood of armed service personnel may have accidentally introduced other species. Around the same period, agriculture slowed due to increased worker rights and the cost of labor, as well as competition with foreign markets (Linnekin Reference Linnekin1997), which likely corresponded with fewer introductions of food plants. However, the attainment of U.S. statehood in 1959 demarcates a shift to an economy dominated by the tourism industry and commercial expansion that is associated with a rapid increase in the naturalization of ornamental species (La Croix Reference La Croix2019; Linnekin Reference Linnekin1997). Hawai‘i experienced its strongest economic growth between 1958 and 1973, and commercial flights to Hawai‘i, which were previously only affordable by the upper class, suddenly became affordable to the middle class (La Croix Reference La Croix2019). This drastically increased the number of visitors and fueled the growth of infrastructure to accommodate them, likely increasing the demand for ornamentals to improve the aesthetic appeal of Hawai‘i and its new tourism-based economy (Ayala Reference Ayala1991).
GDP, tourism, and population positively covaried in our analyses (population vs. tourism: R2 = 0.80, P < 0.001; GDP vs. tourism: R2 = 0.88, P < 0.001; GDP vs. population: R2 = 0.82, P < 0.001), and it is difficult to pinpoint whether the increased naturalization of ornamentals is a direct result of tourism or increased economic well-being that coincided with this economic shift. However, it seems likely that an increased demand for ornamentals may have partially arisen from a desire to increase the aesthetic appeal of the islands for tourists. Ayala (Reference Ayala1991) describes a late 1900s paradigm shift in the international tourism industry to create large resort landscapes that are billed as alluring destinations unto themselves, citing specific examples of Hawaiian resorts that introduced thousands of plants and animals to generate a sense of exoticism and luxury. Nevertheless, economic growth from tourism investments not only increased infrastructure to support visitors, but also improved the financial well-being of Hawai‘i’s growing population (Figure 4C–E). An increase in disposable incomes for both residents and local governments (via tax revenues) likely promoted spending on amenities and beautification not only for tourists. Furthermore, other studies confirm that naturalized plant richness is commonly correlated with measures of human wealth (Denslow et al. Reference Denslow, Space and Thomas2009). Regardless of the exact reasons for introduction, our analyses emphasize the role of the ornamental and landscaping industry as an important source of naturalized species, and this finding is reflected by several studies of islands and continents alike where ornamentals make up the largest portion of naturalized floras (Crawley et al. Reference Crawley, Harvey and Purvis1996; Dodd et al. Reference Dodd, Burgman, McCarthy and Ainsworth2015; Pyšek et al. Reference Pyšek, Sádlo and Mandák2002; Rojas-Sandoval and Acevedo-Rodriguez Reference Rojas-Sandoval and Acevedo-Rodriguez2015; Silva and Smith Reference Silva and Smith2004). Our data from Hawai‘i, as well as similar findings in New Zealand (Hulme Reference Hulme2020), suggest that the dominance of ornamentals in naturalized floras may be a recent phenomenon, which could have implications for studies on how plants are exchanged globally if this trend is found to exist in other regions (van Kleunen et al. Reference Kleunen, Dawson, Essl, Pergl, Winter, Weber, Kreft, Weigelt, Kartesz, Nishino, Antonova, Barcelona, Cabezas, Cárdenas and Cárdenas-Toro2015).
Before being surpassed by ornamentals around 2000, accidentally introduced species were the most numerous group, maintaining a roughly linear trend between 1910 and 2010 that corresponds to an average rate of 3.3 accidental naturalizations yr−1 (Figure 4B). These data fit a linear model (AIC = 1,086) better than an exponential increase model (AIC = 1,234) and slightly better than a saturating (logistic) model (AIC = 1,094). This rate of naturalization is positively correlated with human population (R2 = 0.84, P < 0.001), which similarly experienced linear growth. Although forestry species are comparatively fewer in number, their rate of naturalization best fits an exponential growth curve (AIC = 564) over a linear one (AIC = 785). Between 1910 and 1970, the mean rate of forestry species was 0.32 naturalized yr−1 versus 1.49 species yr−1 after 1970, representing a 365% increase. Nonetheless, it is surprising to find that forestry has contributed significantly fewer naturalized species overall than the other introduction pathways, given the intense reforestation effort that took place in Hawai‘i in the early 1900s (Woodcock Reference Woodcock2003; Box 1). The increased rate in recent years may reflect a substantial lag phase between introduction for major reforestation efforts in the early to mid-1900s and naturalization, which may be expected, as woody species often take longer to mature (Daehler Reference Daehler2009). Alternatively, newer forestry projects in Hawai‘i, such as Eucalyptus plantings for biofuels (DeBell et al. Reference DeBell, Whitesell and Schubert1989), may be the source of recent forestry naturalizations and should be investigated further.
Inter-island Spread
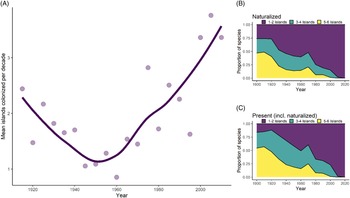
We found that the average rate of inter-island spread for all species was 1.86 islands per decade (SD = 1.84) between 1910 and 2010, although rates of spread varied widely among species. Additionally, the rate of inter-island spread appears to increase at roughly the same time as Hawai‘i’s socioeconomic shift in the middle of the 20th century, such that rates in recent years are more than three islands per decade (Figure 5A). Rates of inter-island spread over time are somewhat variable among introduction pathways (analysis not shown), with the rate of inter-island spread for food plants remaining constant in comparison to other pathways. Additionally, the spread of forestry plants increased during the early 1900s, which may be attributable to mass reforestation efforts during this time, while inter-island spread for other pathways declined.
Inter-island spread of naturalized species over time in Hawai‘i, showing (A) fluctuating rates of spread (averaged over 5-yr intervals; line is LOESS-smoothed to reduce noise), and the proportion of species introduced each decade that have spread among islands, with proportions calculated for (B) species that have fully naturalized and (C) species that are present but not necessarily naturalized.

Two sources of sampling bias may have affected estimated rates of inter-island spread. First, our data show an elevated rate of inter-island spread at the very beginning of the 1900s, coinciding with the first consistent collection of plants for the BISH herbarium in Honolulu (Figure 4A); collectors likely found many long-naturalized species on multiple islands in quick succession, translating artificially into high rates of inter-island spread until those species were collected. Second, the apparent acceleration of inter-island spread could be the outcome of the increased focus on documenting naturalizing cultivated species due to increased public awareness of these plants as invasives (Tye Reference Tye2006). However, our analysis of naturalization rates alongside socioeconomic trends lends credit to our conclusion that the ornamental naturalizations have legitimately increased. Both naturalization rate and inter-island spread rate for ornamentals coincide with the rise of GDP, tourism, and human population growth in Hawai‘i, suggesting that socioeconomic factors are at least partially responsible for these trends. Additionally, if inter-island spread trends for ornamentals were merely a sampling artifact, we might expect ornamentals to be the only group displaying an accelerated inter-island spread rate, but this is not the case. An increased rate also exists for accidentals, which have long been recorded in floras (Hillebrand Reference Hillebrand1888), and likely also reflects increased inter-island trade due to economic activity (Denslow et al. Reference Denslow, Space and Thomas2009).
The distribution of species on multiple islands (within our six-island data set) is significantly associated with time since first record, both when considering a species’ naturalized distribution (χ2 (df = 6, N = 1,369) = 403.22, P < 0.001) or where it is present but not necessarily naturalized (χ2 (df = 6, N = 1,369) = 506.22, P < 0.001). For instance, of species first recorded in the archipelago before 1910, 68% are present and 62% are naturalized on five to six islands (Figure 5B and C). In contrast, most recent introductions have one to two island distributions. For example, 84% of species first recorded between 1985 and 2010 are naturalized on merely one to two islands, but when accounting for a species’ presence alone (not necessarily naturalized), the proportion of species is smaller (75%). Although ornamental plants are more likely to be restricted to one to two islands, and accidentals and food plants are more likely to occur on five to six islands, these distributions appear to be the result of the timing of introduction, because most ornamentals were introduced recently, while the majority of food or accidental species were introduced earlier (analysis not shown). Thus, the number of islands where a plant is present does not vary according to introduction pathway after accounting for time. Our results support the findings of a recent analysis in Hawai‘i showing that weed risk assessment scores, which are mostly based on biological characteristics, are only weakly correlated with inter-island spread (Brock and Daehler Reference Brock and Daehler2020). This suggests that human activities are more important than biological traits when predicting inter-island spread for many species.
Conclusion
We show that Hawai‘i’s nonnative plants are drawn from a diversity of continents, climates and taxonomic groups and that introductions associated with past socioeconomic activities still form a major component of the current flora (Essl et al. Reference Essl, Dullinger, Rabitsch, Hulme, Hülber, Jarošík, Kleinbauer, Krausmann, Kühn, Nentwig, Vilà, Genovesi, Gherardi and Desprez-Loustau2011). Seebens et al. (Reference Seebens, Blackburn, Dyer, Genovesi, Hulme, Jeschke, Pagad, Pyšek, van Kleunen, Winter, Ansong, Arianoutsou, Bacher, Blasius and Brockerhoff2018) contend that the persistent increase in new naturalized species worldwide cannot be solely explained by sustained current economic activities, but that expanding trade networks (e.g., via socioeconomic shifts) can increase the likelihood that new species will be introduced and expand the number of geographic regions from which species can be sourced. Our analyses build on this idea by detailing the approximate timing of these socioeconomic events and demonstrate the emergence of new dominant introduction pathways that allow new species to naturalize. The horticultural industry may be particularly adept at increasing access to new species source pools if plant enthusiasts continue to drive demand for new and unusual species (van Kleunen et al. Reference Kleunen, Essl, Pergl, Brundu, Carboni, Dullinger, Early, Gonzalez-Moreno, Groom, Hulme, Kueffer, Kuhn, Maguas, Maurel and Novoa2018). After introduction to an archipelago, species may spread readily, both within an island, because they tend to have broad climatic tolerances in their native ranges, and between islands, because humans purposely or accidentally transport them. The Hawaiian archipelago needs stringent biosecurity plans to stem the accelerating inter-island spread of plants, which is bolstered by continuous new additions to the already-dominant nonnative flora.
Acknowledgments
We thank the Hawai‘i Invasive Species Council for providing the funding support to conduct this work and Clyde Imada for his careful curation of Hawai‘i’s nonnative plant checklist. Additionally, we are indebted to Barb Kennedy and Richard Pyle for their help obtaining BISH specimen data and to David Lorence for access to PTBG herbarium specimens. This is publication number 121 from the School of Life Sciences, University of Hawai’i at Mānoa. No conflict of interest has been declared.