


For over a century seasonal fluctuations in suicide have been observed (Reference MorselliMorselli, 1881; Reference DurkheimDurkheim, 1951), with studies usually showing an increase in the incidence of suicide in spring and early summer (Reference Chew and McClearyChew & McCleary, 1995; Reference PretiPreti, 2000; Reference Petridou, Papadopoulos and FrangakisPetridou et al, 2002). Suicide by violent means has shown stronger seasonal fluctuation than non-violent suicide (Reference Maes, Cosyns and MeltzerMaes et al, 1993; Reference Hakko, Rasanen and TiihonenHakko et al, 1998; Reference Preti and MiottoPreti & Miotto, 1998; Reference Rasanen, Hakko and JokelainenRasanen et al, 2002; Reference Rock, Greenberg and HallmeyerRock et al, 2003). Various meteorological factors have been suggested to be aetiologically important in this seasonality, including hours of sunshine (Reference Souetre, Salvati and BelugouSouetre et al, 1987; Reference Maes, De Mayer and ThompsonMaes et al, 1994; Reference Salib and GraySalib & Gray, 1997; Reference Preti and MiottoPreti & Miotto, 1998; Reference Petridou, Papadopoulos and FrangakisPetridou et al, 2002), low humidity (Reference Salib and GraySalib & Gray, 1997) and temperature (Reference Souetre, Salvati and BelugouSouetre et al, 1987; Reference Linkowski, Martin and de MaertelaerLinkowski et al, 1992; Reference Maes, De Mayer and ThompsonMaes et al, 1994; Reference Preti and MiottoPreti & Miotto, 1998). Several European studies have examined the possible role of temperature in suicide by looking at the relationship between monthly or weekly suicide rates and temperature (Reference Souetre, Salvati and BelugouSouetre et al, 1987; Reference Linkowski, Martin and de MaertelaerLinkowski et al, 1992; Reference Maes, De Mayer and ThompsonMaes et al, 1994; Reference Jessen, Steffensen and JensenJessen et al, 1998; Reference Preti and MiottoPreti & Miotto, 1998); none of these studies used a daily measure of temperature, despite daily temperature being a methodologically preferable measure of exposure because the health effects of excessive heat are likely to be immediate (Reference Basu and SametBasu & Samet, 2002).
More generally there is evidence of a U-shaped relationship between mean temperature and all-cause mortality (Reference Curriero, Heiner and SametCurriero et al, 2002), with (for example) minimum all-cause mortality in London occurring at 19 °C (Reference Hajat, Kovats and AtkinsonHajat et al, 2002). During extremes of high temperature (i.e. heatwaves) increases in daily mortality have been clearly documented (Reference Kovats and Ebi-KristieKovats & Ebi-Kristie, 2006), but this effect has not been specifically investigated for suicide before. Our aims were first to assess the relationship between daily suicide counts and daily temperature, and second to assess the impact of specific heatwave episodes on suicide.
METHOD
Data
The study used an ecological design. Individual exposure to ambient temperature was not known for those who died by suicide; therefore temperature was assigned at the group level for each day of the period of study. The main statistical approach was time-series regression, which is a technique used for the analysis of longitudinal data that exhibit trends and/or cyclical patterns. Since correlations between suicides and temperature were assessed on a short-term (day-to-day) basis, neither the prevalence of baseline risk factors nor a population denominator needed to be known in order to perform time-series analysis, although time-varying confounders had to be accounted for (Reference Schwartz, Spix and TouloumiSchwartz et al, 1996).
The UK Office for National Statistics (ONS) provided mortality data on all deaths considered due to suicide between 1 January 1993 and 31 December 2003 in England and Wales. All deaths that occurred before 31 January 2000 were coded using ICD–9 codes (World Health Organization, 1978); thereafter ICD–10 codes were used (World Health Organization, 1992). Deaths assigned to the following codes were included: ICD–9 codes E950.0–E959.0, E980.0–E989.0 (excluding E988.8); ICD–10 codes X60–X84, Y10–Y34 (excluding Y33.9). Deaths recorded as being due to ‘undetermined intent’ were included in the study. For each death information was available on date of death, gender and method. Suicides were classified as ‘violent’ or ‘non-violent’ depending on the method used and in line with previous studies – see, for example, Maes et al (Reference Maes, De Mayer and Thompson1994). Self-poisonings by solid, liquid or gas were classed as ‘non-violent’ suicide and all other methods were considered ‘violent’. A small number (n = 11) of ICD–9 coded deaths were classified as being due to ‘late effects’ of either self-inflicted injury or assault; these were discarded from the analysis as date of death might not have been close in time to the date of injury.
The Met Office (http://www.metoffice.gov.uk) provided central England temperature data for the period under study; these include daily maximum and minimum temperatures collated from readings at four monitoring stations in central England (Reference Parker, Legg and FollandParker et al, 1992). Daily mean temperature was calculated from the average of the maximum and minimum temperatures. Duration of daylight for each day of the year was obtained for London from the website http://www.sunrisesunset.com.
Analysis strategy
All analyses were performed using Stata version 8.2 for Windows. The data were collapsed into daily counts of suicide, violent suicide and non-violent suicide for each date in the series. Basic description of the data was undertaken prior to graphical examination of suicide trends by season and over the entire time period.
Generalised linear modelling
The relationship between death counts and mean temperature was explored using Poisson generalised linear modelling. The initial strategy was to include potential time-varying confounders in a model that excluded temperature. Confounders were identified as follows:
-
(a) year of death was included in the model to control for any overall trend in suicide between 1993 and 2003;
-
(b) month of death was included to control for the effect of seasonality (a monthly term was felt to best represent any slow time-varying drivers of suicide seasonality);
-
(c) indicator variables for day of the week, Christmas and other public holidays were also included in the model, as these have previously been associated with suicide (Reference LesterLester, 1979; Reference Johnson, Brock and GriffithsJohnson et al, 2005a ); ‘Christmas’ included 25 and 26 December for all years plus any public holidays that followed these dates, and ‘other public holidays’ included New Year's Day, Good Friday, Easter Sunday, Easter Monday and all Bank Holiday Mondays for all years);
-
length of daylight, which is correlated with daily temperature, was included because it has been suggested to be a causative factor in the high rates of suicide observed in May, June and July (Reference Maes, De Mayer and ThompsonMaes et al, 1994; Reference Salib and GraySalib & Gray, 1997; Reference Petridou, Papadopoulos and FrangakisPetridou et al, 2002).
Graphs showing deviance residuals between the model residuals and daily lag were produced to allow for assessment (and correction if needed) of autocorrelation within the data. Autocorrelation refers to consecutive days having non-independent suicide counts. An overdispersion parameter was calculated from the model by dividing the variance by the mean; overdispersion is taken to be absent or minimal if the parameter approaches 1.
Mean temperature was subsequently added into the model to estimate the effect of temperature on suicide counts after adjustment for all known time-varying confounders. Natural cubic splines were first used to assess visually the functional form of the adjusted relationship, thereby identifying whether the relationship was likely to be linear or not across the full range of temperatures. Natural cubic splines set ‘knots’ at regular intervals along the exposure variable (temperature) allowing the adjusted relationship between temperature and death counts to be assessed for each inter-knot segment. Following visual assessment of the relationship, linear terms could then be used for quantification of the effect for each inter-knot segment. The main outcomes of interest were all suicides, violent suicides and non-violent suicides. Secondary outcomes of interest were male and female suicides. Men are more likely to use violent methods of suicide (Reference Maes, Cosyns and MeltzerMaes et al, 1993), so it was predicted that male suicides would demonstrate a different temperature effect to female suicides. All age groups were considered together in order to retain power.
Episode analysis
An ‘episode analysis’ was undertaken to assess the effect of two separate heatwaves on daily suicide counts. Our hypothesis was that if high ambient temperatures were associated with higher death counts, then sustained periods of unusually high ambient temperature (i.e. heatwaves) would result in higher counts than is usual for that time of year. All suicide cases (rather than suicide subgroups) were used for the episode analysis because of the relatively few number of deaths on individual days. The two heatwave periods in the data-set were 30 July to 3 August 1995 (Reference Rooney, McMichael and KovatsRooney et al, 1998) and 4 August to 13 August 2003 (Reference Johnson, Kovats and McGregorJohnson et al, 2005b ); these periods were defined as starting when the maximum central England temperature surpassed average values by 8 °C and ending when temperatures returned to average (Met Office data). Expected mortality from suicide for the same calendar periods was calculated by averaging the counts from the nearest four years in the data-set for the 1995 heatwave (1993, 1994, 1996 and 1997) and for the 2 years prior to the 2003 heatwave (2001 and 2002). In view of the declining number of suicides after 2001, it was judged that to use years that preceded 2001 in the episode analysis of the 2003 heatwave might risk underestimating any effect of the heatwave. A 7-day moving average count was used to militate against a ‘day of week’ effect. Percentage excess mortality was then calculated as follows, with calculation of confidence intervals obtained by assuming a Poisson distribution.
RESULTS
Between 1 January 1993 and 31 December 2003 there were 53 623 deaths by suicide in England and Wales. There was missing information on date of death for 163 (0.3%) suicides; these deaths were not randomly spread over the years, with 98% occurring in the years 1993 and 1994 and the remainder occurring in 2000 and 2001. The reasons for these missing data are not known and these cases were dropped from the analysis. The mean number of suicides per day was 13.3 (s.d. = 3.9). Three-quarters of all suicides were by men and this proportion remained constant over the study period. The proportion of violent suicides increased during the study period, with a Mantel–Haenzsel test for trend indicating that the odds ratio of dying from a violent (v. non-violent) suicide was 1.07 (95% CI 1.06–1.07; P < 0.001) for each progressive year.
Temporal trends
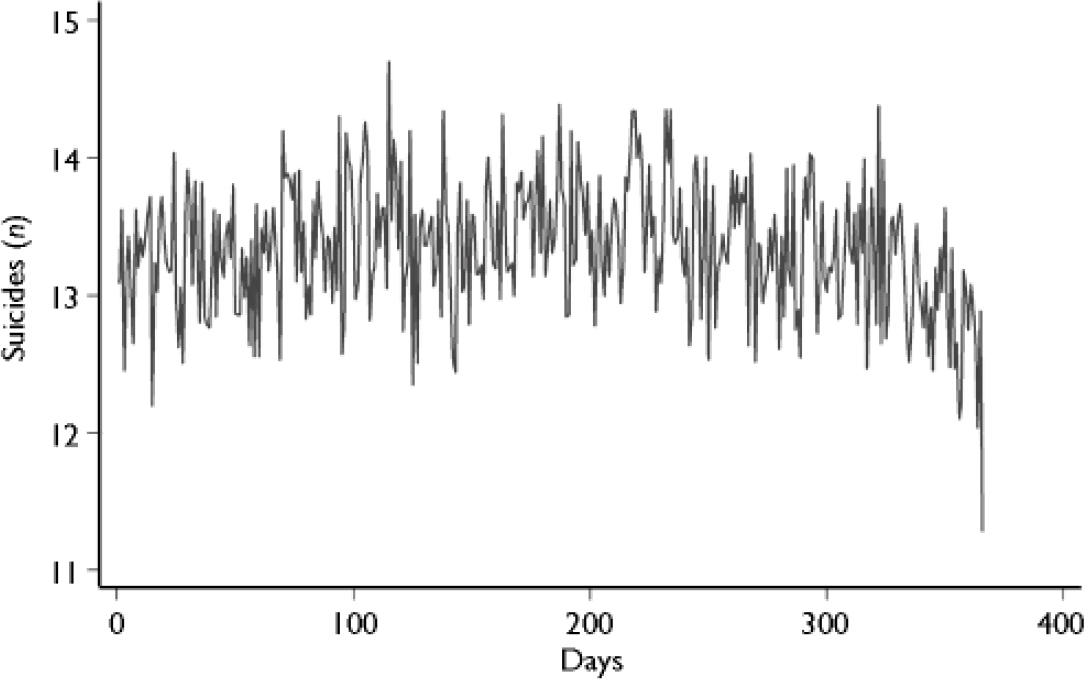
Graphical display of the data showed that the number of suicides per year was relatively consistent between 1993 and 2000, albeit with a gradual rise in violent suicides. Between 2001 and 2003 there appeared to be a reduction in yearly numbers of both violent and non-violent suicide and this is in line with recent ONS findings (Office for National Statistics, 2005). The highest monthly number of suicides (both violent and non-violent suicides) took place in January. This finding remained after monthly counts were adjusted for number of days in the month. Examining the data using a time-series plot averaged across 1 year shows that daily suicide counts remained fairly consistent until the beginning of November, when counts started to diminish (Fig. 1). Similar plots were observed for violent and non-violent suicide (data not shown).
Seasonal pattern of suicide. Daily suicide counts 1993–2003, using a 7-day moving average filter.
The highest daily suicide count was recorded on 1 January (mean = 17.6 deaths; 95% CI 13.6–21.7) and there was strong evidence that this was higher than the mean daily count for the rest of January (t-test=2.69; P=0.008). In order to assess whether January 1 suicides were driving the data, deaths on this date were excluded from the data-set; however, the adjusted count for January remained the highest, with 424.4 deaths. There was good evidence that fewer suicides occurred during the Christmas period when compared with the rest of the year: relative risk 0.86 (95% CI 0.77–0.97; Wald test=–2.39, P=0.017). The evidence was weaker that public holidays incurred a lower risk: RR=0.94 (95% CI 0.89–1.00, P=0.058). The largest number of suicides took place on Mondays, with numbers declining as the week wore on. A similar pattern was observed for violent and non-violent suicides.
Regression analysis
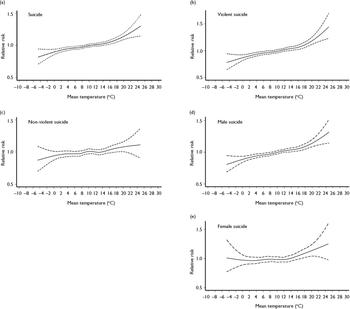
The use of natural cubic splines allowed the adjusted relationship between suicide counts and temperature to be modelled across the range of temperatures. A natural cubic spline model offered a better fit to the data than a linear term (likelihood ratio test 46.21, P< 0.0001), implying that the adjusted relationship between temperature and suicide was significantly non-linear across the whole range of temperature. Spline functions demonstrated subtly different profiles for all suicide, violent suicide and non-violent suicide; however, in all three groups there was evidence of increasing risk at higher temperatures (Fig. 2). For all suicides and violent suicides there was visual evidence of a high temperature threshold effect at approximately 18 °C, i.e. a ‘hockey stick’ plot was seen, with the gradient of the line becoming steeper above this temperature. A similar temperature threshold could be seen for non-violent suicide, although the estimate was less precise (as indicated by wider confidence intervals) and the overall gradient was flatter. When deaths recorded as being due to ‘undetermined intent’ were excluded from the analysis, the estimate did not substantially change. There was no evidence of significant autocorrelation within the data (when deviance residuals were plotted, autocorrelations were <0.05 within a 7-day lag), therefore no control for autocorrelation was made in subsequent analyses. Overdispersion was approximately 1.06 for all the suicide models, which was considered adequate without further correction. Modelling an interaction between daylight and mean temperature failed to give a better fit to the data (likelihood ratio test 1.68, P=0.640), indicating that there was no statistical interaction between these two variables.
Relationship between temperature and suicide (1993–2003): mean temperature v. relative risk of (a) suicide, (b) violent suicide, (c) non-violent suicide, (d) male suicide and (e) female suicide. Broken lines indicate upper and lower limits of confidence interval. Natural cubic spline model, adjusted for year, month, day of week, Christmas, public holidays and hours of daylight.
The aim of the final Poisson generalised linear model was to control for all known time-varying confounders and calculate an adjusted relative risk (and hence percentage change) for suicide in relation to temperature. The focus of the study was the relationship between high temperature and suicide; therefore the final models assessed the linear effect of mean temperatures above the visually derived threshold of 18 °C (with temperatures below 18 °C set to zero). The final models showed that there was strong evidence for a small but significant effect of increasing temperature on all suicides and violent suicide. There was much weaker evidence for an effect of temperature on non-violent suicide (Table 1).
Adjusted percentage increase in suicide at temperatures above 18 °C (lag=0)

| Suicides per day1 Mean (s.d.) | Increase in suicides for every 1 °C rise in mean temperature above 18 °C2 | Wald test | P | ||
|---|---|---|---|---|---|
| % | (95% Cl) | ||||
| All suicide | 13.3 (3.9) | 3.8 | (2.1 to 5.6) | 4.27 | <0.001 |
| Violent suicide | 8.0 (3.0) | 5.0 | (2.7 to 7.4) | 4.38 | <0.001 |
| Non-violent suicide | 5.4 (2.6) | 2.1 | (-0.7 to 4.9) | 1.45 | 0.147 |
| Male suicide | 10.4 (3.3) | 3.8 | (1.8 to 5.8) | 3.79 | <0.001 |
| Female suicide | 3.5 (1.9) | 3.5 | (0.1 to 7.0) | 2.02 | 0.044 |
The effect of high ambient temperature on male and female suicide counts was estimated in a secondary analysis. The natural cubic spline plots (Fig. 2) show that the relationship between temperature and suicide is similar for male suicide and all suicides. The plot for female suicide appears to demonstrate a shallower curve than that for male suicide, with a steady positive gradient from approximately 15 °C. The percentage increase in suicide counts above 18 °C was similar for both genders, although the estimate was less precise for women.
Episode analysis
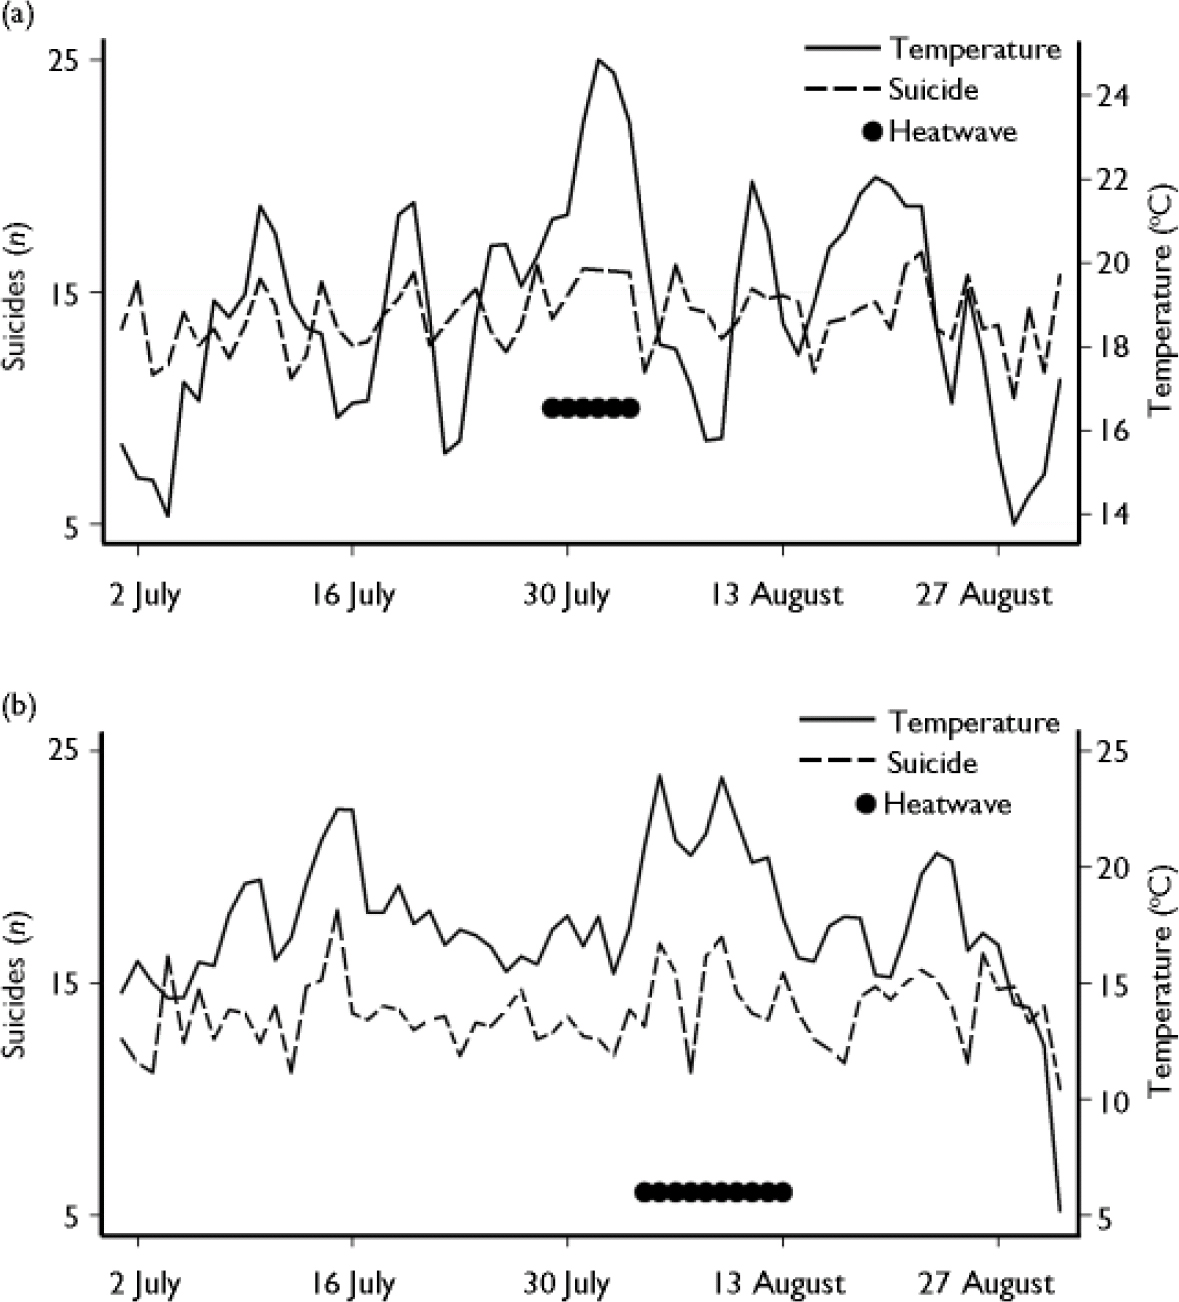
There were mixed results from the analysis of the heatwave events. The 1995 heatwave was associated with a marked short-term increase in mortality from suicide, whereas the 2003 heatwave was associated with virtually no change in mortality (Table 2, Fig. 3). In a post hoc attempt to explore the possible reasons for this lack of effect during the 2003 heatwave, the month prior to the 2003 heatwave was examined graphically. This demonstrated that there might have been an increase in mortality during an earlier hot spell between 13 July and 17 July, when mean temperatures increased to over 19 °C for four consecutive days (Fig. 3). This brief heatwave in July 2003 might have resulted in some immediate increase in mortality, as reported in Table 2, although the confidence intervals were wide and encompassed zero.
Suicide counts during two heatwaves: (a) July and August 1995; (b) July and August 2003. Graphs show daily suicide counts and temperature, using a 7-day moving average filter.
Effect of heat waves on suicide (using 7-day moving average)

| Date of heat wave | Observed suicides n | Estimated excess/deficit of suicides | Change in suicide from expected |
|---|---|---|---|
| % (95% Cl) | |||
| 29 July to 3 August 19951 | 103.6 | +33.1 | +46.9 (15.6 to 86.8) |
| 4-13 August 20032 | 118.9 | -2.1 | -1.8 (-17.8 to 18.4) |
| 13-17 July 20032 | 56.6 | +7.6 | +15.5 (-12.7 to 56.1) |
DISCUSSION
This study used time-series regression to assess deaths from suicide over an 11-year period in England and Wales. After appropriate adjustment for time-varying confounders, there was evidence of a small but robust effect of temperature on suicide and violent suicide counts. The effect of temperature on suicide counts was demonstrated to be non-linear across the temperature range under consideration. High temperature thresholds were identified relatively easily for suicide and violent suicide, although this was less clear for non-violent suicide. When quantifying the effect of high ambient temperatures (mean >18 °C), there was evidence of an increase in the relative risk of suicide and violent suicide for each 1 °C rise in temperature. Secondary analyses revealed no clear difference in the relative risk of high temperature on male or female suicide. Episode analysis of two heatwaves found that the 1995 heatwave was associated with a clear excess of suicides, whereas the 2003 heatwave produced little obvious change to the number of suicides expected for the time of year.
A large data-set was used for this study, which covered all deaths registered as being due to suicide in England and Wales between 1993 and 2003. The mortality and meteorological data were gathered as part of routine surveillance work by ONS and the Met Office and were unlikely to have been influenced by observer bias. The high quality of data provided by the death registration process in the UK meant that it was feasible to include ‘undetermined intent’ deaths as suicides in the study, which maximised the power of the study to detect an effect. Time-series analysis is a powerful technique with which to explore longitudinal data such as these, with the major advantage that it is not necessary to know the population denominator or the distribution of known (or unknown) individual risk factors within the population to interpret the findings. The ecological design of the study means that it is impossible to ascribe heat-related mechanisms to deaths occurring at times of high ambient heat, because individual exposure to high temperature was not known. Nevertheless, during hot periods it is highly likely that those who died were, like the majority of the population, exposed to high temperatures. The scarcity of air-conditioning in the UK means it is unlikely that many of those who died were able to keep themselves cool at times of great heat.
Lack of evidence for seasonality
The results of our study did not support the finding of a spring or summer peak in deaths from suicide; suicide occurred most frequently in January. Neither was a seasonal effect seen for violent suicide, which has been identified as the subtype of suicide most likely to be associated with season (Reference Maes, Cosyns and MeltzerMaes et al, 1993; Reference Hakko, Rasanen and TiihonenHakko et al, 1998; Reference Preti and MiottoPreti & Miotto, 1998; Reference Rasanen, Hakko and JokelainenRasanen et al, 2002; Reference Rock, Greenberg and HallmeyerRock et al, 2003). Although the majority of previous European studies have shown a spring or summer peak in suicide, studies from the UK in the recent past have not. In particular, two studies that used ONS data for England and Wales between 1982 and 1999 found no – or very little – evidence of a seasonal effect (Reference Yip, Chao and ChiuYip et al, 2000; Reference Simkin, Hawton and YipSimkin et al, 2003).
Harmonic analysis, an alternative time-series technique, has been shown to increase the likelihood of finding a seasonal effect for suicide (Reference Hakko, Rasanen and TiihonenHakko et al, 2002). However, harmonic analyses were used by Yip et al (Reference Yip, Chao and Chiu2000) and Simkin et al (Reference Simkin, Hawton and Yip2003), who both failed to show any significant seasonality within recent UK data. It therefore seems unlikely that the choice of analysis technique has influenced the findings in this case. One explanation is that the effect of seasonality has become less important in recent decades in some countries (Reference Yip, Chao and ChiuYip et al, 2000; Reference Ajdacic-Gross, Bopp and SansossioAjdacic-Gross et al, 2005). Chew & McCleary (Reference Chew and McCleary1995) looked at seasonality and suicide in 28 countries and found that countries with high levels of industrialisation and low numbers involved in agricultural work showed the least seasonality.
Effect of temperature on suicide counts
Despite no evidence of a seasonal effect on suicide, it was possible to show that temperature has a short-term effect on suicide counts. By modelling the relationship of temperature to death counts using natural cubic splines, a high temperature threshold was determined above which the effect of temperature increased linearly. This technique has not been used to study deaths from suicide before, although when used in other contexts has shown similar high temperature effects for hospital admissions for renal and respiratory problems (Reference Kovats, Hajat and WilkinsonKovats et al, 2004) and total mortality (Reference Hajat, Kovats and AtkinsonHajat et al, 2002). The relationship between suicide and mean temperature demonstrates a similar threshold to that of total mortality and temperature, which has been estimated to occur at about 19 °C (Reference Hajat, Kovats and AtkinsonHajat et al, 2002). This is the first time that death from suicide has been shown to be contributing to the known increase in all-cause mortality at higher temperatures.
The effect of high temperature on death counts was seen for all subtypes of suicide except non-violent suicide, for which the evidence was weaker. In real terms this finding is likely to be important, as the relative risk estimates for each degree of temperature above 18 °C indicate an increase in suicide and violent suicide of 3.8 and 5.0% respectively. It is not infrequent for the mean temperature in England to be above 18 °C, with such values being recorded on 222 days over the 11-year period of the study. It is unlikely that deaths from suicide are merely being brought forward in time (or ‘harvested’) during hot weather – real additional suicides probably occur when temperatures are high. Future research should focus on whether other important subgroups, such as the elderly, are disproportionally affected by suicide in hot weather.
The 1995 heatwave resulted in a clear excess of suicide during the period of hot weather: the increase of 41.5% is well in excess of the 10.8% increase in all-cause mortality reported for the same period in London (Reference Kovats, Hajat and WilkinsonKovats et al, 2004). The absence of effect during the 2003 heatwave is therefore surprising and an explanation is required. Heatwaves that occur in early summer have been found to result in greater all-cause mortality than those that occur later in the year, implying that people most vulnerable to heat-related death may die during early periods of high temperature and/or that some adaptation to high temperature can occur (Reference Basu and SametBasu & Samet, 2002). It is possible that both of these mechanisms were important during the 2003 heatwave. The earlier period of hot weather between 13 July and 17 July 2003 might have resulted in some excess deaths in those most susceptible to heat-related suicide, while also allowing some physiological or behavioural adaptation among other vulnerable individuals. The later heatwave in August 2003 may therefore have resulted in fewer deaths than would otherwise have occurred. This implies that a sudden increase in temperature may result in greater mortality from suicide than a gradual and sustained increase.
Study limitations
Because of the ecological design of the study it was impossible to link individual (or community) characteristics to heat-related suicide. Additional limitations of the study were potential misclassifications of outcome and exposure, which could have led to some bias in the results. First, deaths from the whole of England and Wales were used in the study and yet the temperature measure (the exposure of interest) was taken from four monitoring stations in central England. Second, it was not known exactly when the suicidal act took place, as only date of death was available for analysis. Third, it was assumed that there was no systematic difference between deaths designated as ‘undetermined intent’ and those recorded as clear cases of suicide. Finally, there were missing data for a few deaths in 1993 and 1994, although these were a small proportion of the total data-set and also unlikely to vary systematically across the year.
Mechanism of effect
It is rarely possible to ascertain causal effects using an ecological study design and the evidence presented here is insufficient to make the assumption that high temperature directly causes death by suicide. However, there are three obvious mechanisms by which high temperature could exert a causal effect on suicides: sociological, biological and psychological. Sociological explanations suggest that the pattern and intensity of social behaviours are influenced by climatic variables and that it is these social interactions that precipitate suicide (Reference DurkheimDurkheim, 1951). One possible sociological mechanism is the use of excess alcohol on hot days; besides this, it is difficult to see how temperature could affect social interaction to any great extent once seasonality, day of the week and holidays have been accounted for. Unfortunately, information on population alcohol consumption was not available for inclusion in our model, so we cannot comment further on this potential mechanism. Biological mechanisms have focused on neurotransmitters such as serotonin (Reference MannMann, 2000), which are known to vary with season and be negatively correlated with impulsivity, aggression (Reference Maes, Scharpe and VerkerkMaes et al, 1995) and suicidality (Reference MannMann, 2000). However, it remains to be seen whether high ambient temperature could interact with serotonin metabolism in the short term to produce an effect on suicide counts. Although speculative, perhaps the most promising mechanism to link suicide with high temperatures is a psychological one. High temperatures have been found to lead individuals to behave in a more disinhibited, aggressive and violent manner (Reference AndersonAnderson, 1989), which might in turn result in an increased propensity for suicidal acts. The finding that violent suicide showed the strongest temperature effect adds some support to this putative mechanism. There was little evidence of a lag effect in the data (results not shown), meaning that high temperatures did not appear to have a delayed effect on increasing suicide counts. This suggests that any causal mechanism linking increased temperature to higher suicide counts is likely to be acting immediately.
Implications
Suicide is an important, preventable cause of premature mortality. This study has shown an effect of high temperatures on suicide counts that will probably become more important as global warming continues (Reference Patz, Campbell-Lendrum and HollowayPatz et al, 2005). It is possible that the population of England and Wales will adjust to higher ambient temperatures, although the speed of global warming may be too great for adaptation to occur. Those with mental illness are highlighted as an at-risk group in England's heatwave plan (Department of Health, 2005), although this is because of their increased susceptibility to heat stroke (Reference BarkBark, 1998) rather than for suicide prevention. In any case, it remains to be seen whether public health measures (designed after the 2003 heatwave) to prevent heat-related death have been effective or not (Reference Kovats and Ebi-KristieKovats & EbiKristie, 2006).
Replication of these findings is required in other populations and geographical regions. Seasonal effects of suicide have been shown most consistently in northern European countries and it is not known whether there is an effect of temperature on suicide in other regions (e.g. equatorial countries) where high temperatures are more common. If a consistent association between short-term high temperature and suicide is identified, further attention needs to be paid to the mechanisms that underlie this effect.
Acknowledgements
The authors thank Allan Baker at the Office for National Statistics for supplying the mortality data. L.A.P. is supported by the National Institute of Environmental Health Sciences (NIEHS), National Institutes of Health as a Ruth L. Kirschstein National Research Fellow (F32 ES013690). The contents of this paper are solely the responsibility of the authors and do not necessarily represent the official views of the NIEHS. S.H. is supported by a Wellcome Trust Research Career Development Fellowship. R.S.K. is funded by the European Commission Directorate-General for Health and Consumer Protection for the EuroHEAT project (agreement no. 2004322).




eLetters
No eLetters have been published for this article.