
Decision making under risk is vital to human survival and development. Risky choices, such as investing or eating genetically modified foods, are common in everyday life. Determining how people make risky choices is a compelling question for scientists. For theoretical studies, a debate on whether decision making under risk is based on a compensatory or non-compensatory process is ongoing. Mainstream theories of decision making under risk claim that risky choices are based on a compensatory expectation-maximisation process. When making a risky choice, people weigh each possible outcome by its probability and then sum all the risky outcomes to assign an overall value (expectation) to each option. Then, they select the option that offers the highest overall expectation (Glöckner & Herbold, Reference Glöckner and Herbold2011; Kahneman & Tversky, Reference Kahneman and Tversky1979; Tversky & Kahneman, Reference Tversky and Kahneman1992). However, models that follow the non-compensatory rule and assume that people rely on only one (or a few) key dimension(s) rather than integrating information from all dimensions of an option to reach a decision are available (Brandstätter, Gigerenzer, & Hertwig, Reference Brandstätter, Gigerenzer and Hertwig2006; S. Li, Reference Li2004a; Thorngate, Reference Thorngate1980). For example, the equate-to-differentiate model suggests that when making risky choices, people seek to ‘equate’ the less significant differences between options in either the best or worst possible payoff dimensions, and rely on only the large one-dimensional difference to be differentiated as the determinant of the final choice (S. Li, Reference Li2004a; S. Li & Xie, Reference Li and Xie2006).
As the research focus has shifted from understanding what people choose to how they decide (Schulte-Mecklenbeck, Kühberger, & Hutzler, Reference Schulte-Mecklenbeck, Kühberger, Gagl and Hutzler2017), methods for examining risky decision-making models have been developed from outcome-based or goodness-of-fit techniques (Liang, Xu, Rao, Jiang, & Li, Reference Liang, Xu, Rao, Jiang and Li2012) to process-tracing techniques. Outcome-based techniques compare choices of individuals with the predicted choices of certain models (Brandstätter & Gussmack, Reference Brandstätter and Gussmack2012; Gigerenzer, Hertwig, & Pachur, Reference Gigerenzer, Hertwig and Pachur2011; Pachur, Hertwig, Gigerenzer, & Brandstätter, Reference Pachur, Hertwig, Gigerenzer and Brandstätter2013). However, stating a preference fails to serve as a true process measure because it provides no information regarding the necessary steps that lead to the preference (Schulte-Mecklenbeck, Kühberger, & Ranyard, Reference Schulte-Mecklenbeck, Kühberger and Ranyard2010). Concrete and convincing evidence based on psychological processes is necessary to elucidate this process and further our understanding of the underlying mechanisms of human decision making. Consequently, researchers have begun to examine the underlying processes of risky choice. Process data are richer than input–output data and provide important evidence for explanatory mechanisms (Schulte-Mecklenbeck et al., Reference Schulte-Mecklenbeck, Kühberger and Ranyard2010). Various technologies used to study information processing of people during decision making include behavioural experiments, functional magnetic resonance imaging (fMRI), event-related potential (ERP), mouse tracking, and eye-tracking (Dshemuchadse, Scherbaum, & Goschke, Reference Dshemuchadse, Scherbaum and Goschke2013; Glöckner & Herbold, Reference Glöckner and Herbold2011; Rao, Li, Jiang, & Zhou, Reference Rao, Li, Jiang and Zhou2012; Rao et al., Reference Rao, Liu, Li, Zhou, Liang, Sun and Li2013; Rao et al., Reference Rao, Zhou, Xu, Liang, Jiang and Li2011; Scarpa, Zanoli, Bruschi, & Naspetti, Reference Scarpa, Zanoli, Bruschi and Naspetti2013; Su et al., Reference Su, Rao, Sun, Du, Li and Li2013). However, a few researchers have decomposed the decision-making process and directly assessed the computational steps assumed by the expectation rule by weighting, summing, and maximising the overall values.
Despite the uneven representation of judgment and decision making worldwide and at its traditional study centre in Israel (Baron, Reference Baron, Baron, Li and Liang2008), researchers from the Pacific Rim have provided theoretical and applied contributions of risky decision-making studies. The research conducted in the Pacific Rim has shed light on unique cultural and regional characteristics of risky decision making. Historically, most of the studies in the earlier stage have endorsed compensatory models. For example, Quiggin (Reference Quiggin1982) from Australia was the first to find an appropriate model, namely the rank-dependent utility model, for the utilisation of transformed probabilities in risky choices (Fennema & Wakker, Reference Fennema, Wakker and Sixto1994). Further, Grant and Kajii (Reference Grant and Kajii1998), from the Australian National University, provided an axiomatisation for the representation of risky choice that is a special case of rank-dependent expected utility called AUSI (pronounced ‘ozzie’) expected utility. Similar to this trend, a small but growing number of researchers have begun to explore the decision-making anomalies that challenged the compensatory models, or they have developed non-compensatory models. For example, Takemura (Reference Takemura1994), from Japan, proposed the contingent focus model to explain the framing effect in risky decision making. In a subsequent study, Takemura and Fujii (Reference Takemura and Fujii1999) applied the model to a psychometric meta-analysis of subject responses in experiments on the Asian disease problem (Tversky & Kahneman, Reference Tversky and Kahneman1981) and found that the results were compatible with the predictions of the model. Moreover, S. Li and colleages (Reference Li2016) developed a coherent ‘equate-to-differentiate’ account for the most reported anomalies and perplexing phenomena in risky decision making. The anomalies and phenomena include the framing effect on the Asian disease problem (S. Li, Reference Li1998; S. Li & Adams, Reference Li and Adams1995; S. Li & Xie, Reference Li and Xie2006), the graph framing effect (Y. Sun, Bonini, & Su, Reference Sun, Li, Bonini and Su2012), the Allais paradox (S. Li, Reference Li1993, Reference Li1994a), the certainty effect (S. Li, Reference Li1995), the reflect effect (a four-fold pattern of risk attitudes; S. Li, Reference Li1993, Reference Li2004b), preference reversal (S. Li, Reference Li1994b, Reference Li2006), single- versus multiple-play discrepancy identical to the symbol (S. Li, Reference Li2003), and the disjunction effect in prisoner dilemma games (S. Li & Taplin, Reference Li and Taplin2002; S. Li, Taplin, & Zhang, Reference Li, Taplin and Zhang2007). Baron (Reference Baron and Li2016, p. 4) noted that the equate-to-differentiate model is ‘an interesting theory that can account for numerous results’. The model particularly emphasises our tendency to reduce decisions to ‘dominance structure’, in which real conflicts and trade-offs disappear (Baron, Reference Baron and Li2016, p. 4). Apart from these theoretical studies, applied studies have focused on hazardous risk management due to the prevalence of natural hazardous circumstances in the Pacific Rim region (Paton, Reference Paton2009). These applied studies include the profactors of hazard preparedness (Paton et al., Reference Paton, Houghton, Gregg, McIvor, Johnston, Bürgelt and Horan2009; Sagala, Okada, & Paton, Reference Sagala, Okada and Paton2009), survivor response to a disastrous experience (Nalipay & Mordeno, Reference Nalipay and Mordeno2016; Seiuli, Nikora, Te Awekotuku, & Hodgetts, Reference Seiuli, Nikora, Te Awekotuku and Hodgetts2016), effect of earthquake exposure on mood (Aslam & Tariq, Reference Aslam and Tariq2010), and intervention evaluation aimed at teaching adaptive coping skills for disaster survivors (Hechanova, Waelde, & Ramos, Reference Hechanova, Waelde and Ramos2016).
As one collaborative part of the preceding studies mentioned in the Pacific Rim, we developed a series of new paradigms to systematically investigate risky decision making over the past decade from a theoretical perspective. Part of the paradigms were designed to explore whether the risk-decision process follows the expectation rule by directly examining the hypothesised computation processes. Other paradigms focused on exploring the boundary condition of the expectation rule, that is, exploring the context under which the rule will work. Based on these paradigms, we conducted behavioural and neurological experiments using fMRI, ERP, eye-tracking, and behavioural experiments. These studies provided convergent evidence regarding the extent of risky decision making based on weighting and summing processes. These paradigms and studies are summarised in Table 1.
Paradigms for the Examination of Risky Decision Making

Note: fMRI = functional magnetic resonance imaging, ERP = event-related potential, SM = search measure.
Methods for Investigating Decision Process
Theories are developed to answer ‘what,’ ‘how,’ and ‘why’ questions (Busse, Kach, & Wagner, Reference Busse, Kach and Wagner2017). The first part of our work focused on the ‘what’ question and directly investigated the process of risky decision making, especially the weighting and summing process. In these methods, participants completed risky decision making and baseline tasks. In the baseline task, participants consciously performed a weighting and summing process. Thus, the differences in decision process between a risky decision-making task and the baselines may reveal whether participants perform the weighting and summing process assumed by the expectation rule.
Proportion Versus Probability Method
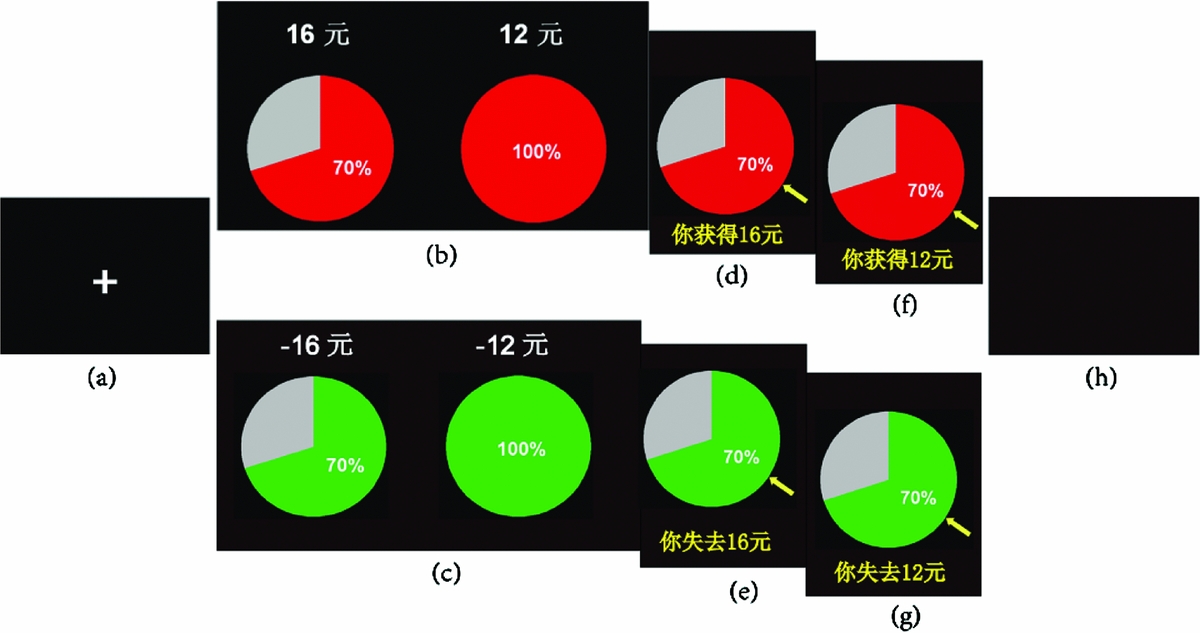
This method was designed to examine the weighting process in risky decision making. Participants performed proportion and probability tasks in this method. Materials in the two tasks were visually identical to the symbol ‘x%’, thereby indicating that ‘you will obtain/lose an x% proportion of this payoff’ in the proportion task and ‘you will have an x% probability of obtaining/losing this payoff’ in the probability task (Figure 1). In the proportion task, participants were required to select between riskless options that involved several partially available payoffs. Meanwhile, the participants were required to select between risky options that involved several probabilistic payoffs in the probability task. In the proportion task, a natural mental arithmetic process is consistent with the weighting and summing processes predicted by compensatory models. Payoffs in each option are first weighted by their respective proportions and then summed to obtain the overall payoff that determines the final choice. If individuals engage in weighting and summing processes when making risky choices, then their performance in the probability task should be similar to their performance in the proportion task. Thus, differences in performance would suggest that risky decision making is not based on weighting and summing processes.
Trial structure. (a) fixation; (b) and (c) experimental material in gain/loss domain; (d) and (e) feedback of choice for proportion task in gain/loss domain; (f) and (g) feedback of choice for probability task in gain/loss domain; (h) blank. In the proportion task, participants select between two riskless options of obtaining (top panel) or losing (lower panel) an x% proportion of a payoff; in the probability task, participants select between two risky options with an x% probability of obtaining (top panel) or losing (lower panel) a payoff (Liang et al., Reference Liang, Xu, Rao, Jiang and Li2012).
Behavioural and eye-tracking studies have shown the proportion versus probability method to be a valid assessment of the extent to which the expectation rule operates in risky choices. Liang et al. (Reference Liang, Xu, Rao, Jiang and Li2012) conducted behavioural experiments using the proportion versus probability method and found that participants exhibited shorter response times in probability tasks compared with proportion tasks, and proportions of expected value-based choices were lower in probability tasks than in proportion tasks. Their study employed double dissociation in comparing the two types of tasks. The rationale underlying the hypothesis of double dissociation is as follows: if the same cognitive process C is involved in tasks A and B, then C should influence A and B. However, if cognitive process C is only involved in task A, C should only influence task A and not affect task B. The study results demonstrated that arithmetic capability, which influences weighting and summing processes, moderated performance in the proportion tasks but not in the probability tasks. By contrast, numerical capability and the sensation-seeking trait, which influence risky decision making, moderated performance in the probability tasks but not in the proportion tasks. These results demonstrated that weighting and summing processes were not involved in the probability task.
Su et al. (Reference Su, Rao, Sun, Du, Li and Li2013) employed this method in an eye-tracking study and found that eye movements of participants were significantly different in the probability task compared to those of the proportion task. Specifically, they found significantly different information search patterns in the two tasks based on the alternative-based versus dimension-based search measure (SM; Böckenholt & Hynan, Reference Böckenholt and Hynan1994) of the two tasks. Attribute-based saccades, which are consistent with the prediction of weighting and summing processes, were observed to predominate in the proportion task. However, dimension-based saccades, which are consistent with the predictions of heuristic processes, were observed to predominate in the probability task. Based on these results, the researchers concluded that different processes governed information search and processing of participants in the proportion and probability tasks, thereby indicating the absence of weighting and summing processes when people make risky choices. Zhou et al. (Reference Zhou, Zhang, Wang, Rao, Wang, Li and Liang2016) analysed the published data from the eye-tracking study of Su et al. (Reference Su, Rao, Sun, Du, Li and Li2013) using scanpath analysis. Compared with traditional eye-tracking analysis methods, scanpath analysis provides a global view of the decision-process analysis. The similarity scores between scanpaths indicate the extent to which the scanpaths of different tasks are similar (X. Li, Logan, & Zbrodoff, Reference Li, Logan and Zbrodoff2010). Zhou et al. (Reference Zhou, Zhang, Wang, Rao, Wang, Li and Liang2016) also developed a new method for identifying a typical trial and provided a visualisation of the decision process. They found that the internal consistency of the scanpath pattern was higher in the proportion task than in the probability task. The researchers also found significant differences between the scanpath patterns in the proportion and probability tasks. The scanpath in a typical trial of the proportion task exhibited a pattern that was consistent with weighting and summing processes. However, this pattern was not observed in the probability task.
Judgment-Based Versus Preferential Choice Method
This method was designed to assess the extent to which preferential choice of an individual involved a compensatory process by examining weighting, summing, and expectation-maximisation processes. In this method, the rules followed by participants in making risky choices were different in the judgment-based and preferential choice tasks. The judgment-based choice task, which requires participants to use the certainty equivalent method, implicitly forced participants to employ a compensatory process. However, the preferential choice task did not explicitly require participants to perform a compensatory or non-compensatory process. Contrasting judgment-based choice with preferential choice enabled us to determine whether preferential choice of an individual could be characterised as a compensatory process.
In their fMRI and ERP studies, Rao, Li et al. (Reference Rao, Li, Jiang and Zhou2012), Rao, Lui et al. (Reference Rao, Liu, Li, Zhou, Liang, Sun and Li2013), and Rao, Zhou et al. (Reference Rao, Zhou, Xu, Liang, Jiang and Li2011) focused on the neural basis of conflict monitoring by comparing a judgment-based choice task with a preferential choice task. Their series of studies provided neurological evidence that preferential choice cannot be solely characterised as a compensatory process. The first fMRI study (Rao et al., Reference Rao, Zhou, Xu, Liang, Jiang and Li2011) examined the extent to which risky choices involve a compensatory process from the perspective of decision conflict. The activity in conflict-related brain regions during the two tasks was compared to assess whether the intensity of inner conflict was less pronounced in the judgment-based choice task than in the preferential choice task. The primary difference between compensatory and non-compensatory processes appeared to be associated with differences in conflict resolutions between binary alternatives (Hogarth, Reference Hogarth1987). In a compensatory process, a strong conflict is induced by maximisation when the difference between the overall values or utilities of two alternatives is small. In a non-compensatory process, a strong conflict is related to large intra-dimensional differences between the two alternatives in payoff and probability. The results in the preferential task indicated that conflict-related regions were sensitive to the intra-dimensional difference (i.e., difference between the probability/payoff dimensions of two risky options). The conflict-related regions in the judgment-based task were sensitive to the unidimensional difference (i.e., difference between the overall values/utilities of two risky options). Moreover, researchers also found that activation in conflict-related brain regions increased during the preferential choice task compared to the judgment-based choice task. Overall, the results of this study indicated that preferential choice cannot be characterised as a compensatory process that maximises the overall value of a prospect in a conflict solution.
Rao et al. (Reference Rao, Li, Jiang and Zhou2012) also obtained neurological evidence from functional connectivity analysis for the judgment-based and preferential choice methods. They classified brain regions into probability and payoff networks based on the functional connectivity patterns between regions. In these regions, activity was detected during both types of decision-making tasks. Moreover, the probability and payoff networks were found to exhibit stronger connectivity strength in the judgment-based choice task compared to the preferential choice task. These results indicated that the weighting process uniformly predicted by mainstream theory is unnecessary during preferential choice.
Rao et al. (Reference Rao, Liu, Li, Zhou, Liang, Sun and Li2013) used ERPs to investigate the judgment-based and preferential choice tasks. The study employed the following double dissociation rationale: if the difference in magnitude in the minimum outcome dimension (which affects risky decision making) only influences the decision process in the preferential choice task, whereas computational difficulty (which influences weighting and summing processes) only affects the judgment-based choice task, then preferential choice does not appear to be based on a compensatory process. The researchers also found that the P300 wave reflected the outcome of stimulus evaluation, and slow wave components were usually linked to the mental processes essential to calculation prior to obtaining the arithmetic operation result (Rao et al., Reference Rao, Liu, Li, Zhou, Liang, Sun and Li2013). The ERP data collected in the two tasks indicated a hypothesised double dissociation. In the preferential choice task, P300 was sensitive to the difference magnitude in the minimum outcome dimension but insensitive to computational difficulty, whereas the slow wave component (500–800 ms) was sensitive to computational difficulty in the judgment-based choice task. These results indicated that the predicted mental arithmetic process occurred in the judgment-based choice task but not in the preferential choice task. Given that computational difficulty is a key feature of mental arithmetic processes, the ERP data suggest that the brain mechanism underlying risky choice is not based on a compensatory process.
In their eye-tracking study, Wang and Li (Reference Wang and Li2012) compared eye movement patterns in judgment-based and preferential choice tasks and found that dwell time, fixation count, and number of saccades significantly differed in the two types of tasks. Their results also indicated that option-based information searches were predominant in the judgment-based choice task, whereas attribute-based information searches were predominant in the preferential choice task. These findings conflict with the predictions of the compensatory model.
Outcome-Matched Versus Outcome-Crossed Method
This method assessed the summing process by comparing outcome-matched and outcome-crossed stimuli presentations. Participants were presented with pairs of options in which each option was associated with the following two outcomes: best and worst. As illustrated in Figure 2, the best and worst outcomes for each option were presented as either parallel (outcome-matched) or crossed (outcome-crossed). Wang and Li (Reference Wang and Li2012) used this method in their eye-tracking study. They hypothesised that if risky choices were based on the expectation rule, then horizontal saccades would not be influenced by the format of stimuli presentation. However, if risky choices involved a non-compensatory strategy, such as the priority heuristic (Brandstätter et al., Reference Brandstätter, Gigerenzer and Hertwig2006) or equate-to-differentiate approach (S. Li, Reference Li2004a), then attribute-based saccades between best and worst possible outcomes should occur in parallel in the outcome-matched stimuli presentation and crossed in the outcome-crossed stimuli presentation.
Illustration of outcome-crossed versus outcome-matched presentations. Left panel (outcome-crossed presentation): The best/worst possible outcomes of A (CNY 5000/CNY 3000) and the best/worst possible outcomes of B (CNY 4900/CNY 3300) were presented crossed, as indicated by the arrows. Right panel (outcome-matched presentation): The best/worst possible outcomes of A (CNY 5000/CNY 3000) and the best/worst possible outcomes of B (CNY 4900/CNY 3300) were presented in parallel, as indicated by the arrows (Zhou et al., Reference Zhou, Zhang, Wang, Rao, Wang, Li and Liang2016).

The eye-tracking study of Wang and Li (Reference Wang and Li2012) supported the preceding hypothesis and suggested that risky decision making is not based on a compensatory strategy. The scanpath analysis indicated that the scanpath patterns of the outcome-matched and outcome-crossed tasks significantly differed (Zhou et al., Reference Zhou, Zhang, Wang, Rao, Wang, Li and Liang2016). The scanpath patterns observed in typical trials were more consistent with the predictions of the equate-to-differentiate approach (S. Li, Reference Li2004a; Li & Xie, Reference Li and Xie2006) than those of the compensatory expectation rule.
Imposed Rule Versus Self-Rule Method
This method was developed to examine emotion and acceptance after decision making when individuals make decisions according to their self-rule (i.e., spontaneously generated by the decision maker) and imposed rule (i.e., EV rule, which is defined based on decision theory). Logically, individuals would experience positive emotions and exhibit high levels of acceptance for decisions based on their own ‘true’ rule. Therefore, consistency between imposed rule and self-rule will lead to the reported acceptance and positive emotion by individuals after decision making. Following the logic, researchers can compare the compensatory and non-compensatory rule with the rule of decision makers and infer which rule is closer to the true rule of decision makers according to differences of individual acceptance and positive emotion to those rules.
In the study by Rao, Liang, and Li (Reference Rao, Liang and Li2009), participants were instructed to make risky choices based on their own rule or imposed rules. Rao et al. employed the rules hypothesised by expected value theory and equate-to-differentiate theory as two imposed rules. In the self-rule condition, participants rated their emotions after making choices based on their own rule. In the imposed-rule condition, participants rated their emotions and acceptance of the imposed rule after making choices based on the imposed rule. The results revealed that participants reported higher levels of acceptance and positive emotions when choices were based on their own rules than when their own rule and the imposed rule produced the same decisions. Notably, the ‘true’ rule of decision makers was more likely to be consistent with the equate-to-differentiate rule than with the expected value rule. Their findings suggest that the expectation rule might fail to capture the emotion and acceptance after risky choice decision making of individuals.
Methods of Examining Boundary Condition
Distinct from theory development, the ‘boundary condition’ of theories refers to the ‘who’, ‘where’, and ‘when’ aspects of a theory to describe the limits of theory generalisability (Busse et al., Reference Busse, Kach and Wagner2017). Another part of our work focused on the ‘when’ aspects of risky decision-making theories and explored the boundary condition of the expectation rule by contextual factors, that is, defining under what context the expectation rule will work. We explored whether the expectation rule can be applicable for conditions that involved a single application or multiple applications or people (everyone).
Single-Application Versus Multiple-Application Method
This method was designed to examine weighting and summing processes in risky decision making, in which participants were asked to make risky choices in single- and multiple-application tasks. In each task, participants select between two options, in which at least one risky option involves a probability of obtaining or losing a payoff. In the single-application task, the selected risky option is only applied once; in the multiple-application task, the selected risky option is applied 100 times. Empirical research found that the behaviour of decision makers in multiple-application gambles is consistent with the predictions of compensatory theory (Colbert et al., Reference Colbert, Murray and Nieschwietz2009; DeKay et al., Reference DeKay, Hershey, Spranca, Ubel and Asch2006; Keren, Reference Keren1991; Klos, Weber, & Weber, Reference Klos, Weber and Weber2005; Langer & Weber, Reference Langer and Weber2001; S. Li, Reference Li2003; Redelmeier & Tversky, Reference Redelmeier and Tversky1992; Wedell & Böckenholt, Reference Wedell and Böckenholt1994). The deviation of people's actual decision behaviour from the predictions of expectation models might be influenced by differences between single- and multiple-application tasks. If single- and multiple-application tasks are significantly different, then the expectation rule is unlikely to govern risky choice in the single-application task.
Su et al. (Reference Su, Rao, Sun, Du, Li and Li2013) and H.Y. Sun, Rao, Zhou, and Li (Reference Sun, Rao, Zhou and Li2013) used eye-tracking to investigate single- and multiple-application tasks. In the study of Su et al., participants were required to select between pairs of risky two-payoff monetary options (i.e., each option involved two risky outcomes) in both tasks. The option pairs were divided into two equal groups based on the level of difficulty of the total payoff computation of expectation value (EV, high vs. low). Their study found that in the multiple-application task, the compensatory models performed significantly better than the non-compensatory models in predicting choices, decision times, and eye movements of participants. Moreover, increased computational difficulty, which was expected to influence weighting and summing processes, affected performance only in the multiple-application task. Information acquisition in the multiple-application task generally took the form of alternative-based saccades and was consistent with weighting and summing processes. However, information acquisition in the single-application task generally took the form of dimension-based saccades, which is consistent with heuristic processes. These results suggest that an expectation-based index for risk preference prediction operates in multiple-play tasks but not in single-play tasks.
H.Y. Sun et al. (Reference Sun, Rao, Zhou and Li2013) compared single- and multiple-application tasks by using behavioural and eye-tracking methods. In this study, participants performed single- and multiple-application tasks, each of which presented two scenarios. The first scenario was the Asian disease problem (Tversky & Kahneman, Reference Tversky and Kahneman1981), and the second scenario was the food problem. Each scenario involved the following two emergency plans: the first plan produced a certain outcome, whereas the other produced a risky and high EV outcome. Different selections and eye movement patterns were found in the two tasks. Compared with the single-application task, more EV-based choices and interdimensional saccades and fewer intradimensional saccades were observed in the multiple-application task. Scanpath analysis indicated that scanpath patterns in the single- and multiple-application tasks significantly differed (Zhou et al., Reference Zhou, Zhang, Wang, Rao, Wang, Li and Liang2016). In the multiple-application tasks, the scanpath in the typical trial exhibited a pattern that was consistent with weighting and summing processes. However, this pattern was not observed in the single-application task.
Decision for Everyone Versus Every One Method
In their study, Liu et al. (Reference Liu, Li, Li and Rao2017) designed three risky choice tasks that comprised a decision-for-everyone (D-everyone) task, a decision-for-self multiple-play (D-multiple) task, and a decision-for-self single-play (D-single) task to explore the boundary condition of EV rule. This task is a ramification of the single/multiple-application task and aims to examine whether individuals apply the same strategy when making decisions for everyone (many people) or for the multiple-play condition when making decisions for themselves. In the D-everyone task, decision makers select the more optimal option from the two options under the assumption that their choice will be a final decision for everyone facing the same choice. In the D-multiple task, decision makers select between the two options under the assumption that their choice will be applied 100 times. In the D-single task, decision makers select between two options under the assumption that their selection will be applied only once to themselves. If decision makers adopt the same strategy (i.e., the expectation strategy) in the D-everyone task and D-multiple task and a different strategy (i.e., a heuristic/non-expectation strategy) in the D-single task, then their performance on the D-everyone and D-multiple tasks should be similar and should contrast with that on the D-single task.
Liu et al. (Reference Liu, Li, Li and Rao2017) conducted an eye-tracking experiment using this task. They found that participants were more likely to follow an expectation strategy in the D-everyone task and the D-multiple task but were more likely to follow a heuristic/non-expectation strategy in the D-single task. These findings were based on behavioural and eye-movement results. The behavioural results indicated that participants in the D-everyone and D-multiple tasks were likely to select an option with higher EV as predicted by expectation rule choices than in the D-single task. Regarding the eye-movement data, the scanpath analysis revealed that the scanpath patterns in the D-everyone and D-multiple tasks were similar to each other and different from those in the D-single task. Results from other eye-tracking measures suggested that the depth of information acquisition and the complexity of information processing were lower in the D-single task than in the D-everyone and D-multiple tasks. Moreover, participants were more likely to use an alternative-based approach in the D-everyone and D-multiple tasks than in the D-single task. An interaction effect between task and EV difference showed that EV difference affected the mean fixation duration only in the D-everyone task. In addition, a mediation analysis revealed that the eye-tracking measures mediated the relationship between task and percentage of the EV-consistent choice. Overall, these results indicate that the expectation rule only works well for everyone (full set) and not for everyone (subset).
Discussion and Conclusion
In the last decade, we have developed a series of methods to directly examine risky decision-making models. The methods of investigating the decision process aim at investigating risky decision-making by comparing the process of a baseline task following a weighting and summing process, and a risky choice task. These studies revealed that participants do not perform the weighting and summing process assumed by the expectation rule and are more likely to adopt a non-compensatory strategy. The methods of examining boundary condition focus on exploring the boundary condition of expectation rule. These studies found that the expectation rule works for risky decisions that are applied numerous times (multiple application) or for people (everyone).
Compared with previous methods that rely on outcome-based techniques, our paradigms have provided several research contributions on risky decision making. First, we adapted paradigms that directly examined the computation processes of weighting, summing, and expectation-maximisation, which are assumed by the expectation rule. To the best of our knowledge, only a few previous studies achieved this goal. Considering that different decision models may predict the same outcome or preference despite potential differences in underlying processes, justifying decision models without examining the process is difficult (Johnson, Schulte-Mecklenbeck, & Willemsen, Reference Johnson, Schulte-Mecklenbeck and Willemsen2008; Zhou et al., Reference Zhou, Zhang, Wang, Rao, Wang, Li and Liang2016). In addition, we can only determine which decision model works better when relying on outcome-based techniques by comparing different model candidates. However, if decision makers adopt multiple strategies assumed by different models, then distinguishing decision strategies using outcome-based techniques is difficult. A better approach for exploring such issues might be directly dependent on process data. Second, we directly compared information search and processing in risky decision making with information search and processing in a series of baseline tasks in which people naturally perform a deliberate calculation of the weighted sums. To a certain extent, simultaneously performing between-task comparisons enabled these paradigms to overcome the limitation on deducing hypotheses on the process data from the decision models that did not consider the relevant processes (Su et al., Reference Su, Rao, Sun, Du, Li and Li2013). Third, we utilised a variety of process-tracing techniques, such as eye tracking, ERP, and fMRI, to provide convergent evidence to examine the expectation rule. Finally, the novel indexes used in the study provided global and direct measures of information search patterns. For example, the SM value is an index that quantifies the degree to which the search direction is alternative or dimension based (Böckenholt & Hynan, Reference Böckenholt and Hynan1994; Su et al., Reference Su, Rao, Sun, Du, Li and Li2013). This measure enables the direct testing of hypotheses on the information search direction in risky decision making. Scanpath analysis, which focuses on the sequence of eye movements, provides spatiotemporal data on the spatial distribution of attention across a visual stimulus (Gbadamosi & Zangemeister, Reference Gbadamosi and Zangemeister2001; Noton & Stark, Reference Noton and Stark1971; Underwood, Humphrey, & Foulsham, Reference Underwood, Humphrey and Foulsham2008; Zhou et al., Reference Sun, Rao, Zhou and Li2013). The pattern generated by the scanpath enables researchers to investigate the process of risky choice using a global measure. These indexes emphasise a methodological application and can be used not only in the field of decision making but also in other areas.
Our findings using these paradigms have important theoretical and practical implications. Theoretically, these studies suggest that using an EV-based index to prescribe human risk preferences appears to be an artificial or false index of risk preference and reveal the need to improve current theories that are based on the use of heuristic strategies. Practically, we indicate a future methodological direction by providing references for paradigm development and utilising novel indexes for the direct investigation the decision processes.
Notably, these methods could be improved by resolving certain limitations. The paradigms in this study only made assumptions on weighting and summing processes. Consequently, such paradigms could only be applied to the examination of decision models involving such processes. In addition, the evidence was insufficient for exploring rules that should be followed in risky decision making. Future studies could focus on varied decision processes and broaden the scope of decision models that could be examined. More importantly, except for falsification, future paradigms could also consider verification of the actual process that individuals follow in risk decision making. In addition, participants in our studies were from a single race (i.e., Chinese), whereas the mainstream economic theory was dominantly built on participants of another single race (i.e., Caucasians). Owing to the ample findings that Asian cultures (e.g., Chinese) are more risk seeking than respondents in other cultures (e.g., in the United States; S. Li, Reference Li2001; Weber, Hsee, & Sokolowska, Reference Weber, Hsee and Sokolowska1998), the culture difference might confuse the results. Future studies should consider expanding their application to examine other decision processes of participants from multiple cultures and reveal the rules that individuals follow in risky choice.
In conclusion, this article reviewed paradigms of examining risky choice models developed for the following two aims: investigating the weighting and summing process assumed by the EV rule and exploring the boundary conditions by contextual factors of the EV rule. The results of the first cluster paradigms revealed that decision makers did not follow the EV rule in the single-application risky decision-making. By contrast, decision makers adopted a non-compensatory strategy, such as a heuristic one. The results of the second cluster paradigms showed that the EV rule was only applicable for conditions which involved decisions that applied numerous times (multiple application) or people (everyone).
Acknowledgements
We thank Hong-Zhi Liu for discussion. We thank LetPub (www.letpub.com) for its linguistic assistance during the preparation of this manuscript.


 Open access