


Introduction
The West Netherlands Basin (WNB) is a prolific hydrocarbon province with some 80 oil and gas fields. Interest in its exploration was accidentally initiated at the world exhibition of 1938 in The Hague, when the Bataafse Petroleum Maatschappij (BPM) drilled a demonstration well on the De Mient exhibition site. It struck oil at 460 m (Knaap & Coenen, Reference Knaap, Coenen, Visser, Zonneveld and van Loon1987). During and shortly after World War II, exploration began. Seismic and gravimetric surveys were acquired, and wells were drilled, resulting in the discovery of the first oilfield, the Rijswijk Field, in 1953. The first gas discovery in the WNB, the Botlek Field, followed in 1984. The last gas discovery dates from 2016 in the P11 block. The main target horizons in this basin were Upper Jurassic to Lower Cretaceous and Triassic strata. Oil and gas exploration and production resulted in a wealth of seismic and well data. Almost the entire WNB is covered by 3D-seismic surveys. They are of different vintage, and the standard public domain versions are of reasonable quality. A giant recent leap in data availability in the public domain (www.nlog.nl) is the release of reprocessed versions of the 3D-seismic and of raw well data of all drilled wells. In addition, a wealth of published literature is available (see e.g. Rondeel et al., Reference Rondeel, Anders, Batjes and Nieuwenhuijs1996). De Jager et al. (Reference De Jager, Doyle, Grantham, Mabillard, Rondeel, Batjes and Nieuwenhuijs1996), Den Hartog Jager (Reference Den Hartog Jager, Rondeel, Batjes and Nieuwenhuijs1996) and Racero-Baena & Drake (Reference Racero-Baena, Drake, Rondeel, Anders, Batjes and Nieuwenhuijs1996) provide comprehensive overviews of the Upper Jurassic to Lower Cretaceous sedimentary deposits, hydrocarbon generation and structural style of the WNB.
At present, hydrocarbon exploration is almost halted and most of the fields in the mature WNB hydrocarbon province are abandoned or in their tail-end production stage. Since the mid-1970s the area has entered its second life for geothermal exploration (e.g. Lokhorst, Reference Lokhorst2000). Several geothermal potential desktop studies were conducted between then and the mid-1990s. These studies already identified Lower Cretaceous Sandstone beds as main geothermal targets in the WNB, culminating in the definition of the Delfland geothermal project (Dufour, Reference Dufour and Mot1984). However, it took until 2005 before the first geothermal operator initiated a geothermal project to replace the gas-powered heating system in this greenhouse complex with a geothermal heating system against a backdrop of high and volatile gas prices (Ramaekers et al., Reference Ramaekers, Geel, Lokhorst and Simmelink2006). Aided by governmental support, a successful doublet system was realised that has exploited the sedimentary rocks of the Nieuwerkerk and Vlieland formations since 2007. This project initiated several follow-up projects in the WNB. At present, 12 doublets are realised in the Upper Jurassic to Lower Cretaceous strata in the WNB. Initially, the marine sandstones of the Vlieland Formation were the main target. However, interest shifted rapidly to the Delft Sandstone Member (Delft Sst Mbr) of the underlying Nieuwerkerk Formation because of its higher temperature, permeability and thickness (Donselaar et al., Reference Donselaar, Groenenberg and Gilding2015; Willems et al., Reference Willems, Vondrak, Munsterman, Donselaar and Mijnlieff2017c; Vondrak et al., Reference Vondrak, Donselaar and Munsterman2018). Recently the deeper Alblasserdam Member (Alblasserdam Mbr) of the Nieuwerkerk Formation has been targeted, and ongoing exploration aims for a combined development of both stratigraphic intervals. In 2017 the first geothermal system, exploiting this combined aquifer, was realised.
Recent geothermal exploration renewed interest in the Upper Jurassic to Lower Cretaceous strata of the deeper graben fault blocks of the WNB. Newly acquired data from geothermal wells from different palaeo tectono-sedimentary locations warrant revisiting of the tectono-sedimentological and sequence-stratigraphical models to better understand and predict the lateral and vertical distribution and quality variations of the different aquifer zones. This paper presents an overview of the new insights into the Delft Sst Mbr reservoir architecture and the geothermal potential of the Vlieland Sst Formation.
Structural geological setting, West Netherlands Basin
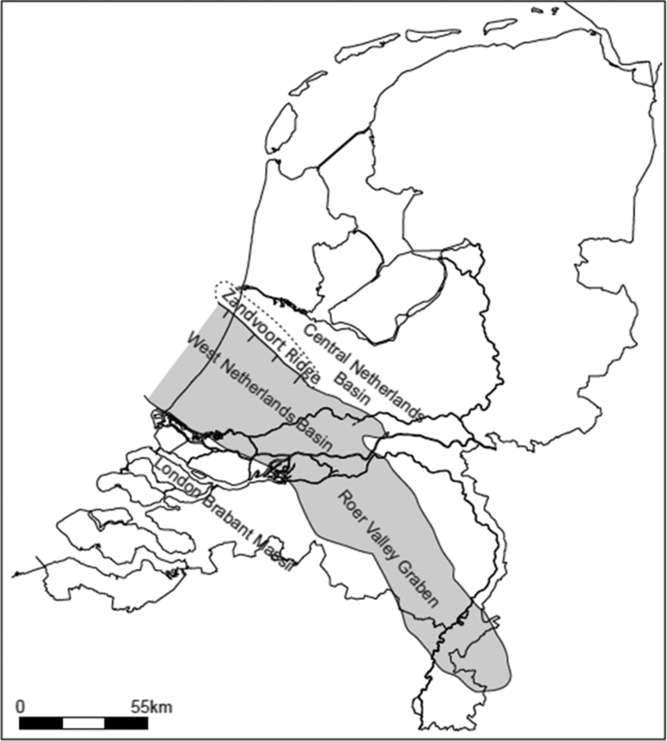
The WNB is a northwest–southeast-trending basin in the south of the Netherlands extending westward into the southern Dutch North Sea. The basin is flanked by the London–Brabant High in the southwest and the Zandvoort Ridge in the northeast (Fig. 1). Extensional movement commenced in the Middle Jurassic, creating a series of parallel half-grabens (Bodenhausen & Ott, Reference Bodenhausen, Ott, Illing and Hobson1981; Den Hartog Jager, Reference Den Hartog Jager, Rondeel, Batjes and Nieuwenhuijs1996; Racero-Baena & Drake, Reference Racero-Baena, Drake, Rondeel, Anders, Batjes and Nieuwenhuijs1996). The subsiding half-grabens were filled with terrestrial sediments sourced from the London–Brabant Massif in the south and from the Roer Valley Graben in the southeast (Den Hartog Jager, Reference Den Hartog Jager, Rondeel, Batjes and Nieuwenhuijs1996; Herngreen & Wong, Reference Herngreen, Wong, Wong, Batjes and de Jager2007). The syn-tectonic deposition of these sediments is reflected by a major unconformity at the base of the Upper Jurassic to Lower Cretaceous strata and by the widely differing thickness of these strata in the adjacent fault blocks (Fig. 2). In addition, local intra-Nieuwerkerk unconformities are evidence of various local tectonic events (e.g. Devault & Jeremiah, Reference Devault and Jeremiah2002). Around Hauterivian times, the basin entered a post-rift sag phase, while relative sea level was rising. The Upper Cretaceous sediments are therefore more homogeneous in thickness, wedging towards the basin margins (Fig. 2; Den Hartog Jager, Reference Den Hartog Jager, Rondeel, Batjes and Nieuwenhuijs1996; Vondrak et al., Reference Vondrak, Donselaar and Munsterman2018). The palaeo-coastline transgressed from the northwest boundary of the WNB in the Ryazanian to the northwest boundary of the Roer Valley Graben in Hauterivian times, which is reflected by increasingly marine sedimentation covering the terrestrial syn-tectonic strata (Den Hartog Jager, Reference Den Hartog Jager, Rondeel, Batjes and Nieuwenhuijs1996; Herngreen and Wong, Reference Herngreen, Wong, Wong, Batjes and de Jager2007; Jeremiah et al., Reference Jeremiah, Duxbury and Rawson2010; Vejbbæk et al., Reference Vejbbæk, Andersen, Dusar, Herngreen, Krabbe, Leszczynski, Lott, Mutterlose, Van der Molen, Doornenbal and Stevenson2010).
Geological setting of the West Netherlands Basin, bordered by the London–Brabant Massif in the south, the Zandvoort Ridge and Central Netherlands Basin to the north (after Vondrak et al. Reference Vondrak, Donselaar and Munsterman2018).
Seismic cross-section of ~40 km, perpendicular to the main fault trend in the WNB. The interpretation of the faults (black dotted lines) and top and base of the strata follow Duin et al. (Reference Duin, Doornenbal, Rijkers, Verbeek and Wong2006).

A new tectonic phase in the Palaeocene significantly altered the structural setting of the basin as part of the Late Cretaceous Laramide compressional phase (Van Wijhe, Reference Van Wijhe1987; Deckers & van der Voet, Reference Deckers and van der Voet2018). During this Alpine inversion phase, many of the Jurassic normal faults were reactivated as reverse faults. Due to inversion and uplift of horst and pop-up structures, the Cretaceous sediments have been substantially eroded (Fig. 2; Racero-Baena & Drake, Reference Racero-Baena, Drake, Rondeel, Anders, Batjes and Nieuwenhuijs1996; Herngreen & Wong, Reference Herngreen, Wong, Wong, Batjes and de Jager2007; Jeremiah et al., Reference Jeremiah, Duxbury and Rawson2010). Uplift and erosion were most severe towards the Zandvoort Ridge, where Upper Cretaceous strata have been substantially eroded (Fig. 2). By influencing the present-day burial depth and hence temperature of these strata, the inversion affected their geothermal potential. It also created the horst and pop-up structures that were targeted by hydrocarbon wells.
Most of the subsurface data are derived from hydrocarbon fields on the horst and pop-up structures in the basin. The influence of Late Jurassic to Early Cretaceous tectonic movement on sedimentation as well as the Tertiary inversion complicates regional well-log correlations in the WNB. Therefore, uncertainty about the geothermal potential of the Upper Jurassic to Lower Cretaceous strata remains, despite the wealth of subsurface data acquired in in the past 50 years in the WNB.
WNB stratigraphy, Nieuwerkerk Formation to Rijnland Group: from fluvial to marine
The Late Jurassic to Early Cretaceous basin fills in the Dutch sector of the North Sea basin can be seen as a eustatically and tectonically controlled stepped transgression from the Central Graben and Sole Pit Basin in the northwest, towards the Lower Saxony Basin and Roer Valley Graben in the southeast (Van Adrichem Boogaert & Kouwe, Reference Van Adrichem Boogaert and Kouwe1997; Abbink et al., Reference Abbink, Mijnlieff, Munsterman and Verreussel2006; Jeremiah et al., Reference Jeremiah, Duxbury and Rawson2010; Munsterman, Reference Munsterman2012; Bouroullec et al., Reference Bouroullec, Verreussel, Geel, de Bruin, Zijp, Kőrösi, Munsterman, Janssen and Kerstholt-Boegehold2018; Verreussel et al., Reference Verreussel, Bouroullec, Munsterman, Dybkjær, Geel, Houben, Johannessen and Kerstholt-Boegehold2018). Essentially, this stepped transgression was already depicted in the chrono-lithostratigraphic chart of Van Adrichem Boogaert & Kouwe (Reference Van Adrichem Boogaert and Kouwe1997; Fig. 3), which mimics an incipient sequence-stratigraphic approach. In every North Sea sub-basin, the following sedimentary facies bands occur either fully or partly, from bottom to top:
Terrestrial delta plain sediments, including floodplain fines, coal and channel sandstones
Dark lagoonal/marginal claystones, often with mono-typical shell assemblage
Clean stratified barrier sequence sandstones and transgressional sheet sands
Upper shoreface to lower shoreface glauconite-rich sandstones
Upper offshore to lower offshore glauconite-rich sandstones
Fully marine silty claystones and occasionally high-TOC (total organic carbon) claystones
Cartoon of regional Upper Jurassic to Lower Cretaceous stratigraphy on the left, edited after Van Adrichem Boogaert & Kouwe (Reference Van Adrichem Boogaert and Kouwe1997). On the right, three GR logs to highlight associated GR log response.

The Upper Jurassic to Lower Cretaceous sediments are grouped into lithostratigraphic units. The oldest is the Schieland Group or the Niedersachsen Group and predominantly comprises terrestrial sediments, and the overlying Scruff or Rijnland Group consists only of marine sediments (Fig. 3). Subdivision of Upper Jurassic to Lower Cretaceous sediments follows this approach in all North Sea basins, but actual nomenclature for groups, formations and members depends on the sub-basin. For example, marine/lagoonal claystones from the Oyster Ground (Dutch Central Graben), Neomiodon (Broad Fourteens Basin) and Rodenrijs (WNB) members are facies-wise comparable. Similarly, the intensely bioturbated, glauconitic sandstones of the Scruff Greensand Spiculite or Stortemelk Formation in the southern Dutch Central Graben and Terschelling Basin, as well as the Friesland Sst Mbr in the Vlieland Basin, are equivalents of the Rijn Mbr in the WNB.
Within the WNB, the Upper Jurassic to Lower Cretaceous sequence is subdivided into the mainly continental Schieland Group and the marine Rijnland Group (Fig. 3). Here, the Schieland Group is represented by the Nieuwerkerk Formation (Van Adrichem Boogaert & Kouwe, Reference Van Adrichem Boogaert and Kouwe1997). The Nieuwerkerk Formation is traditionally lithostratigraphically subdivided into three members based on sandstone content, abundance of coal and/or frequency of marine intercalations within different intervals.
1. The oldest of these members is the Ryazanian Alblasserdam Mbr. It is characterised as a low net-to-gross, syn-rift fluvial interval. It unconformably overlies the Upper Jurassic Altena Group in the graben fault blocks and the Lower Jurassic Aalburg Formation on some horst blocks (Devault & Jeremiah, Reference Devault and Jeremiah2002) and has a heterogeneous gamma-ray (GR) log signature.
2. In the western and central onshore part of the WNB, the Alblasserdam Mbr is overlain by massive sandstones of the coastal-plain Delft Sst Mbr.
3. This member is normally conformably overlain by the organic-rich claystones of the lagoonal Rodenrijs Claystone Mbr.
The lithostratigraphic interpretation of a sandstone package below the Rodenrijs Claystone Mbr belonging to the Delft or Alblasserdam Mbr without detailed biostratigraphic control is exceedingly difficult. From detailed seismic interpretation it appears that locally a (near-)base Delft Sst Mbr reflector has an angular truncation configuration. Intra-Nieuwerkerk Formation unconformities have been reported (e.g. Devault & Jeremiah, Reference Devault and Jeremiah2002), but not confirmed with accurate seismic-to-well ties.
Directly overlying the Nieuwerkerk Formation are the marine sediments of the Rijnland Group. Depending on the location in the basin, the contact is either conformable or a subtle angular unconformity with an erosional truncation. The sediments were deposited from the Latest Ryazanian in the northwest of the WNB until the Aptian. Its base comprises either claystones of the Vlieland Claystone Formation or sandstones of the Vlieland Sandstone Formation (Vlieland Sst Fm). Van Adrichem Boogaert & Kouwe (Reference Van Adrichem Boogaert and Kouwe1997) described several WNB-specific members within the Vlieland Sst Fm, which were deposited as basal transgressive sands, prograding coastal barrier complexes or offshore shoal sands (Fig. 3). Towards the southeast, these marine sandstone members grade into continental claystone deposits, which are often attributed to the Alblasserdam Mbr. These marine and terrestrial deposits are lateral equivalents with rapid lateral facies variations. Limited well control and geological data create uncertainty on prediction of the lateral extent, thickness and hence geothermal potential of the sandstone-rich members.
Two of the marine sandstone members of the Rijnland Group, the Rijswijk Mbr and the Berkel Sst Mbr, are currently major geothermal aquifer targets in the WNB (e.g. Vis et al., Reference Vis, Van Gessel, Mijnlieff, Pluymaekers, Hettelaar and Stegers2010). The Rijswijk Mbr mainly consists of basal transgressive and bioturbated sandstones. The Berkel Sst Mbr was deposited by a regressive coastal-barrier system prograding to the west and northwest (Racero-Baena & Drake, Reference Racero-Baena, Drake, Rondeel, Anders, Batjes and Nieuwenhuijs1996). Currently, 11 active doublets produce heat from the Delft Sst Mbr (Mijnlieff, Reference Mijnlieff2020), making it the main geothermal target of the WNB.
Because of the syn-tectonic sedimentation, the thickness of the Nieuwerkerk Formation varies significantly in different fault blocks within the WNB. Accommodation space was created by the subsiding grabens and half-grabens. On the basin margins and horst- and pop-up structures the thickness ranges from 0 to 200 m, while in some graben fault blocks the Nieuwerkerk Formation has a thickness of up to 1500 m (Duin et al., Reference Duin, Doornenbal, Rijkers, Verbeek and Wong2006; Wong, Reference Wong, Wong, Batjes and Jager2007). The Rijnland Group has a more gradual thickness development of c.100 m on the basin fringes to more than 900 m in the centre of the onshore part of the WNB (Duin et al., Reference Duin, Doornenbal, Rijkers, Verbeek and Wong2006; Herngreen & Wong, Reference Herngreen, Wong, Wong, Batjes and de Jager2007). This thickness pattern is consistent with its setting in a post-rift sequence.
A first sequence-stratigraphic update of this lithostratigraphic division of the WNB by Van Adrichem Boogaert & Kouwe (Reference Van Adrichem Boogaert and Kouwe1997) was made by Den Hartog Jager (Reference Den Hartog Jager, Rondeel, Batjes and Nieuwenhuijs1996). He placed the stratigraphic members in a sequence-stratigraphic framework. This refinement was based on interpretation of seismic facies variation and correlation of net-to-gross trends on well logs. Later, Devault & Jeremiah (Reference Devault and Jeremiah2002) continued with sequence-stratigraphic updates of the WNB stratigraphy utilising palynological analyses of drill cuttings and cores, assisted by seismic volumes. Devault & Jeremiah (Reference Devault and Jeremiah2002) introduced a regional well-log correlation framework based on maximum flooding surfaces (MFS) such as the Forbesi MFS, the Elegans MFS and the Paratollia MFS. Jeremiah et al. (Reference Jeremiah, Duxbury and Rawson2010) published a continuation of this work in which the southern North Sea basins were linked using the MFS approach. More recently Munsterman (Reference Munsterman2012, Reference Munsterman2013) and Willems et al. (Reference Willems, Vondrak, Munsterman, Donselaar and Mijnlieff2017c) used new well-log data and palynological cuttings analyses from geothermal wells in the graben fault blocks to improve understanding of the regional architecture of the Delft Sst Mbr. Their palynological drill cuttings analyses enabled correlation of chronostratigraphic intervals. This revealed distinctive intervals of different age within the Delft Sst Mbr as well as lateral variation in sandstone content within these intervals, highlighting that well-log correlation based on the lithostratigraphic model in Figure 3, which is based on Van Adrichem Boogaert & Kouwe (Reference Van Adrichem Boogaert and Kouwe1997), could overestimate the lateral continuity of sandstone-rich zones.
Aquifer geology: Nieuwerkerk Formation
Depositional environment
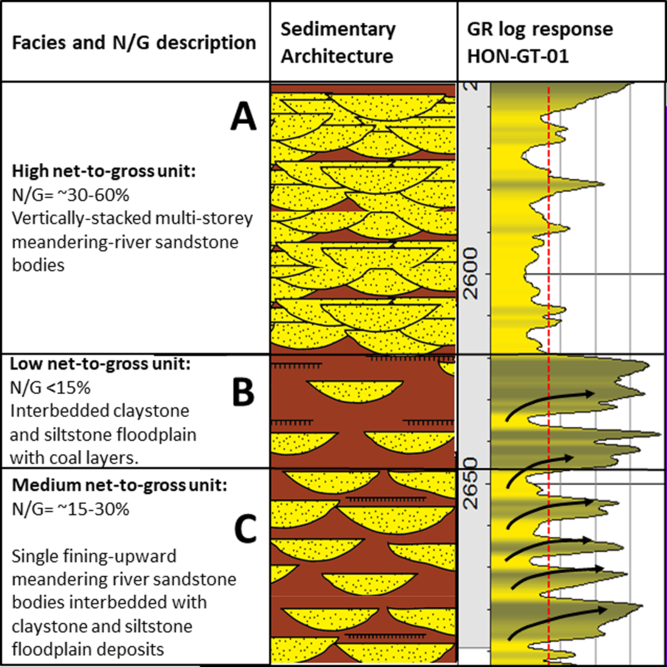
Palynological and lithofacies analysis indicates that the siliciclastic Delft Sst Mbr succession formed in a relatively humid, lower-coastal-plain meandering-river depositional environment (Donselaar et al., Reference Donselaar, Groenenberg and Gilding2015; Vondrak et al., Reference Vondrak, Donselaar and Munsterman2018). Variability in net-to-gross and sandstone stacking patterns in the Nieuwerkerk Formation is the result of relative base-level fluctuations by differential movement along extensional faults in combination with rising sea level. Three different net-to-gross units can be recognised:
1) High net-to-gross units with multi-storey vertical stacking pattern of meandering-river sandstone bodies reflect low accommodation increase and inherent basinward shift of fluvial facies (Fig. 4A). The sedimentary architecture of such a depositional setting is a sand-prone unit with high vertical and lateral continuity caused by erosional truncation of the underlying floodplain mudstone and fine-grained upper parts of the underlying sandstone. These sand-prone units have c.40–60% net-to-gross and are characterised by stacked multi-storey sandstone bodies with minor mudstone intervals (Vondrak et al., Reference Vondrak, Donselaar and Munsterman2018).
2) Low net-to-gross intervals were formed during a high rate of accommodation increase, which favoured the preservation of floodplain fines, and consist of interbedded claystone, siltstone and coal layers with minor thin sandstone intercalations. In a sedimentary architecture sense, this implies a low lateral and vertical connectivity of the isolated individual sandstone units and preservation of coal layers (Fig. 4B).
3) Units with c.30% net-to-gross consist of loosely stacked single-storey sandstone bodies, characterised by a sharp, erosional base and fining-upward to claystone and siltstone. On the GR logs, this is reflected by repeated fining-upward cycles (Fig. 4C).
Subdivision of net-to-gross units within Nieuwerkerk Formation signature gamma-ray log (well HON-G-01), with associated facies architecture. Modified from Donselaar et al. (Reference Donselaar, Groenenberg and Gilding2015). Black curved arrows highlight fining-upward sequences in the gamma-ray log.
The geothermal aquifers of the Nieuwerkerk Formation consist of stacked high and medium net-to-gross units. Their combined thickness varies across the basin from ~100 m in the HON-GT-01 well to more than 200 m in the PNA-GT-02 well. Currently, these sandstone-prone intervals with locally sandstone content of more than 60% are often referred to as the Delft Sst Mbr. Following Van Adrichem Boogaert & Kouwe (Reference Van Adrichem Boogaert and Kouwe1997), this member is of Valanginian age. Recent palynological drill cuttings analyses revealed, however, that such high net-to-gross units do not necessarily extend on a regional scale. They are sometimes formed by stacking of several high net-to-gross units of different age, as is shown in Figure 5. This figure shows how a high net-to-gross interval in the well PNA-GT-02 is partially Valanginian and partially Early Valanginian to Late Ryazanian, which is the age of the Alblasserdam Mbr according to Van Adrichem Boogaert & Kouwe (Reference Van Adrichem Boogaert and Kouwe1997), and not the Delft Sst Mbr. This shows that application of the simplified lithostratigraphic model, based on interpretation of high net-to-gross units alone as sketched in Figure 3, is not straightforward. Willems et al. (Reference Willems, Vondrak, Munsterman, Donselaar and Mijnlieff2017c) explained the diachronous development as a result of a shift in fluvial depocentre from west to east between the Late Ryazanian and Early Valanginian. In the Valanginian phase, a high net-to-gross unit was formed in the western part of the basin, while a low net-to-gross unit was formed in the eastern part. Conversely, in the Late Ryazanian / Early Valanginian, mainly floodplain fines were deposited towards the west and higher net-to-gross intervals were deposited in the western part of the basin. Recent WNB correlation studies show that palynological analyses are a key tool for improved understanding of the regional sandstone distribution within the Nieuwerkerk Formation and predict aquifer thickness, which is of paramount importance for doublet design. Because such detailed palynological analyses of Nieuwerkerk Formation cuttings from graben fault blocks are only available for a very limited number of wells, the traditional lithostratigraphic model is still dominant in Dutch geothermal development.
Well section showing the gamma-ray logs of three geothermal wells in the WNB. High net-to-gross units forming the Delft Sst Mbr aquifer are highlighted in each well, together with the overlying low net-to-gross Rodenrijs Claystone Mbr. The Elegans and Paratollia MFS markers and the age indications are derived from Willems et al. (Reference Willems, Nick, Weltje and Bruhn2017b).

Continued relative sea-level rise in the Hauterivian caused a landward shift of fluvial facies and preservation of extensive fine-grained floodplain and swamp sediments of the Rodenrijs Claystone Mbr, finally resulting in lagoonal black claystone facies. Locally, towards the top of the Rodenrijs Claystone Mbr, sandstone beds are intercalated in a thickening-upward trend culminating in a sandstone package several metres thick. These individual sandstones may be represent washover sands in a lagoonal area behind a barrier (e.g. Vis et al., Reference Vis, Mijnlieff, Verreusel and Munsterman2012).
Very few wells intersect complete sections of the deeper Alblasserdam Mbr in the graben fault blocks. Most geothermal wells only reach several tens of metres into the top of this member. The well logs of these wells show loose stacking of meandering-river sandstone bodies in low net-to-gross intervals, suggesting single-storey fluvial sandstone bodies with low connectivity, and hence low geothermal potential. Some studies mention red-beds and braided deposits at the base of the Alblasserdam Mbr (e.g. Den Hartog Jager, Reference Den Hartog Jager, Rondeel, Batjes and Nieuwenhuijs1996) which were, for example, encountered in the GAAG-06 well (TNO, 2018).
Aquifer sedimentology
The Delft Sst Mbr overlies the Alblasserdam Mbr conformably, possibly locally disconformably as evidenced by seismic data. Core evaluations of the Moerkapelle-11 well show that the basal contact of the Delft Sst Mbr in that well is marked by a sharp, erosional surface (Fig. 6A). The overlying Delft Sst Mbr consists of a lithofacies association of fine to coarse-gravelly, moderately to poorly sorted, light-grey massive sandstone interbedded with claystone, siltstone and coal layers. Individual sandstone beds are characterised by a fining-upward grain-size succession consisting of a lag deposit with clay and lignite clasts in a medium- to coarse-sand matrix at the base, to laminated siltstone and coal at the top (Fig. 6D). Another core of well Q13-09 contains a rare example of a complete fining-upward sequence of c.4 m, which could be related to palaeo bank-full flow depth. Willems et al. (Reference Willems, Nick, Donselaar, Weltje and Bruhn2017a) used this to estimate the associated bank-full palaeo-flow width of 40 m and meander belt width. Following Williams (Reference Williams1986), they proposed a 40 m bank-full flow width, and a meander belt width of c.1–2 km.
Core photographs of the Delft Sst Mbr in well MKP-11. (A) Erosional contact (dashed line) between grey floodplain siltstone (top Alblasserdam Mbr) and medium-grained fluvial channel sandstone with coal fragments (base of Delft Sst Mbr). (B) Oil-stained coarse-grained fluvial sandstone with lighter mud invasion rim. (C) Oil-stained fine to medium-grained fluvial sandstone. (D) Siltstone showing inclined lamination and interbedded coal; top of the fining-upward succession of a fluvial sandstone body.

Rock properties: permeability and porosity
Core plug measurements in the 1500–2500 m depth range show a linear compaction-related porosity reduction trend of c.5% per 500 m (Fig. 7A). The wide spread of porosity values at present-day depth results from facies differences and a varying degree of diagenesis (Fig. 7B). The impact of burial history becomes evident when comparing Figure 7A with Figure 7B, which shows the relation between the maximum burial depth of the core samples and porosity. Maximum burial depth was derived from burial maps of the basin-modelling study by Nelskamp & Verweij (Reference Nelskamp and Verweij2012). Figure 8 shows the relation between porosity and permeability for all Nieuwerkerk Formation core plugs (k N, Equation 1) and the presumed Delft Sst Mbr (k D, Equation 2):
 $${\log _{10}}\left( {{k_{\rm{N}}}} \right) = - 2.03 \cdot {10^{ - 7}} \cdot {\varphi ^5} + 2.547 \cdot {10^{ - 5}} \cdot {\varphi ^4} + 1.035 \cdot {10^{ - 3}} \cdot {\varphi ^3} + 8.905 \cdot {10^{ - 3}} \cdot {\varphi ^2} + 0.358 \cdot \varphi + 3.21$$
 $${\log _{10}}\left( {{k_{\rm{D}}}} \right) = - 3.523 \cdot {10^{ - 7}} \cdot {\varphi ^5} + 4.278 \cdot {10^{ - 5}} \cdot {\varphi ^4} - 1.723 \cdot {10^{ - 3}} \cdot {\varphi ^3} + 1.896 \cdot {10^{ - 2}} \cdot {\varphi ^2} + 0.333 \cdot \varphi - 3.222$$
(A) Porosity – present-day depth and (B) porosity – maximum burial depth relations for Nieuwerkerk Formation.

Porosity–permeability cross-plot of Nieuwerkerk Formation core plug measurements.

Considering an average current depth of the sandstones of 2000–2500 m, these plots suggest a porosity of the Delft Sst Mbr of some 8–25% (Fig. 7B) and associated permeability range from several tens of mD up to 3000 mD. Measurements in Figures 7 and 8 are derived from hydrocarbon wells. So far, well tests from several active geothermal doublets mainly indicate permeability values of entire production intervals of over 1000 mD, which is the higher end of this permeability range. Several hypotheses exist that explain the high permeability values that were derived from the well tests in geothermal wells. Firstly, these doublets exploit younger intervals of the Nieuwerkerk Formation, while the core plug dataset also contains samples from the entire formation. Possibly, the younger, shallower intervals have more favourable aquifer properties. Secondly, well tests could show higher permeability because the sandstones with highest permeability of the presumed Delft Sst Mbr are probably very friable and therefore less frequently preserved in the coring process. Finally, the higher well-test permeabilities might be a result of the presence of additional secondary porosity from fractures or sub-seismic faults that locally enhance permeability. Due to the low vertical resolution of most log measurements and the low resolution of seismic data, secondary permeability is not yet proven. Formation Imaging logging and detailed geomechanical modelling could be applied to elucidate the possible role of secondary porosity in Nieuwerkerk Formation aquifers.
Well-test and GR logs also revealed variations in aquifer quality and thickness of the Nieuwerk Formation across the basin. The most favourable flow performance was encountered in the doublets of Honselersdijk, Poeldijk and De Lier (Mijnlieff, Reference Mijnlieff2020). Aquifer thickness, as well as aquifer quality, decreases towards the south and to a lesser extent also to the north of these doublets. As the clay content and the degree of diagenesis of the Delft Sst Mbr is typically quite low, a more likely explanation for this varying quality could be related to other factors, such as grain-size distribution and sorting.
Rock properties: thermal
Mottaghy et al. (Reference Mottaghy, Pechnig and Vogt2011) published heat conductivity and density measurements of sandstone and claystone cuttings of the Nieuwerkerk Formation from well KDZ-02 and Q16-02. They found an average density of 2.68 g cm−3. Heat conductivity measurements were subdivided into samples with heat conductivity below 3.0 W m−1 K−1, which are mainly claystone, and samples with heat conductivity higher than 3.0 W m−1 K−1, which were related to sandstones. From these data, mean values of heat conductivity of 2.5 W m−1 K−1 for the claystone samples and 4.5 W m−1 K−1 for the sandstone samples can be derived. The heat capacity or heat diffusivity constant has not been determined in these measurements. In the absence of measurements of these properties, so far, rough assumptions were made for heat capacity and heat conductivity in numerical production simulations of geothermal exploitation of the Nieuwerkerk Formation aquifer. These assumptions of heat capacity range from 730 J kg−1 K−1 for sandstone and 950 J kg−1 K−1 for claystone by Crooijmans et al. (Reference Crooijmans, Willems, Nick and Bruhn2016) to 2700 J kg−1 K−1 for both sandstone and claystone by Kahrobaei et al. (Reference Kahrobaei, Fonseca, Willems, Wilschut and Van Wees2019).
Aquifer geology: Rijnland Group
Depositional environment
The Rijnland Group in the WNB has four distinct sandstone members (Rijswijk, Berkel, IJsselmonde and De Lier), which are all shallow marine sandstones. Depending on the position on the coastal bathymetrical profile and its position with reference to the fair-weather and storm wave-base the facies differ significantly. The most proximal locations comprise low-angle cross-bedded to massive, slightly burrowed, clean moderately to well-sorted, fine- to medium-grained upper shoreface sandstones. GR signature is generally egg-shaped, with frequent high peaks caused by thin claystone intercalations.
The more distal facies, deposited as lower shoreface to lower offshore sediments, are characterised by medium- to fine-grained silty to clayey, glauconitic sandstones. They are thoroughly bioturbated to such an extent that no sedimentary structures are visible anymore. Only subtle trends in clay content hint at an original stratification of sand and clay, most likely caused by episodic influx of sand in an area below storm wave-base. In this area a low sedimentation rate of predominant background sedimentation of clay and possibly silt gives the fauna enough time to churn the sediment. The GR signature of these facies is barrel-shaped.
The Rijswijk Sst Mbr represents the first fully marine sequence after the deposition of the terrestrial to marginal marine sediments of the Nieuwerkerk Formation. The Rijswijk Sst Mbr is deposited as a transgressive sheet, stepping into the WNB from the north (Jeremiah et al., Reference Jeremiah, Duxbury and Rawson2010). Den Hartog Jager (Reference Den Hartog Jager, Rondeel, Batjes and Nieuwenhuijs1996) and Racero-Baena & Drake (Reference Racero-Baena, Drake, Rondeel, Anders, Batjes and Nieuwenhuijs1996) described and mapped the marine transgressive sheet sands and coastal barrier sand complexes. The facies belt of the Rijswijk Mbr has the most northerly position and did not overstep the entire WNB. The younger sandstones progressively encroach the southwest flanks of the WNB, resulting ultimately in configurations where the De Lier Sst Mbr overlies the Nieuwerkerk Formation in the southeastern part of the basin (e.g. well BRT-01, Fig. 3).
Aquifer sedimentology
The GR log of well VDB-GT-01 exhibits a typical signature of the Rodenrijs Claystone Mbr and Rijswijk Sst Mbr (Fig. 9). Directly on top of the claystones a blocky sandstone can be recognised covered by a thin claystone interval. This grades into a barrel-shaped GR response, which is associated with lower shoreface to lower offshore sandstone. Cores from the Q13-09 and Q13-08 wells provide insight into the sequence-stratigraphic origin of this typical Rodenrijs Claystone Mbr GR sequence (Fig. 9; Vis et al. Reference Vis, Mijnlieff, Verreusel and Munsterman2012). In the core of well Q13-09, a sequence boundary with an erosive nature lies on the top of the blocky sand followed by a very thin transgressive conglomeratic lag. This is associated with a maximum flooding surface at the maximum shale peak on the GR. Thus, the blocky sand below is genetically related to the Rodenrijs Claystone Mbr. After the regional flooding event, this shale peak was covered with sandy deposits during a relative sea-level high stand, represented by the barrel-shaped GR interval.
GR logs of wells Q13-08 and Q13-09 offshore The Hague, as well as core section from Q13-09 highlighting that boundary between the Rijnland Group and Nieuwerkerk Formation is not always marked by a transition from high to low GR readings. The top of the Nieuwerkerk Formation could contain sandy units, complicating identification of the boundary based on GR logs alone.

In cores of the offshore Rijn oilfield the sequence boundary is found at the base of the blocky sand, which is characterised by the presence of a conglomeratic basal interval (TNO, 2018). The overlying claystone and bell-shaped sandstone GR response is similar to the interval in Q13-09. In this case the blocky sandstone may better be interpreted as an infill of an erosional topographic low in the coastline (incised valley) in which the early transgressive sands were accumulated and preserved.
Lateral continuity of the sandstones of the Rijnland Group is expected to be high. Alberts et al. (Reference Alberts, Geel and Klasen2003) showed that transgressive sheet sandstones like the Rijswijk Mbr, or coastal barrier complexes like the Berkel Sst Mbr, could have lateral continuity of several tens of kilometres, depending on the palaeobathymetry and the balance between sediment supply and relative base-level. The thickness of transgressive sheet sandstones like the Rijswijk Mbr typically does not exceed 20 m, while coastal barrier complexes can build-up to several tens of metres in thickness (Alberts et al., Reference Alberts, Geel and Klasen2003). Despite the potentially high lateral continuity, well-log correlation is not always straightforward in the WNB because of the stepped transgression. Therefore, similar sandstones (on log response) may belong to a different sequence and, in the lithostratigraphic nomenclature, to a different member and may therefore be laterally disconnected. Multiple studies have already shown that biostratigraphic control is essential to unravel the lateral facies architecture on sub-regional scale (Munsterman Reference Munsterman2012; Vis et al., Reference Vis, Mijnlieff, Verreusel and Munsterman2012; Willems et al., Reference Willems, Vondrak, Munsterman, Donselaar and Mijnlieff2017c; Vondrak et al., Reference Vondrak, Donselaar and Munsterman2018).
Rock properties
Favourable porosity and permeability values have been measured in core plug samples of the marine sandstones of the Rijnland Group especially for the Rjiswijk-, Berkel- and IJsselmonde Sst Mbrs (Fig. 10). According to Vis et al. (Reference Vis, Van Gessel, Mijnlieff, Pluymaekers, Hettelaar and Stegers2010), there is no significant relationship between depth and permeability for the Rijnland Group sands in this basin. This is reflected by the large scatter on the porosity–permeability cross-plots of Figure 10. Possible explanations include (1) the facies differences within the different members, (2) varying diagenesis as a result of differences in burial history (Vis et al. Reference Vis, Van Gessel, Mijnlieff, Pluymaekers, Hettelaar and Stegers2010) and (3) the limited maximum burial depth of up to 2500 m. Especially for the Rijswijk Mbr, the permeability declines more rapidly for lower porosity values, which could be attributed to the effect of dispersed clay and glauconite. This reduces its geothermal potential. Despite the many available porosity–permeability measurements of sandstone members of the Rijnland Group, the authors of this paper are not aware of publications on thermal properties of the Rijnland Group aquifers.
Porosity–permeability cross-plot of Vlieland Sandstone Members of the Rijnland Group: (A) Berkel Sst; (B) Rijswijk Sst; (c) De Lier Sst; (D) IJselmonde Sst.

Geological challenges
Even in the data-rich WNB, geothermal power estimates for new doublets still have a wide uncertainty range. This is reflected by the large spread of P10 to P90 capacity estimates for new doublets of several MWth. The uncertainty has a potential negative impact on the maturation of these projects because the risk puts off investors, especially as the geological insurance- and feed-in subsidy allocations are based on these estimates. The uncertainty in capacity estimates results from a limited understanding of (1) the regional sedimentary aquifer architecture, (2) sub-seismic structural geology and (3) aquifer rock properties. A better understanding of these three geological parameters is also crucial for safe and sustainable exploitation of the resources and is a prerequisite for optimised well planning in the limited space available between currently active doublets. The main challenges and uncertainties are discussed in the following paragraphs.
Uncertainty in sedimentary aquifer architecture
Despite the increasing number of studies with sequence-stratigraphic updates, the coarse lithostratigraphic model of Van Adrichem Boogaert & Kouwe (Reference Van Adrichem Boogaert and Kouwe1997) in Figure 3 still forms the basis for geothermal doublet planning and design in the WNB. The development of higher-resolution models based on sequence stratigraphy has been limited by the limited amount of geological data acquired from geothermal wells. Firstly, logging in geothermal wells is less extensive than logging in hydrocarbon wells, or only done for sections of the wellbores. Also, no vertical seismic profiles (VSPs) are available in geothermal offset wells. Therefore, no well-to-seismic ties can be made, which limits the available information that could be derived from seismic data on the regional sedimentary architecture. New geothermal well planning would benefit from enhanced used of seismic data, especially because reprocessed WNB vintage seismic surveys are now available in the public domain that dramatically improved imaging of sedimentary and tectonic features. Secondly, geothermal wells in the WNB have relatively simple completions compared to their hydrocarbon counterparts. They have large open-hole sections with production tubing and screens and no downhole flow sensors to identify differences in productivity of intervals. Therefore, uncertainty remains as to the net aquifer thickness, which is a key element of sedimentary aquifer architecture. This affects the prediction of lifetime and interference (Mijnlieff & Van Wees, Reference Mijnlieff and Van Wees2009; Hamm & Lopez, Reference Hamm and Lopez2012; Crooijmans et al., Reference Crooijmans, Willems, Nick and Bruhn2016), and heat-in-place estimates (Vis et al., Reference Vis, Van Gessel, Mijnlieff, Pluymaekers, Hettelaar and Stegers2010; Kramers et al., Reference Kramers, Van Wees, Pluymaekers, Kronimus and Boxem2012). Intervals with higher flow rates can also be more subject to erosion, scaling and corrosion, and therefore the simple completions also restrict well-integrity studies. For detailed local aquifer zonation evaluation without the availability of downhole flow sensors, repetitive production logging is a prerequisite to delineate the net aquifer thickness and allow more detailed permeability calculations from well tests. Finally, no cores have been derived from the Upper Jurassic to Lower Cretaceous interval in the graben fault blocks. These would not only allow high-resolution studies of the sedimentary aquifer architecture, they would also permit rock property measurements. For example, geothermal core plug permeability measurements could elucidate the difference between hydrocarbon core plug measurements and the permeability derived from geothermal well tests. Not all geothermal wells would need to be cored. Palynological analysis of drill cuttings (e.g. Munsterman Reference Munsterman2012, Reference Munsterman2013; Willems et al., Reference Willems, Vondrak, Munsterman, Donselaar and Mijnlieff2017c) and field work analogue studies (e.g. Flood & Hampson, Reference Flood and Hampson2015; Owen et al., Reference Owen, Hartley, Ebinghaus, Weissmann and Santos2018) could assist in extrapolating observations in core studies to a regional scale. So far, palynological analyses have only been applied to a very limited number of geothermal and petroleum wells in the WNB, and outcrop analogue studies have not been reported in the literature.
Uncertainties in structural geology and thermal properties
Uncertainty not only remains for the regional sedimentary architecture, but also for the existence and distribution of sub-seismic faults and fractures in the Upper Jurassic to Lower Cretaceous interval. These features could act as flow baffles or alternatively as high-permeability short cuts, affecting thermal breakthrough time and optimised doublet deployment (e.g. Mijnlieff & Van Wees, Reference Mijnlieff and Van Wees2009). An improved understanding of the variance in thermal properties of the rocks is required for more adequate predictions of thermal breakthrough as a basis for optimised doublet design. Heat conductivity and heat capacity affect the cold-water front propagation, the cold-water breakthrough moment and the rate of the production temperature decline thereafter (e.g. Poulsen et al., Reference Poulsen, Balling and Nielsen2015; Pandey et al., Reference Pandey, Vishal and Chaudhuri2018). The variability of these properties could be large (e.g. Fuchs, Reference Fuchs2018) and has not been determined for WNB aquifer rocks. A better grip on reservoir properties, including porosity, permeability, geomechanical and thermal properties, can be derived from core samples.
Value of information in geothermal operations
The geological uncertainties mentioned above continue to a large extent, as a result of cost cutbacks for data acquisition and geological studies in geothermal operations. It should be noted that the past decade has seen several examples of geothermal wells that have had adequate to good data acquisition campaigns including extensive logging of Upper Jurassic – Lower Cretaceous strata. A subtle trend of more data acquisition is emerging recognising the need for data-driven static and dynamic subsurface geological models for long-term efficient and safe operations of geothermal systems. Nevertheless, hydrocarbon developers typically acquire much more subsurface data than geothermal operators because of the higher value of hydrocarbons compared to the value of geothermal heat. In addition, there was limited incentive for the first geothermal operators in the WNB to invest in data because they only aimed to provide heat for local, decentralised heat networks with a single doublet. In contrast, hydrocarbon operators aim to exploit an entire resource with dozens of wells. Because data acquisition from the first wells reduces the risk of failure of later wells, there is a much stronger incentive for extensive data acquisition in regionally focused operations. Because of the different exploitation standards in both industries, and because of different financial boundary conditions, we expect that geothermal operators cannot directly copy data acquisition standards from hydrocarbon operators. Therefore, a major challenge for optimising geothermal exploitation is to quantify the value of information (VOI) of data, to be able to derive new geothermal data acquisition standards. In particular, coring and seismic inversion are too costly for individual operators and should be shared. VOI could be a basis for long-term data cost-sharing strategies between neighbouring operators as well as government agencies.
New aquifer targets: Alblasserdam Member
The Alblasserdam Mbr is generally considered as a low net-to-gross interval below the Delft Sst Mbr with a low geothermal potential. Devault & Jeremiah (Reference Devault and Jeremiah2002) and Jeremiah et al. (Reference Jeremiah, Duxbury and Rawson2010) did not recognise the Delft Sst Mbr as a separate unit and believed that amalgamated sandstone complexes occur throughout the Nieuwerkerk Formation. This suggests not only that the Delft Sst Mbr of Van Adrichem Boogaert & Kouwe (Reference Van Adrichem Boogaert and Kouwe1997) is a possible geothermal target in the formation, but that additional similar amalgamated sandstone complexes could occur locally in deeper parts of the Alblasserdam Mbr. The sandstone distribution in the Alblasserdam Mbr is poorly understood because most wells only intersect several hundred metres of the top of the Nieuwerkerk Formation. Den Hartog Jager (Reference Den Hartog Jager, Rondeel, Batjes and Nieuwenhuijs1996) described the seismic facies of the Alblasserdam section as discontinuous, with low amplitudes. He associated this with rapid lateral facies variation, abundant impermeable shale flow baffles and barriers and lower sandstone content and braided deposits at the base of the member. Because of the syn-tectonic origin, it is not straightforward to use well data from this member from hydrocarbon wells on structural highs to predict the geothermal potential of the Alblasserdam Mbr in the graben blocks. Moreover, these structural elements are often heavily faulted, which complicates well-log correlation of the sandstone members. The limited available core- and well-test data also suggest better aquifer quality of the Delft Sst compared to that of the Alblasserdam Mbr. Mainly the higher temperatures due to the increased depth of up to 3000 m (Duin et al., Reference Duin, Doornenbal, Rijkers, Verbeek and Wong2006) still make the Alblasserdam Mbr a considerable potential geothermal target in the WNB, while the increased depth may also influence the permeability and porosity unfavourably.
New aquifer targets: Rijnland Group
Despite its favourable permeability, porosity and large volumes (Vis et al., Reference Vis, Van Gessel, Mijnlieff, Pluymaekers, Hettelaar and Stegers2010), the Rijnland Group is currently underdeveloped, with only one doublet producing heat from sandstones belonging to this group. This could be explained by their generally shallower depth with lower associated temperatures. Current operators’ geothermal exploitation focus is on deeper targets with temperatures more than 70°C. Future interest in the Rijnland Group might increase with growing demand for low-carbon heat and lower future thresholds for minimal required production temperature. Progressive heat exchanger efficiency and improved thermal insulation of greenhouses and buildings will further reduce minimum required production. Alternatively, exploitation of the Rijnland Group could be enhanced when imminent interference between operators of the Nieuwerkerk Formation forces new operators to look for alternatives. This highlights that the expansion of geothermal exploitation in the WNB not only depends on geological uncertainties but also on legislative measures to deal with them.


 Open access