


Ion adsorption rare earth element (REE) ores, also called ‘weathered crust elution-deposited REE ores’ by some authors (e.g. Chi & Tian, Reference Chi and Tian2008), are the main global source of heavy REE (HREE) and yttrium (Y; Sanematsu & Watanabe, Reference Sanematsu, Watanabe, Verplanck and Hitzman2016). With increasing worldwide demand for REE, especially heavy REE (HREE), these deposits have become important sources of REE because of the easy extraction of the ore and the low radiogenic element (uranium (U), thorium (Th)) contents, which are typically high in other REE deposits, such as carbonatites and alkaline igneous complexes (e.g. Chakhmouradian & Zaitsev, Reference Chakhmouradian and Zaitsev2012; Sanematsu & Watanabe, Reference Sanematsu, Watanabe, Verplanck and Hitzman2016; Goodenough et al., Reference Goodenough, Wall and Merriman2017). In ion adsorption deposits, the REE ores are clay minerals (mostly kaolinite and halloysite) that retain the REE, leached from the dissolution of magmatic (phosphates, silicates), hydrothermal (fluorocarbonates, phosphates) or supergene (oxides, phosphates, fluorocarbonates) minerals, on their structural surfaces, typically as outer-sphere hydrated complexes (Yamaguchi et al., Reference Yamaguchi, Honda, Tanaka, Tanaka and Takahashi2018; Borst et al., Reference Borst, Smith, Finch, Estrade, Villanova-de-Benavent and Nason2020), during weathering of primary igneous rocks (Sanematsu & Watanabe, Reference Sanematsu, Watanabe, Verplanck and Hitzman2016). The HREE enrichment is not universal, and recent research suggests that the HREE enrichment of some deposits is a function of magmatic and hydrothermal processes prior to weathering (Li et al., Reference Li, Zhou and Williams-Jones2019; Chaoxi et al., Reference Chaoxi, Cheng, Aiguo, Smith, Kynicky and Chunwan2023). Adsorption of the REE on clay minerals is also an important process in marine element and estuarine cycling (Tepe & Bau, Reference Tepe and Bau2016) and in controlling the REE in acid mine drainage and geothermal waters (e.g. Lewis et al., Reference Lewis, Komninou, Yardley and Palmer1998; Borrego et al., Reference Borrego, Carro, López-González, de la Rosa, Grande, Gómez and de la Torre2012).
Clay minerals are important adsorption agents due to their small grain size, which translates into a high specific surface area (Awwiller & Mack, Reference Awwiller and Mack1991). The surface properties of clay minerals depend on their chemical composition, the type of atoms on the surface (O and H), the charge and the presence and type of exchangeable cations. There are two types of such surfaces: (1) edge surfaces, associated with defect sites and charges that depend on the pH; and (2) planar surfaces (neutral or charged; Schoonheydt & Johnston, Reference Schoonheydt, Johnston, Bergaya and Lagaly2013). If charged, these surfaces can have permanent (typical of 2:1-layer minerals) or variable charges (Coppin et al., Reference Coppin, Berger, Bauer, Castet and Loubet2002; Schoonheydt & Johnston, Reference Schoonheydt, Johnston, Bergaya and Lagaly2013). The variable-charge surface in clays is: (1) on the hydroxyl surfaces of the octahedral layer (also called ‘gibbsite basal planes’); and (2) at the hydroxyl groups located at edges and defects in mineral particles (called ‘terminal OH groups’). These terminal OH groups are undercoordinated compared to the OH at the hydroxyl surfaces, and they have positive or negative charge depending on the pH of the aqueous solution and the metal ion(s) present in it. The terminal OH groups interact more with water molecules than hydroxyl surfaces, and siloxane neutral surfaces are the least reactive of these (Schoonheydt & Johnston, Reference Schoonheydt, Johnston, Bergaya and Lagaly2013). Variable charges are developed through the loss of protons (H+) to the solution, and the resulting negatively charged surfaces attract positively charged species (in terms of this study, e.g. REECO3+, REEHCO32+ and REE 3+ and humic complexes). The capacity for incorporating such anions increases with decreasing particle size because of the higher number of defects and resulting edge and surface charges (Li et al., Reference Li, Li and Yang2015). The Al2Si2O5(OH)4 polymorphs kaolinite (triclinic, planar morphology) and halloysite (monoclinic, tubular morphology), as 1:1-layer minerals, present one siloxane (the O of the Si tetrahedra) and one hydroxyl (the OH of the Al octahedra) surface, with no interlayer positions. They tend to display only variable-charge surfaces because of the absence of important isomorphic substitutions (Schoonheydt & Johnston, Reference Schoonheydt, Johnston, Bergaya and Lagaly2013). In contrast, despite being a 2:1 clay mineral common in ion adsorption ores, there is little evidence of REE adsorption on illite (Sinitsyn et al., Reference Sinitsyn, Aja, Kulik and Wood2000).
Adsorption of REE depends on the characteristics of the absorbing clay mineral, as noted earlier, as well as on the pH (related to the point of zero charge) and ionic strength (I, salinity) of the soil water (Laveuf & Cornu, Reference Laveuf and Cornu2009). Experimental studies indicate that REE fractionation during adsorption is influenced by pH, ionic radii and the presence of anions (e.g. NO3–, ClO4–) and humic substances in the solution (e.g. Coppin et al., Reference Coppin, Berger, Bauer, Castet and Loubet2002; Wan & Liu, Reference Wan and Liu2005, Reference Wan and Liu2006). The REE tend to become more adsorbed onto kaolinite with increasing pH (Coppin et al., Reference Coppin, Berger, Bauer, Castet and Loubet2002; Wan & Liu, Reference Wan and Liu2005). The trend is the opposite in the presence of humic acids: the adsorption of REE increases with decreasing pH and decreasing humic acid concentration; and light REE (LREE) are preferentially adsorbed onto kaolin with respect to HREE (Wan & Liu, Reference Wan and Liu2006). During kaolinite adsorption, no REE fractionation is observed at the anion concentrations of common groundwaters (Coppin et al., Reference Coppin, Berger, Bauer, Castet and Loubet2002; Sanematsu & Watanabe, Reference Sanematsu, Watanabe, Verplanck and Hitzman2016), but HREE may be more favourably adsorbed onto kaolinite than LREE at neutral pH (Wan & Liu, Reference Wan and Liu2005), and LREE tend to be more adsorbed in the presence of humic acids (Takahashi et al., Reference Takahashi, Minai, Ambe, Makide, Ambe and Tominaga1997; Sonke & Salter, Reference Sonke and Salter2006). Previous experimental studies of lanthanide (Ln) adsorption onto clays include the adsorption of individual REE onto kaolinite (neodymium (Nd), Aja, Reference Aja1998; europium (Eu), Tertre et al., Reference Tertre, Berger, Simoni, Castet, Giffaut, Loubet and Catalette2006; Eu and gadolinium (Gd), Kautenburger & Beck, Reference Kautenburger and Beck2016; lanthanum (La), Nd and Y, Xiao et al., Reference Xiao, Huang, Long, Feng and Wang2016) or montmorillonite (Eu, Bradbury & Baeyens, Reference Bradbury and Baeyens2002; Tertre et al., Reference Tertre, Berger, Simoni, Castet, Giffaut, Loubet and Catalette2006); or all REE onto kaolinite (Coppin et al., Reference Coppin, Berger, Bauer, Castet and Loubet2002; Gao et al., Reference Gao, Fan and Xu2017), montmorillonite (Maza-Rodríguez et al., Reference Maza-Rodríguez, Olivera-Pastor, Bruque and Jiménez-López1992) and vermiculite (Olivera-Pastor et al., Reference Olivera-Pastor, Rodríguez-Castellón and Rodríguez-García1988). Hence, there is a good basis for understanding REE adsorption onto kaolinite, but experimental studies considering numerous variables (pH, variable ligands, ionic strength, kaolinite grain size and crystallinity) at once are still necessary.
In this work, we present the results of adsorption experiments at ambient temperature of REE + Y + scandium (Sc) + Th onto kaolin samples from two localities in a wide range of media including deionised water with dilute nitric acid and low- and high-ionic strength NaCl, Na2SO4 and NaHCO3 solutions at pH ≈ 2, 4, 6 and 8, with 0.1 ppm REE. The aim is to gain further insights into the factors controlling the adsorption of REE onto kaolinite, which ultimately lead to the formation of ion adsorption REE deposit ores.
Methodology
Experiment setup
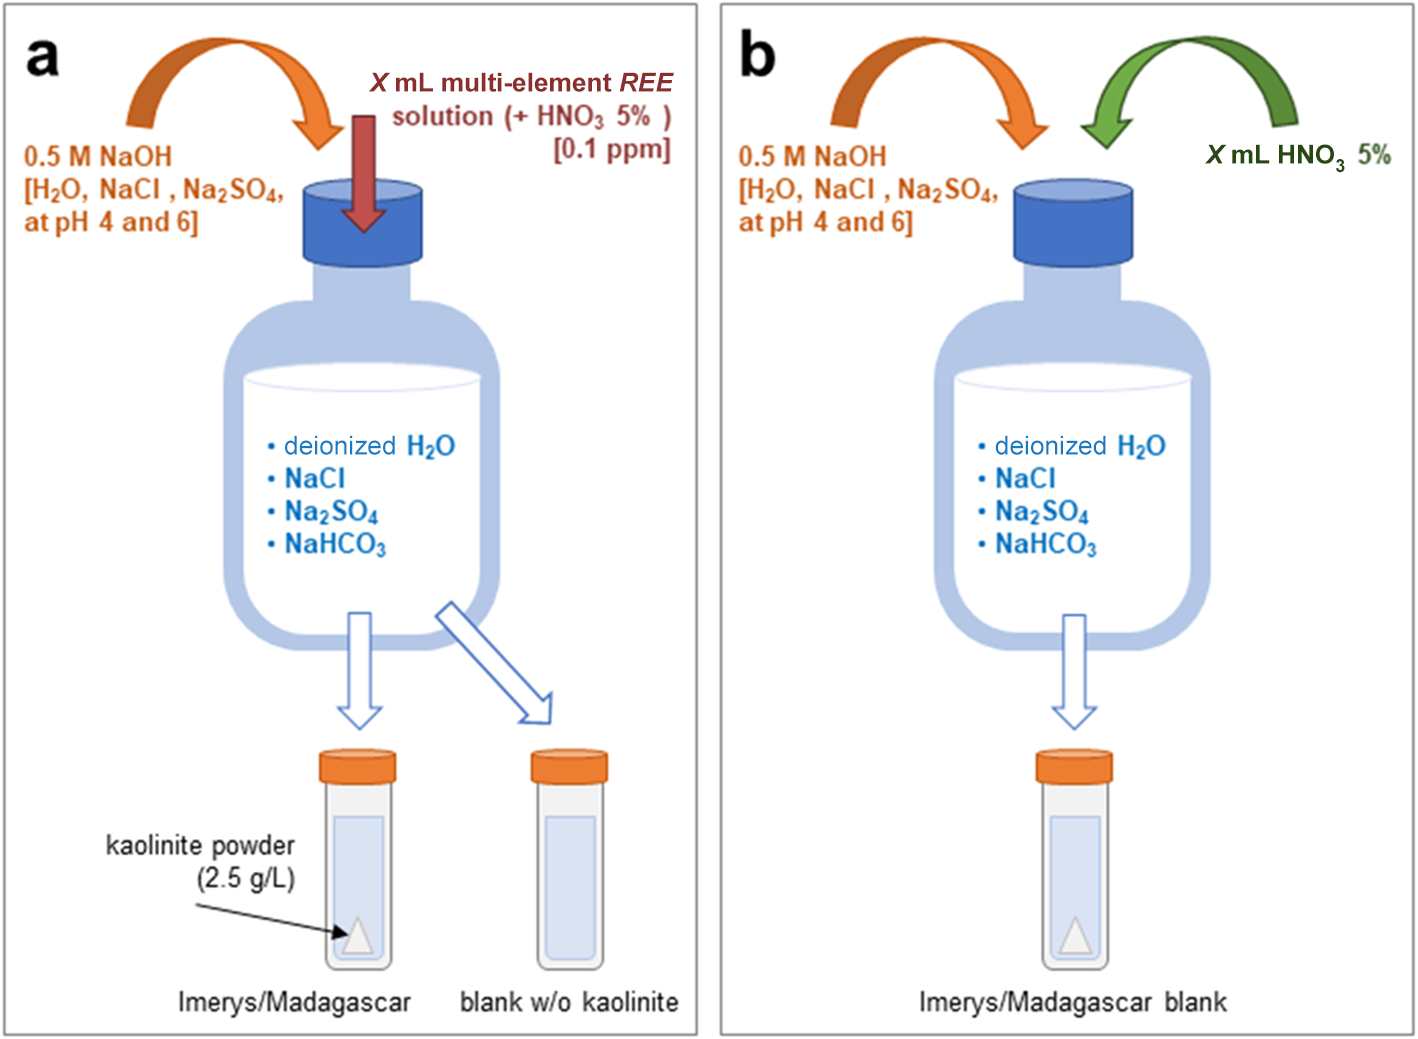
The experiments consisted of introducing kaolinite powder into a solution, following a 2.5 g L–1 solid:solution ratio (Coppin et al., Reference Coppin, Berger, Bauer, Castet and Loubet2002). The kaolinite powders used were: (1a) ‘China clay BP light kaolin’ provided by Imerys® (hereafter ‘Imerys kaolin’); and (2) a kaolin separate from the ion adsorption REE deposit over the Ambohimirahavavy alkaline complex in Madagascar (hereafter ‘Madagascar kaolin’; Estrade et al., Reference Estrade, Marquis, Smith, Goodenough and Nason2019). The Imerys kaolin was not treated before the experiments but is an industrial mineral product processed for purity and has a relatively uniform grain size. The Madagascar kaolin is a mineral separate of the <2 μm fraction prepared by standard centrifugation techniques and with organic matter removed by treatment with hydrogen peroxide (Bergaya & Lagaly, Reference Bergaya, Lagaly, Bergaya and Lagaly2013). The tubes containing the kaolinite powders and the solutions were put in a shaker (at 250 rpm) to keep the kaolinite in suspension (except the NaHCO3 experiment, in which the solutions and powders were put in open glass bottles on magnetic stirrers in a fume hood because of degassing). The experiments ran for 1 day, with sampling after 2, 6 and 24 h (Fig. 1 & Table 1). The samples were centrifuged for 30–40 min at 2500 rpm (except the samples of the experiment with NaHCO3), and the supernatant (hereafter referred to as the ‘output solution’) was filtered with a 0.45 µm syringe filter and diluted with 4% HNO3 for inductively coupled plasma mass spectrometry (ICP-MS) analysis. The solid residue was rinsed with deionised water and put in an oven at 40°C to allow the rest of the solution to evaporate.
Schematic setup of the adsorption experiments. (a) REE-bearing (starting solution: dilute nitric acid) using deionised water (pH-corrected with NaOH to 4 or 6) or solutions with NaCl (pH ≈ 2 or pH-corrected with NaOH to 4 or 6), NaSO4 (pH-corrected with NaOH to 4 or 6) or NaHCO3, with kaolinite (Imerys or Madagascar) and a kaolinite-free blank. (b) REE-free, with the same ligands and pH, and with the same proportion of HNO3 as in the REE-bearing solution, with kaolinite.

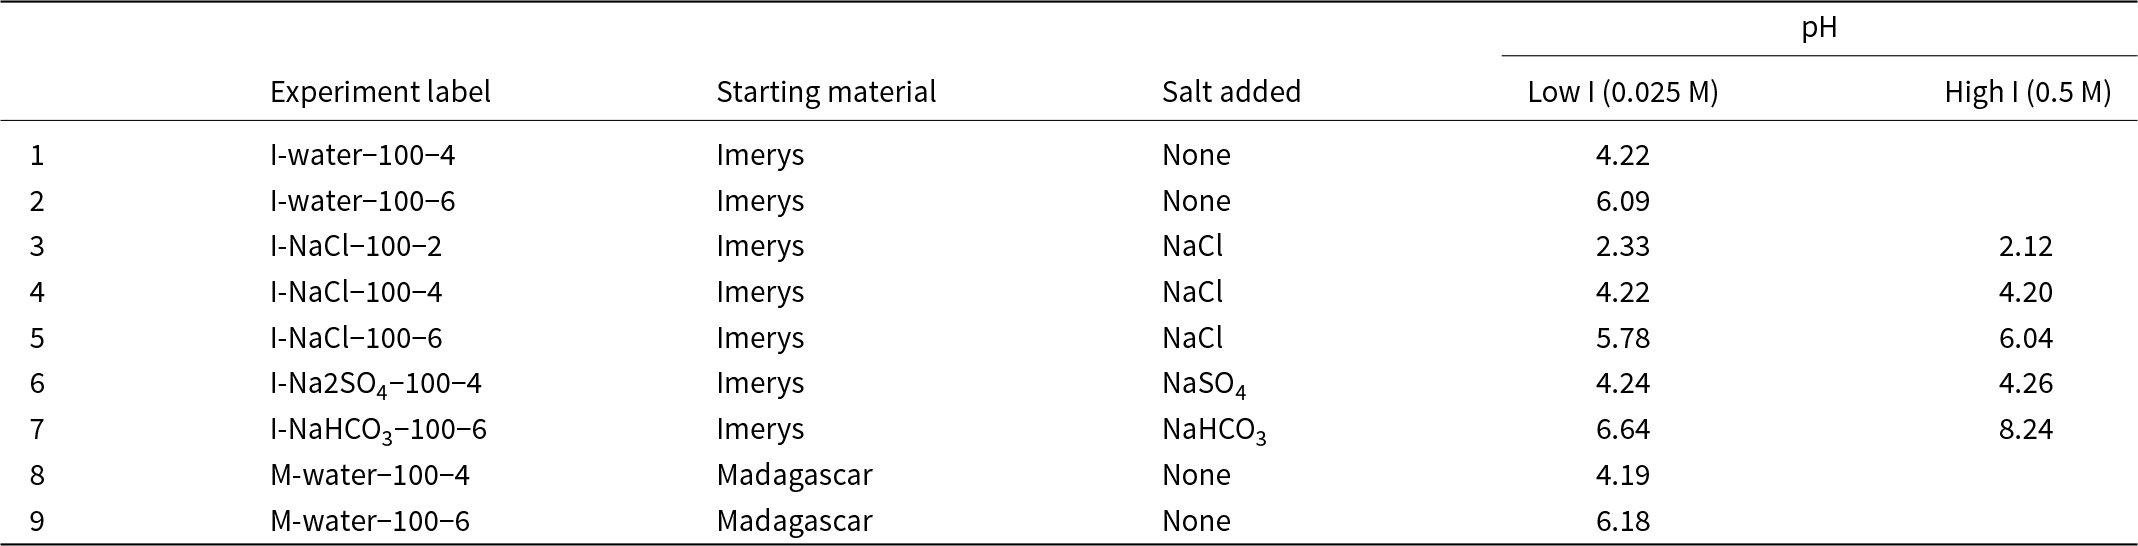
Details of the experiments carried out in this study, including starting material, pH, ionic strength and salt added. All experiments contained HNO3 and 0.1 ppm REE. Experiments were run for 1 day and sampled at 2, 6 and 24 h.

The solutions that interacted with Imerys kaolinite were deionised water (experiments ‘1-I-water-100-4’ and ‘2-I-water-100-6’); and low- and high-ionic strength (I) solutions (0.025 and 0.5 M, respectively) containing NaCl, Na2SO4 and/or NaHCO3 (Table 1; https://doi.org/10.17033/DATA.00000338). The saline solutions were prepared using reagent-grade NaCl (Fisher® sodium chloride S/3160/60), Na2SO4 (Fisher® anhydrous sodium sulphate S/6600/60) and NaHCO3 (Sigma Aldrich® sodium bicarbonate S-6014). On the other hand, the solution interacting with Madagascar kaolinite included deionised water (experiments ‘M-water-100-4’ and ‘M-water-100-6’) with nitric acid added from the stock REE solution and to fix the final pH. The pH values of the solutions were ∼2 (‘3-I-NaCl-100-long’, ‘4-I-NaCl-100-2’), ∼4 (‘1-I-water-100-4’, ‘5-I-NaCl-100-4’, ‘8-I-NaSO4-100-4’, ‘10-M-water-100-4’) and 6–8 (‘2-I-water-100-6’, ‘6-I-NaCl-100-6’, ‘9-I-NaHCO3-100-6’, ‘11-M-water-100-6’; Table 1). All solutions contained 0.1 mg L–1 REE, using the multi-element calibration standard coded 8500-6944 from Agilent technologies® (10 mg L–1 Ce, Dy, Er, Eu, Gd, Ho, La, Lu, Nd, Pr, Sc, Sm, Tb, Th, Tm, Y, Yb; 5% HNO3 matrix) diluted with deionised water. To achieve pH ≈ 4 and 6 in NaCl and Na2SO4 solutions, 5 M NaOH was added whilst pH was monitored using a pH meter (Fig. 1a). The experimental solutions were selected to reflect a range of inorganic ligands potentially present in ion adsorption deposit (IAD) environments (e.g. Li et al., Reference Li, Kwong, Zhou and Williams-Jones2022) or in other environments noted for their REE mobility. The pH range spans from those present in sulphide weathering environments (pH ≈ 2; e.g. Ferreira da Silva et al., Reference Ferreira da Silva, Bobos, Matos, Patinha, Reis and Fonseca2009) to natural groundwater pH reported from IADs (pH 4–7; e.g. Li et al., Reference Li, Zhou and Williams-Jones2019, Reference Li, Kwong, Zhou and Williams-Jones2022). The concentration of the REE is close to those reported from IAD groundwaters from the Zhudong and Bankeng deposits by Wu (Reference Wu1988) and Li et al. (Reference Li, Zhou and Williams-Jones2019, Reference Li, Kwong, Zhou and Williams-Jones2022), where the REE ranged from 0.3 mg kg–1 (La, Ce) to 0.05 mg kg–1 (Tm, Lu).
Each experiment was conducted in duplicate and included a kaolinite-free blank (Fig. 1a), as well as a set of REE-free blanks that were prepared using the saline solution with the same concentration of 5% HNO3 as the REE counterparts, buffered to a similar final pH (Fig. 1b). It is worth noting that Coppin et al. (Reference Coppin, Berger, Bauer, Castet and Loubet2002) used NaNO3 and NaClO4 for their experiments. Although HNO3 was always present in our experiments (contained in the standard REE solution), we used NaCl instead of NaClO4. According to Millero (Reference Millero1992), La3+ does not have the same activity coefficient in NaCl and in NaClO4. The full experimental analytical dataset including replicates and blanks is available at https://doi.org/10.17033/DATA.00000338.
To facilitate the interpretation of trends in sorption behaviour across the REE in the presence of different ligands, the aqueous speciation of the REE in each experimental solution was calculated using PHREEQC® v. 3 software (Parkhurst & Appelo, Reference Parkhurst and Appelo2013) and the Lawrence Livermore National Laboratory (LLNL) database. For Ln–Cl complexes the LLNL database was used, and for Ln–OH, Ln–SO4 and Ln–CO3 complexes internally consistent association constants tabulated by Li et al. (Reference Li, Kwong, Zhou and Williams-Jones2022) from Klungness & Byrne (Reference Klungness and Byrne2000), Lee & Byrne (Reference Lee and Byrne1992), Luo & Byrne (Reference Luo and Byrne2004), Liu & Byrne (Reference Liu and Byrne1998), Millero (Reference Millero1992), Luo & Millero (Reference Luo and Millero2004), Schijf & Byrne (Reference Schijf and Byrne2004) and Luo & Byrne (Reference Luo and Byrne2001) were used. This database does not include disulphate complexes, but where the disulphate complexes have been included in databases, the association constants are predicted to be two orders of magnitude lower than for the mono sulphate complex (Wood, Reference Wood1990).
Analytical techniques
The particle size of the starting material was determined using a Malvern® Mastersizer 2000+ Hydro 2000G laser particle analyser (results are given in percentiles), using water with Calgon as dispersants. The kaolinite powders were studied using powder X-ray diffraction (PXRD) in a Rigaku Miniflex XRD device at 40 kV accelerating voltage and 10 nA current, using Cu-Kα X-rays and a rotating stage. Samples were not crushed or desiccated prior to the analysis. A small portion of the powder was put onto a pin and then carbon coated and examined under a Zeiss Evo scanning electron microscope (SEM) with an Oxford Instruments energy-dispersive spectrometry (EDS) detector. Analytical conditions were 5 kV accelerating voltage and 0.1 nA current in imaging and analysis mode. To obtain the mass loss on ignition (LOI), the kaolinite powders were put into a desiccator at 105°C overnight prior to analysis (University of Cambridge, Department of Geography, Physical Geography Laboratories; LOI protocol v. 1.2). The samples were heated at 550°C for 4 h and left for 30 min to cool down in a desiccator at ambient temperature.
The chemical composition of both the untreated kaolin powder and the output solutions was obtained with an Agilent 7900 ICP-MS device in He collision mode. For bulk analyses the kaolin powder was prepared as a fused bead (using LiBO3) and then digested with HNO3. The calibration standards were REE oxides in 5% HNO3, doped to matrix-match with the samples using LiBO3. Prior to the analysis, the output solution was diluted by 50% with 4% HNO3. In this case, the calibration standards were prepared with the same multi-element calibration standard (Agilent® 8500-6944) used in the experiments, matrix-matched with each experiment solution using a blank LiBO3 digestion solution. The internal calibration standard was a matrix-matched solution with 100 ppb Rh. Repeat analysis of solutions indicates reproducibility within 5% for all elements. Means of repeat analysis of US Geological Survey (USGS) Certified Reference Materials BCR2 and GSP2 are within 1σ agreement with certified values for the techniques used here. The ICP-MS data of the output solutions were used to calculate the sorption coefficient Kd (mL g–1) according to Equation 1 proposed by Coppin et al. (Reference Coppin, Berger, Bauer, Castet and Loubet2002):
 \begin{equation}{{\text{K}}_{\text{d}}} = \frac{{\left( {{C_{{\text{initial}}}} - {C_{{\text{final}}}}} \right)}}{{{C_{{\text{final}}}}}}\frac{V}{M}\end{equation}
where C initial and C final are the aqueous concentrations (μg L–1) of the elements at the start and at the end of the experiments, respectively, V is the solution volume (mL) and M is the mass of the kaolin powder (g).
Mean zeta-potential (ζ-potential) of the starting kaolin was measured using a Zetasizer Nano ZS90 with a DTS1070 cell at room temperature. The instrument uses electrophoretic light scattering to determine electrophoretic mobility, from which the ζ-potential is calculated. This is based on the Smoluchkovsky approximation (Sze et al., Reference Sze, Ericjson, Ren and Li2003). The dispersants were: (1) deionised water; (2) low- and high-I solutions at their default pH; and (3) deionised water at different pH values ranging from 1 to 8, which were achieved by adding 0.025 M NaOH or 5% HNO3. All of the analyses were performed at the University of Brighton.
Results
Characterisation of the starting material
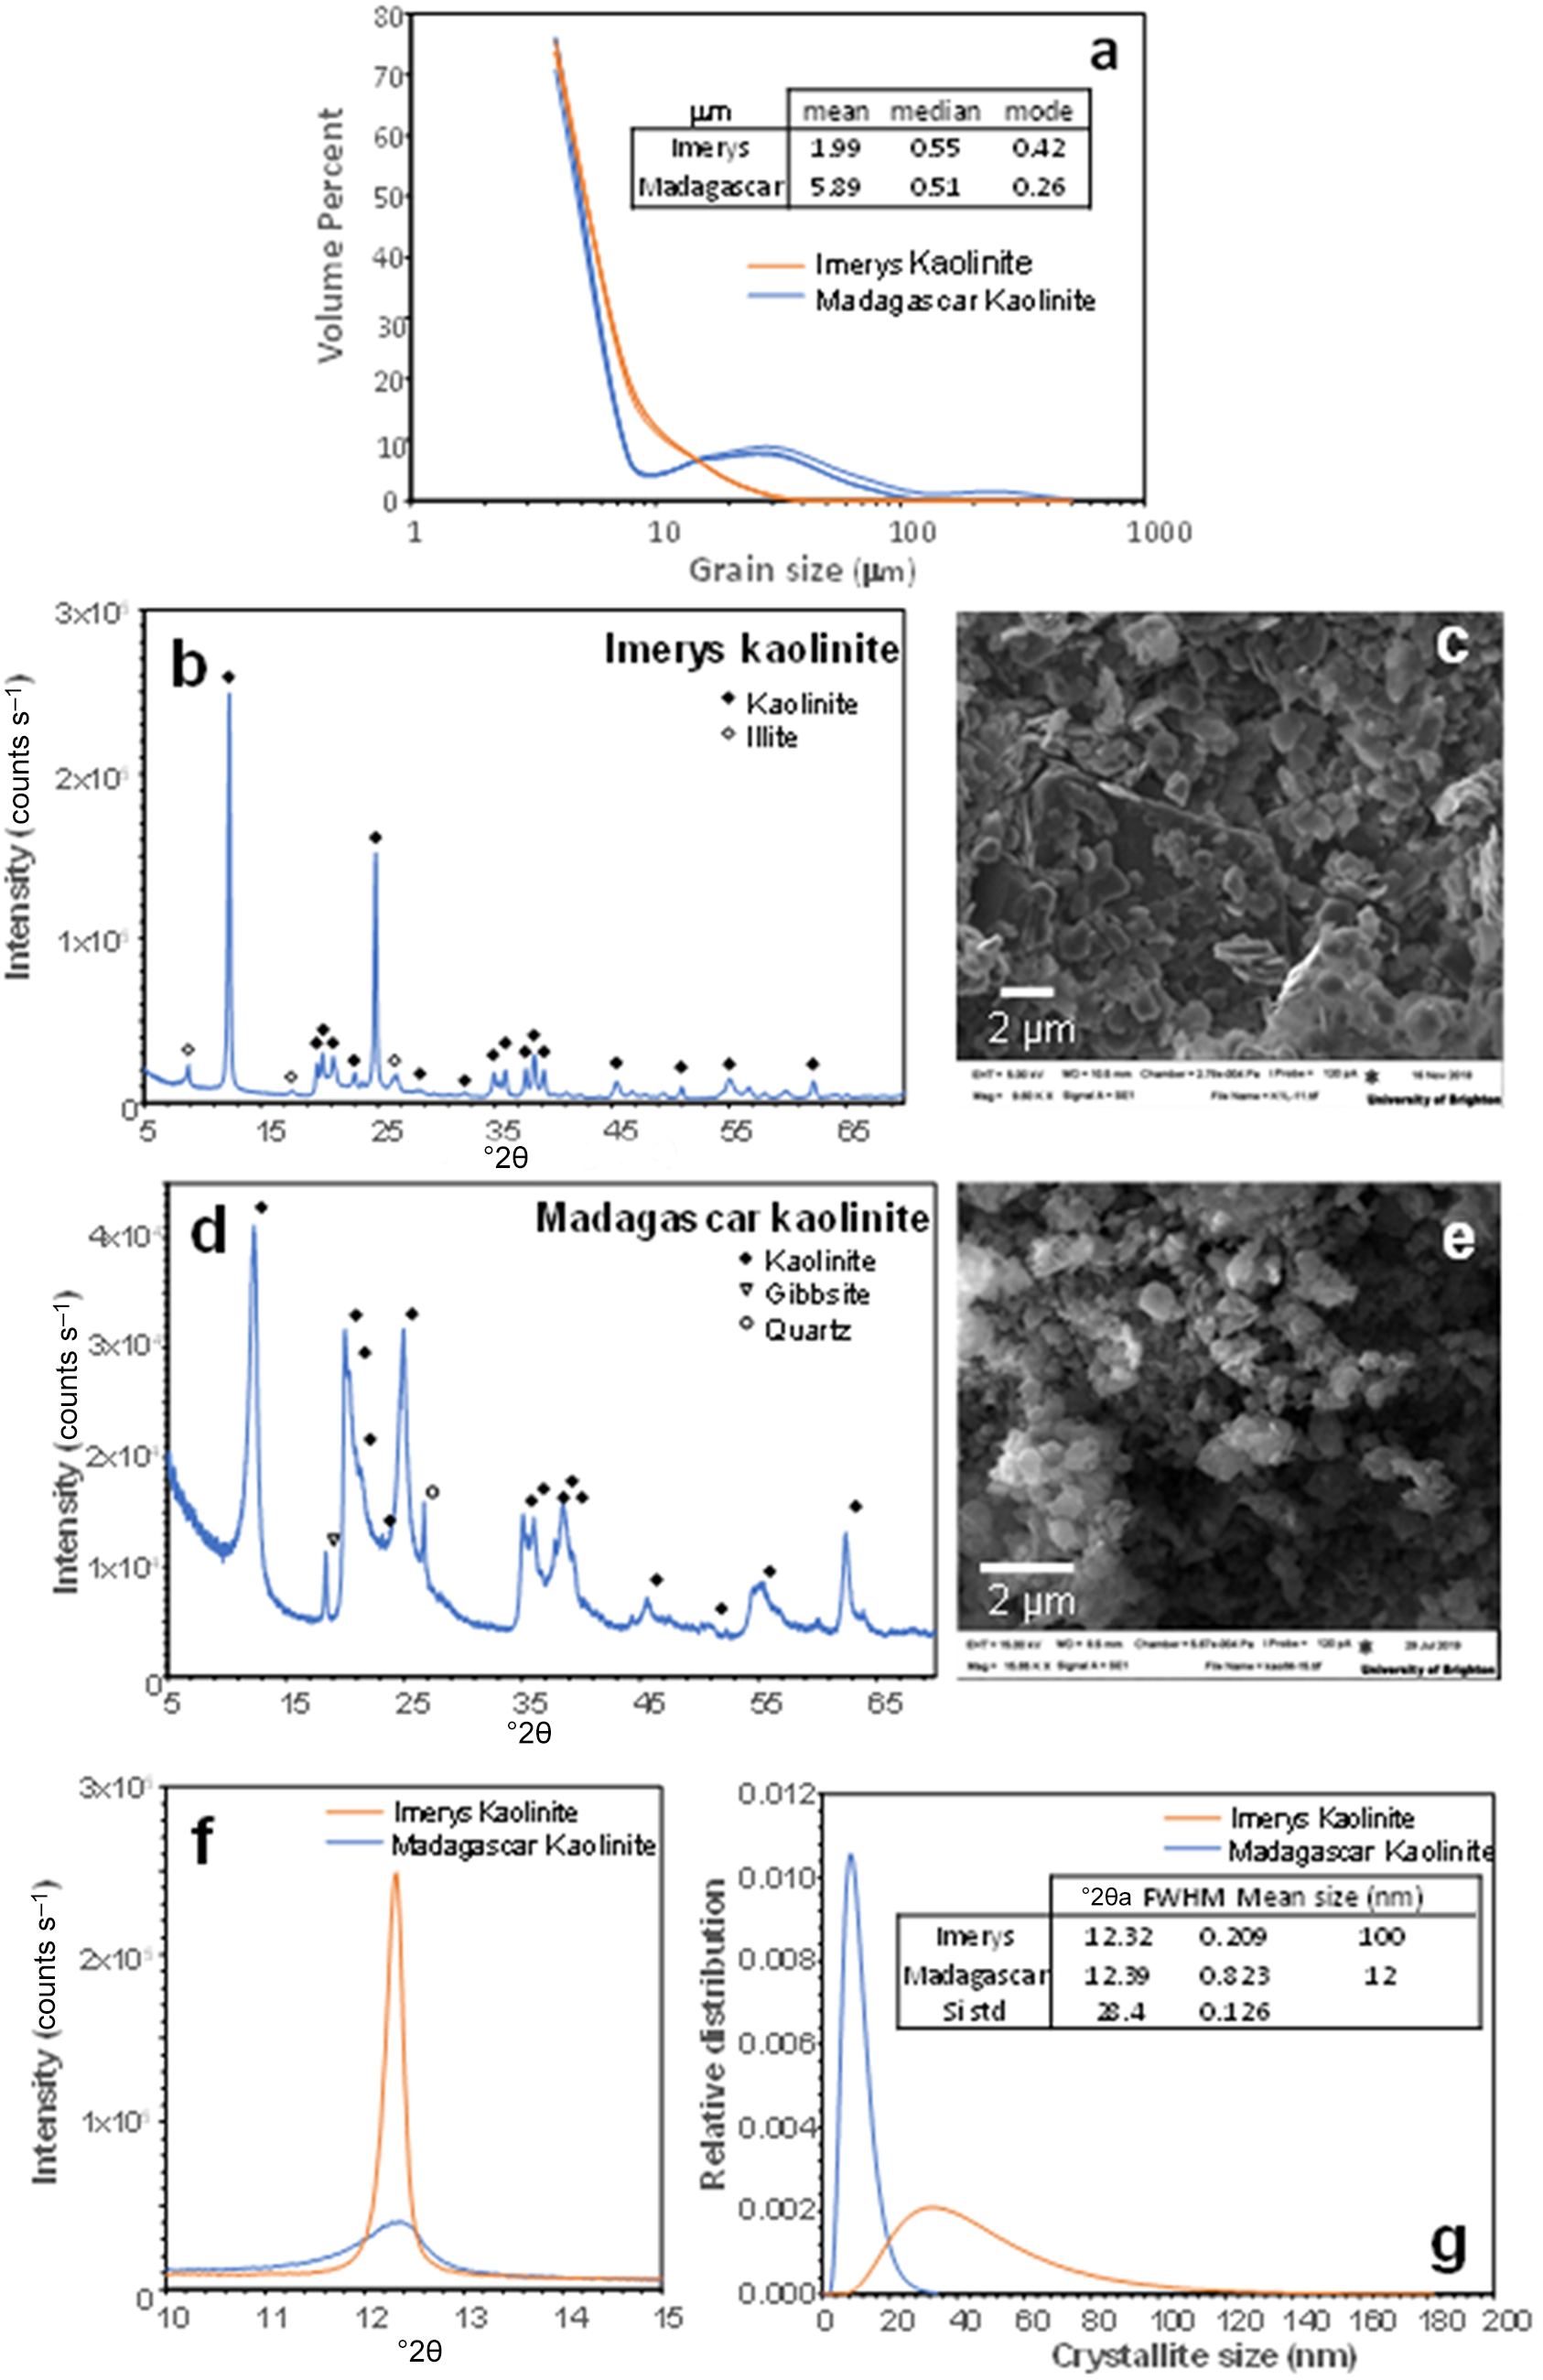
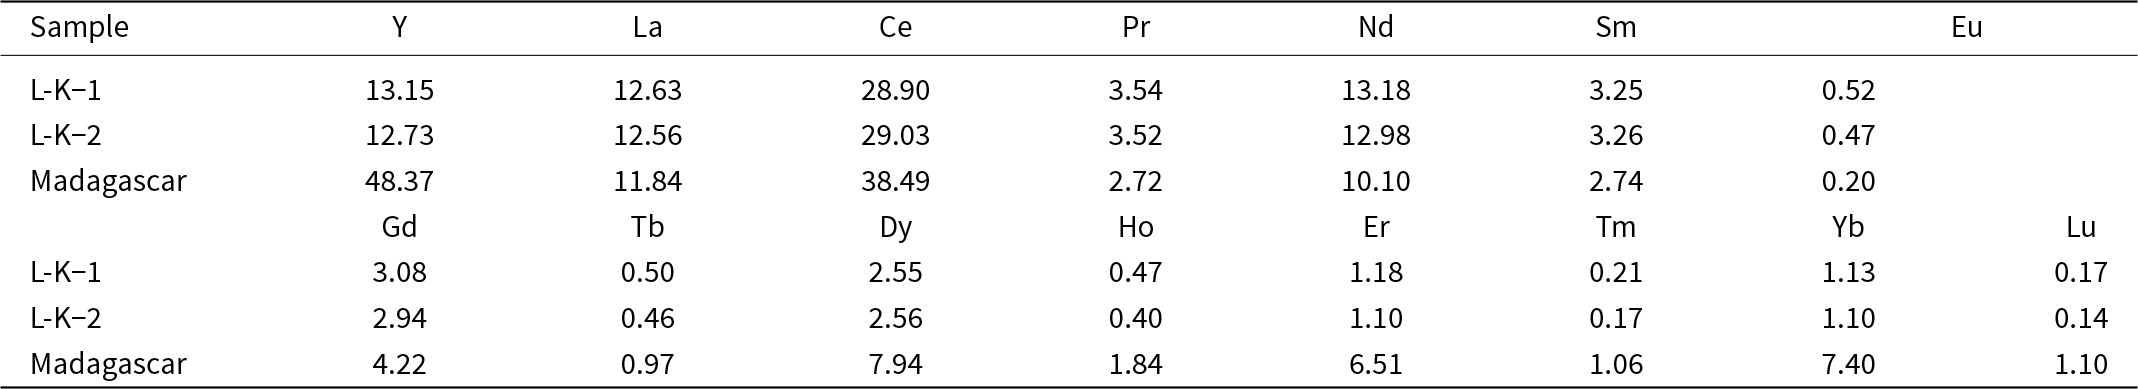
The mean particle sizes determined by laser particle-size analysis for the Imerys and Madagascar kaolins are 1.99 and 5.89 µm, respectively (Fig. 2a). However, the size distribution in the Madagascar sample is bimodal, with ∼10% of particles being up to 30 µm. The modal grain sizes are 0.42 µm for Imerys and 0.26 µm for Madagascar (Fig. 2a). These are likely to represent the kaolinite particle sizes, with the coarser grains in the Madagascar sample representing quartz due to imperfect separation in the centrifuge. PXRD revealed that the Imerys sample has minor illite impurities (Fig. 2b,c) and that the Madagascar sample contains minor quartz and gibbsite (Fig. 2d,e). Semi-quantitative estimates of phase proportions using the reference intensity ratio (RIR) method indicate 94.2% kaolinite, 2.5% gibbsite and 3.3% quartz in the Madagascar sample and 95.2% kaolinite and 4.8% illite in the Imerys sample. This is coherent with the observations under secondary electron (SE) SEM in which the starting material consists of similar-sized kaolinite plates, frequently aggregated (Fig. 2c,e). Previous studies of Ln adsorption on illite (Sinitsyn et al., Reference Sinitsyn, Aja, Kulik and Wood2000) show several orders of magnitude lower Kd values than for kaolinite (Coppin et al., Reference Coppin, Berger, Bauer, Castet and Loubet2002). Illite is therefore expected to have minimal impact on the experimental results here. Gibbsite may be an effective sorbent for the REE (Zhang et al., Reference Zhang, Wang, Zhao, Cui, Zhang and Wang2023), but adsorption increases with pH, so at the low proportion of gibbsite present in the Madagascar sample, and the low pH of most experiments, the influence of gibbsite in the experiments is likely to be minimal. The crystallinity of the kaolinites has been assessed from the full width at half maximum peak diameter of the kaolinite 12°2θ (7 Å) peak (Fig. 2f). Assuming a log normal distribution and no lattice strain, this indicates a sub-grain crystallite size of 100 nm in the Imerys kaolin and of 12 nm in the Madagascar kaolin. The Madagascar kaolinite has a significantly lower crystallinity than the Imerys kaolinite. The chemical composition obtained by ICP-MS of the Imerys kaolin yields 29 ppm Ce; 13 ppm Y, La and Nd; 2–4 ppm Pr, Sm, Gd and Dy; and Eu, Tb, Ho, Er, Tm, Yb and Lu are approximately or less than 1 ppm. In the Madagascar kaolinite these values are 38 ppm Ce; 48 ppm Y, 12 ppm La and Nd; 2–8 ppm Pr, Sm, Gd and Dy; and 0.2–6.5 ppm Eu, Tb, Ho, Er, Tm, Yb and Lu (Table 2). The mass LOI measured was 11.16 wt.%.
Starting material used for the experiments: (a) laser particle-size analysis of the grain size in the two kaolinite samples used; (b) PXRD diffractogram of the Imerys kaolinite; (c) backscattered electron image of the Imerys kaolinite; (d) PXRD diffractogram of the Madagascar kaolinite; (e) BSE image of the Madagascar kaolinite; (f) close-up of the 10 Å reflection in the PXRD diffractograms; (g) crystallite size comparison of both kaolinites assuming a log-normal distribution. FWHM = full width at half maximum.
Chemical composition of the kaolinite powders used in the experiments obtained by ICP-MS (in μg kg–1).

Source: Data from Estrade et al. (Reference Estrade, Marquis, Smith, Goodenough and Nason2019).
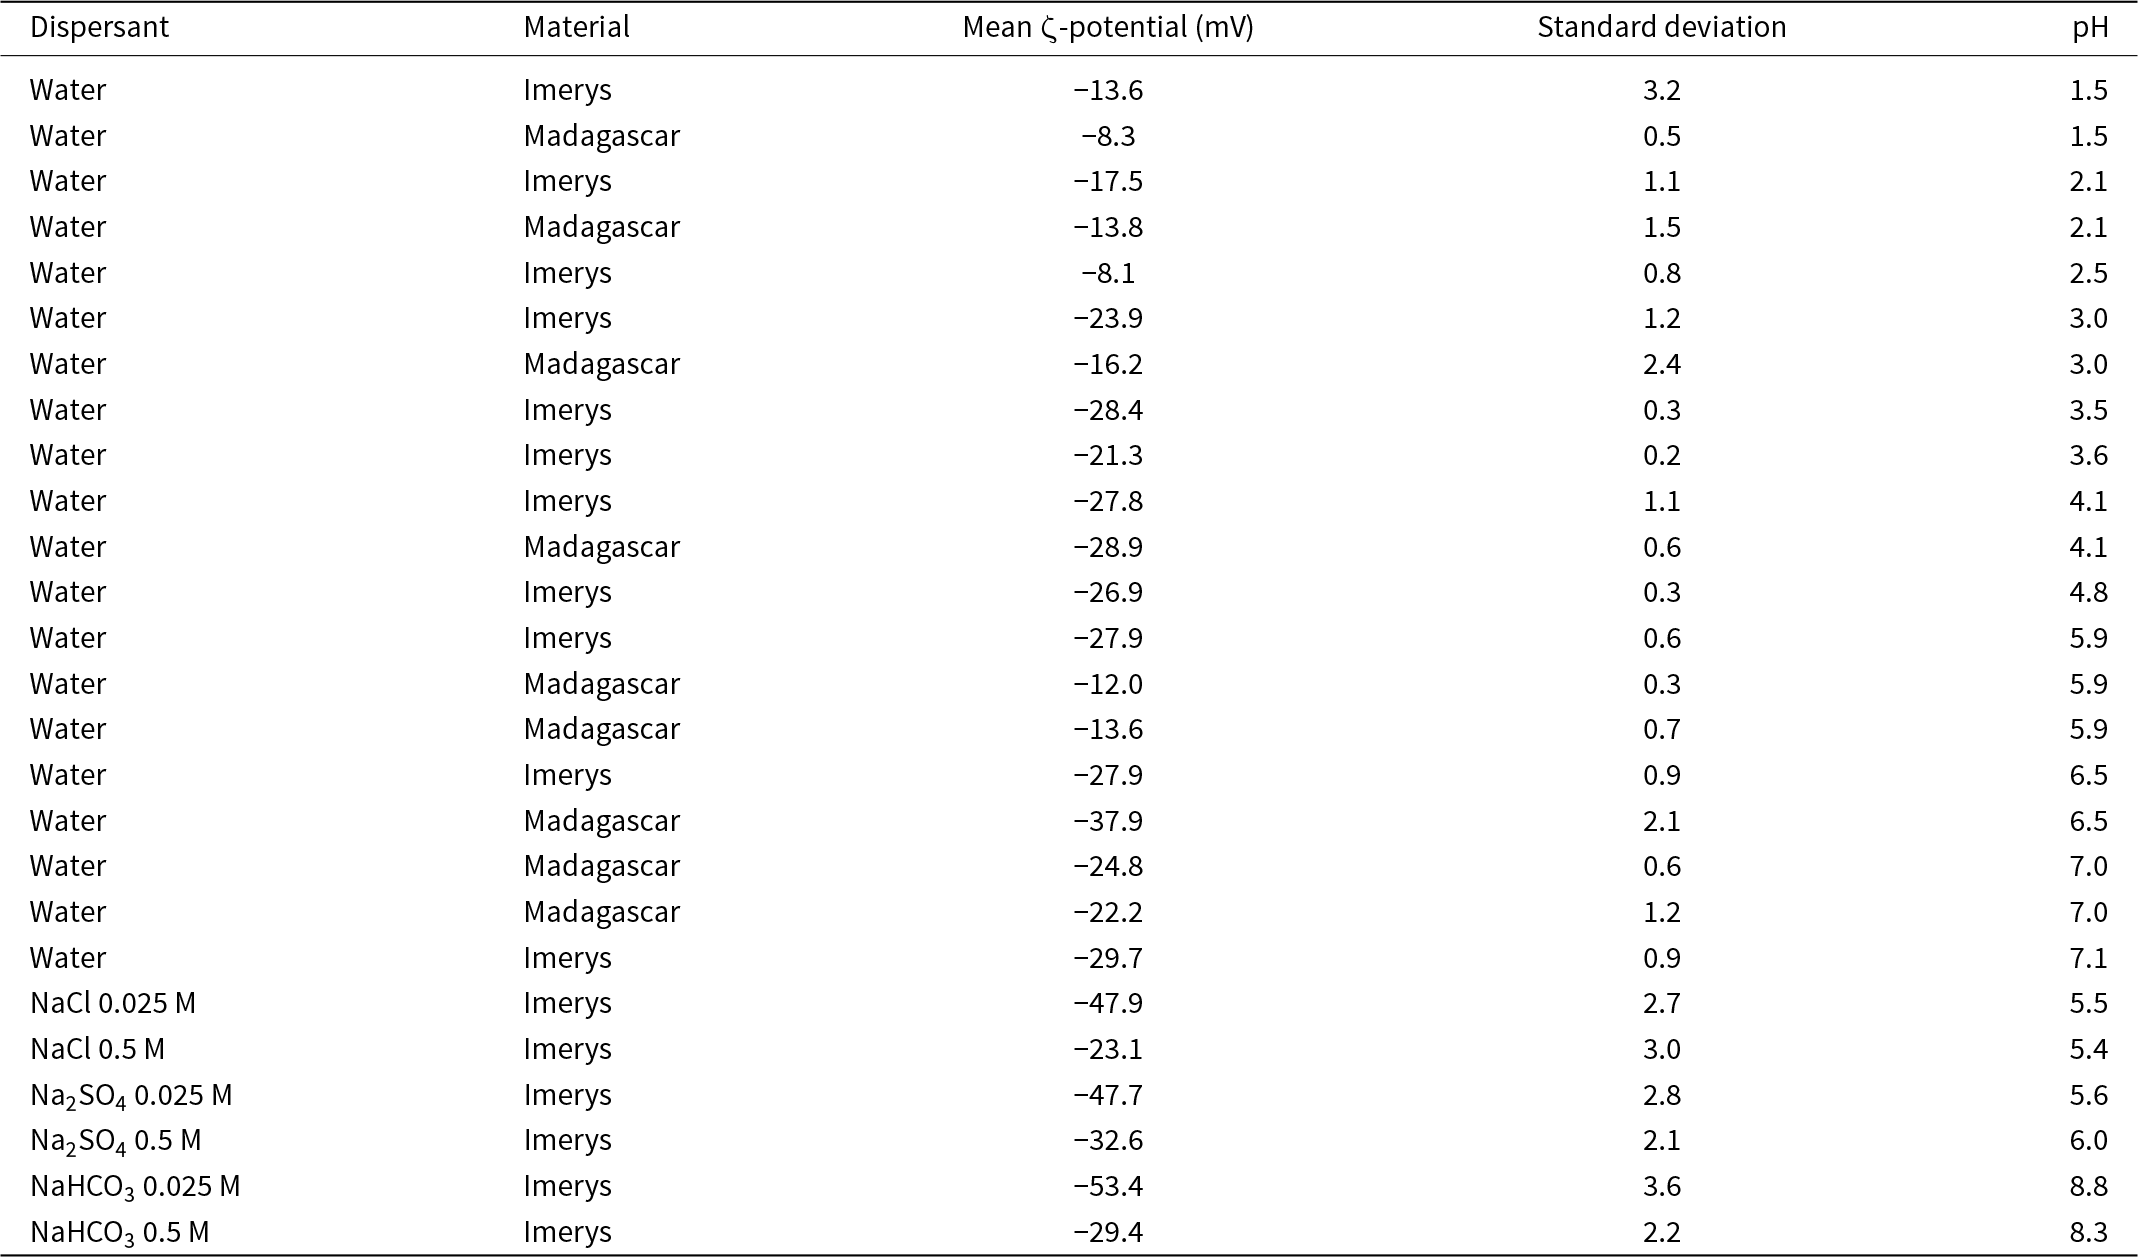
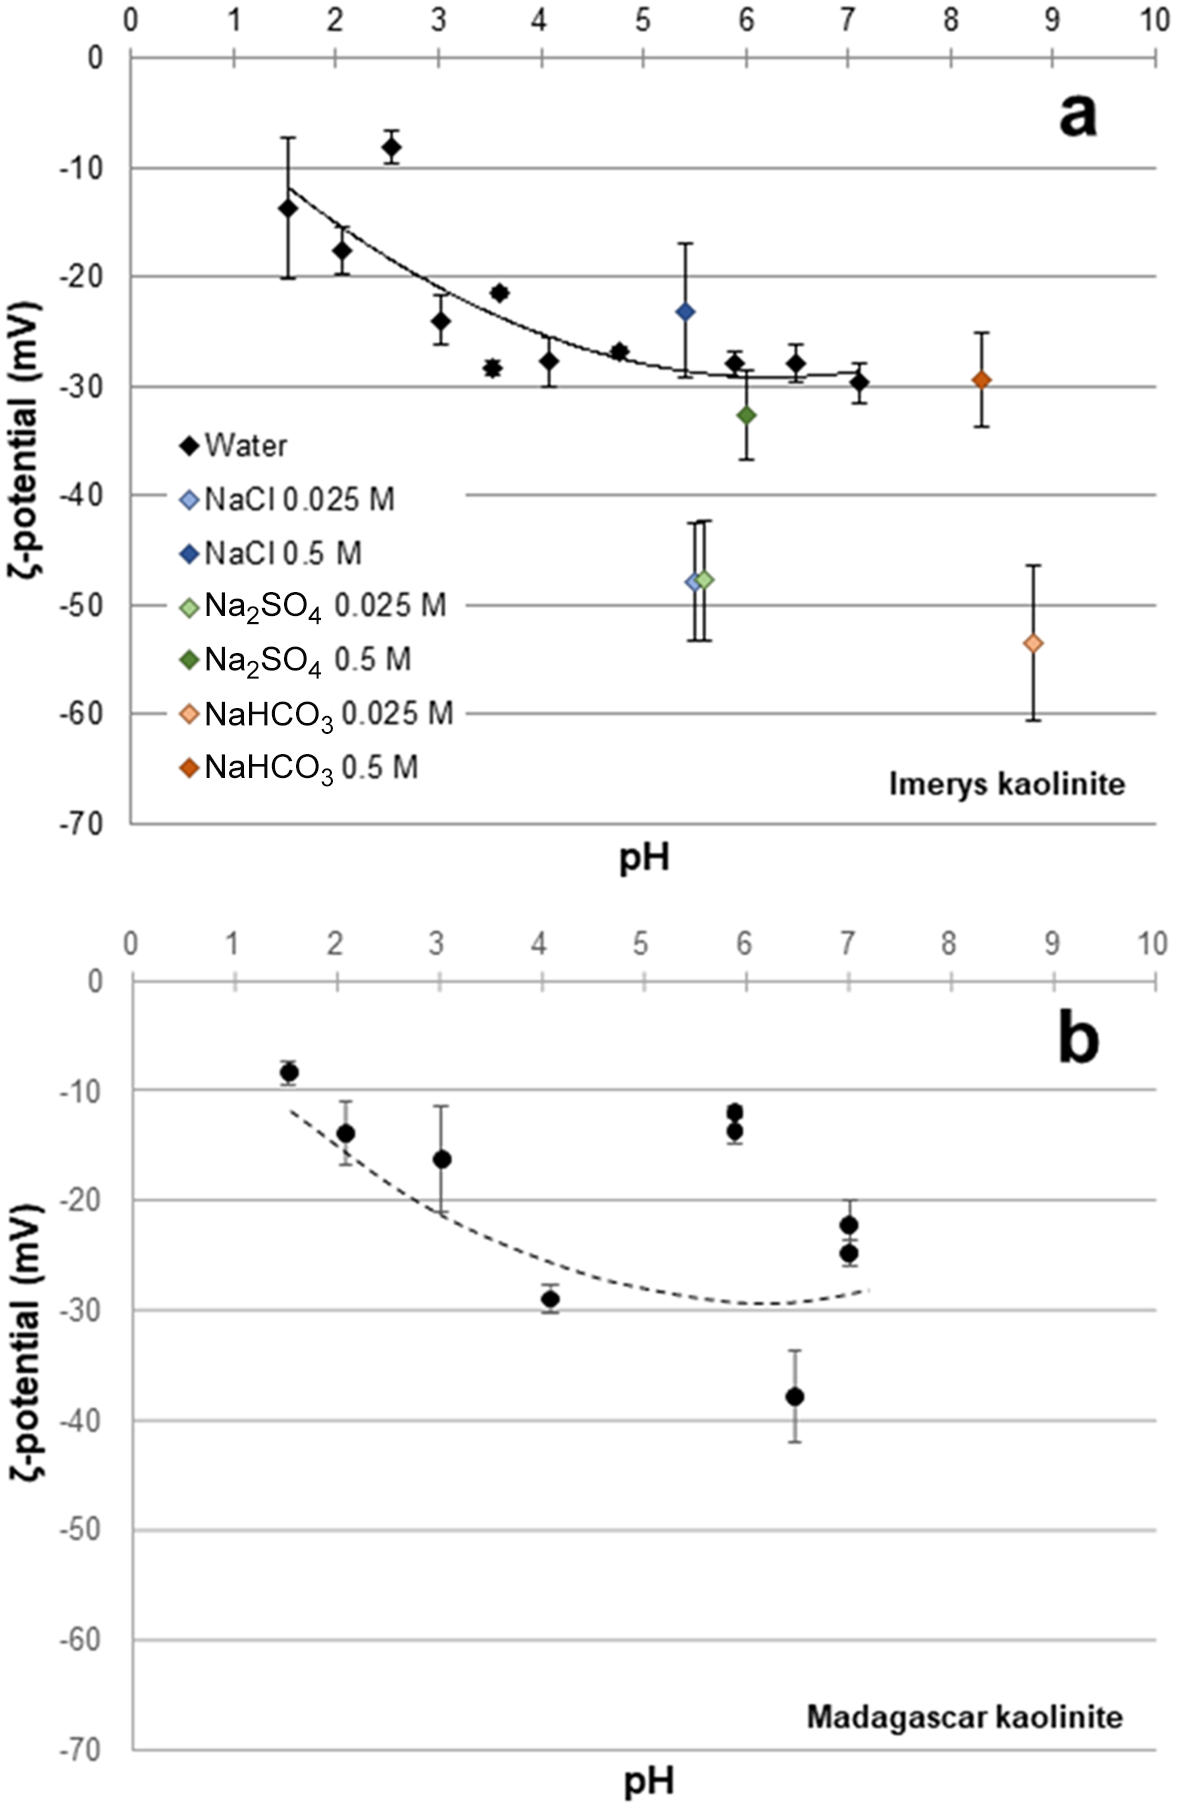
Because of limited material from the Madagascar sample, application of a full range of surface characterisation techniques (reactive surface area, surface charge density) was not possible. We therefore measured the mean ζ-potential to allow quantitative comparison of the surface properties of the two samples alongside laser particle-size analysis. The ζ-potential is directly related to the surface potential if the thickness of the Stern layer is known, and hence to surface charge density in a specified electrolyte via the Grahame equation (Grahame, Reference D.C1953; Israelachvili, Reference Israelachvili2011). The ζ-potential of the starting material in dilute nitric acid ranges from –15 mV at pH 1.5 to –30 mV at pH 7.1 (Fig. 3a & Table 3), and it is consistently within this range in 0.5 M solutions. In low-I solutions the ζ-potential is lower (–48 mV in NaCl and Na2SO4 and –53 mV in NaHCO3) than in high-I solutions (–24 mV in NaCl, –33 mV in Na2SO4 and –29 mV in NaHCO3; Fig. 3a & Table 3), which is consistent with the reduced concentration of counterions (Na+) at the kaolinite surface (Grahame, Reference D.C1953; Israelachvili, Reference Israelachvili2011). In the nitric acid-buffered samples there is no significant difference in ζ-potential between the Imerys and Madagascar kaolinite (Fig. 3b), indicating no significant difference in surface charge density. The results are consistent with previous determinations of kaolinite surface charge density that indicate a negative surface charge from pH 1.2 to 2.0, with a plateau in charge density from pH ≈ 3 (Bolland et al., Reference Bolland, Posner and Quirk1980).
ζ-potential vs pH of the starting material in water at various pH values and in the NaCl, Na2SO4 and NaHCO3 solutions used in the experiments (see Table 3): (a) Imerys kaolinite; (b) Madagascar kaolinite. The dashed line in (b) is the Imerys fit shown in (a).

ζ-potentials of the starting materials in water at various pH values and in the NaCl, Na2SO4 and NaHCO3 solutions used in the experiments.
Predicted speciation in experimental solutions
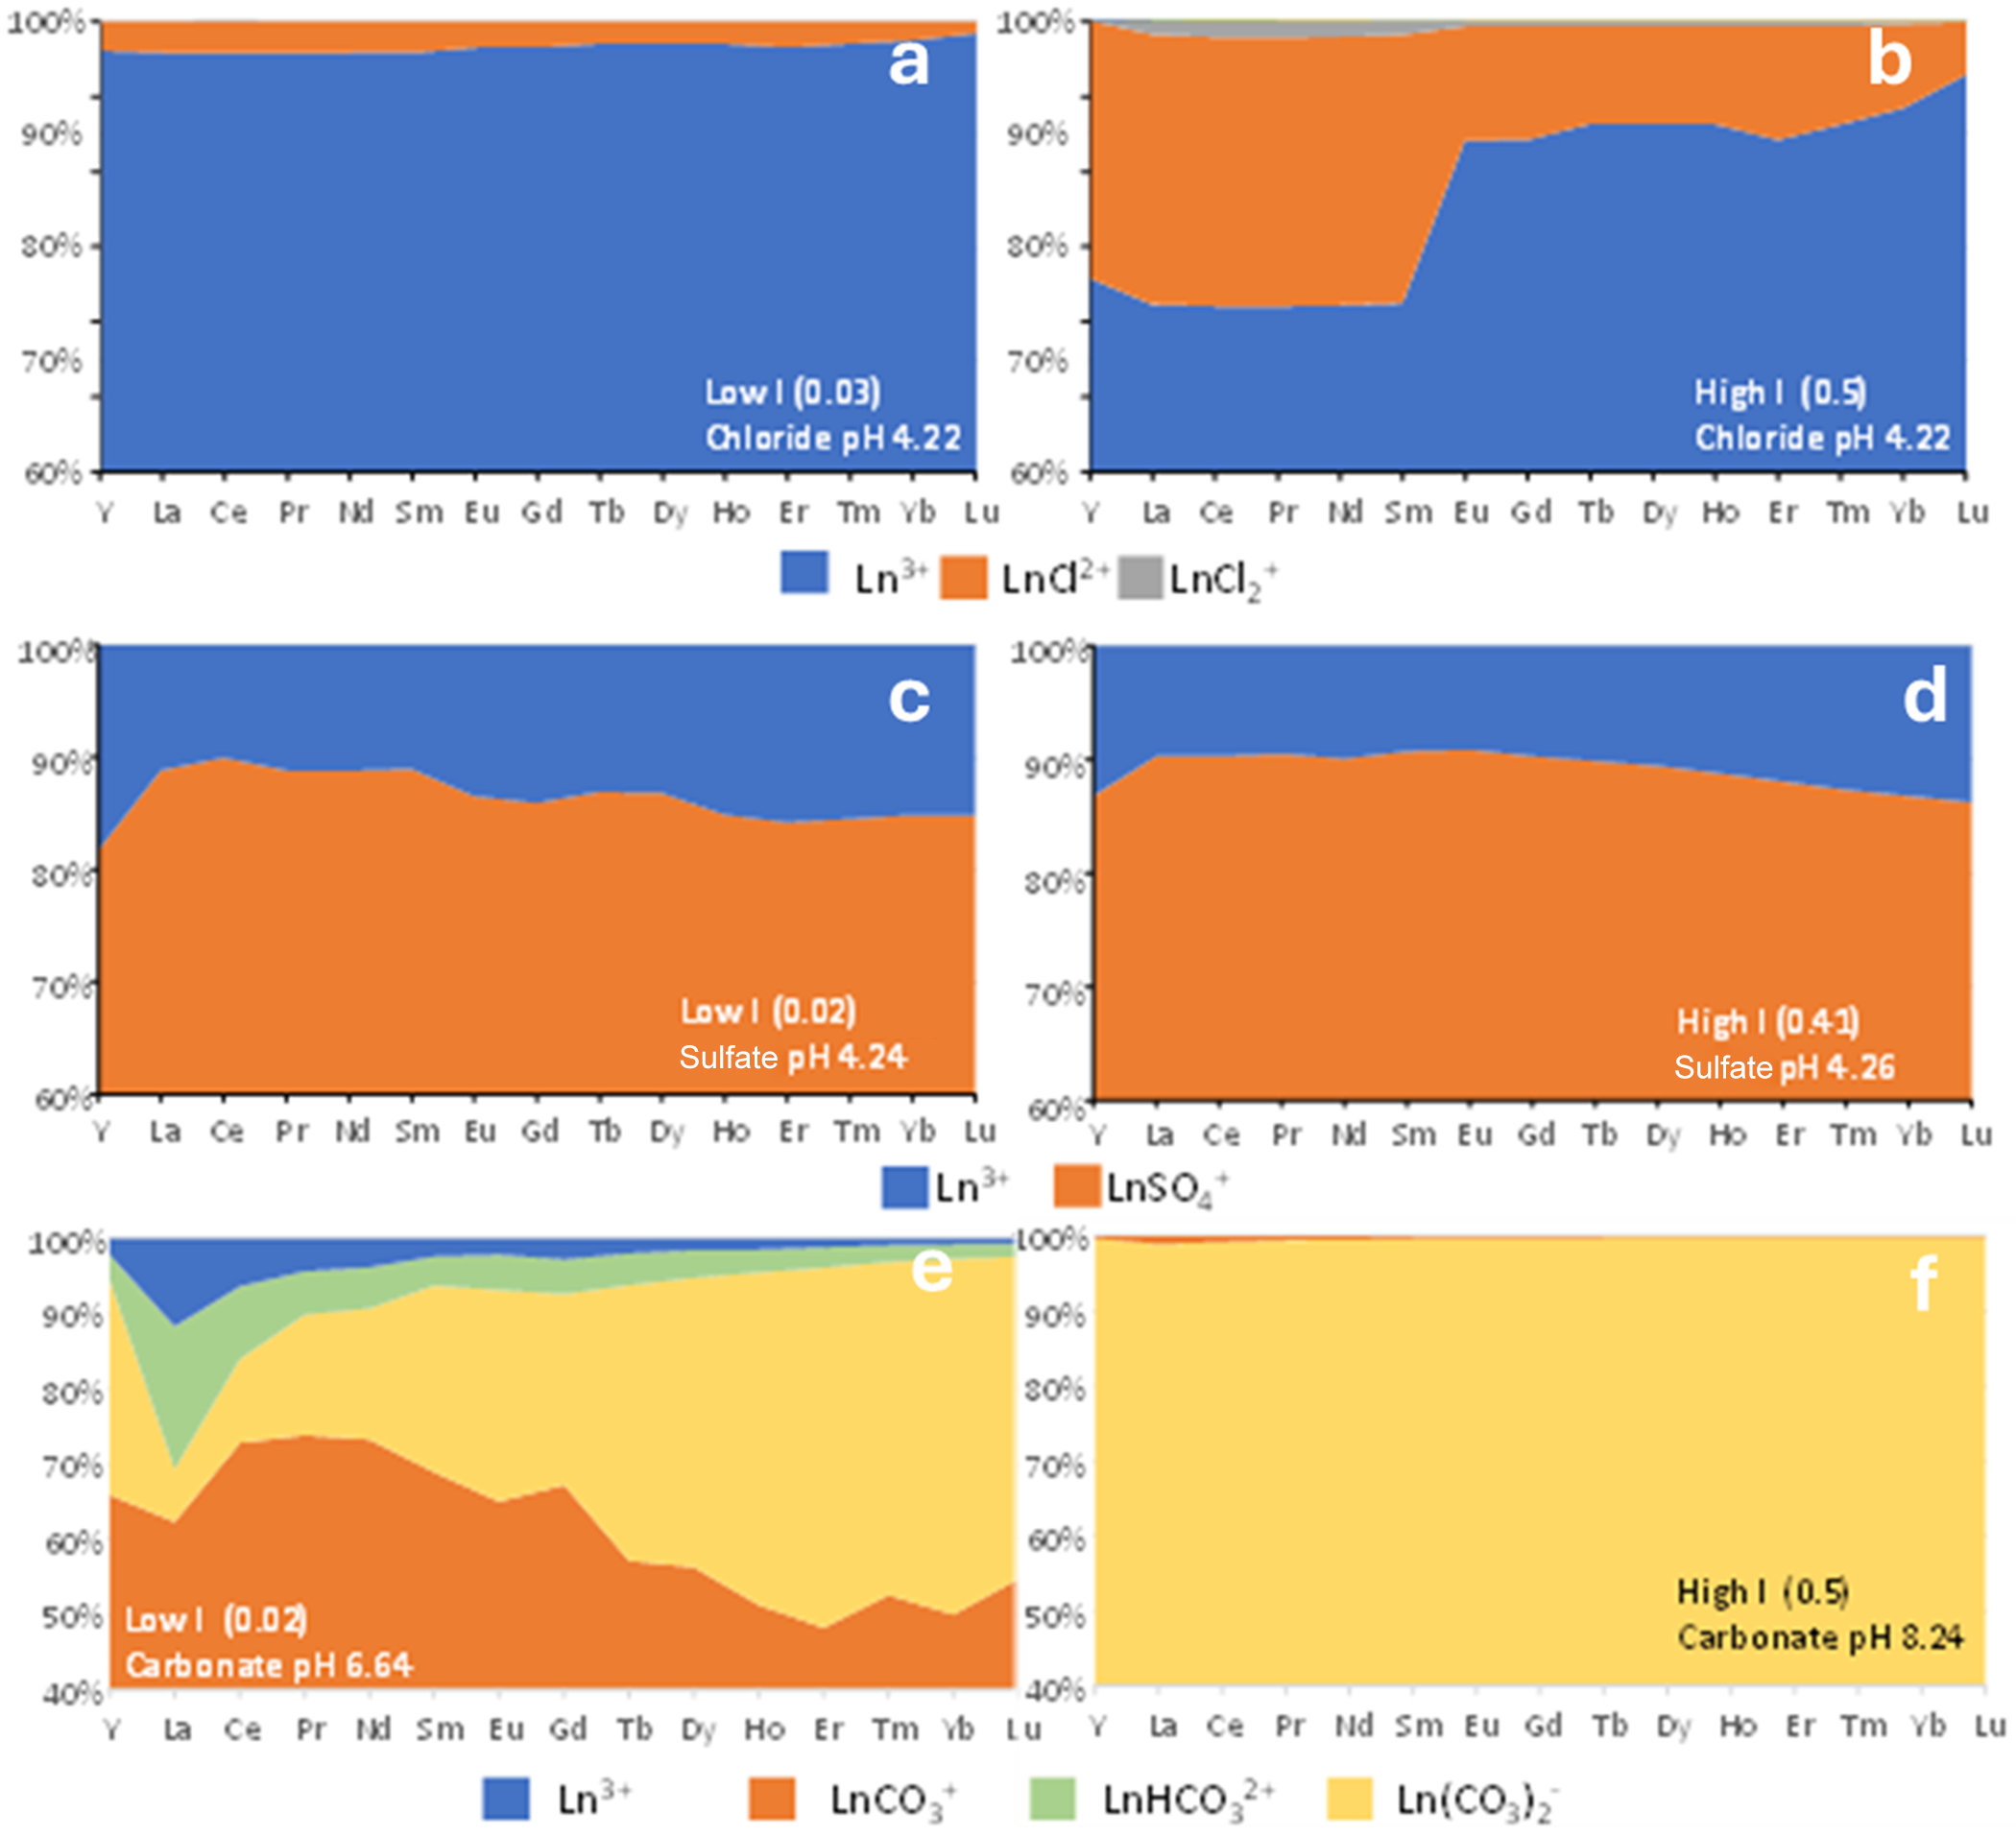
The results of the speciation calculations are shown in Fig. 4. For experiments in dilute nitric acid (‘water’) at all pH values, all REE are predicted to be dominantly (>99.9%) present as the free Ln ion (Ln3+), and so these data are not shown in Fig. 4. For chloride-bearing solutions at low ionic strength, at pH 2–6 all REE are predicted to be present as ∼97% Ln3+(aq), with the remainder present as LnCl2+(aq) (Fig. 4a). At high ionic strength, for the LREE (La–Sm), formation of LnCl2+(aq) is predicted to account for ∼25% of the REE, and for the HREE (Eu–Lu) it is predicted to account for ∼8–10% (Fig. 4b). The results are consistent across the pH range of the experiments, so only the results for pH 4.22 are shown in Fig. 4. For sulphate, a high proportion of the dissolved REE are predicted to be present as complex ions. At low I, 80–85% of the REE are predicted to be present as LnSO4+ (Fig. 4c), and at high I, 86–90% are present as LnSO4+ (Fig. 4d). The remainder is dominantly Ln3+. There is no strong preferential formation of sulphate complexes with increasing atomic number, although there is a slight preference for LREE complexes compared to HREE complexes. The results for sulphate are semiquantitative as a result of the lack of disulphate complexes in the database, as noted earlier.
Speciation of the REE with various ligands (Cl–, SO42–, CO32–) with low and high ionic strengths (0.02–0.03 M and 0.41–0.50 M, respectively) at the pH of the performed experiments (obtained with PHREEQC® v. 3 software; Parkhurst & Appelo, Reference Parkhurst and C.A.J2013).

For carbonate-bearing solutions at low I, speciation is predicted to be dominated by LnCO3+, ranging from ∼70% of the solution load (Ce(CO3)+) to ∼50% (Lu(CO3)+). The remainder is made up of Ln(CO3)2– complexes, Ln(HCO3)2+ complexes and a small amount of the free ion (11% for La3+ to 0.7% for Lu3+; Fig. 4e). At high ionic strength, Ln(CO3)2– complexes are predicted to dominate for all REE (Fig. 4f). The ionic strength of the solution is modified slightly relative to the stoichiometry of NaHCO3 by the formation of NaHCO30 and NaCO3– complex ions to give an ionic strength of 0.46 M. Lanthanite (Ln2(CO3)3.8H2O) is predicted to be close to saturation for La–Sm. However, there is no evidence for LREE carbonate precipitation in the experimental data for carbonate solutions (see ‘Influence of ligands and ionic strength’ section later). This could relate to the lack of a solid solution model for REE mineral phases, to kinetic hindrance for precipitation at low degrees of supersaturation (Price et al. (Reference Price, Butler, Ngwenya, Kirstein, McDermott and O’Neill2023) noted a delay in nucleation of mixed lanthanite-(La,Nd) compared to pure lanthanite-(La)) or to inaccuracies in reported equilibrium constants for REE mineral precipitation.
Influence of pH
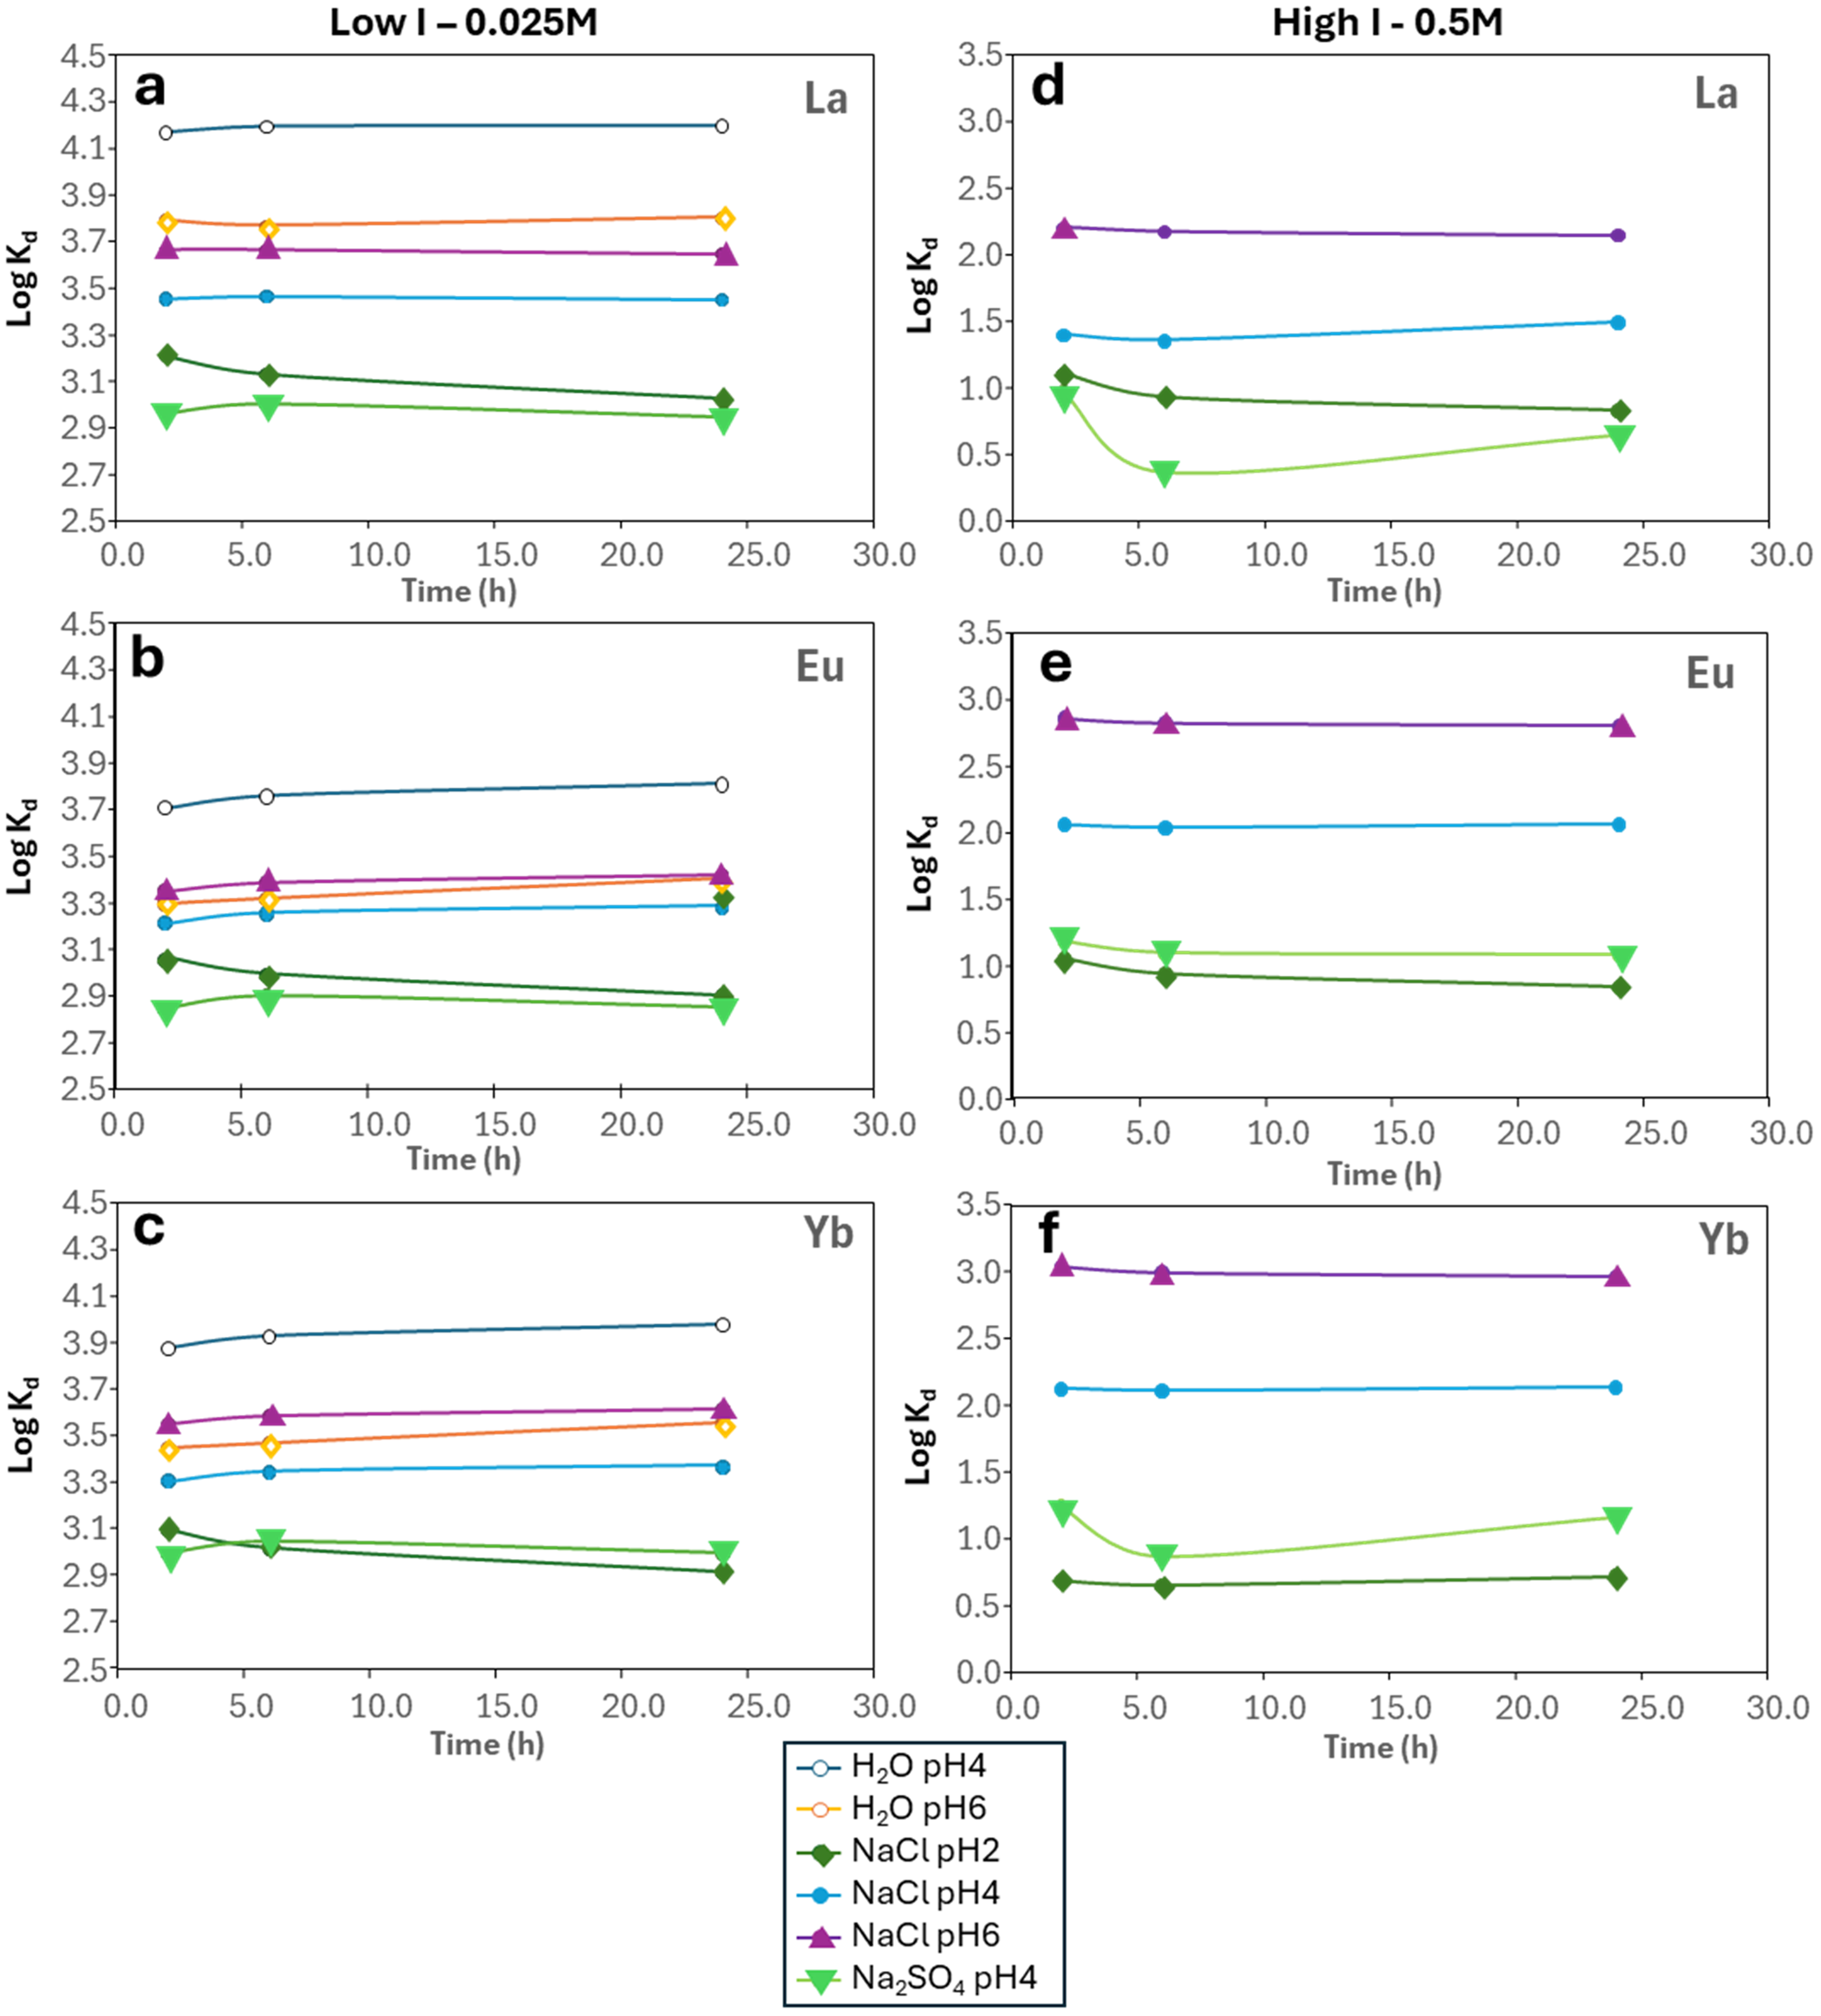
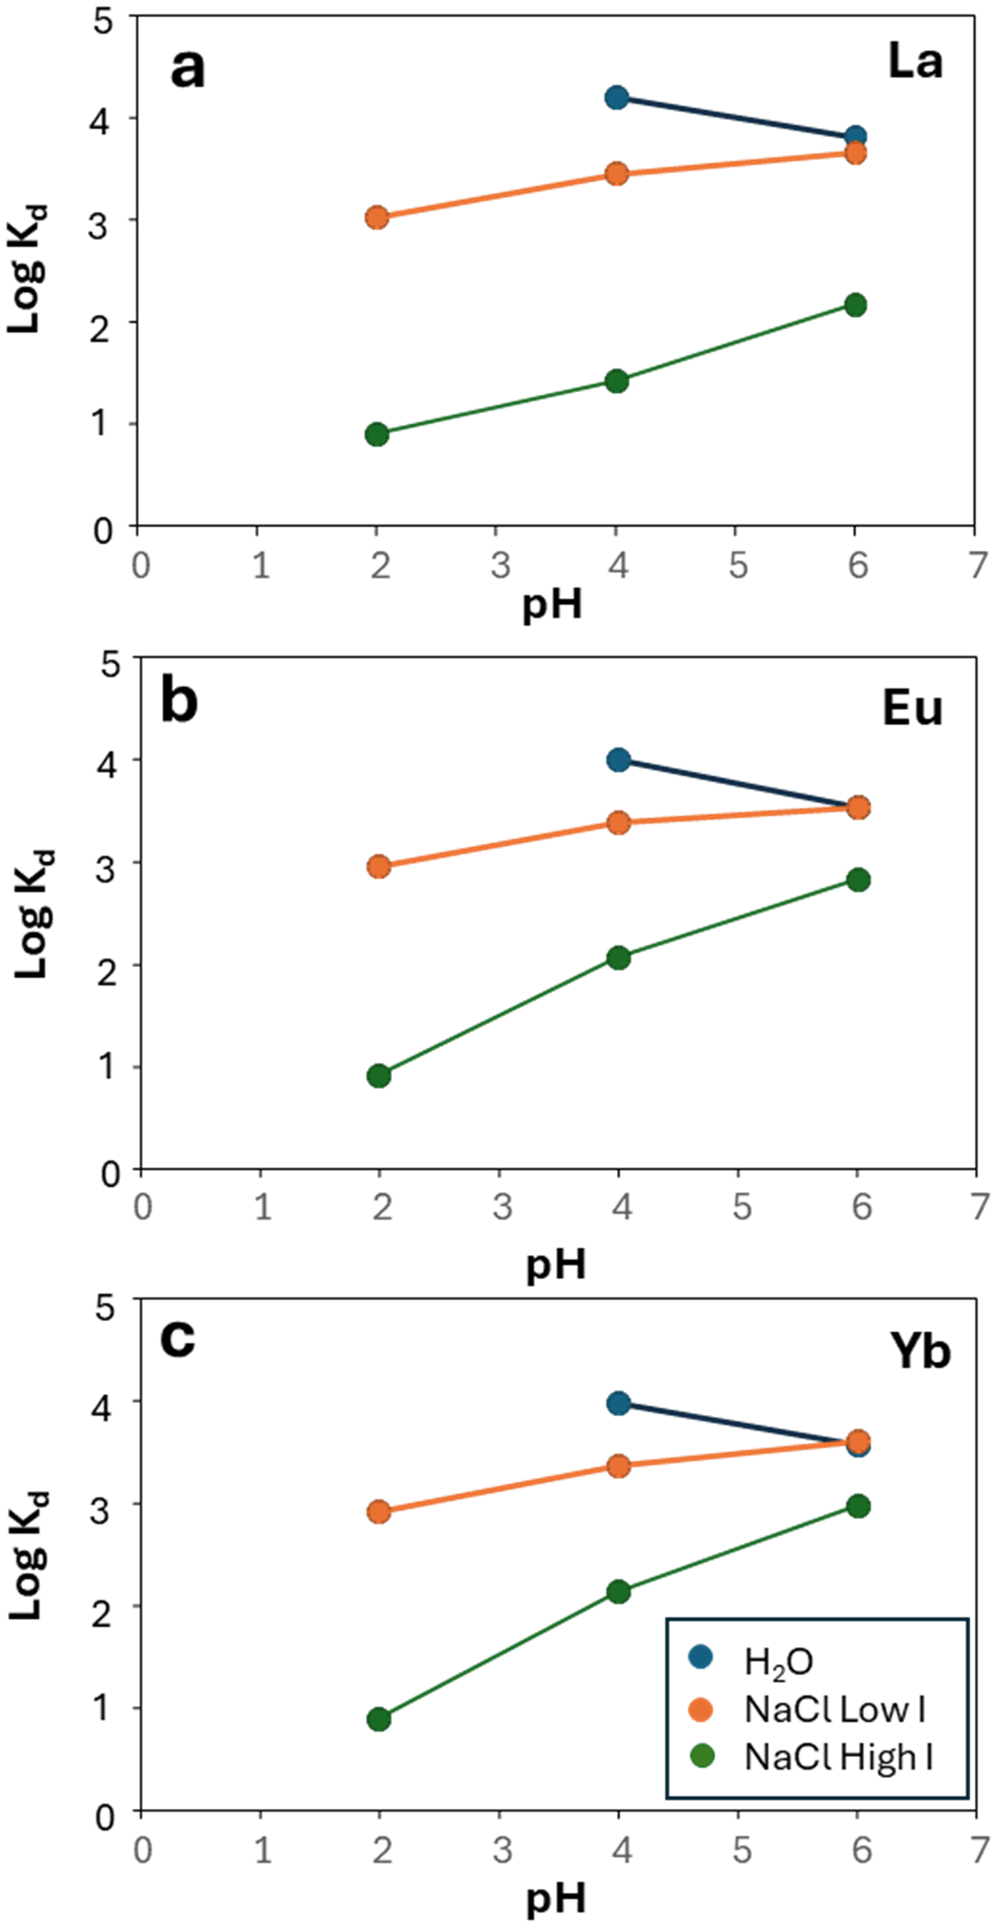
The results of adsorption experiments at varying pH in nitric acid solution and in the presence of NaCl are shown in Figs 5–7. In general, the adsorption reaction is very quick under these experimental conditions. Significant adsorption was already observed after only 2 h of the experimental run, and it typically reached a maximum by 24 h (Fig. 5). For example, at pH 4.23 in water/dilute nitric acid, the calculated Kd for La ranges from 1.47 × 10⁴ mL g–1 after 2 h to 1.58 × 10⁴ mL g–1 after 24 h (Fig. 5a; https://doi.org/10.17033/DATA.00000338). This was also observed by Coppin et al. (Reference Coppin, Berger, Bauer, Castet and Loubet2002) and Moldoveanu & Papangelakis (Reference Moldoveanu and Papangelakis2012, Reference Moldoveanu and Papangelakis2013). The fast kinetics of REE adsorption onto kaolinite was pointed out by Aja (Reference Aja1998), who found equilibrium to be achieved after only a few minutes, and this is consistent across the LREE, middle REE (MREE) and HREE exemplified by La, Eu and Yb (Fig. 5).
Plots of logKd against experiment time for La, Eu and Yb in low-I (0.025 M) and high-I (0.5 M) solutions.

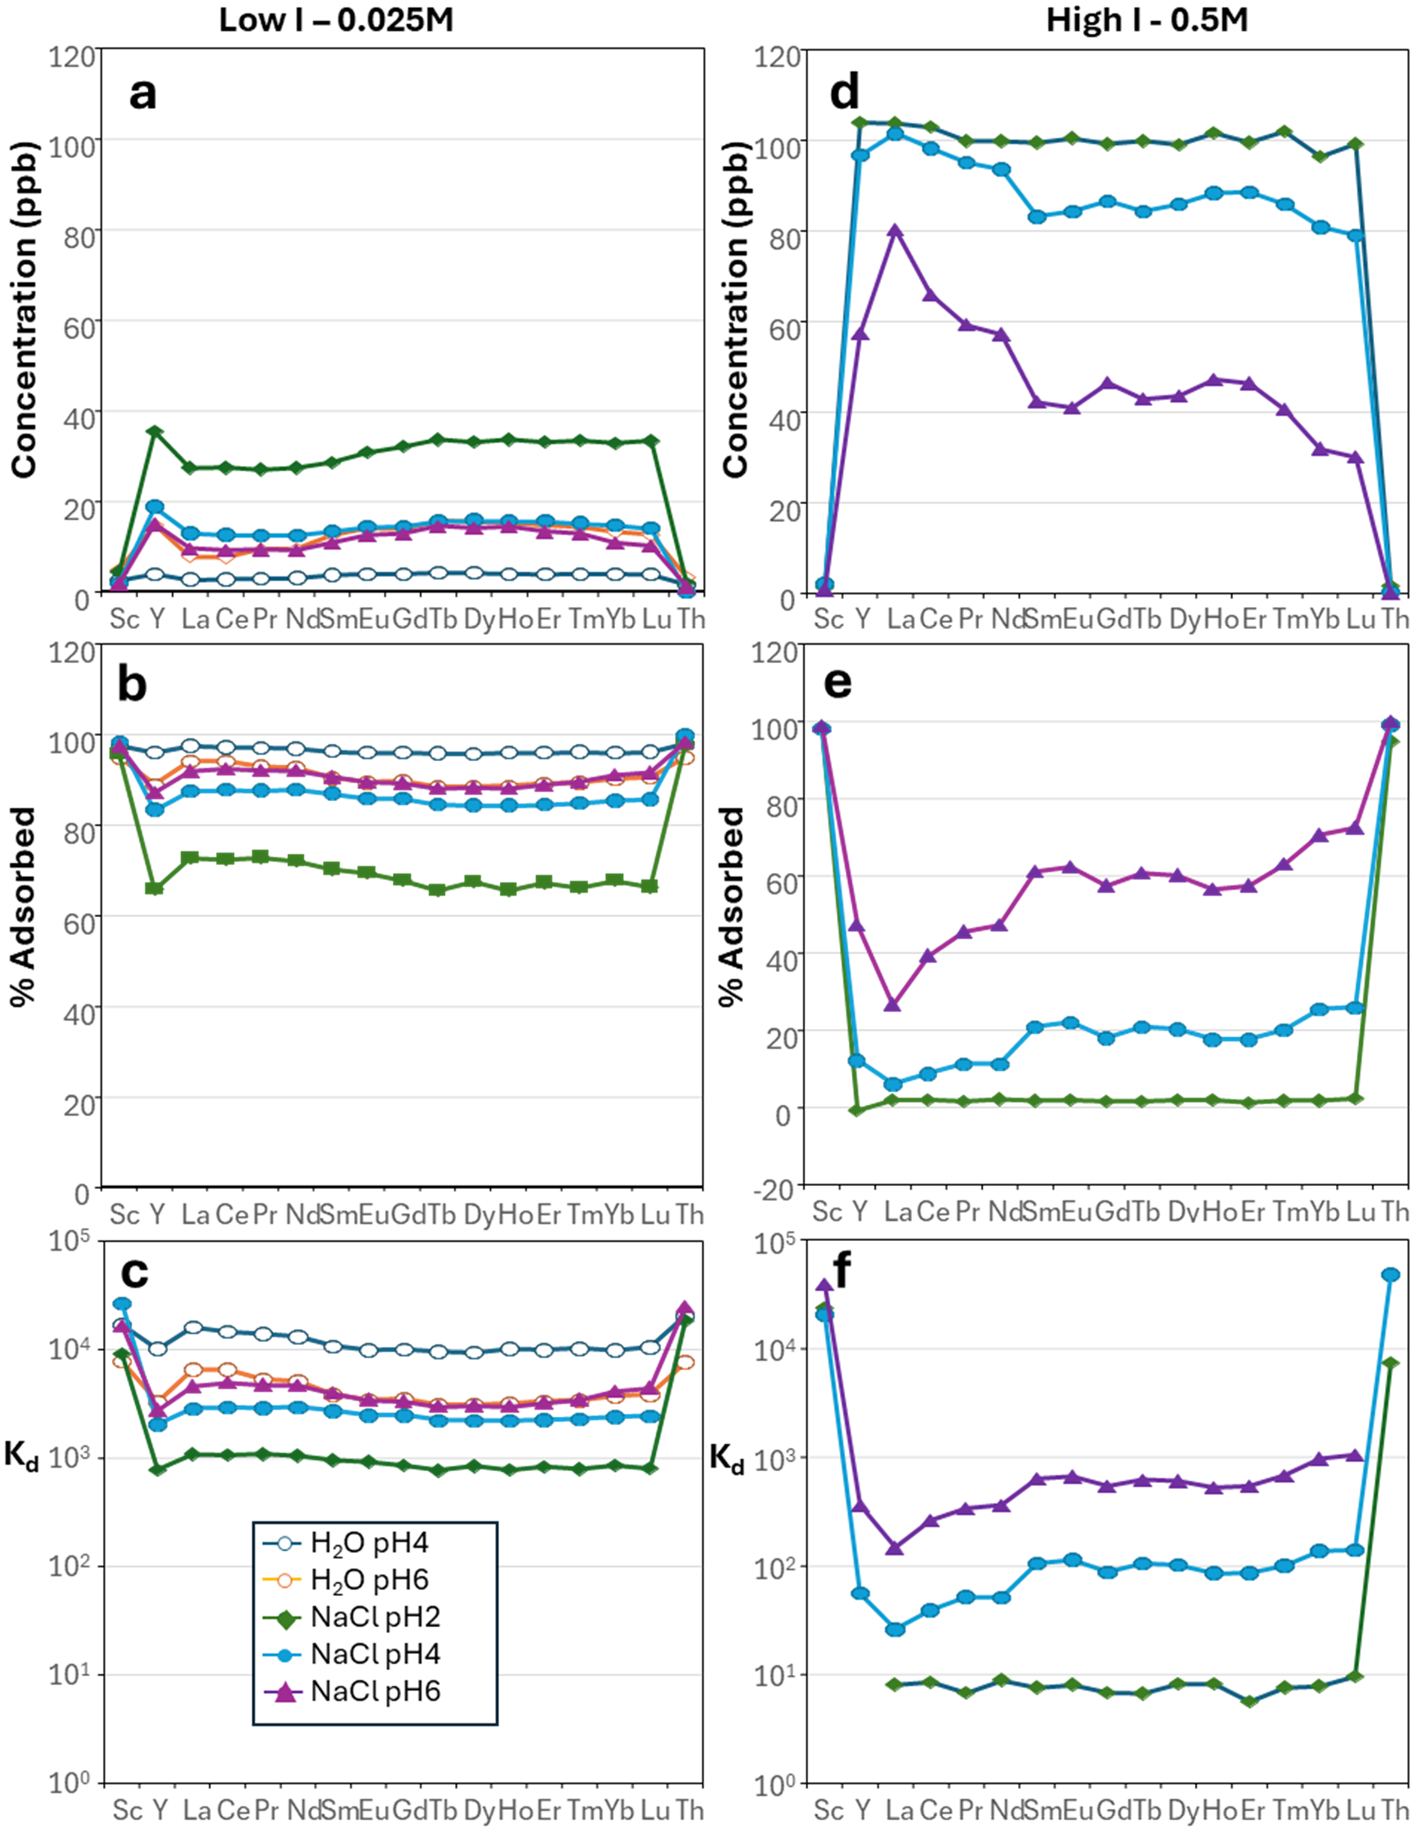
In the experiments with water/dilute nitric acid, REE+Y tend to be more adsorbed onto kaolinite at pH 4 than at pH 6 (Fig. 6a–c). For example, in water/dilute nitric acid, La has a calculated Kd of 6.34 × 10³ mL g–1 at pH 6.05 compared to 1.58 × 10⁴ mL g–1 at pH 4.23 (Fig. 6a). The same is observed in the experiments with NaCl, but adsorption is not inversely correlated with pH, since adsorption is lowest at pH 2 (Fig. 6a). In low-I NaCl solutions, the Kd values for La are 1.05 × 10³ mL g–1 at pH 2.33, 2.82 × 10³ mL g–1 at pH 4.22 and 4.42 × 10³ mL g–1 at pH 6.04, and the trends are consistent across the MREE and HREE (Fig. 6b,c). The adsorption curves of REE+Y are subparallel at different pH values in the same solution type, which suggests that pH does not play a significant role in REE fractionation (Fig. 7 & Supplementary Material S1 & S2). The distinction in Kd between La and Lu is 1.05 × 10³ mL g–1 and 7.73 × 10² mL g–1 at pH 2 and 4.42 × 10³ mL g–1 and 4.36 × 10³ mL g–1 at pH 6 (Fig. 7e & Supplementary Material S1 & S2). Furthermore, across all of the experiments performed, Sc and Th are always found in very low concentrations in the output solution, indicating that they tend to be more adsorbed onto kaolinite than REE+Y (Fig. 7 & Supplementary Material S1–S4).
Plots of logKd against pH for La, Eu and Yb in low-I (0.025 M) and high-I (0.5 M) solutions.

Plots showing the results of the experiments with (a–c) water and low-I NaCl solutions and (d–f) water and high-I NaCl solutions: (a & d) REE concentrations (in ppb), (b & e) proportions of adsorbed element (with respect to the initial concentration introduced into the solution and (c & f) Kd values.

At all pH values, in both water/dilute nitric and in NaCl bearing solutions, there is no evidence for addition of REE or Al from kaolinite dissolution. This is in keeping with the results of Carroll & Walter (Reference Carroll and Walther1990), who showed no significant differences in kaolinite dissolution rates from pH 2 to 8 at 25°C and increased dissolution rates only above pH 8, as well as those of Ganor et al. (Reference Ganor, Mogollón and Lasaga1995), who showed that the kaolinite dissolution rate at 25°C was independent of pH from pH 2 to 3 and only varied from log rate –12.1 mole m–2 s–1 to –12.6 mole m–2 s–1 from pH 3.0 to 4.2.
Influence of ligands and ionic strength
The most effective solution at promoting adsorption of REE+Y is the one with only water/dilute nitric acid (Kd from 6.34 × 10³ mL g–1 to 3.74 × 10³ mL g–1 from La to Lu at pH 6) and that with NaCl at low I (0.025 M; Kd from 4.42 × 10³ mL g–1 to 4.36 × 10³ mL g–1 from La to Lu at pH 6; Fig. 7a–c & Supplementary Material S1 & S2), whereas the one with high-I NaCl (0.5 M) shows reduced adsorption (Kd from 8.99 × 101 mL g–1 to 8.75 × 10² mL g–1 from La to Lu at pH 6), in common with the other two ligands, especially at acidic pH (Figs 7d–f & Supplementary Material S1 & S2). Interestingly, a mild tetrad effect can be observed in Fig. 7b,d (Supplementary Material S1 & S2).
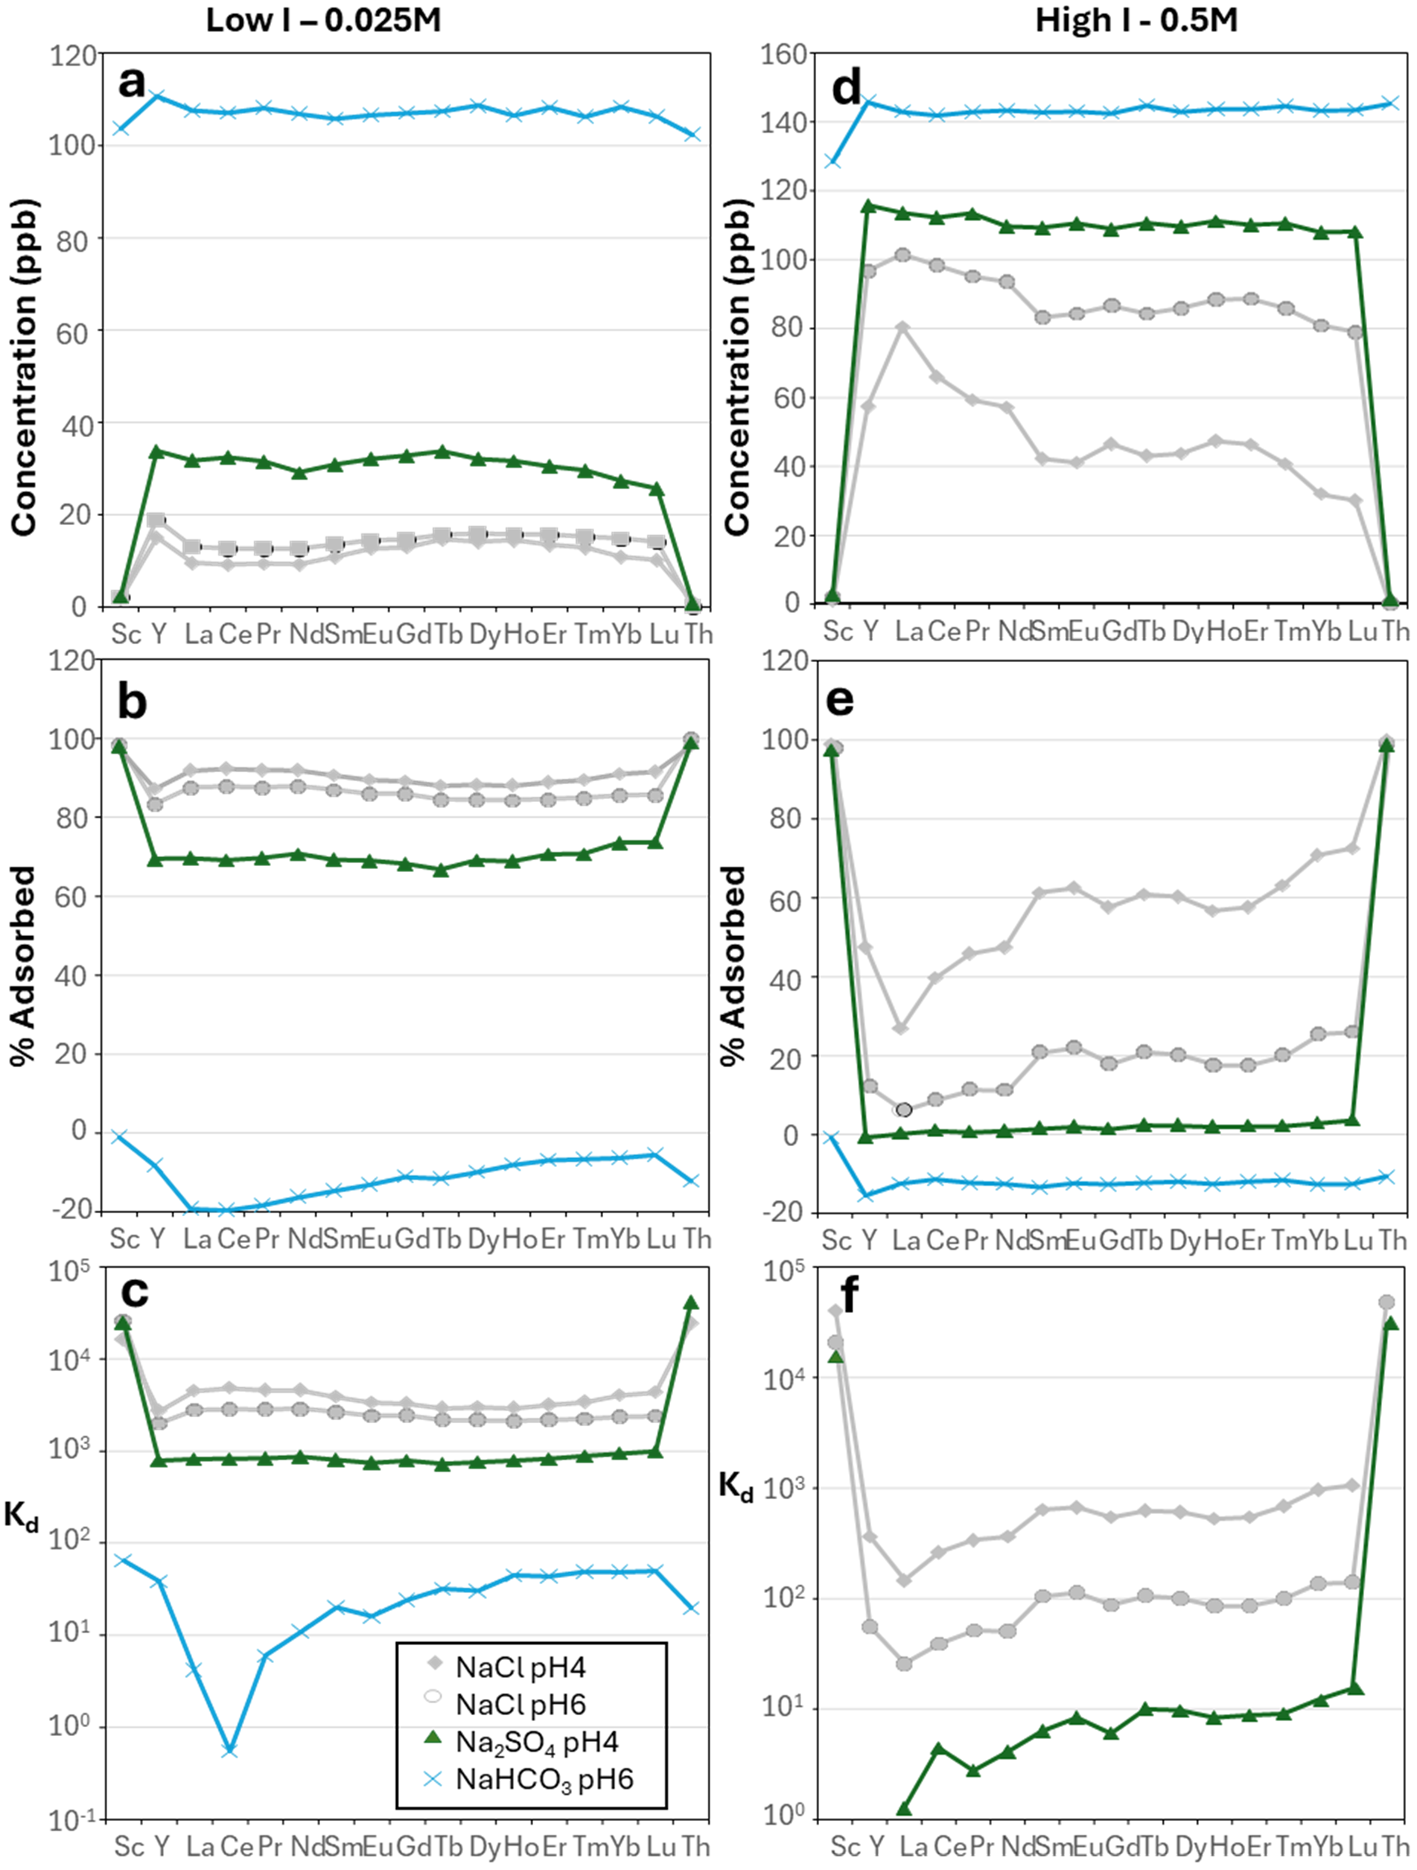
In contrast, the solution with Na2SO4 shows lesser adsorption at low I (Kd from 9.21 × 10² mL g–1 to 1.10 × 10³ mL g–1 from La to Lu at pH 4.24; Fig. 8a–c & Supplementary Material S1 & S2), and this is further reduced at high I, or even desorption can be observed (the measured concentration of REE exceeded the initial 100 ppb; Kd from 2.34 × 10⁴ mL g–1 to 1.82 × 10⁴ mL g–1 from La to Lu at pH 4.26; Fig. 8d–f & Supplementary Material S1 & S2). The solution with NaHCO3 shows desorption both at low I (pH 6) and at high I (pH 8; Fig. 8a,b & Supplementary Material S1 & S2).
Plots showing the results of the experiments with (a–c) water and low-I NaSO4 and NaHCO3 solutions and (d–f) water and high-I NaSO4 and NaHCO3 solutions. Results for NaCl solutions are shown in grey for comparison: (a & d) REE concentrations (in ppb), (b & e) proportions of adsorbed element (with respect to the initial concentration introduced into the solution) and (c & f) Kd values.

In terms of fractionation of the REE, adsorption of all REE+Y is mostly homogeneous in Na2SO4 (Fig. 7 & Supplementary Material S1 & S2), there is a slight fractionation of LREE towards kaolinite in water/dilute nitric acid and in NaCl (Fig. 6) and in NaHCO3 desorption of LREE is significantly higher than that of HREE (Fig. 7e & Supplementary Material S1 & S2). In contrast, fractionation is marked in NaCl at high I and at pH 4, and even more so at pH 6, with La being the least adsorbed element onto kaolinite (Kd = 1.38 × 10² mL g–1), and there is an increase in the proportion adsorbed with increasing atomic mass to Kd = 9.95 × 10² mL g–1 for Lu ( . 7d,f & Supplementary Material S1 & S2). In all experiments there is the potential for the incorporation of the REE into the crystal lattice as well as adsorption onto surface or interlayer sites. However, previous leaching studies (e.g. Sanematsu & Watanabe, Reference Sanematsu, Watanabe, Verplanck and Hitzman2016; Estrade et al., Reference Estrade, Marquis, Smith, Goodenough and Nason2019; Li et al., Reference Li, Zhou and Williams-Jones2019) and X-ray adsorption spectroscopy studies of REE-bearing kaolinites (Yamaguchi et al., Reference Yamaguchi, Honda, Tanaka, Tanaka and Takahashi2018; Borst et al., Reference Borst, Smith, Finch, Estrade, Villanova-de-Benavent and Nason2020) indicate that adsorption is the dominant process.
Variation with the type of kaolinite
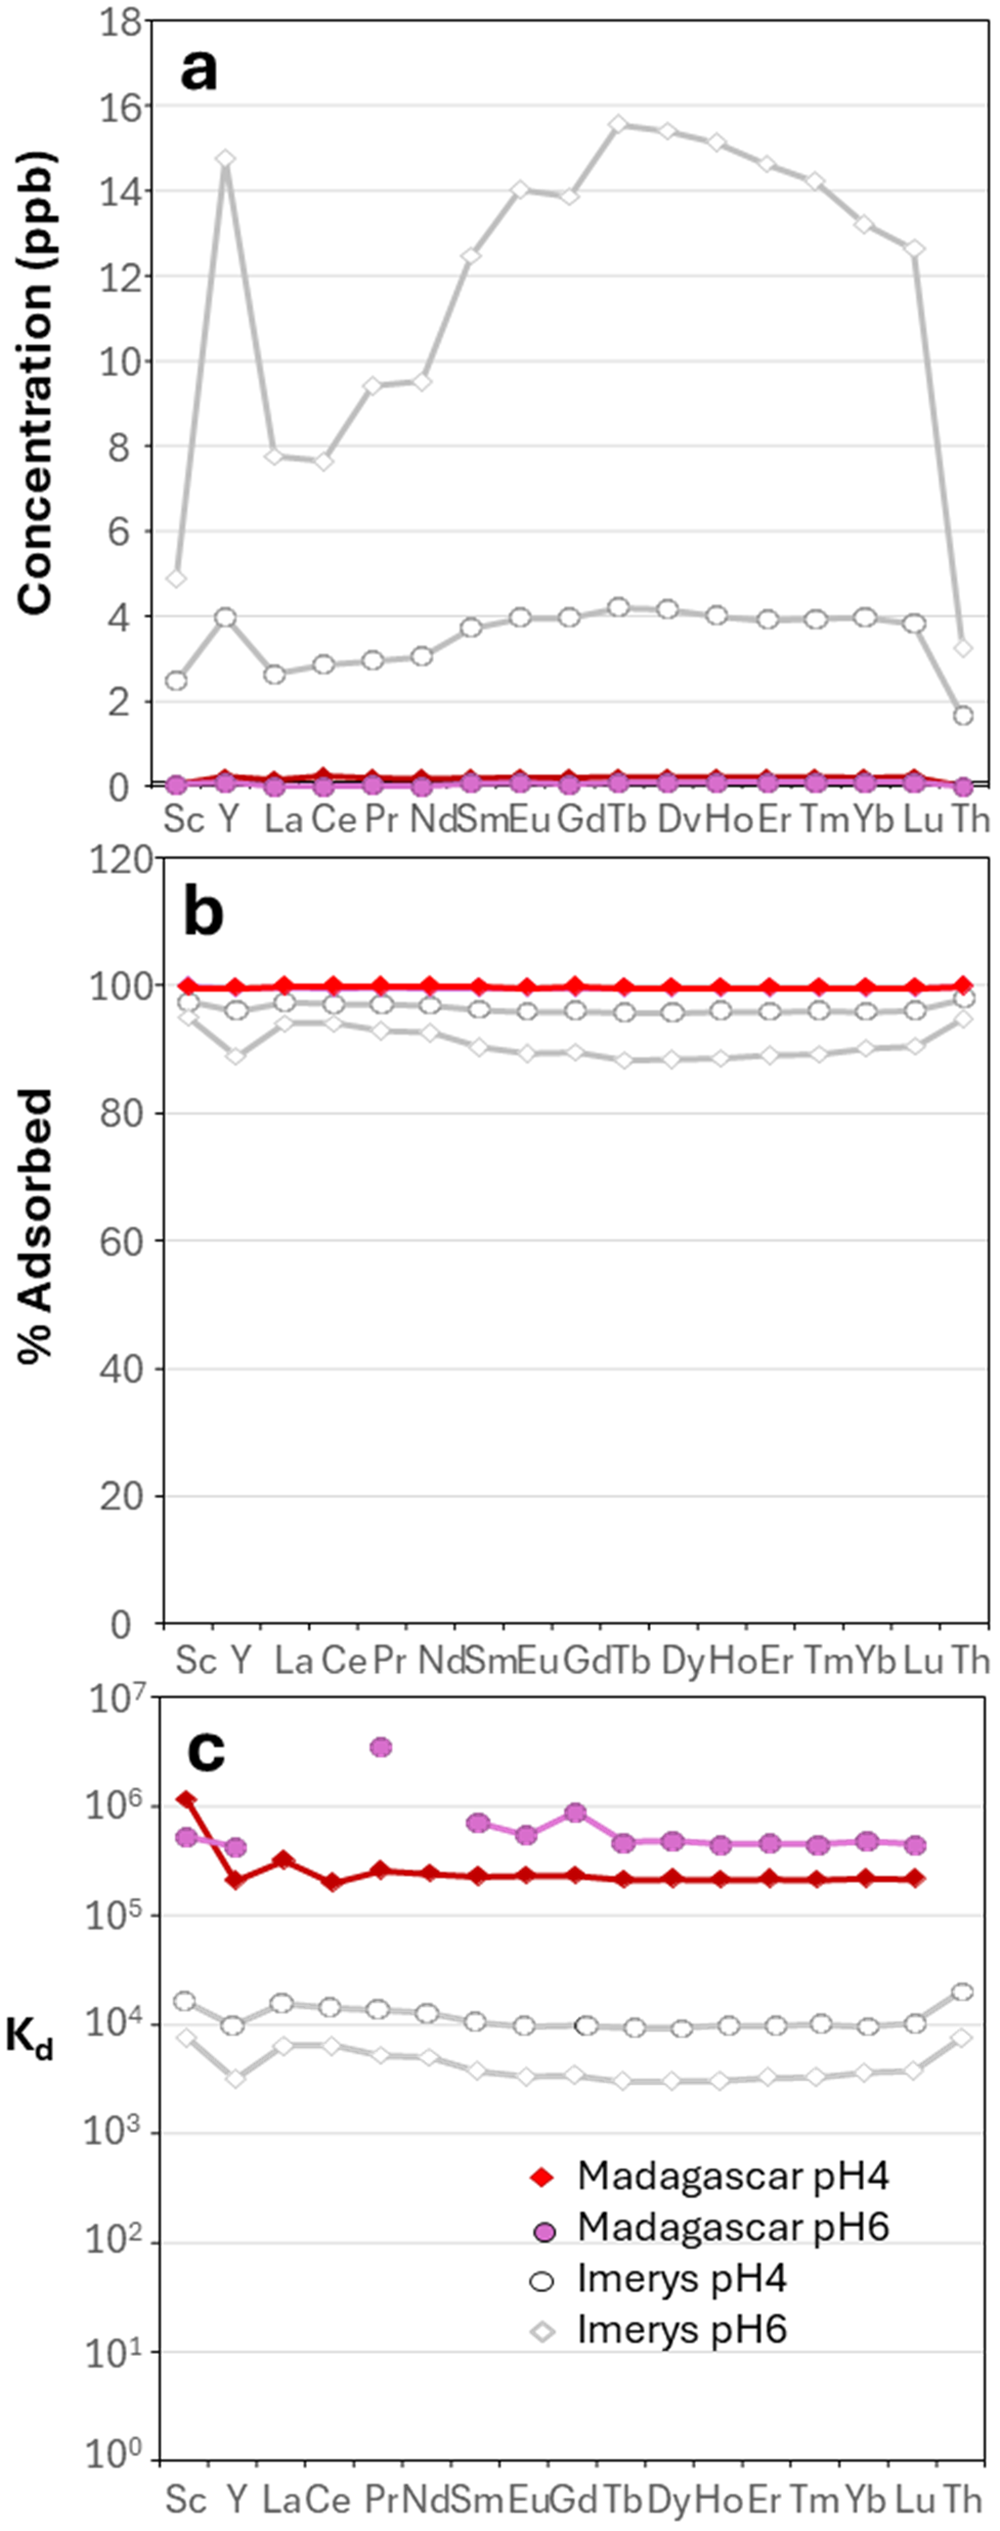
The output solution concentrations, percentage of adsorption and Kd in the Madagascar kaolinite are displayed in Fig. 9 and compared with the Imerys kaolinite under the same solution conditions. The concentration of REE+Sc+Y+Th in the solution interacting with the Madagascar kaolinite diminishes with time (https://doi.org/10.17033/DATA.00000338), as can be observed in the Imerys kaolinite (Fig. 5). The measured Kd values reveal that there is homogeneous adsorption of all REE, with LREE being slightly more adsorbed than HREE (Fig. 9 & Supplementary Material S3 & S4). In addition, there is a negative anomaly of Y and Ce in terms of the proportion adsorbed. Sc and Th tend to be removed from the solution and incorporated into the kaolin (Fig. 9b,c & Supplementary Material S3 & S4), and this is more evident with the Madagascar kaolinite at pH 4. The Kd values for the Madagascar kaolinite show less variation across the group compared to those of the Imerys kaolinite, with little potential for fractionation, except for in Ce and Y. Both Sc and Th are more effectively adsorbed than the REE (Fig. 9b,c & Supplementary Material S3 & S4). The results indicate that the Madagascar kaolinite is more effective at adsorbing the studied elements by at least an order of magnitude compared to the Imerys kaolinite, with the Kd for La at pH 4 after 24 h being 3.27 × 10⁵ mL g–1 for the Madagascar kaolinite compared to 1.58 × 10⁴ mL g–1 for the Imerys kaolinite.
Plots showing (a) the REE+Sc+Y+Th concentration (in ppb, analysed in He collision mode) of the experiments with water using Madagascar kaolinite, (b) the proportion of adsorbed elements and (c) the Kd values. The results for Imerys kaolinite under the same conditions are shown for comparison in grey.

Discussion
REE adsorption onto kaolinite in low-ligand-strength solutions
The Kd values determined for the adsorption of the REE on Imerys kaolinite in this study in water with dilute nitric acid at pH 4.20 and 6.09 are consistent with the results of Coppin et al. (Reference Coppin, Berger, Bauer, Castet and Loubet2002) under similar conditions. Minor variations are likely to be due to grain and crystallite size (see ‘The role of grain size and crystallinity’ section later) between the kaolins used. To allow for repeatable experiments with a homogeneous material, both studies used commercially supplied China clay separates (this study: Imerys light kaolinite; Coppin et al. (Reference Coppin, Berger, Bauer, Castet and Loubet2002): English China Clays SUPREME kaolinite). The ζ-potential of the kaolinites measured here shows a decline from approximately –10 mV at pH 2 to approximately –30 mV at pH 4, from which point ζ-potential remains approximately constant at –30 mV. The consistency of the ζ-potential variation with pH between the two kaolinites measured in this study, and the those measured by previous authors (e.g. Tari et al., Reference Tari, Bobos, Gomes and Ferreira1999), indicates that, all other factors (electrolyte composition and ionic strength, grain size, crystallinity) being equal, the surface charge properties of kaolinite are relatively constant, as is their control over adsorption behaviour. Kaolinite does not show a well-defined isoelectric point (and, hence, point of zero charge) above pH 1, and so it has a consistent negative net surface charge (Tari et al., Reference Tari, Bobos, Gomes and Ferreira1999).
The mechanisms of REE adsorption on kaolinite have been discussed in detail by previous authors (Aja, Reference Aja1998; Coppin et al., Reference Coppin, Berger, Bauer, Castet and Loubet2002; Kautenberger & Beck, Reference Kautenburger and Beck2016; Xiao et al., Reference Xiao, Huang, Long, Feng and Wang2016; Gao et al., Reference Gao, Fan and Xu2017) and measured in natural samples by Yamaguchi et al. (Reference Yamaguchi, Honda, Tanaka, Tanaka and Takahashi2018) and Borst et al. (Reference Borst, Smith, Finch, Estrade, Villanova-de-Benavent and Nason2020). The corresponding desorption behaviour has been investigated by Moldoveanu & Papangelakis (Reference Moldoveanu and Papangelakis2012, Reference Moldoveanu and Papangelakis2013). Coppin et al. (Reference Coppin, Berger, Bauer, Castet and Loubet2002) concluded that sorption depends on the nature of the clay mineral (i.e. cation-Exchange capacity (CEC)), pH and ionic strength. REE chemisorption takes place on amphoteric sites at the edges of particles to compensate for the variable charge. At low I, the sorption coefficient is influenced by the CEC of the clays. Most of the exchangeable cations occur at the edges and on the basal (OH) surfaces of kaolinite (Ma & Eggleton, Reference Ma and Eggleton1999). The permanent charge from the substitution of Al3+ for Si4+ is insignificant, and the CEC of kaolinite strongly depends on particle size (thickness and diameter in the 001 plane) and on pH (Ma & Eggleton, Reference Ma and Eggleton1999). Yamaguchi et al. (Reference Yamaguchi, Honda, Tanaka, Tanaka and Takahashi2018) and Borst et al. (Reference Borst, Smith, Finch, Estrade, Villanova-de-Benavent and Nason2020) demonstrated that in natural ion adsorption clays the REE are adsorbed as 8 or 9 coordinated hydrated ions as outer-sphere complexes onto the variable-charge OH sites (the aluminol surface). Coppin et al. (Reference Coppin, Berger, Bauer, Castet and Loubet2002) suggested that the permanent charge is compensated at low pH by a physical sorption of REEs on the basal planes. However, the permanent charge resulting from isomorphic substitution for Al3+ and Si4+ in the octahedral and tetrahedral layers is relatively limited in the kaolinite group, as is interlayer ion exchange due to relatively strong bonding between the 1:1 layers (Schoonheydt & Johnston, Reference Schoonheydt, Johnston, Bergaya and Lagaly2013). Borst et al. (Reference Borst, Smith, Finch, Estrade, Villanova-de-Benavent and Nason2020) demonstrated leaching of the REE from kaolinite across the group using ICP-MS and X-ray absorption near-edge structure (XANES) analyses following preparation of a REE-saturated kaolinite using the same methodology and materials as those of the current study. There is therefore little evidence for a change in the adsorption mechanism with pH or atomic number over the pH range (2–6) described here. The data presented here are therefore inferred to be consistent with basal and edge adsorption of the REE onto variable-charge aluminol sites.
The key feature noted regarding Kd in the absence of strongly complexing ligands is the increase in sorption at lower pH (pH 4 compared to pH 6; Fig. 6). This is in contrast to the general increase in Kd with increasing pH noted by Coppin et al. (Reference Coppin, Berger, Bauer, Castet and Loubet2002), who attributed this to decreasing (i.e. increasingly negative) surface charge. In our data there is little change in the mean ζ-potential between pH 4 and 6 (approximately –30 mV), so this does not relate to change in the surface charge. In the speciation calculations carried out as part of this study the significant difference between pH 4 and 6 in the experimental solutions was the formation of LnOH2+ complex ions at pH 6. At pH 4 these account for less than 0.02% of the total REE present in solution, but at pH 6 this varies from 0.27% (La) to 2.80% (Lu) of the REE present. In both cases the remainder is accounted for by the free ions. The hydrolysis of the hydrated Ln3+ ions at higher pH to form Ln–OH complexes may account for the observed reduction in adsorption. The very slight preference for LREE sorption observed in these experiments may also be accounted for by this variation in speciation. An increase of sorption below pH 6 with decreasing ionic strength was observed for Nd and Eu by Sinitsyn et al. (Reference Sinitsyn, Aja, Kulik and Wood2000). A similar pH dependence for REE adsorption onto Fe-oxyhydroxides was noted by Bau (Reference Bau1999) and also attributed to an increase in hydroxide complex formation with increasing pH. The key distinction between our experiments and those of Coppin et al. (Reference Coppin, Berger, Bauer, Castet and Loubet2002) is that Coppin et al. used NaNO3 and NaClO4 to vary pH and ionic strength, whereas our approach was to use only nitric acid for experiments without strongly complexing ligands. Experiments at pH 2 in the presence of NaCl are discussed in the subsection immediately to follow.
The role of ionic strength and ligand type
Our experiments have tested the adsorption of the REE on kaolinite in the presence of Cl–, SO42– and CO32– ligands at high and low ionic strength and the pH dependence of adsorption in the presence of NaCl. In NaCl solutions at an ionic strength of 0.03 mol kg–1 adsorption increases from pH 2 to 6, with Kd typically varying from ∼1000 to 5000 mL g–1 over that range (Fig. 7e & Supplementary Material S1 & S2). The relative pattern of Kd is comparable to that in water/dilute nitric, with only a sight preference for the LREE, and hence minimal fractionation relative to the solution is predicted for kaolinite adsorption at low I. The magnitude of Kd in NaCl solutions at pH 6 and water/dilute nitric acid at pH 6 are comparable. The trend of increasing Kd with pH is also directly comparable to that observed by Coppin et al. (Reference Coppin, Berger, Bauer, Castet and Loubet2002). The linear relationship between logKd and pH was inferred by Coppin et al. (Reference Coppin, Berger, Bauer, Castet and Loubet2002) to be related to adsorption onto the amphoteric sites at the edges of the particles. Walther (Reference Walther1996) demonstrated that both the Si–O and Al–O site negative charges increased with pH, although the Al–O site is positive until pH ≈ 6. The net surface charge is always negative for kaolinite (Schroth & Sposito, Reference Schroth and Sposito1997), as Al3+ for Si4+ substitution is typically insignificant and is largely controlled by proton adsorption and desorption reactions at edge sites and the aluminol basal surface sites (Ma & Eggleton, Reference Ma and Eggleton1999). Positive charge is generated at low pH by proton adsorption on edge and basal Al–OH sites via
 \begin{equation*}{\text{Al--OH + }}{{\text{H}}^{\text{ + }}}{\text{ = Al--O}}{{\text{H}}_{\text{2}}}^{\text{ + }}\end{equation*}
The increasing negative charge in more basic solutions is generated by proton loss at Al–OH and Si–OH sites:
 \begin{equation*}{\text{Al--OH + }}{{\text{H}}^{\text{ + }}}{\text{ = Al--O}}{{\text{H}}_{\text{2}}}^{\text{ + }}\end{equation*}
 \begin{equation*}{\text{Al--OH + O}}{{\text{H}}^{\text{--}}}{\text{ = Al--}}{{\text{O}}^{\text{--}}}{\text{ + }}{{\text{H}}_{\text{2}}}{\text{O}}\end{equation*}
We inferred earlier that the lack of correlation of Kd with pH seen in the water/dilute nitric acid experiments was because the formation of hydroxy complexes inhibited sorption at high pH. This does not occur in dilute NaCl solutions because the formation of hydroxy complexes is inhibited by the preferential formation of chloride complexes that do not show strong pH dependence at low I. The speciation calculations presented earlier indicate that, in the low-I NaCl solution, the Ln3+ ion accounts for 97.3% of La to 99.0% of Lu aqueous speciation. The remainder is dominantly LnCl2+, with minimal predicted LnOH+ ion formation. There is a slight increase in the dominance of the Cl complex with increasing pH to 97.2% La3+ and 98.3% Lu3+ at pH 6, which accounts for the slight preference for LREE adsorption.
In high-I NaCl solutions the adsorption of the REE is significantly reduced compared to the low-I experiments and the pH dependence of Kd is enhanced. Sorption is lowest at pH 2 and shows little LREE–HREE fractionation and a negative Y anomaly. At 6 h in the pH 2 experiment there is evidence for desorption of the REE or dissolution of kaolinite, as the eluent fluid had higher REE concentrations at the end of the experiment than at the beginning. This is consistent with the data of Walther (Reference Walther1996), as the low pH dissolution rate of kaolinite at 25°C becomes slightly increased at this point. At pH 4 and 6 the adsorption of the HREE is enhanced relative to the LREE, with a significant inflection towards increased Kd from Sm onwards. Coppin et al. (Reference Coppin, Berger, Bauer, Castet and Loubet2002) concluded that LREE/HREE fractionation in the Ln did not depend on the background electrolytes or presence/absence of dissolved CO2. They attributed preferred HREE sorption at high I to competition with Na+ or because of the formation of inner-sphere complexes, both according to the Ln contraction. However, measurements of natural kaolinites point to the formation of outer-sphere complexes (Yamaguchi et al., Reference Yamaguchi, Honda, Tanaka, Tanaka and Takahashi2018; Borst et al., Reference Borst, Smith, Finch, Estrade, Villanova-de-Benavent and Nason2020) at acid soil pH. Determination of aluminol surface charge (Walther, Reference Walther1996) and the net proton excess (Tombácz & Szekeres, Reference Tombácz and Szekeres2006) both indicate that the aluminol surface does not become negative until pH 6, and the speciation calculations present here indicate that hydrolysis of the hydration shell of Ln–Cl complex ions is minimal in the experimental solutions. Both of these factors would limit the formation of inner-sphere complexes to higher pH. However, the speciation calculations do indicate preferential formation of LnCl2+ complexes for the HREE, with a major step change in the proportion of complex ions at Sm, which mirrors the step change in adsorption at Sm. At high I and pH 2 the proportion of the REE as the free ion varies from 74.9% for La3+ to 95.2% for Lu3+, with the remainder as LnCl2+ (23.8% to 4.6%). The proportions remain similar to pH 6. The differential adsorption behaviour can therefore be accounted for by the formation of chloride complex ions at high I. This also accounts for the anomalous behaviour of Y, as there is a higher proportion of the complex ion in solution compared to Dy and Ho (22.75% YCl2+ compared to 8.60% for Dy and Ho; c.f. Bau, Reference Bau1996, Reference Bau1999). We therefore conclude that the LREE–HREE fractionation observed in chloride solutions at high ionic strength is a result of the inhibition of sorption caused by the formation of complex ions, but with an overall reduction in adsorption caused by competition with Na+ (Coppin et al., Reference Coppin, Berger, Bauer, Castet and Loubet2002).
In Na2SO4 solutions at pH 4 at both low and high ionic strength adsorption is significantly less compared to NaCl and water/dilute nitric acid at the same pH, with minimal LREE–HREE fractionation. In low-I experiments Kd for all REE is ∼900 mL g–1, whereas in high-I Na2SO4 solution Kd is from 1 to 17 mL g–1. Mean ζ-potential measurements suggest that in low-I, Na-bearing solutions the surface properties of kaolinite are modified down to a ζ-potential of approximately –50 mV (Fig. 4a), possibly as a result of anion adsorption at positively charged aluminol sites (Tari et al., Reference Tari, Bobos, Gomes and Ferreira1999). Increasingly negative surface charge would increase Kd, not reduce it. However, in speciation calculations at low I, LnSO4+ accounts for 84.5% of aqueous La to 78.6% of aqueous Lu. At high I there is preferential LREE complexation, with LnSO4+ accounting for 90.30% La to 86.22% Lu (Fig. 4e,f). We therefore infer that the formation of REE–sulphate complexes strongly inhibits surface adsorption on kaolinite relative to chloride- or nitrate-bearing solutions. sulphate itself does not interact with the kaolinite surface, in contrast to ferrihydrite, as noted by Gu et al. (Reference Gu, Liu, Yang, Zhu, Ma and Liang2022). Previous studies of REE adsorption on kaolinite in the presence of sulphate produced Kd values that are directly comparable to those determined here (Gu et al., Reference Gu, Liu, Yang, Zhu, Ma and Liang2022).
In NaHCO3 at pH 6–8 at low ionic strength, LREE La–Gd sorption is strongly inhibited, with potentially some desorption or dissolution of kaolinite after 2 h. This is most marked for the LREE, and Gd–Lu still show slight adsorption with Kd ≈ 10–40 mL g–1. For longer reaction times desorption or dissolution is the principal process. At high I all REE are higher in the lixiviant than in the input solution, indicating that desorption or kaolinite dissolution is the principal process. This can be accounted for by a combination of aqueous speciation and the solubility of kaolinite. Speciation calculations indicate that, at low I and pH 6.6, LaCO3+ dominates, with additional LaHCO3+ for La to Sm. The free ion accounts for only a very small proportion of the REE, ranging from 11.71% of aqueous La to 0.70% of aqueous Lu. Yttrium has similar speciation to Dy and Ho. At high I and pH 8.2 free Ln ions are negligible and Ln(CO3)2– dominates all REE. The limited adsorption for all REE compared to solutions bearing all other ligands can therefore be related to the very high association of Ln carbonate aqueous complexes. Kaolinite solubility is strongly pH dependent and shows an increase in dissolution rate at pH 8 (Carrol & Walther, Reference Carroll and Walther1990; Walther, Reference Walther1996). At 25°C the dissolution rate above pH 8 is significantly higher than at pH 2. Below pH 8 the rate-determining step for kaolinite dissolution is the formation of Al–OH2+, followed by Si detachment by OH complexes at higher pH. Therefore, the mechanism of kaolinite dissolution will promote desorption of the REE at basic pH, as well the increasing solubility of kaolinite. In Na2CO3 solutions the carbonate ions themselves will effectively buffer the pH to more basic levels, and REE complexation and desorption will be the dominant processes. In terms of the apparent LREE–HREE fractionation in Fig. 8 the lower adsorbed percentage and lower Kd for the LREE reflect the greater starting concentration of the LREE in the experimental kaolinites. Previous studies have shown that adsorption at basic pH can be as or more effective than at acidic pH (e.g. Feng et al., Reference Feng, Onel, Council-Trouche, Noble, Yoon and Morris2021), but these studies used REE chloride solutions, presumably (although not specified) with pH buffered by the addition of NaOH. In natural alkaline environments the solutions are likely to be sodium carbonate-rich, and aqueous speciation will be critical to the extent of adsorption. Cerium shows anomalously low adsorption relative to La and Pr in low-I carbonate solutions (Fig. 8c & Supplementary Material S1 & S2). This cannot be attributed to complex ion formation, as Ce3+ shows no anomalous behaviour relative to La and Pr (Fig. 4e). This may be due to Ce oxidation to Ce4+ as a result of the reduction in the redox potential required for oxidation at a higher pH (Abelan et al., Reference Abelan, Moser, Lucas, Grate, Evans and Browning2017), although this was not considered in our speciation modelling.
The role of grain size and crystallinity
The Imerys light kaolinite was used throughout the experiments with different ligands to provide a homogenous and repeatable mineral substrate. The effects of varying kaolinite source, which influences grain size and crystallinity, were assessed using Madagascar kaolinite separated from samples characterised in Estrade et al. (Reference Estrade, Marquis, Smith, Goodenough and Nason2019) using pH 4 and 6 water/dilute nitric acid solutions. The relative distributions of the REE in the output solutions matched those seen with the Imerys kaolinite, but there was an order of magnitude more adsorption (near 100% adsorption), with logKd for the REE from 5.3 to 5.4 at pH 4 and from 5.6 (Lu) to 6.5 (Ce) after 24 h. The ζ-potential of kaolinite is not influenced by crystallinity, both according to our measurements (Fig. 3) and as noted previously by Au et al. (Reference Au, Clode, Smart and Leonga2015), so the increase in sorption can be related to the increase in available edge, basal and defect sites with decreasing crystallinity, as indicated by crystallite size (Li et al., Reference Li, Li and Yang2015; Yang et al., Reference Yang, Jaber, Michot, Rigaud, Walter and Laporte2023), and not to a fundamental change in surface properties (including surface charge density). Similar effects have been noted in other previous studies (e.g. adsorption of AuCl4–; Hanlie et al., Reference Hanlie, Sun, Wang and Min2003). Reductions in crystallinity arise from weathering genesis of kaolinite compared to the hydrothermal one (Balan et al., Reference Balan, Fritsch, Allard and Calas2007; Zadvernyuk et al., Reference Zadvernyuk, Kadoshnikov, Shekhunova and Remez2021) and from formation at high pH (Fialips et al., Reference Fialips, Sabine, Decarreau and Beaufort2000). The effect of increased REE adsorption with reduced grain size has also been observed in natural kaolinites by Galán et al. (Reference Galán, Fernández-Caliani, Miras, Aparicio and Márquez2007).
Implications
The data presented here demonstrate that ligand availability has a key effect on REE adsorption onto kaolinite at both low and high ionic strength. At low ionic strength, the available ligand (Cl–, SO42– or CO32–) has little effect on fractionation of the REE, and the only effect is overall inhibition of adsorption. At high ionic strength, the relative fractionation of the REE is pronounced for Cl– solutions, minor for sulphate and pronounced for carbonate.
For ion adsorption deposits of the REE formed in continental weathering environments, the ligand concentration is typically low, and there is little evidence of REE fractionation caused by complex ion formation in solution. Pore fluid solution chemistry from regolith in IADs has not been widely reported, but samples from the Zhudong and Bankeng deposits are low strength (I from 0.008 to 0.012 M) and dominantly Na or Ca bicarbonate solutions with subsidiary chloride, with pH values from 5.4 to 7.5 (Li et al., Reference Li, Kwong, Zhou and Williams-Jones2022). Li et al. (Reference Li, Kwong, Zhou and Williams-Jones2022) predicted 80% of the REE to occur as the free ion in water from Zhudong, which, from the data presented here, implies minimal influence of complex ion formation on fractionation of the REE. At Bankeng, LnCO3+ and Ln(CO3)2– were predicted to dominate. At this site, the clay-adsorbed portion of the REE is LREE-enriched relative to regolith porewater, which is consistent with the influence of the formation of carbonate complexes inhibiting LREE adsorption, as indicated by the experiments presented here. The deposits are formed by dissolution of REE-bearing minerals high in the soil profile, transport to regions of pH increase and subsequent adsorption on kaolinite group minerals (Sanematsu & Watanabe, Reference Sanematsu, Watanabe, Verplanck and Hitzman2016; Estrade et al., Reference Estrade, Marquis, Smith, Goodenough and Nason2019; Li et al., Reference Li, Zhou and Williams-Jones2020). The critical factor in REE enrichment in IADs from this study is the influence of crystallinity in enhancing the enrichment of weathering kaolinite in the REE. Li & Zhou (Reference Li and Zhou2020) showed that in the Zhudong deposit (south China), the proportion of leachable REE increased from the lower to the upper pedolith. This was correlated with changes in the relative proportions of halloysite and kaolinite and in the crystallinity of kaolinite, with greater adsorbed REE occurring in samples with higher halloysite proportions and lower kaolinite crystallinity and hence higher concentrations of adsorption sites. In the Bankeng deposit (south China), Li & Zhou (Reference Li and Zhou2023) showed that the Brunauer–Emmett–Teller (BET) surface area and the CEC of kaolinite increased from the soil zone (upper pedolith) to greater depths in the weathering profile (lower pedolith and saprolite). Halloysite is not ubiquitously enriched in IADs (Estrade et al., Reference Estrade, Marquis, Smith, Goodenough and Nason2019), and therefore kaolinite grain size and crystallinity play major roles in the retention of adsorbed REE.
Low-temperature systems with significant Cl– and SO42– occur in marine environments and acid mine drainage. Adsorption onto inorganic nanoparticulates and colloids has been noted as a key control on REE behaviour in estuarine mixing, with adsorption being important at low salinity but with remobilisation of the LREE at higher salinities, presumably influenced by preferential Ln–Cl complex ion formation (Tepe & Bau, Reference Tepe and Bau2016). The influence of sulphate in causing REE fractionation onto Fe-oxyhydroxides in marine systems was noted previously by Bau (Reference Bau1999). REE behaviour has been used as a tracer in high-sulphate continental waters, including acid mine drainage (e.g. Borrego et al., Reference Borrego, Carro, López-González, de la Rosa, Grande, Gómez and de la Torre2012; Migaszewski et al., Reference Migaszewski, Gałuszka and Dołęgowska2018; Soyol-Erdene et al., Reference Soyol-Erdene, Valente, Grande and de la Torre2018) and geothermal waters (Lewis et al., Reference Lewis, Komninou, Yardley and Palmer1998). All of these studies noted REE–sulphate complex ion formation as the dominant form in solution (cf. Lozano et al., Reference Lozano, Ayora and Fernández-Martínez2020), and trends in sorption and desorption behaviour in clays in these environments can be interpreted on the basis of the data presented here. In alkaline weathering systems, including carbonatites, where clays may be generated by the breakdown of mafic silicate phases and feldspar (e.g. Hutchinson et al., Reference Hutchinson, Slezak, Wendlandt and Hitzman2022) and alkaline lakes (e.g. Kreitsmann & Bau, Reference Kreitsmann and Bau2023), the high pH would increase adsorption, but the presence of significant carbonate would retain the REE in solution up to hydrothermal temperatures (Louvel et al., Reference Louvel, Etschmann, Guan, Testemale and Brugger2022).
A critical point from this study is that modelling of deposit formation or leaching processes based on either equilibrium Kd values across the range of REE (e.g. Coppin et al., Reference Coppin, Berger, Bauer, Castet and Loubet2002) or the derivation of adsorption isotherms (e.g. Anawati & Azimi, Reference Anawati and Azimi2023) must take the crystallinity of the kaolinite into account, otherwise order-of-magnitude-scale differences relative to natural systems may be predicted. Unless experiments can be carried out to quantify fully the relationship between crystallinity and Kd, the isotherms specific to study sites need to be generated to produce successful models.
The solution reagents used in all of these experiments include Sc and Th. The behaviour of both potentially has implications for clay-adsorbed resources. Scandium is in high demand for a range of applications (Williams-Jones & Vasyukova, Reference Williams-Jones and Vasyukova2018) and may occur as clay adsorbed in lateritic deposits (Chassé et al., Reference Chassé, Griffin, O’Reilly and Calas2019), alongside adsorption onto or incorporation into Fe-oxides (Chassé et al., Reference Chassé, Griffin, O’Reilly and Calas2016). As an actinide, this is a potentially deleterious element in a REE IAD. Scandium has a Kd value in nitric acid solutions comparable to that of La, consistent with a lower proportion of the hydroxide complex in solution compared to the HREE. Thorium has the highest observed Kd value, consistent with higher ionic charge and Coulombs law-based control on adsorption, and hence it could occur alongside the REE in some weathering environment deposits. The critical factor in the separation of Ln from actinides in the weathering environment is the low solubility of primary and secondary Th-oxides.
Conclusions
We have conducted a series of experiments to examine the adsorption of the REE onto kaolinite under varying conditions, including pH, ligand type and concentration and kaolinite crystallinity. The kinetics of adsorption are rapid, with equilibrium being reached by between 6 and 24 h in all cases. In dilute aqueous solution, in the absence of strongly binding ligands (solutions contained nitric acid) the extent of adsorption decreased with increasing pH, contrary to what has been observed in previous studies. This is attributed to the formation of hydroxyl complexes inhibiting adsorption at pH 6 and above. In NaCl solutions, adsorption increases with pH, which can be interpreted as the formation of more adsorption sites as a result of proton loss at hydroxyl sites. The addition of ligands results in reduced adsorption, which is inferred to result from the inhibition of adsorption by complex ion formation in solution. Sulphate is more effective than chloride at inhibiting adsorption, and carbonate is the most effective, possibly promoting desorption at high ionic strength (0.5 M). The addition of chloride results in fractionation of the REE, with the reduction in adsorption being most marked for the LREE (La to Sm). These form the most strongly associated chloride complexes according to speciation calculations. Although sulphate causes a greater reduction in sorption, it causes less REE fractionation, as sulphate complexes show relatively consistent association constants across the group. Carbonate shows REE fractionation as a result of more strongly associated LREE complex ion formation. The overall reduction in adsorption is also affected by the presence of counterions (Na+) with the addition of electrolytes to provide a ligand source. Comparison of a natural, weathering-derived kaolin from Madagascar to the processed kaolin used for most experiments indicates that crystallite size – and hence crystallinity and defect density – has a major controlling role over adsorption. Distribution coefficients for the natural kaolin are an order of magnitude greater in favour of kaolinite adsorption compared to the processed kaolin. Both Sc and Th show greater adsorption than the REE, but their presence as surface-adsorbed species in natural systems may be limited by the low solubility of their oxides under near-surface conditions. The data presented here are applicable to the behaviour of the REE in ion adsorption deposits and to REE behaviours in a range of natural fluid–mineral interactions.
Supplementary material
The supplementary material for this article can be found at https://doi.org/10.1180/clm.2026.10021.
Financial support
This paper is a product of the SoS RARE project, which was funded by the UK’s Natural Environment Research Council under grant agreement No. NE/M011429/1. For the purposes of open access, the authors have applied a Creative Commons Attribution (CC-BY) license to any Author Accepted Manuscript version arising from this submission.
Competing interests
The authors declare none.


 Open access