


Bricks are among the most widely used construction materials worldwide, with an estimated annual production of 1.5 trillion units (Brown, Reference Brown, Petrović, Gjerde, Chicca and Marriage2024). The growing demand for bricks is driven by continuously increasing urbanization and socio-economic development. Recent studies indicate that the brick market is expected to register a compound annual growth rate exceeding 3% between 2024 and 2029 (Mordor Intelligence Research and Advisory, 2023). However, brick production is associated with high energy consumption, particularly during the manufacturing process. Additionally, the energy demand for heating and cooling in buildings is strongly influenced by the hygrothermal properties of clay bricks, which depend on their porosity, density and product configuration (solid or hollow), as these parameters influence thermal conductivity and moisture-buffering capacity (Makrygiannis & Karalis, Reference Makrygiannis and Karalis2023; Hofheinz et al., Reference Hofheinz, Walker, Purcell and Kinnane2025).
In 2020, the building sector recorded 38% of global CO2 emissions and 35% of energy consumption (Global Alliance for Building and Construction, 2020). Moreover, brick manufacturing consumes approximately 0.54–4.50 MJ of energy per kilogram of product, depending on the type of kiln and fuel used (Maithel & Heierli, Reference Maithel and Heierli2008; Murmu & Patel, Reference Murmu and Patel2018). These figures highlight the urgent need to implement strategies to reduce energy demand, particularly through the optimization of construction materials (Global Alliance for Building and Construction, 2020).
Many studies have promoted sustainability in the building sector through the development of ecological bricks. For instance, Bruno et al. (Reference Bruno, Gallipoli, Perlot and Mendes2017, Reference Bruno, Gallipoli, Perlot and Mendes2019) investigated the hypercompaction of bricks prior to firing, while Kung (Reference Kung1985) estimated optimal firing conditions by measuring the saturation coefficient and specific surface area. Extensive research (Cid-Falceto et al., Reference Cid-Falceto, Mazarrón and Cañas2012; Oti & Kinuthia, Reference Oti and J.M2012; El Fgaier et al., Reference El Fgaier, Lafhaj, Brachelet, Antczak and Chapiseau2015, Reference El Fgaier, Lafhaj, Chapiseau and Antczak2016; Touolak et al., Reference Touolak, Nya, Haulin, Yanne and Ndjaka2015; González-López et al., Reference González-López, Juárez-Alvarado, Ayub-Francis and J.M2018; Ruiz et al., Reference Ruiz, Zhang, Edris, Cañas and Garijo2018; Malkanthi et al., Reference Malkanthi, Balthazaar and Perera2020; Nagaraj et al., Reference Nagaraj, Sravan, Arun and K.S2014; Abid et al., Reference Abid, Kamoun, Jamoussi and El Feki2022) has focused on raw earth bricks, which are often well suited for thermal insulation (El Fgaier et al., Reference El Fgaier, Lafhaj, Brachelet, Antczak and Chapiseau2015; Giada et al., Reference Giada, Caponetto and Nocera2019; Belarbi et al., Reference Belarbi, Sawadogo, Poullain, Issaadi, Hamami, Bonnet and Belarbi2022). However, their environmental advantages may vary depending on the formulation and production process. In particular, the use of stabilizers such as cement or lime can significantly increase embodied energy and associated CO2 emissions (Arduin et al., Reference Arduin, Caldas, Paiva and Rocha2022; Dai, Reference Dai2026). Additionally, earth bricks may exhibit limited technological performance in terms of mechanical strength and water absorption, which can affect their durability. These materials are particularly vulnerable to water damage and tend to lose strength and dimensional stability over time (Murmu & Patel, Reference Murmu and Patel2018). Conversely, fired clay bricks are valued for their high technological performance, achieved through mineralogical and microstructural transformations during firing (Oti et al., Reference Oti, Kinuthia and Bai2009; Gentilini et al., Reference Gentilini, Franzoni, Graziani and Bandini2014; Lachheb et al., Reference Lachheb, Youssef and Younsi2023). As thermal treatment is energy-intensive, optimizing firing conditions while ensuring adequate technological properties and hygrothermal performance is essential.
In Morocco, several studies have investigated the performance of clay bricks in various contexts, particularly in the development of eco-efficient materials. El Hammouti et al. (Reference El Hammouti, Charai, Mezrhab, Nasri and Karkri2022) examined the thermophysical properties of raw earth materials from Ouled Setout and Touissite in north-east Morocco, reporting thermal conductivities of 1.379 and 0.807 W mK–1, respectively. Similarly, Boukili et al. (Reference Boukili, Lechheb, Ouakarrouch, Dekayir, Kifani-Sahban and Khaldoun2021) studied a clayey material from Bensmim and concluded that, although it is unsuitable for brick manufacturing due to its weak mechanical properties, it exhibits high thermal performance, with thermal conductivity values ranging from 0.324 to 0.356 W mK–1. El Hammouti et al. (Reference El Hammouti, Charai, Channouf, Horma, Nasri and Mezrhab2023) conducted a comparative study of fired and unfired clay bricks from four regions in northern Morocco. Their results showed that firing improved mechanical strength by 19–107% while reducing thermal conductivity by 21.6–52.0%. El Azhary et al. (Reference El Azhary, Lamrani, Raefat, Laaroussi, Garoum, Mansour and Khalfaoui2017) investigated the thermal performance of unfired clay bricks in buildings in Errachidia and showed that, with a thermal conductivity of 0.703 W mK–1, these materials reduced indoor temperatures by ∼5.1°C during the hottest periods. Finally, El-Yahyaoui et al. (Reference El-Yahyaoui, Manssouri, Lehleh, Sahbi and Limami2023) investigated unfired clay bricks incorporating diss fibres in the Taounate region and reported that increasing fibre content improved insulation performance but reduced compressive strength. These variations in thermal conductivity among Moroccan clay-based materials are primarily attributed to differences in the physical properties of the elaborated specimens, particularly porosity and density. Higher porosity generally corresponds to lower density and reduced thermal conductivity, as air-filled pores impede heat transfer through the material.
Previous studies (Cid-Falceto et al., Reference Cid-Falceto, Mazarrón and Cañas2012; Oti & Kinuthia, Reference Oti and J.M2012; Nagaraj et al., Reference Nagaraj, Sravan, Arun and K.S2014; El Fgaier et al., Reference El Fgaier, Lafhaj, Brachelet, Antczak and Chapiseau2015, Reference El Fgaier, Lafhaj, Chapiseau and Antczak2016; Touolak et al., Reference Touolak, Nya, Haulin, Yanne and Ndjaka2015; El Azhary et al., Reference El Azhary, Lamrani, Raefat, Laaroussi, Garoum, Mansour and Khalfaoui2017; González-López et al., Reference González-López, Juárez-Alvarado, Ayub-Francis and J.M2018; Ruiz et al., Reference Ruiz, Zhang, Edris, Cañas and Garijo2018; Malkanthi et al., Reference Malkanthi, Balthazaar and Perera2020; Boukili et al., Reference Boukili, Lechheb, Ouakarrouch, Dekayir, Kifani-Sahban and Khaldoun2021; Abid et al., Reference Abid, Kamoun, Jamoussi and El Feki2022; El Hammouti et al., Reference El Hammouti, Charai, Mezrhab, Nasri and Karkri2022, Reference El Hammouti, Charai, Channouf, Horma, Nasri and Mezrhab2023; El-Yahyaoui et al., Reference El-Yahyaoui, Manssouri, Lehleh, Sahbi and Limami2023) aimed at optimizing energy demand in brick production have primarily focused on raw earth bricks, which exhibit a lower environmental footprint and acceptable insulation performance. However, their limited technological and mechanical properties make fired clay bricks essential for ensuring durability, despite their higher energy consumption. Research efforts to optimize firing conditions remain limited. Additionally, the investigated methods have not considered the type of heat treatment used. Therefore, research investigating innovative approaches to adjusting the firing process is essential.
This study evaluates the effect of a stepped firing process as a sustainable alternative to conventional heat treatment for clay bricks. The approach involves systematically adjusting firing parameters, including key temperatures and dwell times, representing a novel strategy in the literature. The research investigates how this firing process influences brick properties, including compressive strength, density, porosity, water absorption, thermal conductivity, rebound hammer and ultrasonic pulse velocity (UPV) tests, along with their mineralogical and microstructural characteristics.
Geological context
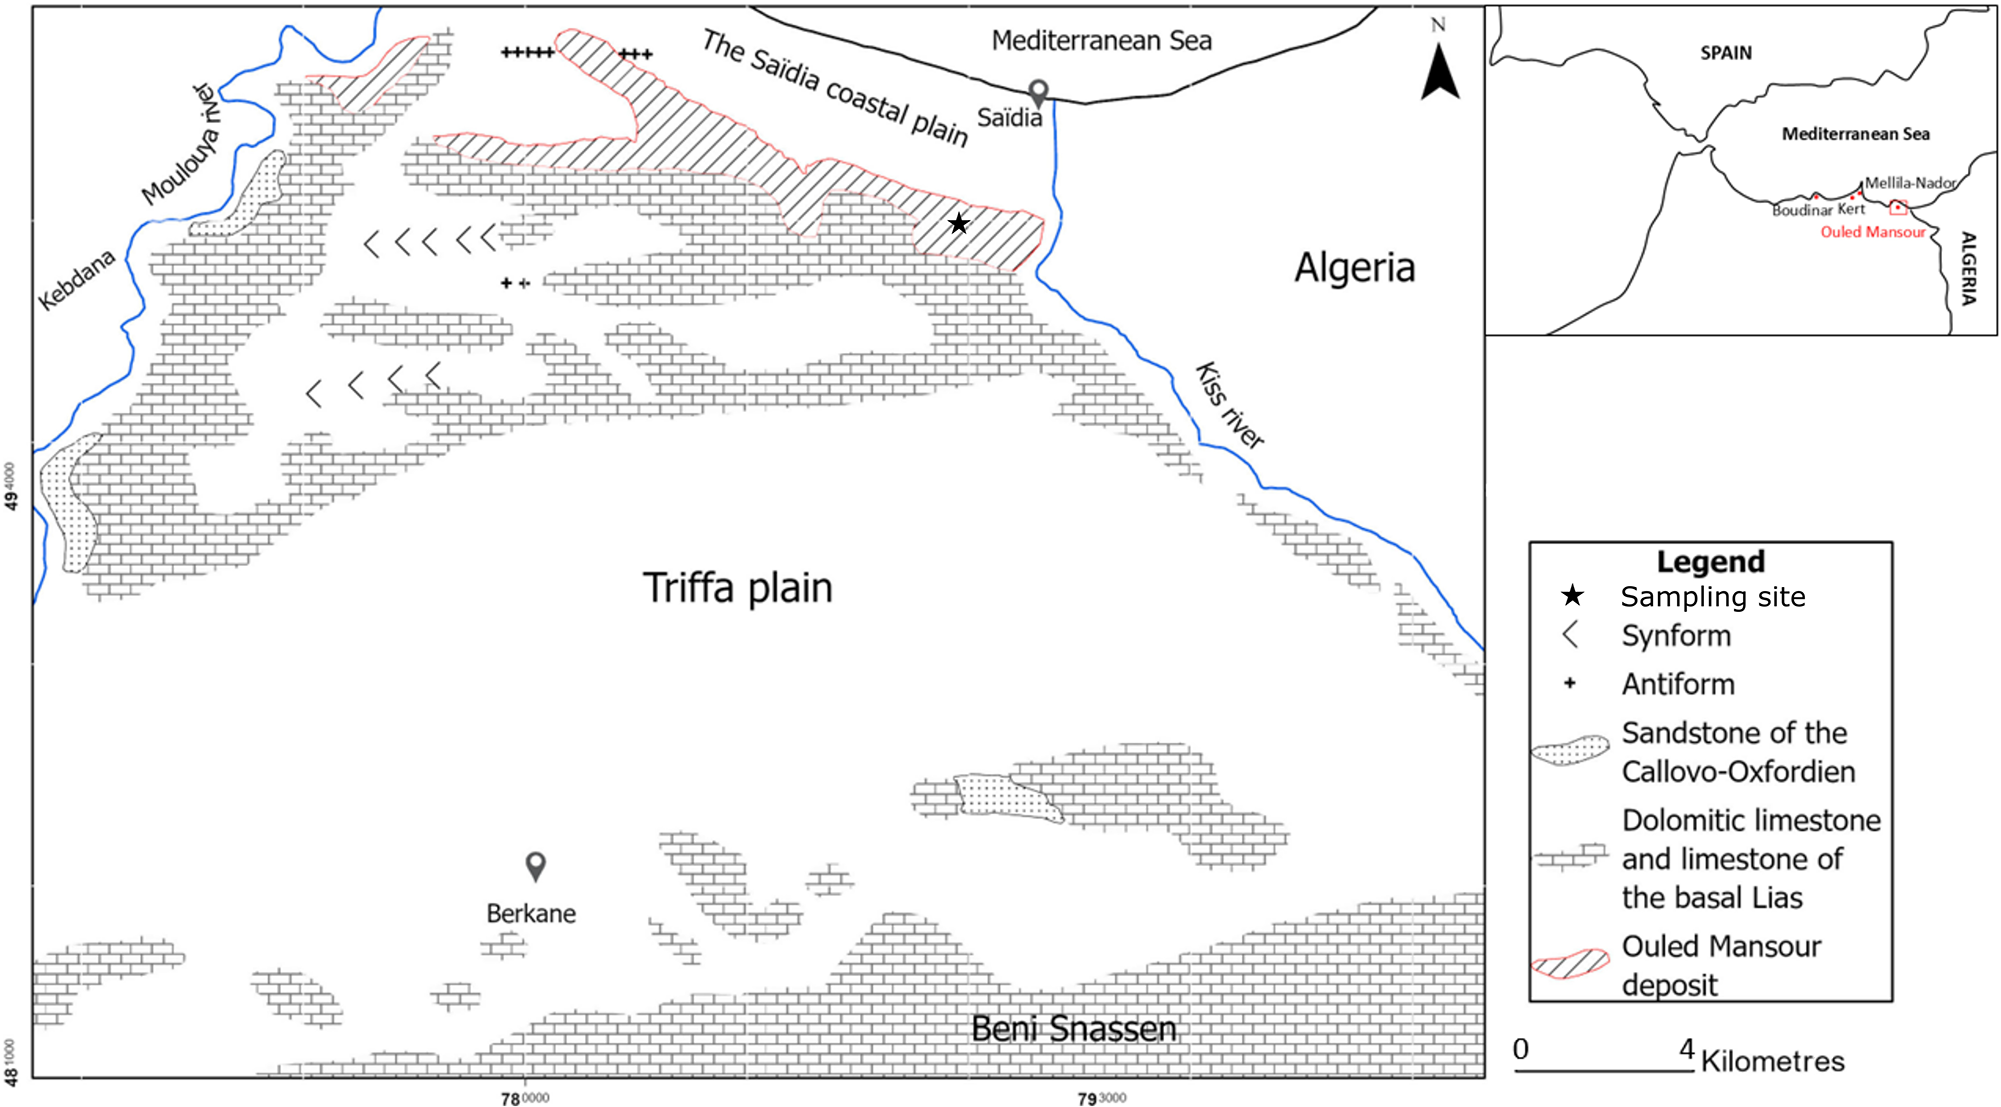
The undulating Ouled Mansour plateau (Fig. 1) comprises low ridges separated by elongated depressions. It forms the southern boundary of the Saidia coastal plain and the northern limit of the Triffa plain (Laouina, Reference Laouina1990; Carneiro et al., Reference Carneiro, Boughriba, Correia, Zarhloule, Rimi and Houadi2010). The Ouled Mansour hills consist of marly sediments, representing the main Neogene deposits in north-eastern Morocco, including those of Boudinar, Kert, Mellila-Nador and Kebdana (Houzay, Reference Houzay1975; Guillemin & Houzay, Reference Guillemin and Houzay1982; Barathon, Reference Barathon1989; Laouina, Reference Laouina1990; Kharim, Reference Kharim1991; Münch et al., Reference Münch, Roger, Cornée, Saint Martin, Féraud and Moussa2001; Carneiro et al., Reference Carneiro, Boughriba, Correia, Zarhloule, Rimi and Houadi2010; Nasri et al., Reference Nasri, Elhammouti, Azdimousa, Achalhi and Bengamra2016, Reference Nasri, Azdimousa, El Hammouti, El Haddar and El Ouahabi2019).
Simplified geological map of the study area (modified from Fetouani et al., Reference Fetouani, Sbaa and Vanclooster2008).

Figure 1 Long description
Geological map of northeastern Morocco detailing various rock formations and geological structures. The map highlights the Triffa plain, bordered by the Saidia coastal plain to the north and Ben Snassen to the south. Key features include synforms and antiforms, marked by arrows and different rock types such as sandstone of the Callovo-Oxfordian, dolomitic limestone and limestone of the basal Lias. The Ouled Mansour deposit is indicated with a red pattern. Sampling sites are marked with stars. The inset map shows the location of the study area in relation to the Mediterranean Sea and Algeria. The legend explains symbols for geological features and rock types. The map scale is 0 to 4 kilometers.
The Neogene in north-east Morocco was also marked by a tectonic extensional phase followed by a compressional phase (Barathon, Reference Barathon1989). The Ouled Mansour horst corresponds to a flexural uplift of sedimentary layers, which explains the lagoonal to shallow-marine nature of these deposits. The plateau surface rises eastward, overlooking the Kiss border valley by ∼170 m, and westward towards hills bordering the Moulouya River. Maximum elevation reaches ∼190 m (Barathon, Reference Barathon1989; Laouina, Reference Laouina1990). Neogene sedimentation in north-eastern Morocco began in the late Tortonian (Barathon, Reference Barathon1989; Kharim, Reference Kharim1991; Boubkari et al., Reference Boubkari, Achalhi, Raji, Ouabid, Bodinier, El Kati and El Messbahi2022), while Ouled Mansour marls are of Miocene and Pliocene age (Carneiro et al., Reference Carneiro, Boughriba, Correia, Zarhloule, Rimi and Houadi2010). The deposit comprises blue/green marls near the top, overlain by green marls interbedded with yellow/brown calcareous sandstones, and basal conglomerates with rounded pebbles in soft, sandy or chalky cement (Grari et al., Reference Grari, Chourak, Boushaba, Cherif and Alonso2019). Three representative green marl samples (S1, S2 and S3) were collected from the top, middle and bottom of the deposit, respectively, after removing the weathered surface layer.
Methods
Raw material characterization
X-ray diffraction (XRD) analyses were performed on bulk samples and orientated aggregates using a Bruker D8-Advance diffractometer with Cu-Kα₁ radiation (λ = 1.542 Å) at the Department of Chemistry, University Mohammed First (Morocco), to determine the mineralogical composition. Bulk samples were prepared according to Moore & Reynolds (Reference Moore and Reynolds1997). Orientated aggregates were prepared from the <2 μm clay fraction through three preparations: air dried (AD), after solvation with ethylene glycol for 24 h (EG) and after heating at 500°C for 4 h (H). The obtained XRD traces were manually processed using the Joint Committee on Powder Diffraction Standards (JCPDS)–International Centre for Diffraction Data (ICDD) diffraction files and EVA® Bruker software. The quantitative estimation of the bulk and clay fraction mineralogy was performed by using TOPAS® Bruker software.
The chemical composition was determined by X-ray fluorescence (XRF) using a Thermo Fisher ARL Perform’X spectrometer after heating the samples at 1000°C for 2 h to determine the loss on ignition (LOI) at the Laboratory of Magmatic Petrology, University of Liege (Belgium).
Fourier-transform infrared (FTIR) spectroscopy was carried out using a Shimadzu FT-IR-8400S spectrometer in the range 400–4000 cm⁻1 at the Department of Chemistry, University Mohammed First (Morocco). Simultaneous thermal analysis (STA) was performed under atmospheric conditions using a TGA/DSC 3+ Mettler Toledo analyser up to 1200°C with a heating rate of 10°C min–1 (Laboratoire Argiles, Géochimie et Environnements Sédimentaires, University of Liege, Belgium).
The particle-size distribution analysis was performed using a Malvern Mastersizer 2000 laser diffraction analyser at the Department of Chemistry, University of Liege (Belgium). Approximately 1 g of bulk sample was suspended in distilled water and then introduced into the instrument, which operated at a rotation speed of 2000 rpm.
Atterberg limits, including the liquid limit (LL) and plastic limit (PL), were determined following the Casagrande method in accordance with the NF P 94-051 standard (AFNOR, 1993). The plasticity index (PI) was calculated as the difference between LL and PL at the Laboratory of Applied Geosciences, University Mohammed First (Morocco).
Brick preparation and characterization
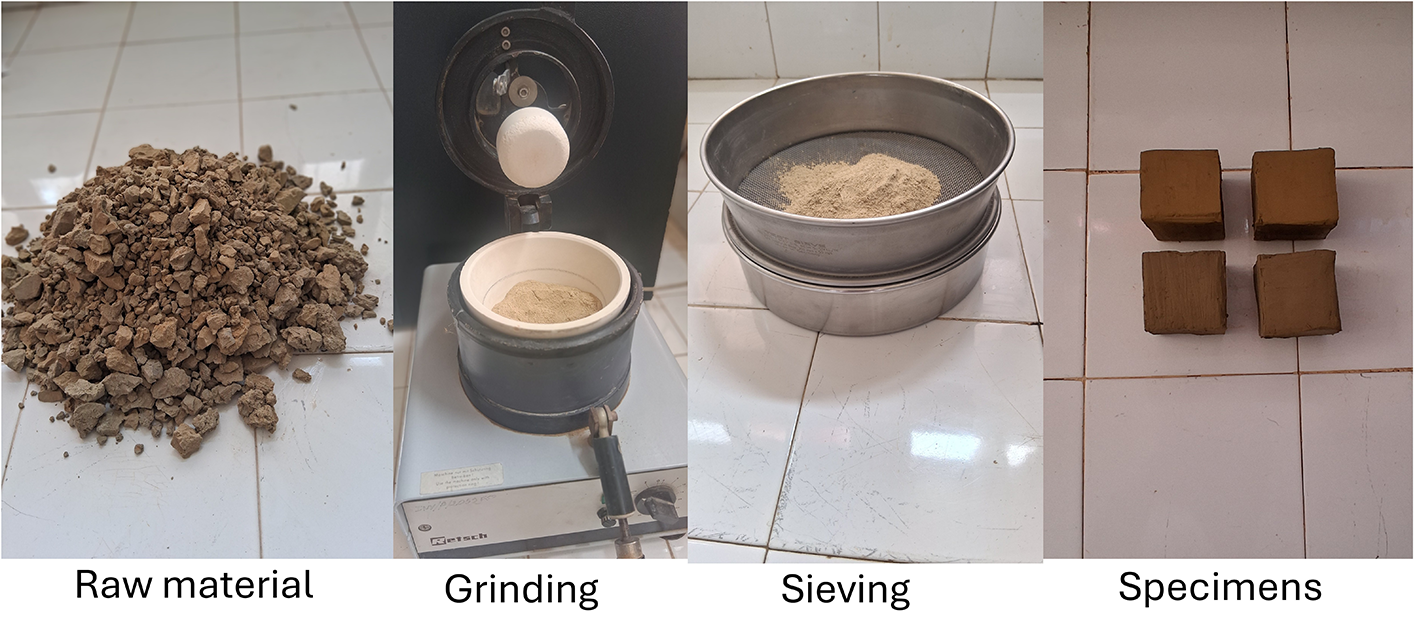
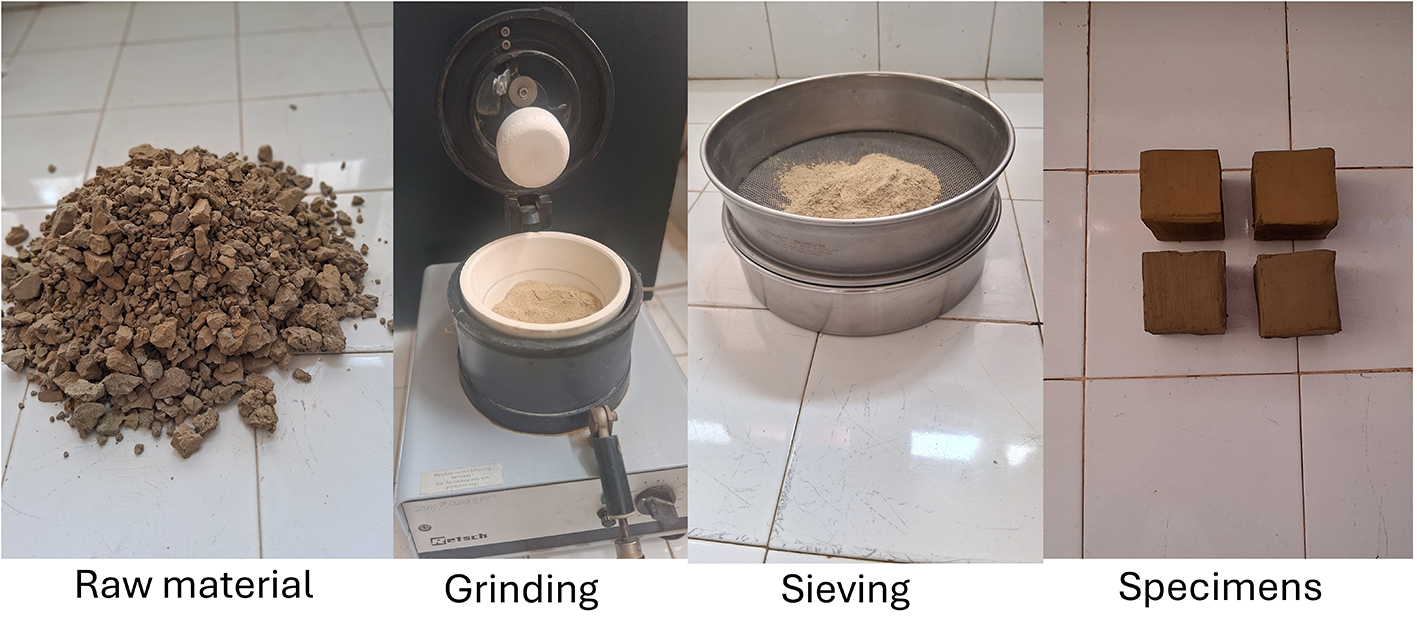
The raw materials were initially mixed, ground and passed through a 1 mm sieve. The sieved material was then mixed with distilled water at 30 wt.% of the dry raw material to obtain a homogeneous and plastic paste. This paste was manually shaped into 50 × 50 × 50 mm3 cubic moulds. The preparation procedure is illustrated in Fig. 2.
Preparation procedure of the specimens.
The prepared specimens were first air-dried for 24 h and then dried at 70°C in a Binder E28 WTC oven until constant weight was achieved. The dried specimens were subsequently fired using direct and stepped processes at 770°C and 870°C in a Magmatherm MT 1100 furnace.
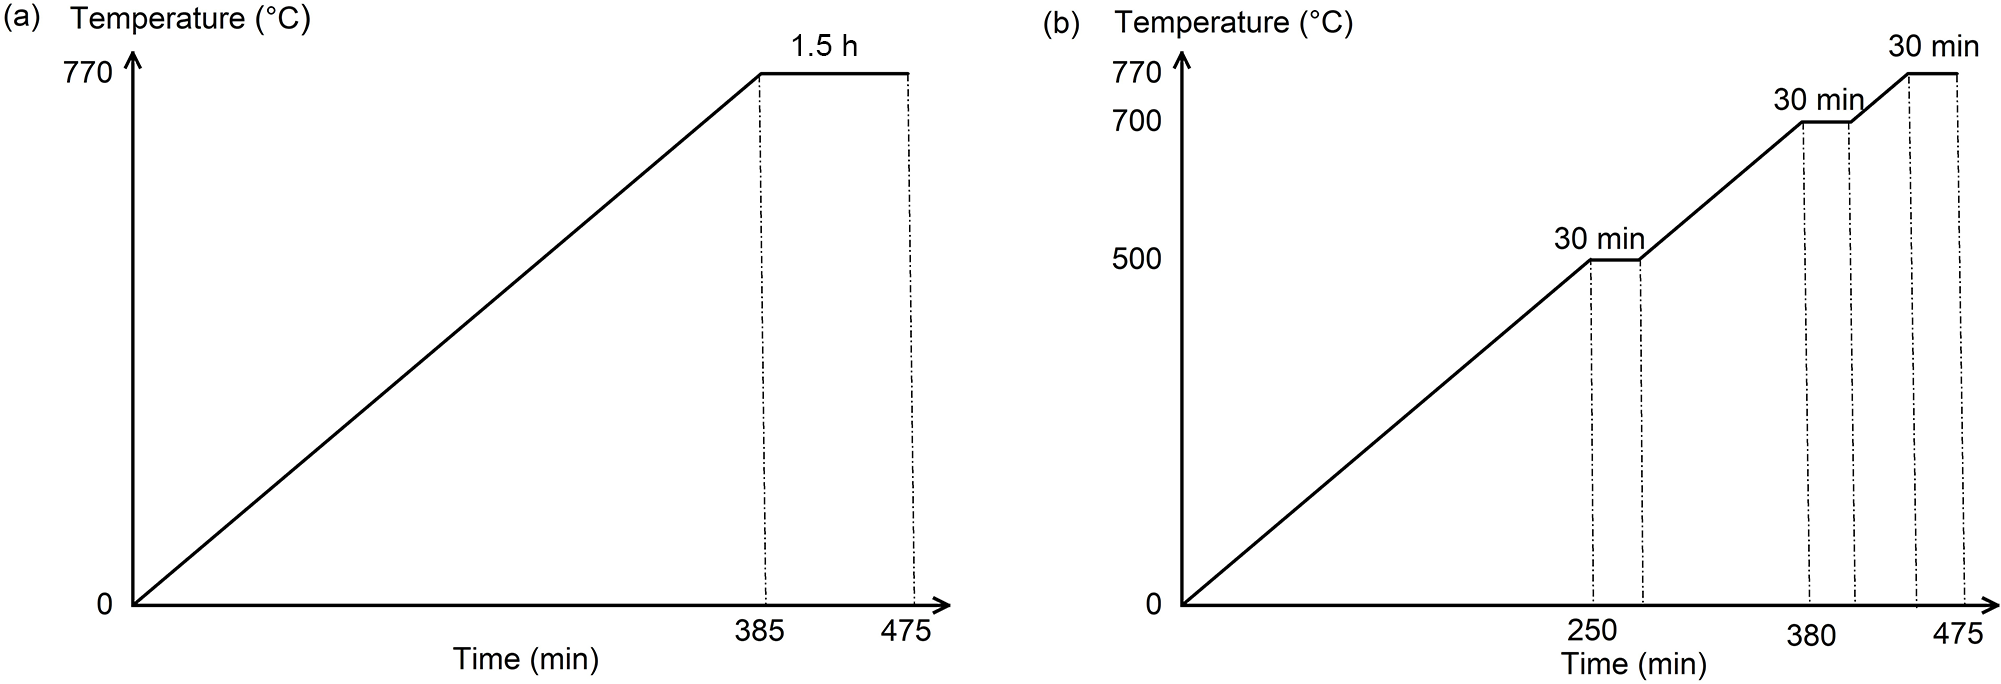
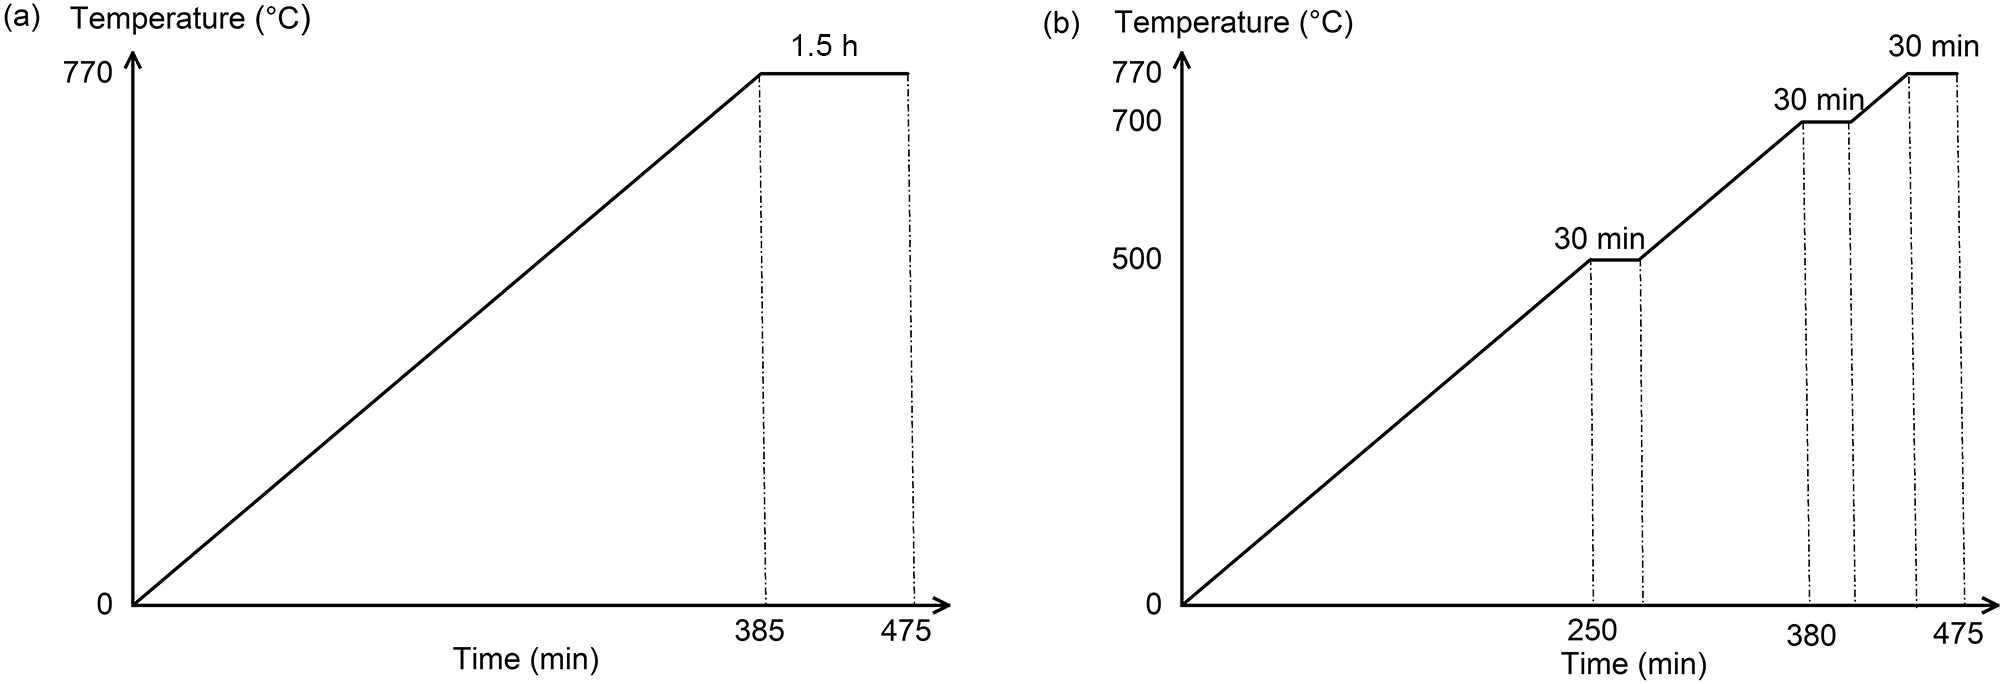
In the direct firing process, the temperature continuously increased to target temperatures of 770°C and 870°C, with a soaking time of 1.5 h (770D and 870D, respectively). In the stepped firing process, two intermediate steps were applied at 500°C and 700°C before reaching the maximum temperature (770S and 870S, respectively). The soaking time at each firing stage and at the target temperature was 30 min (Fig. 3). The heating rate for both firing processes was 2°C min–1. In the direct process, firing is continuous without intermediate stages, and the materials were maintained for a longer period at high temperatures, in contrast to the stepped process, which helps to reduce energy consumption. For each firing process, 10 bricks were prepared and characterized, and the average values are reported.
Schematic representation of the firing procedure at 770°C: (a) direct process and (b) stepped process.
The fired brick specimens were characterized for their microstructural, mineralogical, physical, thermal and mechanical properties. Non-destructive tests were also performed. Apparent porosity, water absorption and density were measured in accordance with the ASTM C373-88 standard (ASTM, 2006). Compressive strength was determined using a Controls Pilot Pro testing machine in accordance with EN 772-1 (AFNOR, 2015) at the Laboratory of Applied Geosciences, University Mohammed First (Morocco).
To evaluate the thermal insulation performance of the specimens, thermophysical characterization was conducted using the hot disk method according to ISO 22007-2 (ISO, 2008), at the Laboratory of Mechanics and Energy, University Mohammed First (Morocco). Thermal conductivity and thermal diffusivity were measured using a Transient Plane Source (TPS 2200) apparatus.
Non-destructive characterization by UPV testing was performed using a Karl Deutsch 1085 ultrasonic flaw detector echograph equipped with a 2 MHz transducer, in accordance with the ASTM C597 standard (ASTM, 1998), at the Laboratory of Industrial and Engineering, University Mohammed First (Morocco). This method is based on the propagation of ultrasonic waves through a material to assess its durability. It enables the measurement of the UPV (m s–1) and the detection of internal defects in specimens.
This method relies on the emission and reception of mechanical waves propagating through the material. Waves are emitted by a transducer, and the received signals are displayed as echograms on the equipment screen. UPV testing has been widely used to evaluate the quality of concrete for over 60 years (Naik et al., Reference Naik, Malhotra and J.S2003). It has also been applied to composites (Brancheriau, Reference Brancheriau2013; Rachidi et al., Reference Rachidi, Elkihel, Delaunois and Deschuyteneer2019), steel (Bakdid et al., Reference Bakdid, El Kihel, Delaunois and Nougaoui2016, Reference Bakdid, El Kihel, Nougaoui and Delaunois2019), wooden materials (Brancheriau, Reference Brancheriau2013), concrete (Bogas et al., Reference Bogas, Gomes and Gomes2013), blocks and bricks (Koroth et al., Reference Koroth, Fazio and Feldman1998; Sathiparan et al., Reference Sathiparan, Jayasundara, Samarakoon and Banujan2023), as well as in bearing defect detection in rotating machinery (Anouar et al., Reference Anouar, Elamrani, Elkihel, Delaunois and Electronique2017).
Defects were analysed through echograms displayed on the apparatus screen. Ultrasound velocity was calculated using Equation 1:
 \begin{equation}v = \frac{{2e}}{{\Delta t}}\end{equation}
where e is the specimen thickness (m) and Δt is the wave transit time (s).
Rebound hardness was assessed using a Schmidt hammer (type N) to determine the rebound value (R), following the ASTM C805 standard (ASTM, 1994), at the Laboratory of Applied Geosciences, University Mohammed First (Morocco). This non-destructive test, primarily used for concrete and rock, has been increasingly applied in brick hardness assessment (Debailleux, Reference Debailleux2019). It measures the mean rebound value (R) of a sample, which reflects surface resistance to successive impacts from the hammer plunger tip (Aydin & Basu, Reference Aydin and Basu2005). This method provides an approximate estimate of the compressive strength of materials. It also allows monitoring of material quality and of the evolution of their performance after construction, as they are subjected to various degradation factors. While commonly applied to concrete (Shariati et al., Reference Shariati, Ramli-Sulong, Mohammad Mehdi Arabnejad, Shafigh and Sinaei2011; Jain et al., Reference Jain, Kathuria, Kumar, Verma and Murari2013; Sanchez & Tarranza, Reference Sanchez and Tarranza2015) and rocks (Aydin & Basu, Reference Aydin and Basu2005; Yagiz, Reference Yagiz2009; Karaman & Kesimal, Reference Karaman and Kesimal2015), with established calibration diagrams for mechanical properties, its use in masonry remains limited (Debailleux, Reference Debailleux2019; Brencich et al., Reference Brencich, Dawid, Matysek, Orban and Sterpi2021; Gambilongo et al., Reference Gambilongo, Barontini, Silva and Lourenço2023). However, correlation equations have been developed to estimate brick compressive strength from rebound values (Brozovsky, Reference Brozovsky2014; Roknuzzaman et al., Reference Roknuzzaman, Hossain, Mostazid and Haque2017; Brencich et al., Reference Brencich, Dawid, Matysek, Orban and Sterpi2021).
Mineralogical transformations during firing were monitored by XRD analysis at the Department of Chemistry, University Mohammed First (Morocco), and microstructure was examined using a scanning electron microscope (SEM; HIROX SH-5500P, 10 kV) at University Mohammed First (Morocco).
Results and discussion
Raw material characterization
Mineralogical and chemical composition
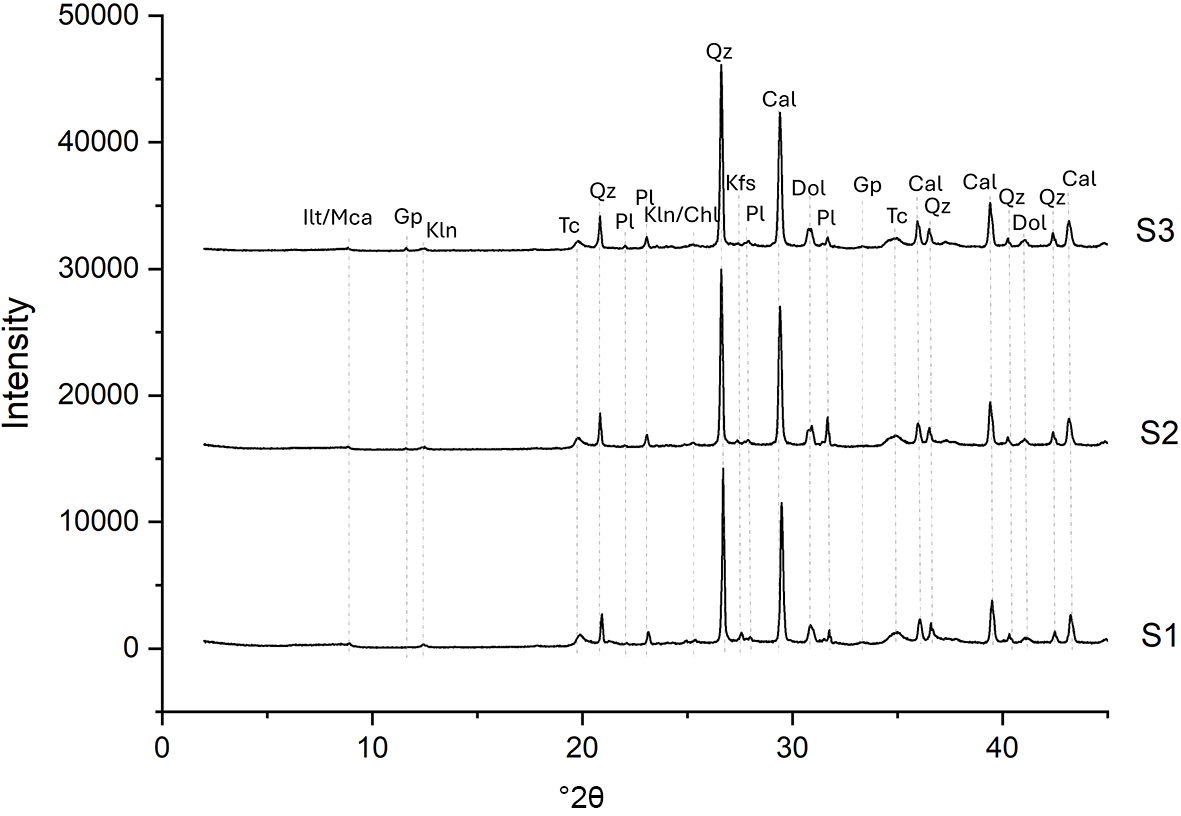
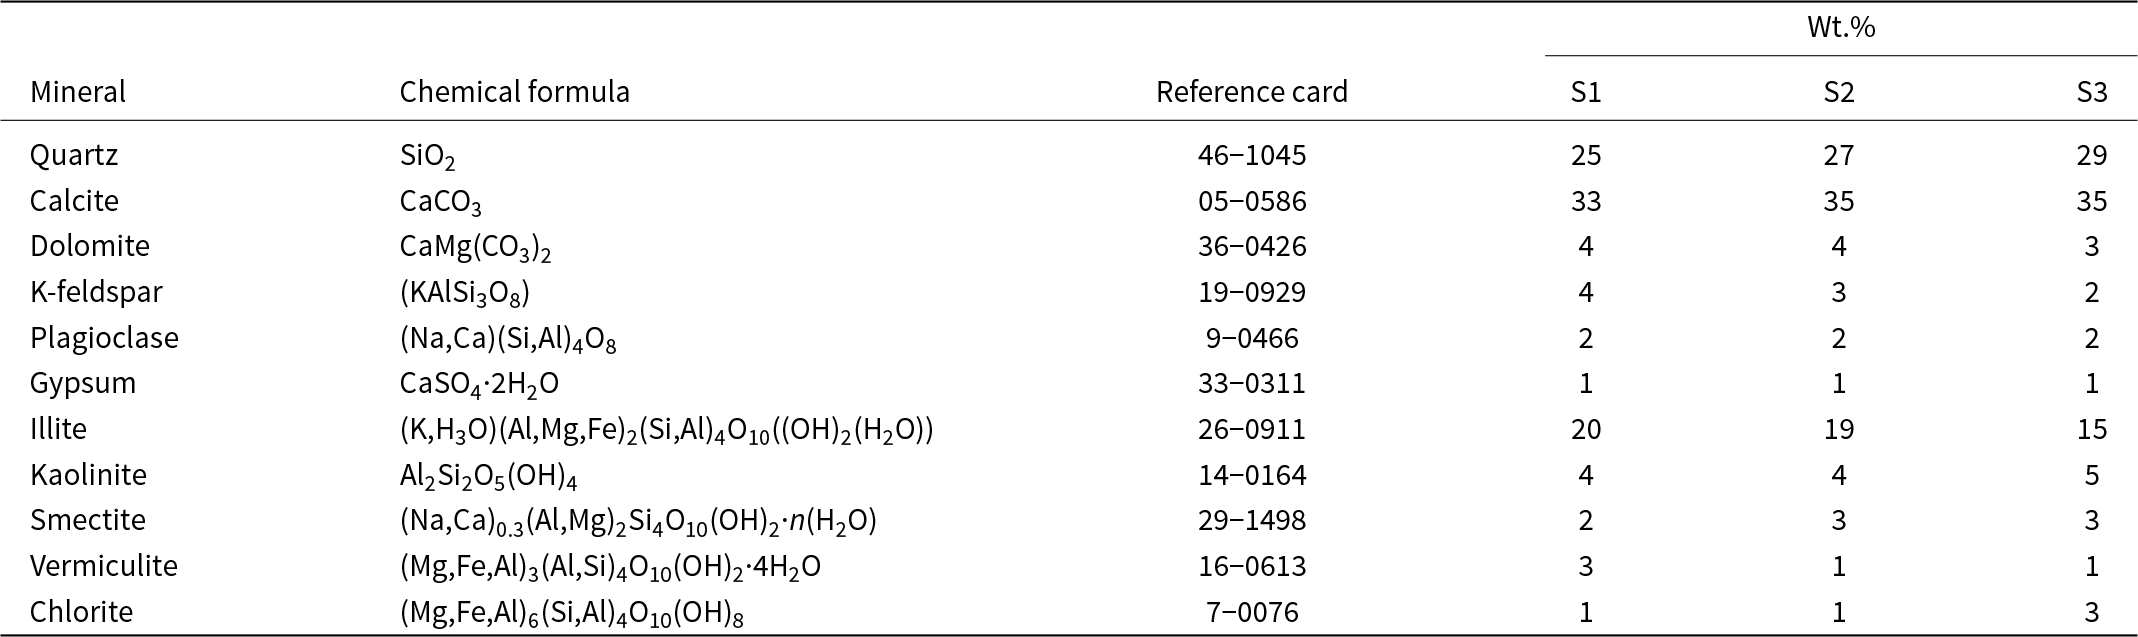
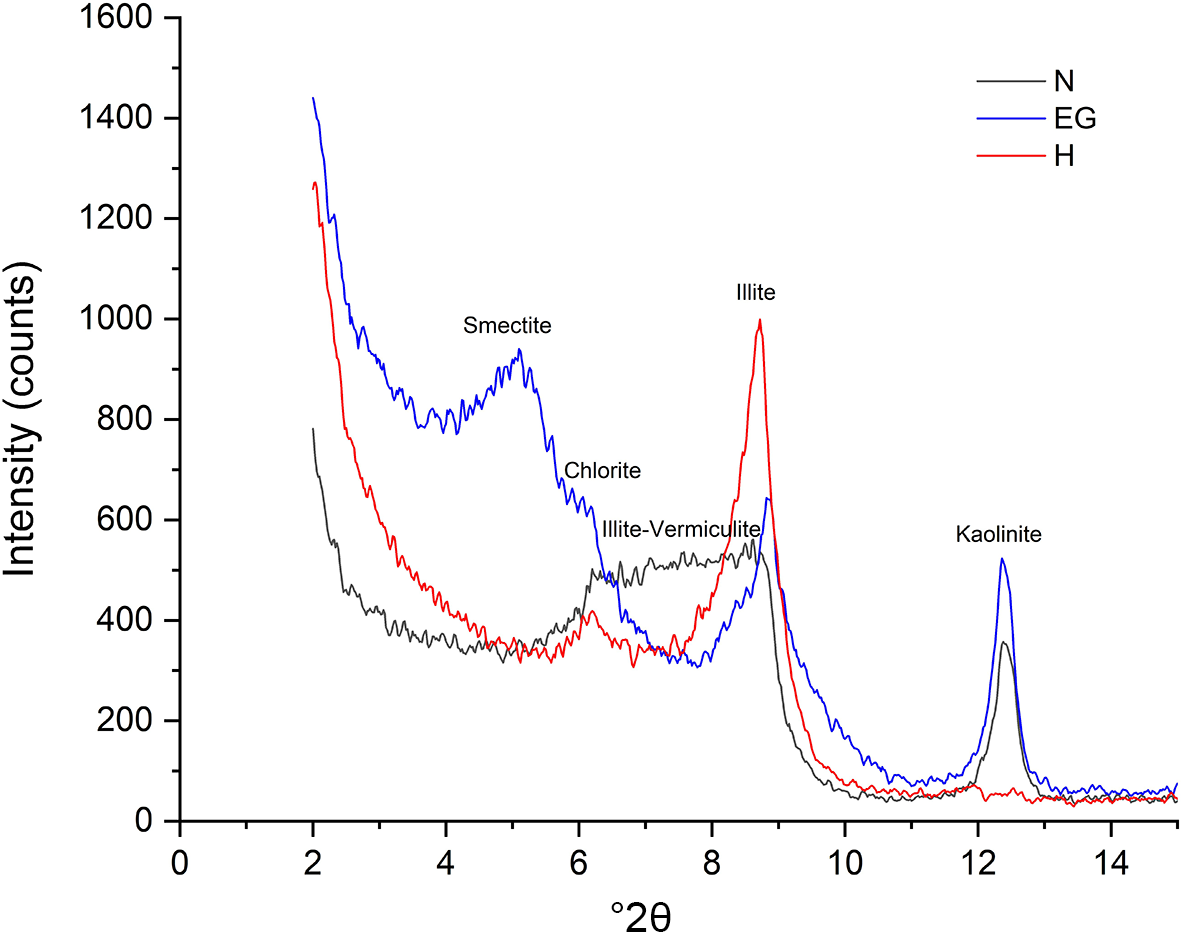
The XRD traces show a similar mineralogical composition to the studied clayey samples (Fig. 4 & Table 1). The major phases include quartz (25–29 wt.%), calcite (33–35 wt.%) and dolomite (∼4 wt.%). The principal clay minerals (Fig. 5 & Table 1) are illite (15–20 wt.%) and kaolinite (4–5 wt.%), with traces of smectite, vermiculite and chlorite (≤3 wt.%). The raw clay materials used in brick production are predominantly illitic and kaolinitic, with occasional traces of chlorite, whereas smectite is rarely present or occurs in limited amounts. Quartz and calcite are the most common accessory phases (El Yakoubi et al., Reference El Yakoubi, Aberkan and Ouadia2006; El Qandil, Reference El Qandil2007; El Ouahabi et al., Reference El Ouahabi, Daoudi and Fagel2014; Gharb & Ouazzani, Reference Gharb and Ouazzani2014; Baghdad et al., Reference Baghdad, Bouazi, Bouftouha, Bouabsa and Fagel2017; Laibi et al., Reference Laibi, Gomina, Sorgho, Sagbo, Blanchart, Boutouil and Sohounhloule2017; Tsozué et al., Reference Tsozué, Nzeugang, Mache, Loweh and Fagel2017; Aghayev & Küçükuysal, Reference Aghayev and Küçükuysal2018; Bomeni et al., Reference Bomeni, Njoya, Ngapgue, Wouatong, Yongue Fouateu, Kamgang Kabeyene and Fagel2018; El Idrissi et al., Reference El Boudour El Idrissi, Daoudi, El Ouahabi, Collin and Fagel2018; Nasri et al., Reference Nasri, Azdimousa, El Hammouti, El Haddar and El Ouahabi2019; Kagonbé et al., Reference Kagonbé, Tsozué, Nzeukou and Ngos2021; Rahou et al., Reference Rahou, Rezqi, El Ouahabi and Fagel2022).
XRD traces of the raw materials. Cal = calcite; Chl = chlorite; Dol = dolomite; Gp = gypsum; Ilt = illite; Kfs = K-feldspar; Kln = kaolinite; Mca = mica; Pl = plagioclase; Qz = quartz; Tc = total clay minerals.
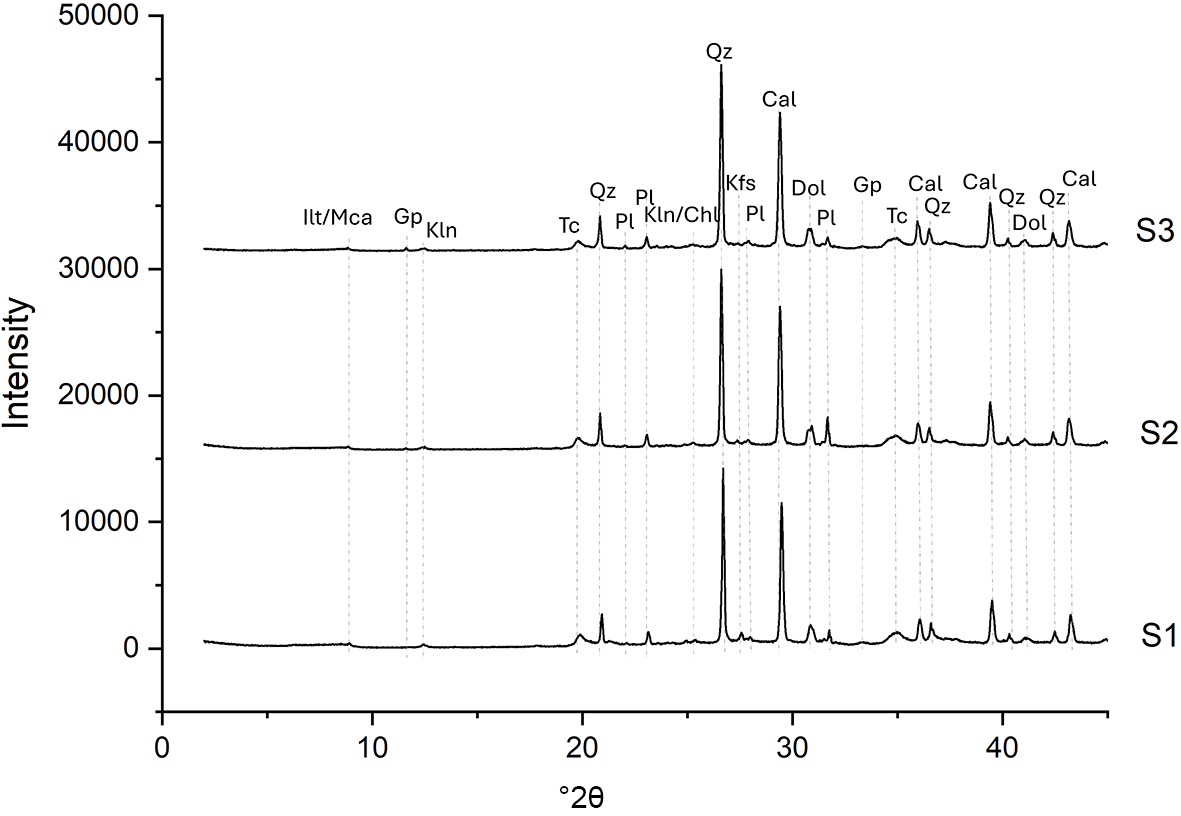
Figure 4 Long description
Intensity Three stacked line plots labeled S1, S2 and S3. The x-axis is labeled 2 theta (Cu K alpha), ranging from 0 to 45, with labeled ticks at 0, 10, 20, 30 and 40. The y-axis is labeled Intensity, ranging from 0 to 50000, with labeled ticks at 0, 10000, 20000, 30000, 40000 and 50000. S1 trace: A near-horizontal baseline with multiple narrow peaks. The tallest peak is near 30 on the 2 theta axis. Additional smaller peaks appear between about 20 and 45. S2 trace: A near-horizontal baseline above the S1 trace with multiple narrow peaks. The tallest peak is near 30 on the 2 theta axis. Additional smaller peaks appear between about 20 and 45. S3 trace: A near-horizontal baseline above the S2 trace with multiple narrow peaks. The tallest peak is near 30 on the 2 theta axis. Additional smaller peaks appear between about 20 and 45. Short text labels are placed above several peaks across the 2 theta range, including labels near the tallest peak around 30 and additional labels between about 20 and 45.
Mineralogical composition of the raw materials.
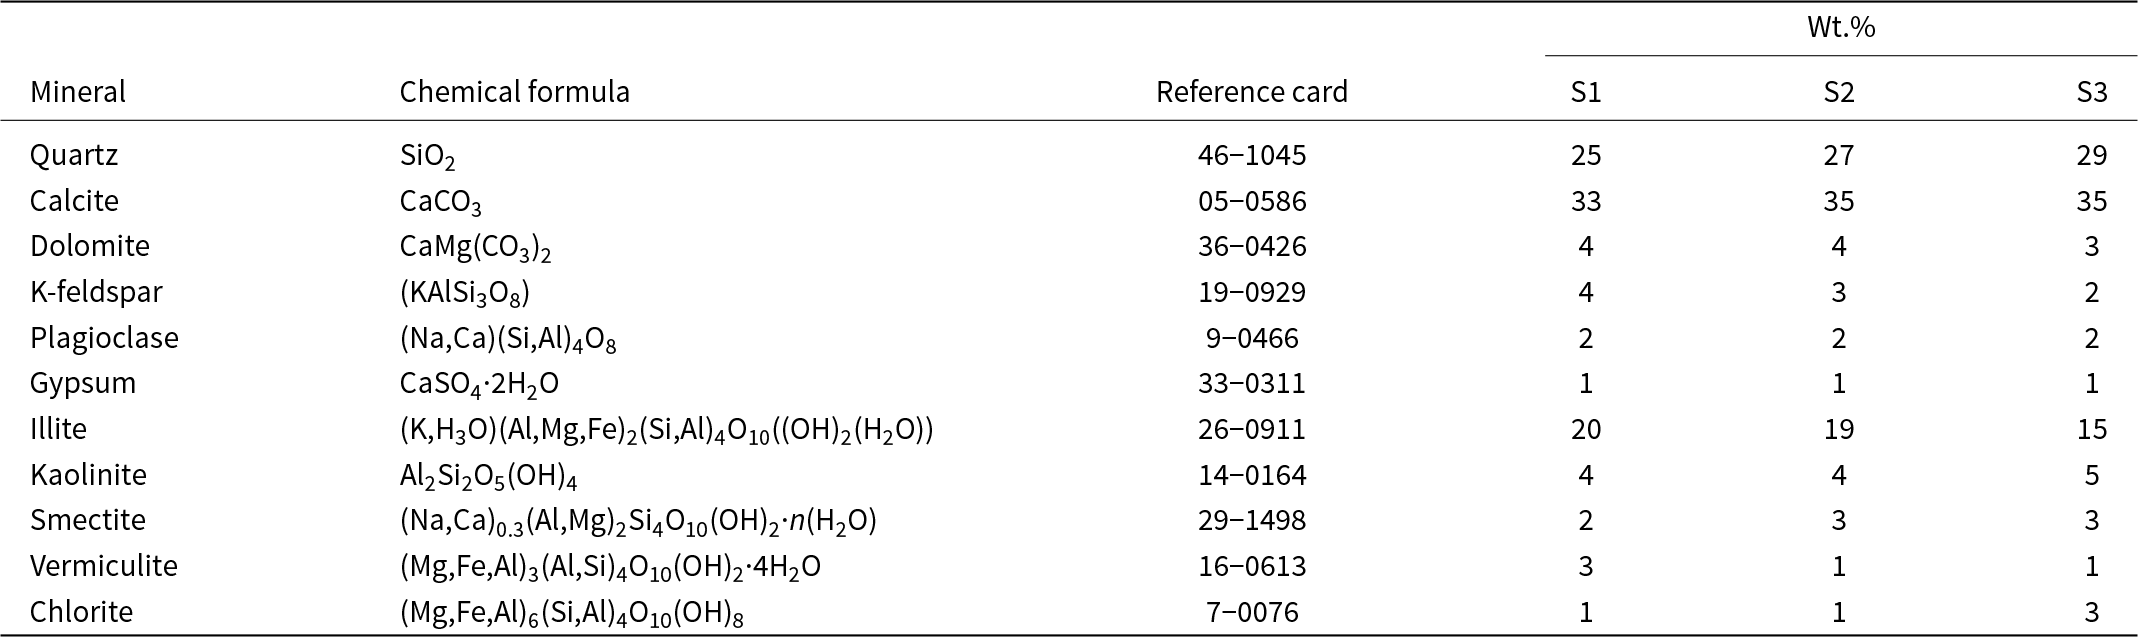
Table 1 Long description
Mineral weight percentages are listed for three raw-material samples labeled S1, S2, and S3, alongside each mineral’s chemical formula and reference card number. Calcite is the largest component in every sample at 33 percent in S1 and 35 percent in both S2 and S3. Quartz is the second-largest component, rising from 25 percent in S1 to 27 percent in S2 and 29 percent in S3. Illite is also substantial but decreases across samples, from 20 percent in S1 to 19 percent in S2 and 15 percent in S3. Most other minerals are minor, generally between 1 and 5 percent, including dolomite, K-feldspar, plagioclase, gypsum, kaolinite, smectite, vermiculite, and chlorite. Notable small shifts include vermiculite dropping from 3 percent in S1 to 1 percent in S2 and S3, and chlorite increasing to 3 percent in S3. Values are reported as weight percent and may not sum exactly to 100 due to rounding or unlisted phases.
XRD traces of the orientated aggregates performed on sample S3. EG = ethylene glycol-solvated; H = heated at 500°C; N = natural (air-dried).
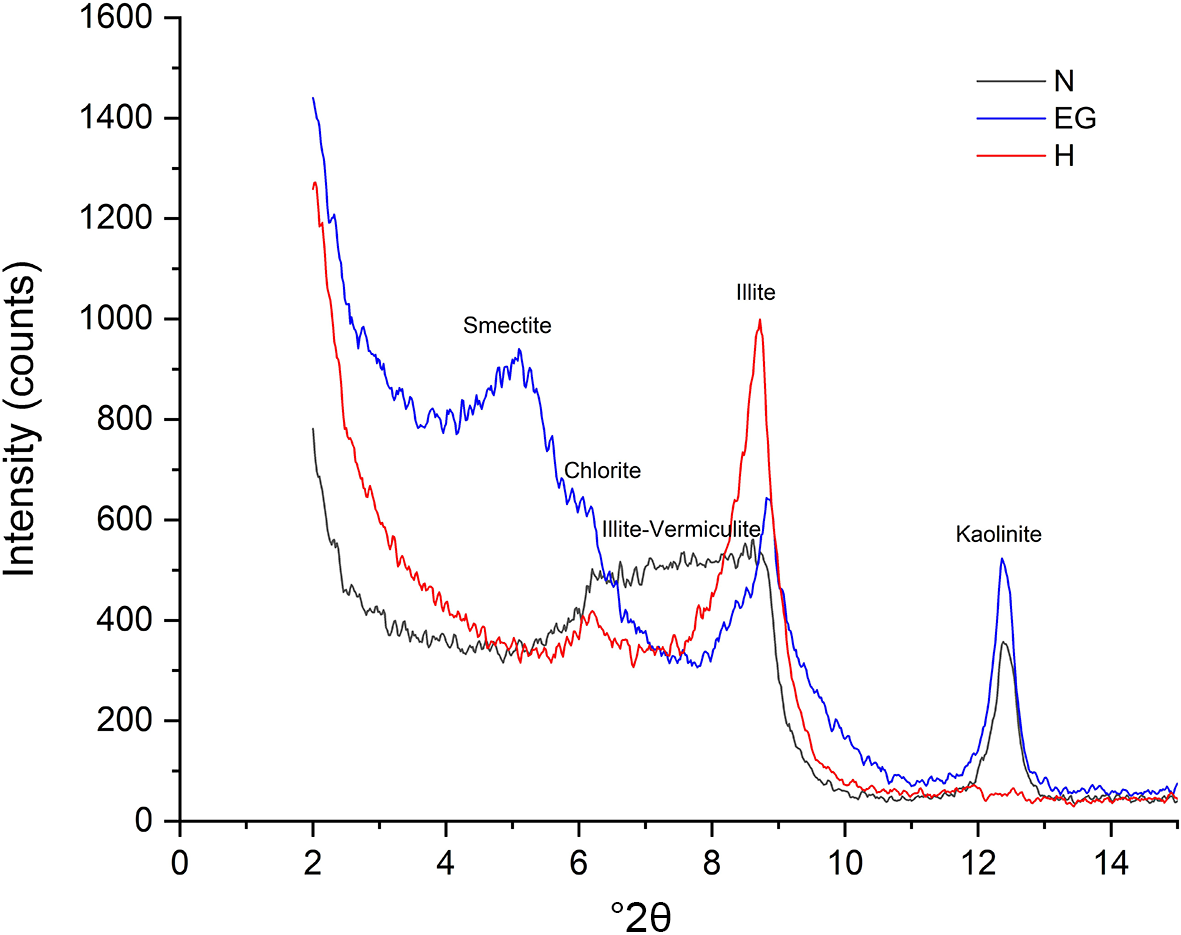
The mineralogical composition controls the characteristics of clays, as each component undergoes specific transformations during firing. Each phase reacts differently based on firing conditions and interactions with other components. These transformations significantly influence the properties of the final product.
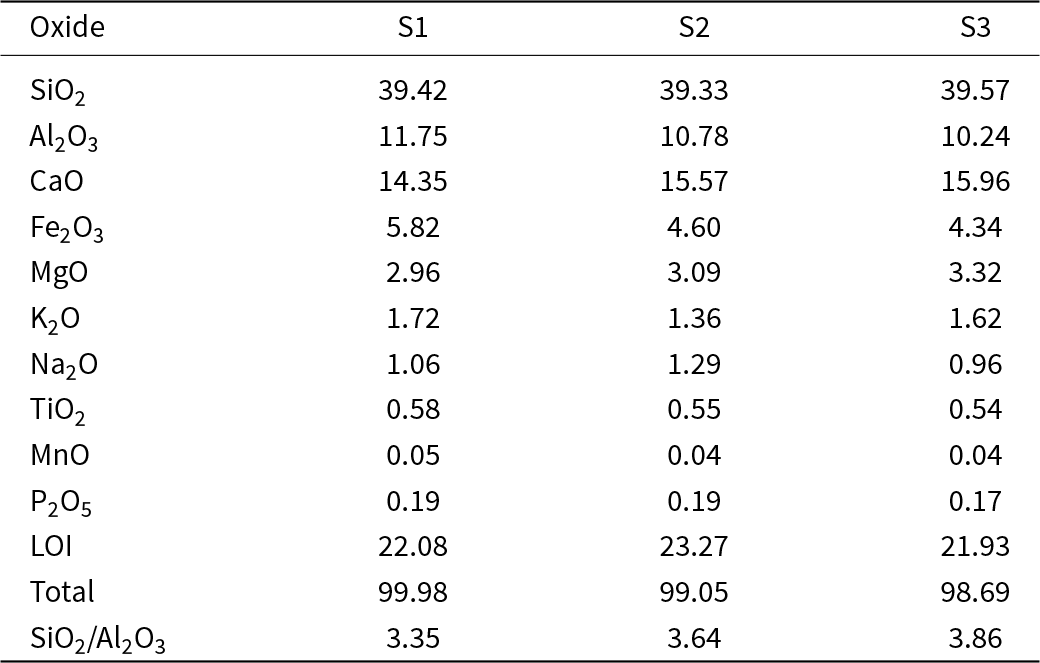
The chemical composition of the clay samples consists primarily of SiO2 (39–40 wt.%), Al2O3 (10–12 wt.%) and CaO (14–16 wt.%; Table 2). The Fe2O3 ranges from 4 to 6 wt.%. The high contents of Al2O3 and SiO2 are related to clay minerals and quartz, respectively.
Chemical composition of the raw clay materials (wt.%).
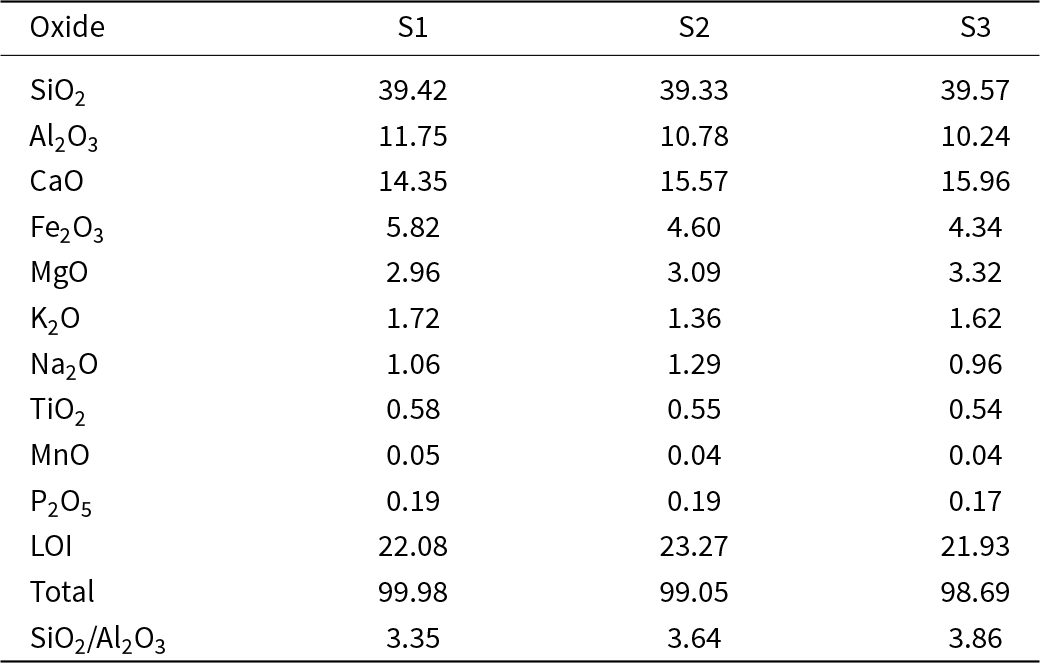
The SiO2/Al2O3 ratio exceeds 3 (average 3.61), which is within the typical range for common clays (2.85–4.09; Quiroga et al., Reference Quiroga, Giraldo-Gómez and N.R2018). This ratio reflects the predominance of clay minerals (Souza et al., Reference Souza, Sousa, Terrones and Holanda2005) and free quartz (Bennour et al., Reference Bennour, Mahmoudi, Srasra, Boussen and Htira2015; Boussen et al., Reference Boussen, Sghaier, Chaabani, Jamoussi and Bennour2016). The CaO and MgO contents are related to the presence of carbonates, particularly calcite and dolomite, which act as fluxes along with Na2O3 and K2O, promoting the formation of a glassy phase (Kazmi et al., Reference Kazmi, Abbas, Nehdi, Saleem and Munir2017). In high concentrations, Ca and Mg may also delay the sintering process (Dondi et al., Reference Dondi, Raimondo and Zanelli2014; Pardo et al., Reference Pardo, Jordan and Montero2018).
Iron oxides are responsible for the red colouration of ceramic pastes, originating from illite or chlorite, both of which may incorporate Fe cations (Kreimeyer, Reference Kreimeyer1987; Molera et al., Reference Molera, Pradell and Vendrell-Saz1998; Abajo, Reference Abajo2000). Previous studies indicate that clays containing more than 5 wt.% Fe2O3 typically fire red, whereas those with 1–5 wt.%, as in the studied samples (average Fe2O3 = 4.9 wt.%), tend to produce lighter colours (Murray, Reference Murray and Brindley2006; Dondi et al., Reference Dondi, Raimondo and Zanelli2014; Jordán et al., Reference Jordán, Meseguer, Pardo and Montero2015; Domínguez et al., Reference Domínguez, Dondi, Etcheverry, Recio and Iglesias2016).
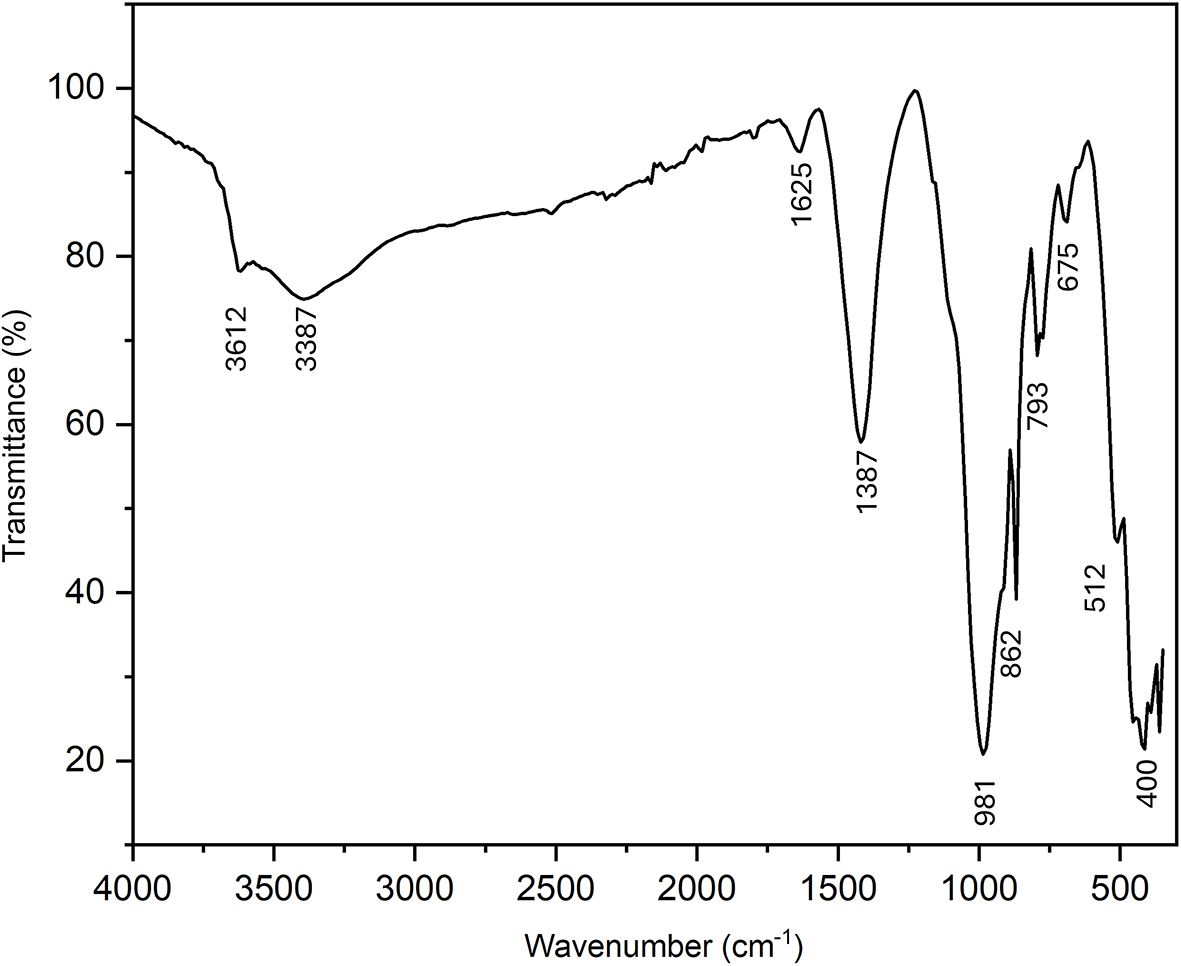
The infrared spectrum of the S3 sample is shown in Fig. 6, and it is presented as a representative example of the three studied samples, all of which exhibited similar spectral trends. The most intense bands occur between 3612 and 3387 cm–1, corresponding to OH stretching vibrations of the clay minerals. The band at 3612 cm–1 is attributed to kaolinite, while that at 3387 cm–1 relates to OH stretching of adsorbed water on clay minerals (Brindley et al., Reference Brindley, Kao, Harrison, Lipsicas and Raythatha1986; Qtaitat & Al-Trawneh, Reference Qtaitat and I.N2005; Saikia & Parthasarathy, Reference Saikia and Parthasarathy2010).
FTIR spectrum of the S3 sample.

The absorption near 981 cm–1 corresponds to Al–Al–OH bending vibrations of the clay minerals (De Almeida Azzi et al., Reference De Almeida Azzi, Osacký, Uhlík, Čaplovičová, Zanardo and Madejová2016). The band at 1625 cm–1 is attributed to the H–O–H bending vibration of water (Saikia & Parthasarathy, Reference Saikia and Parthasarathy2010). The bands at 1387 and 862 cm–1 are assigned to the C–O vibrations of carbonates (Russell & Fraser, Reference Russell and A.R1962). The bands at 793 and 400 cm–1 correspond to Si–O stretching vibrations of quartz (Russell & Fraser, Reference Russell and A.R1962; Saikia & Parthasarathy, Reference Saikia and Parthasarathy2010; De Almeida Azzi et al., Reference De Almeida Azzi, Osacký, Uhlík, Čaplovičová, Zanardo and Madejová2016). The band at 675 cm–1 relates to Si–O–Si bending of clay minerals (Saikia & Parthasarathy, Reference Saikia and Parthasarathy2010). The band at 512 cm–1 corresponds to Si–O–Al bending vibrations (Bich et al., Reference Bich, Ambroise and Péra2009; De Almeida Azzi et al., Reference De Almeida Azzi, Osacký, Uhlík, Čaplovičová, Zanardo and Madejová2016). The FTIR spectroscopy results are consistent with the XRD analysis and confirm the presence of clay minerals, quartz and carbonates as the main components of the studied clayey samples.
Physical properties
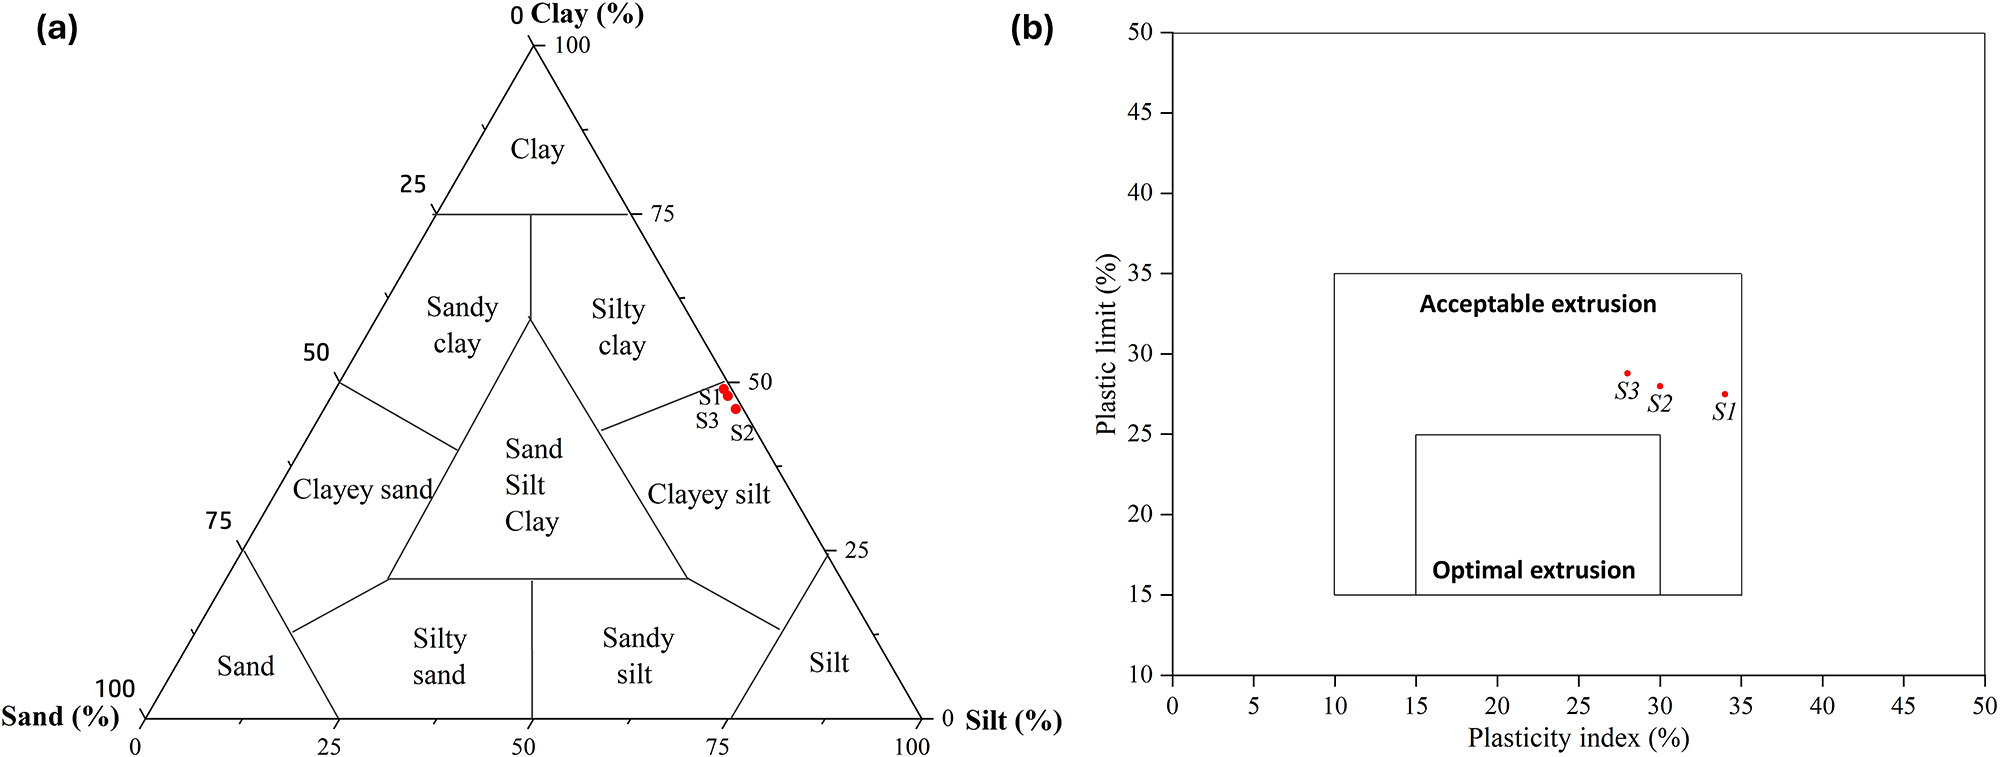
The grain-size distribution analysis classifies the studied samples as clayey silt (Shepard, Reference Shepard1954), with minor sand content (≤1 wt.%; Fig. 7 & Table 3). The clay fraction ranges from 46 to 49 wt.%, while the silt fraction varies from 50 to 53 wt.%. Minor variations in particle-size distribution are observed among the samples. The average values of clay, silt and sand are 48, 51 and 1 wt.%, respectively.
Projection of raw materials (a) on the Shepard diagram (Shepard, Reference Shepard1954) and (b) on a workability chart (Bain, Reference Bain1987).
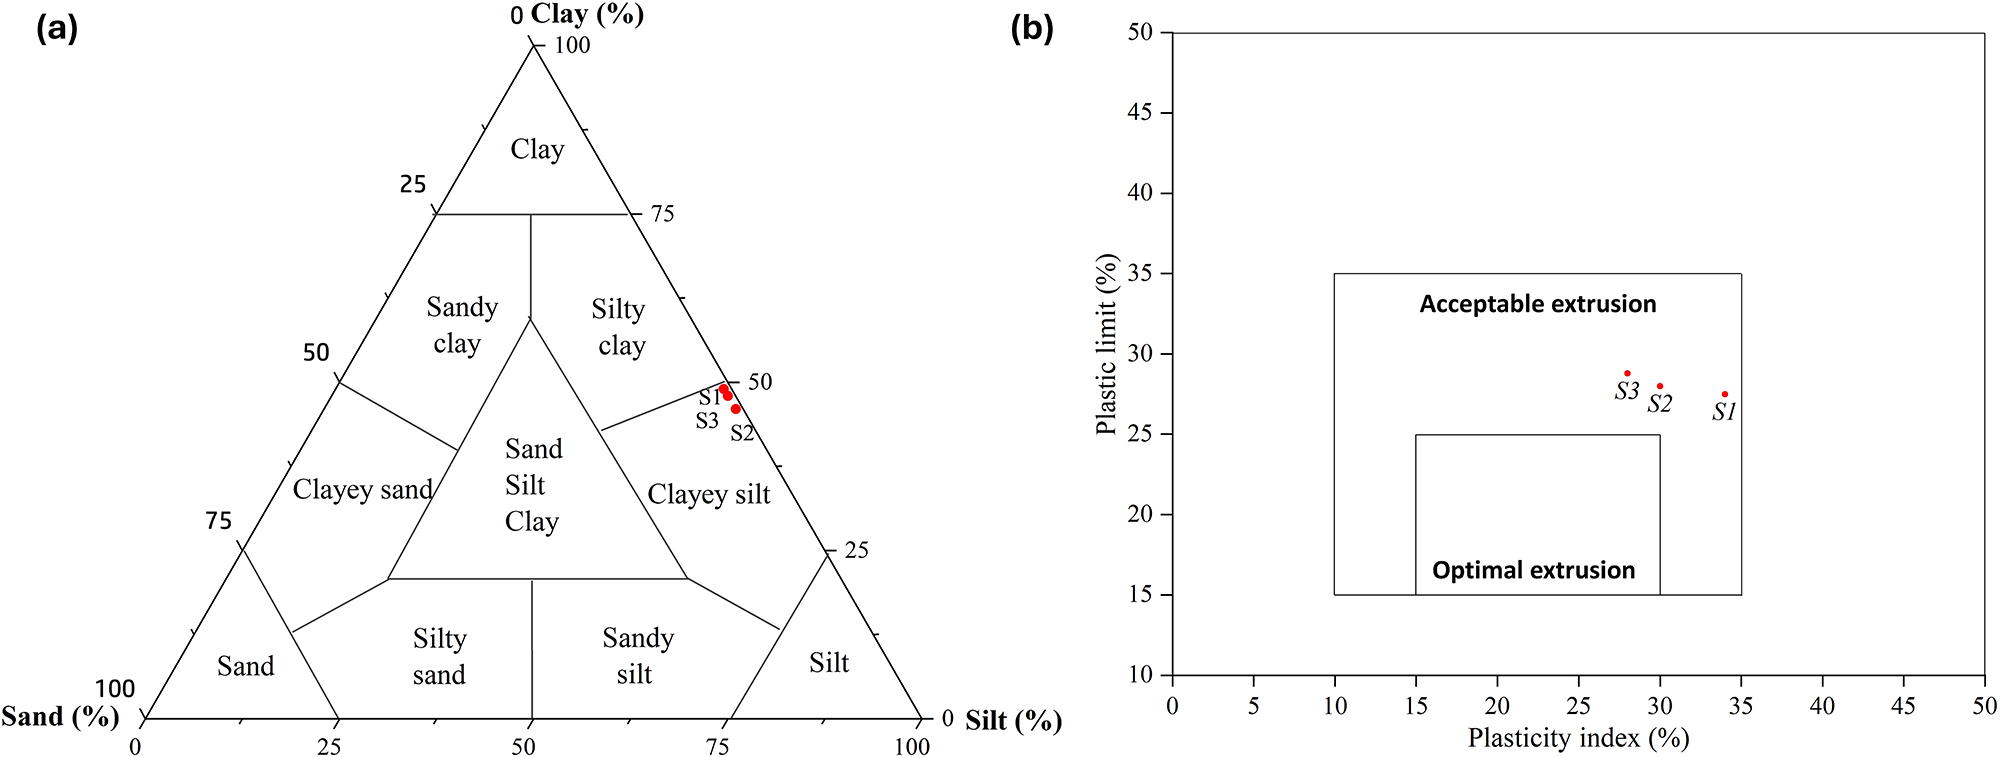
Figure 7 Long description
The image A showing a triangular ternary plot with axis labels Clay percent, Sand percent and Silt percent. Tick labels visible include 25, 50 and 75 on the triangle edges, with 0 and 100 at the corners. Region labels inside the triangle include Clay, Sandy clay, Silty clay, Clayey sand, Sand clay, Sand, Silty sand, Sandy silt, Silt and Clayey silt. Three points are labeled S1, S2 and S3. S1 is plotted in the region labeled Silty clay. S2 is plotted in the region labeled Silty clay. S3 is plotted in the region labeled Silty clay. The image B showing a scatter plot with x-axis label Plasticity index percent and y-axis label Free silica percent. The x-axis has tick labels 0 to 45 in increments of 5. The y-axis has tick labels 0 to 50 in increments of 5. Two nested rectangular boxes are drawn. The larger box contains the text Acceptable extrusion. The smaller box contains the text Optimal extrusion. Three points are labeled S1, S2 and S3. All three points are plotted inside the larger Acceptable extrusion box and outside the smaller Optimal extrusion box. S1 is plotted at approximately Plasticity index 30 percent and Free silica 25 percent. S2 is plotted at approximately Plasticity index 30 percent and Free silica 25 percent. S3 is plotted at approximately Plasticity index 35 percent and Free silica 25 percent.
Grain-size distribution and Atterberg limits (wt.%) of the raw clay materials.

Grain-size distribution significantly influences material plasticity, affecting paste extrusion and shaping as well as permeability and porosity. According to McManus (Reference McManus and Tucker1988), the raw materials exhibit low permeability and porosity, indicating desirable workability and consistency (El Idrissi et al., Reference El Boudour El Idrissi, Daoudi, El Ouahabi, Collin and Fagel2018). Moreover, permeability and porosity are controlled by the Al2O3/SiO2 ratio, with lower ratios corresponding to reduced permeability (Jarraya et al., Reference Jarraya, Fourmentin and Benzina2010). This aligns with the observed low Al2O3/SiO2 values (0.86–0.89) in the studied samples.
The three samples S1, S2 and S3 exhibit a PI ranging from 28% to 34%, with a LL between 57% and 62% (Table 3). According to Holtz et al. (Reference Holtz, Kovacs and T.C1981), these values classify the studied samples as highly plastic. Furthermore, the samples demonstrate optimal extrusion properties, in agreement with Bain (Reference Bain1987) (Fig. 7). The plastic behaviour of these samples is closely influenced by geological origin, genesis, crystal order, non-clay mineral content, organic matter, initial moisture content and, most importantly, particle-size distribution and mineralogical composition (Hajjaji et al., Reference Hajjaji, Hachani, Moussi, Jeridi, Medhioub and López-Galindo2010; Andrade et al., Reference Andrade, Al-Qureshi and Hotza2011; El Ouahabi et al., Reference El Ouahabi, Daoudi and Fagel2014; Moreno-Maroto & Azcárate, Reference Moreno-Maroto and Alonso-Azcárate2018; Moussi et al., Reference Moussi, Hajjaji, Hachani, Hatira, Labrincha, Yans and Jamoussi2020).
Plastic clays typically contain either high amounts of low-plasticity clay minerals, including illite, chlorite and kaolinite, or low percentages of high-plasticity clay minerals such as smectite (Daoudi et al., Reference Daoudi, Knidiri, El Boudour El Idrissi, Rhouta and Fagel2015). The studied samples contain significant amounts of low-plasticity clay minerals (>24%) associated with 2–3% smectite. Furthermore, the clay fraction exceeds 46%, which explains the observed plasticity. The samples exhibit suitable plasticity for brick manufacturing. Extremely plastic clays require substantial water to form workable pastes due to their internal moisture gradients (Souza et al., Reference Souza, Teixeira, Santos and Longo2013), potentially causing considerable shrinking and deformation during drying and firing (Pracidelli & Melchiades, Reference Pracidelli and F.G1997).
Thermal properties
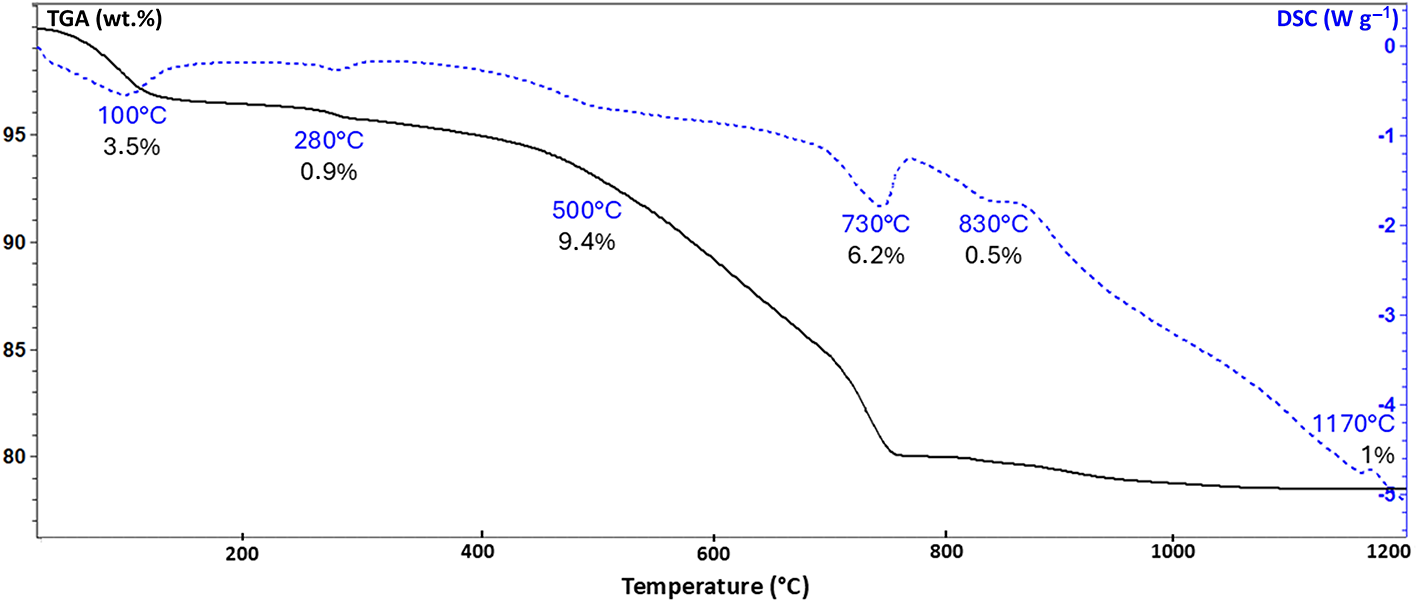
The STA provides insights into the firing behaviour of the studied samples (Fig. 8), with S3 shown as a representative example, as all three samples exhibited similar trends. The STA curves display six distinct thermal events associated with weight loss. The first endothermic peak at 100°C is attributed to the removal of adsorbed water (Baran et al., Reference Baran, Ertürk, Sarikaya and Alemdaroǧlu2001; Ben Zaied et al., Reference Ben Zaied, Abidi, Slim-Shimi and Somarin2015), accompanied by a weight loss of 3.5%. At ∼500°C, kaolinite and illite dehydroxylation cause 9.4% weight loss (Jankula et al., Reference Jankula, Hulan, Štubňa, Ondruška, Podoba and Šín2015). Between 700°C and 760°C, the decomposition of calcite accounts for a 6.2% mass loss, while the decomposition of dolomite at 830°C contributes an additional 0.5% weight loss (Trindade et al., Reference Trindade, Dias, Coroado and Rocha2009; El Ouahabi et al., Reference El Ouahabi, Daoudi and Fagel2014; Ben Zaied et al., Reference Ben Zaied, Abidi, Slim-Shimi and Somarin2015; Bennour et al., Reference Bennour, Mahmoudi, Srasra, Boussen and Htira2015). Finally, the exothermic peak at 1170°C corresponds to high-temperature phase crystallization, with a 1% weight loss (Trindade et al., Reference Trindade, Dias, Coroado and Rocha2009).
STA curves of sample S3. DSC = differential scanning calorimetry; TGA = thermogravimetric analysis.

Figure 8 Long description
Two-series line graph with temperature on the horizontal axis and two vertical axes. Horizontal axis label: Temperature (degree Celsius). Range: 0 to 1200. Left vertical axis label: TGA (wt percent). Range: 80 to 100. Right vertical axis label: DSC (W g superscript -1). Range: minus 4 to 4. A black curve (TGA) starts near 100 at 0 degree Celsius, then decreases gradually. It is labeled 100 degree Celsius with 3.5 percent. It is labeled 280 degree Celsius with 0.9 percent. It is labeled 500 degree Celsius with 9.4 percent. The curve drops more steeply between about 600 and 700 degree Celsius, then continues downward toward the right edge. A blue dashed curve (DSC) runs across the plot with several labeled temperatures: 100 degree Celsius, 280 degree Celsius, 500 degree Celsius, 730 degree Celsius, 830 degree Celsius and 1170 degree Celsius. The blue dashed curve shows multiple peaks and troughs across the temperature range, with a prominent feature near the label 1170 degree Celsius.
Characterization of bricks
Physical properties
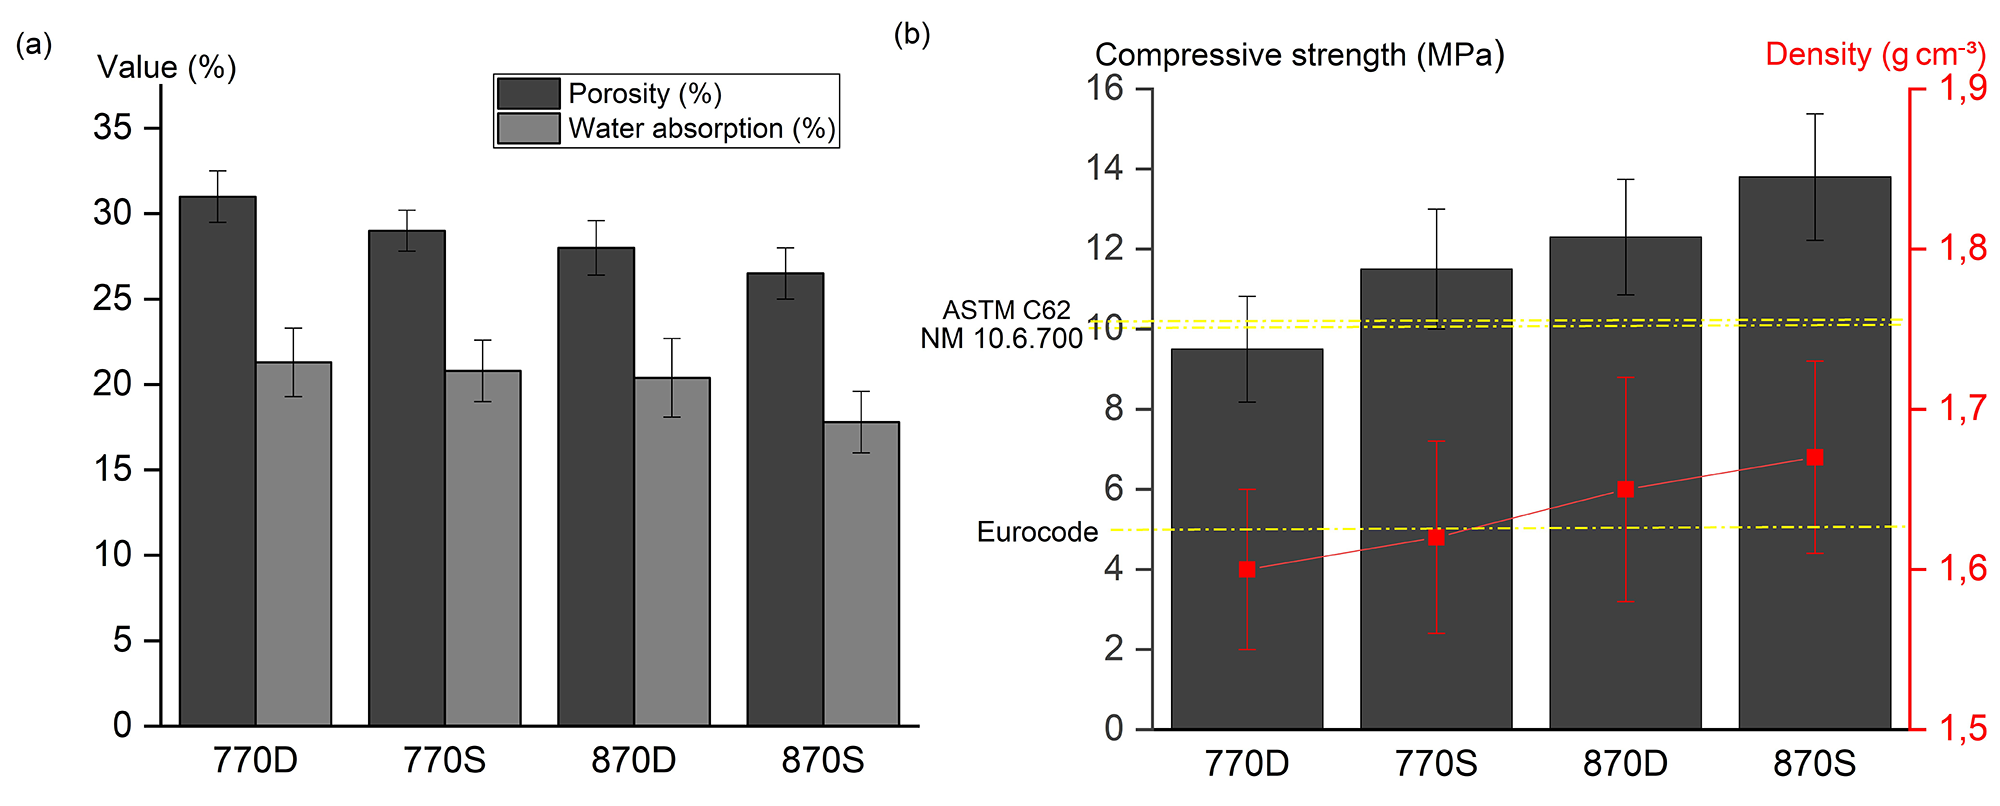
The open porosity and water absorption results are presented in Fig. 9. Porosity values range from 26% to 31%, while water absorption varies between 17 and 21 wt.%. The lowest values are observed in bricks fired using the stepped process up to 870°C (870S), whereas the highest values occur in bricks fired by direct heating at 770°C (770D).
Physical and mechanical properties of the fired bricks: (a) porosity and water absorption; (b) bulk density and compressive strength.

Figure 9 Long description
The image A showing a bar chart with y-axis label Value (percent) and y-axis range 0 to 35. The x-axis categories are 770D, 770S, 870D, 870S. A legend lists Porosity (percent) and Water absorption (percent). For 770D, Porosity is 31 and Water absorption is 22. For 770S, Porosity is 29 and Water absorption is 21. For 870D, Porosity is 28 and Water absorption is 20. For 870S, Porosity is 27 and Water absorption is 18. The image B showing a bar and line graph with left y-axis label Compressive strength (megapascal) and left y-axis range 0 to 16. The right y-axis label is Density g centimeter superscript minus 3 and right y-axis range 1.5 to 1.9. The x-axis categories are 770D, 770S, 870D, 870S. A horizontal line is labeled ASTM C62 M1 16.7 20.0. Another horizontal line is labeled E.5000. Bar values for compressive strength are 9 for 770D, 10 for 770S, 12 for 870D and 14 for 870S. The line values for density are 1.60 for 770D, 1.62 for 770S, 1.65 for 870D and 1.67 for 870S.
Porosity and water absorption show minimal variation between direct and stepped firing processes, with a general decrease observed. For instance, at 770°C, porosity decreases from 31% in the direct process to 29% in the stepped process. Similarly, at 870°C, porosity reduces from 28% to 26% with the stepped firing, representing a reduction of 2%. Water absorption follows the same trend, as more porous bricks retain greater amounts of water. The stepped firing and higher temperatures reduce porosity and, consequently, water absorption by minimizing internal ducts and capillaries (Leiva et al., Reference Leiva, Arenas, Alonso-Fariñas, Vilches, Peceño, Rodriguez-Galán and Baena2016). Pores develop in the materials during the drying phase due to the loss of plasticity water and subsequently through dehydration during firing. The two intermediate firing steps at 500°C and 700°C contribute to reducing porosity. These stages are associated with the dehydroxylation of clay minerals and the decomposition of carbonates, which are key factors controlling reaction kinetics and the occurrence of new phases, as they release H2O and CO2, respectively (Duminuco et al., Reference Duminuco, Messiga and Riccardi1998; Trindade et al., Reference Trindade, Dias, Coroado and Rocha2009). During the 700°C firing stage, calcite decomposes gradually, providing sufficient time for the release of Ca, which subsequently reacts with other components, particularly SiO2 and Al2O3, to form new phases. As a result, larger pores are partially filled, reducing their size, while smaller pores are completely filled. At 870°C in the stepped process, two factors contribute to the further reduction of porosity: the increased temperature and the use of firing stages.
Water absorption directly affects brick durability, as higher absorption rates increase water infiltration, which gradually weakens the material over time. In facing and engineering bricks, excessive water absorption may also induce structural risks due to volumetric changes and stress generated during wetting–drying cycles (Mashiri et al., Reference Mashiri, Vinod, Sheikh and Tsang2015). Furthermore, water absorption provides an indication of the material’s resistance to weathering. Water absorption for moderate weathering resistance should not exceed 22 wt.% (ASTM, 2012). Consequently, bricks from all firing processes are expected to withstand such weathering conditions.
Bulk density varies slightly from 1.60 to 1.67 g cm–3 (Fig. 9). Bricks densify with stepped firing and higher sintering temperatures, with 870S specimens exhibiting the highest density. Specimens fired at 770°C by direct heating are the least dense. Density values vary inversely with porosity and water absorption.
Brick densification results from reduced porosity and the formation of new phases. Densification minimizes voids, bringing particles closer together. Bulk density also depends on the nature, density and proportion of neoformed phases, with denser phases producing denser materials. Temperature is the primary factor affecting density, rather than the use of firing stages. Stepped heating maintains density without compromising brick lightness.
Lightweight bricks improve building seismic performance and reduce transportation and labour costs (De Silva & Hansamali, Reference De Silva and Hansamali2019). Furthermore, they decrease the overall building weight, thereby reducing the required dimensions of structural elements such as beams and columns (Muñoz et al., Reference Muñoz, Letelier, Muñoz, Bustamante and Gencel2021).
Mechanical strength
Compressive strength ranges from 9.5 to 13.8 MPa (Fig. 9), with direct firing at 770°C yielding 9.5 MPa, increasing to 11.5 MPa with stepped firing. Compressive strength reaches 12 MPa at 870°C and peaks under stepped firing at 870°C. In Morocco, the mechanical resistance threshold is 10 MPa according to NM 10.6.700 standard (SNIMA, 2001), while ASTM C62 specifies 10.3 MPa for normal weathering (ASTM, 2012). All fired specimens except 770D meet these requirements. Additionally, all bricks satisfy the Eurocode minimum of 5 MPa for fired clay bricks.
Buildings should withstand both permanent (dead) loads from their own weight and operational (live) loads from occupancy. Stepped firing significantly improves mechanical strength, with 21% and 15% increases observed at 770°C and 870 °C, respectively. Higher firing temperatures increase strength by 26% and 20% for direct and stepped processes, respectively. The eco-friendly bricks produced by stepped firing exhibit adequate mechanical performance for unrestricted construction use.
Increased porosity and water absorption correlate with decreased density and mechanical strength. Pore-volume reduction and neoformed phase development during firing increase strength, rendering the bricks suitable as eco-friendly construction materials.
Thermal performance
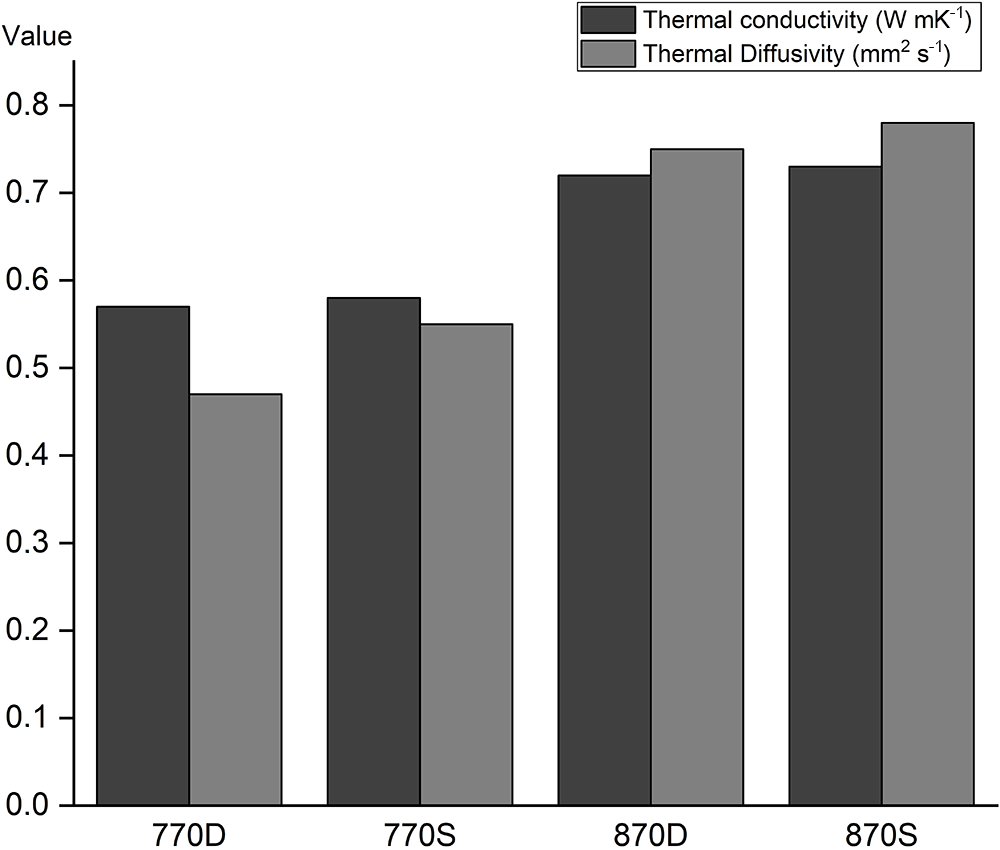
The thermal characterization results (Fig. 10) show that 770D specimens exhibit the lowest thermal conductivity (0.57 W mK–1) and thermal diffusivity (0.47 mm2 s–1). In contrast, 870S bricks display the highest values (0.73 W mK–1 and 0.78 mm2 s–1, respectively).
Thermal properties of the fired bricks.

Samples fired by the direct process exhibit similar thermal properties to those fired by the stepped process, although a slight increase is observed under stepped firing conditions. However, higher firing temperatures lead to increased thermal conductivity and diffusivity.
The obtained values align with the porosity and water absorption results. In general, the more porous the material, the lower its thermal conductivity. Air pores, with a thermal conductivity of 0.026 W mK–1 (Smith et al., Reference Smith, Alzina, Bourret, Nait-Ali, Pennec and Tessier-Doyen2013), reduce overall brick thermal conductivity. Mineralogical transformations occurring during firing also affect thermal insulation. As porosity develops due to the release of structural water from minerals such as kaolinite and illite, as well as the release of CO2 during decarbonation (Nigay et al., Reference Nigay, Cutard and Nzihou2017), thermal conductivity is affected. The formation of new phases that fill the voids also plays a significant role, as each mineral exhibits specific thermal characteristics that may change during firing. For instance, kaolinite has a thermal conductivity of 2.8 W mK–1 (Midttømme, Reference Midttømme1998), which decreases to 0.39 W mK–1 upon decomposition to metakaolinite above 500°C (Michot et al., Reference Michot, Smith, Degot and Gault2008). Illite and smectite exhibit thermal conductivities of ∼2.8 W mK–1, while the thermal conductivity of quartz ranges from 1.28 to 1.65 W mK–1 (Abdulagatov et al., Reference Abdulagatov, Emirov, Tsomaeva, Gairbekov, Askerov and N.A2000).
Thermal performance is inversely related to thermal conductivity and diffusivity. Therefore, bricks fired at 770°C under both direct (770D) and stepped (770S) processes exhibit the highest thermal efficiency, while stable thermal insulation properties are observed across all specimens. The stepped firing process can contribute to energy savings both during manufacturing and throughout the lifecycle of the bricks in buildings, improving thermal comfort while reducing overall energy consumption.
The values obtained in this study are lower than those for unfired solid clay bricks (0.77–1.07 W mK–1) but higher than those for fired hollow clay bricks (0.19–0.40 W mK–1), which have larger cavities that increase thermal transmittance (El Hammouti et al., Reference El Hammouti, Charai, Channouf, Horma, Nasri and Mezrhab2023).
Non-destructive testing
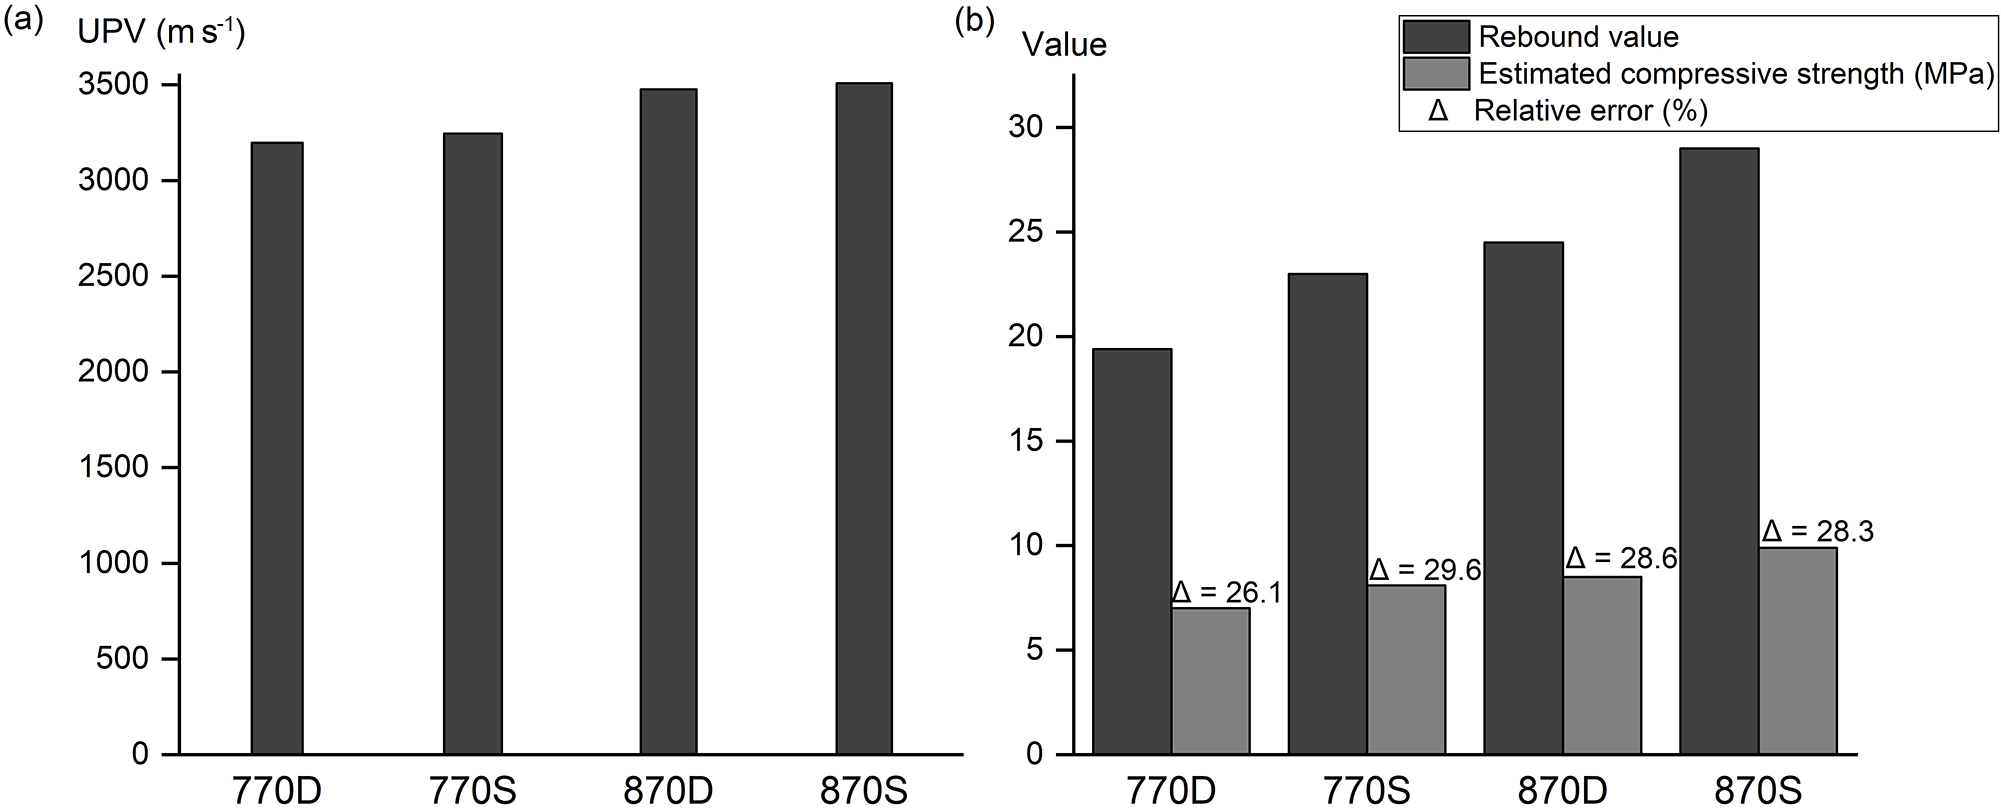
The UPV results for the tested brick specimens are summarized in Fig. 11. The lowest velocity is 3197 m s–1 for the bricks fired at 770°C using the direct process (770D), increasing to 3246 m s–1 with stepped firing (770S). The bricks 870D and 870S exhibit velocities of 3476 and 3508 m s–1, respectively. Increasing firing temperature and stepped firing lead to higher UPV values, reflecting reduced porosity and cracks during sintering. In contrast, high open porosity reduced the interconnectedness of the solid structure, which in turn slows down ultrasonic pulse propagation (Jeong & Hsu, Reference Jeong and D.K1995).
(a) UPV results and (b) rebound value and estimated compressive strength.

UPV correlates positively with density and compressive strength (Bogas et al., Reference Bogas, Gomes and Gomes2013; Sathiparan et al., Reference Sathiparan, Jayasundara, Samarakoon and Banujan2023) but negatively with water absorption (Koroth et al., Reference Koroth, Fazio and Feldman1998). Anisotropy and the presence of anomalies within the material affect ultrasonic wave propagation, leading to attenuation and longer transit times (Brancheriau, Reference Brancheriau2013). The more compact the material, the denser and less porous it is, enabling faster wave transmission. In contrast, bricks with greater inhomogeneity dampen waves, resulting in longer transit times and reduced velocities.
The 770S and 870S brick specimens are more compact and exhibit lower porosity than the 770D and 870D bricks, which explains their higher UPV values. Compared with previous studies, the UPV values obtained in this study align with those reported by Koroth et al. (Reference Koroth, Fazio and Feldman1998), at 2201–4383 m s–1. They are higher than those reported for cement-stabilized earth blocks (270–2610 m s–1; Sathiparan et al., Reference Sathiparan, Jayasundara, Samarakoon and Banujan2023) but lower than those reported for concrete (3600–5200 m s–1; Bogas et al., Reference Bogas, Gomes and Gomes2013).
Bricks with UPV values above 3500 m s–1 are considered durable, while those with values below 1000 m s–1 are considered non-durable (Koroth et al., Reference Koroth, Fazio and Feldman1998). In this study, all tested bricks exhibit UPV values between ∼3200 and 3510 m s–1. 870S bricks, with UPV values exceeding 3500 m s–1, represent the most durable specimens. The durability ranking is as follows: 870D > 770S > 770D.
Ultrasonic waves have frequencies above 20 kHz, while audible sound ranges from 20 Hz to 20 kHz (Leighton, Reference Leighton2007). These two types of waves share the same nature and similar propagation behaviour but differ in frequency (Pompei, Reference F.J2002). Accordingly, UPV can predict the sound transmission and acoustic insulation performance of brick materials. Sound transmission through walls within buildings can be reduced by using materials with lower UPV values. The bricks 770D and 870D are therefore expected to provide improved acoustic comfort. When sound waves encounter porous materials, they are damped within the pores, reducing external noise transmission.
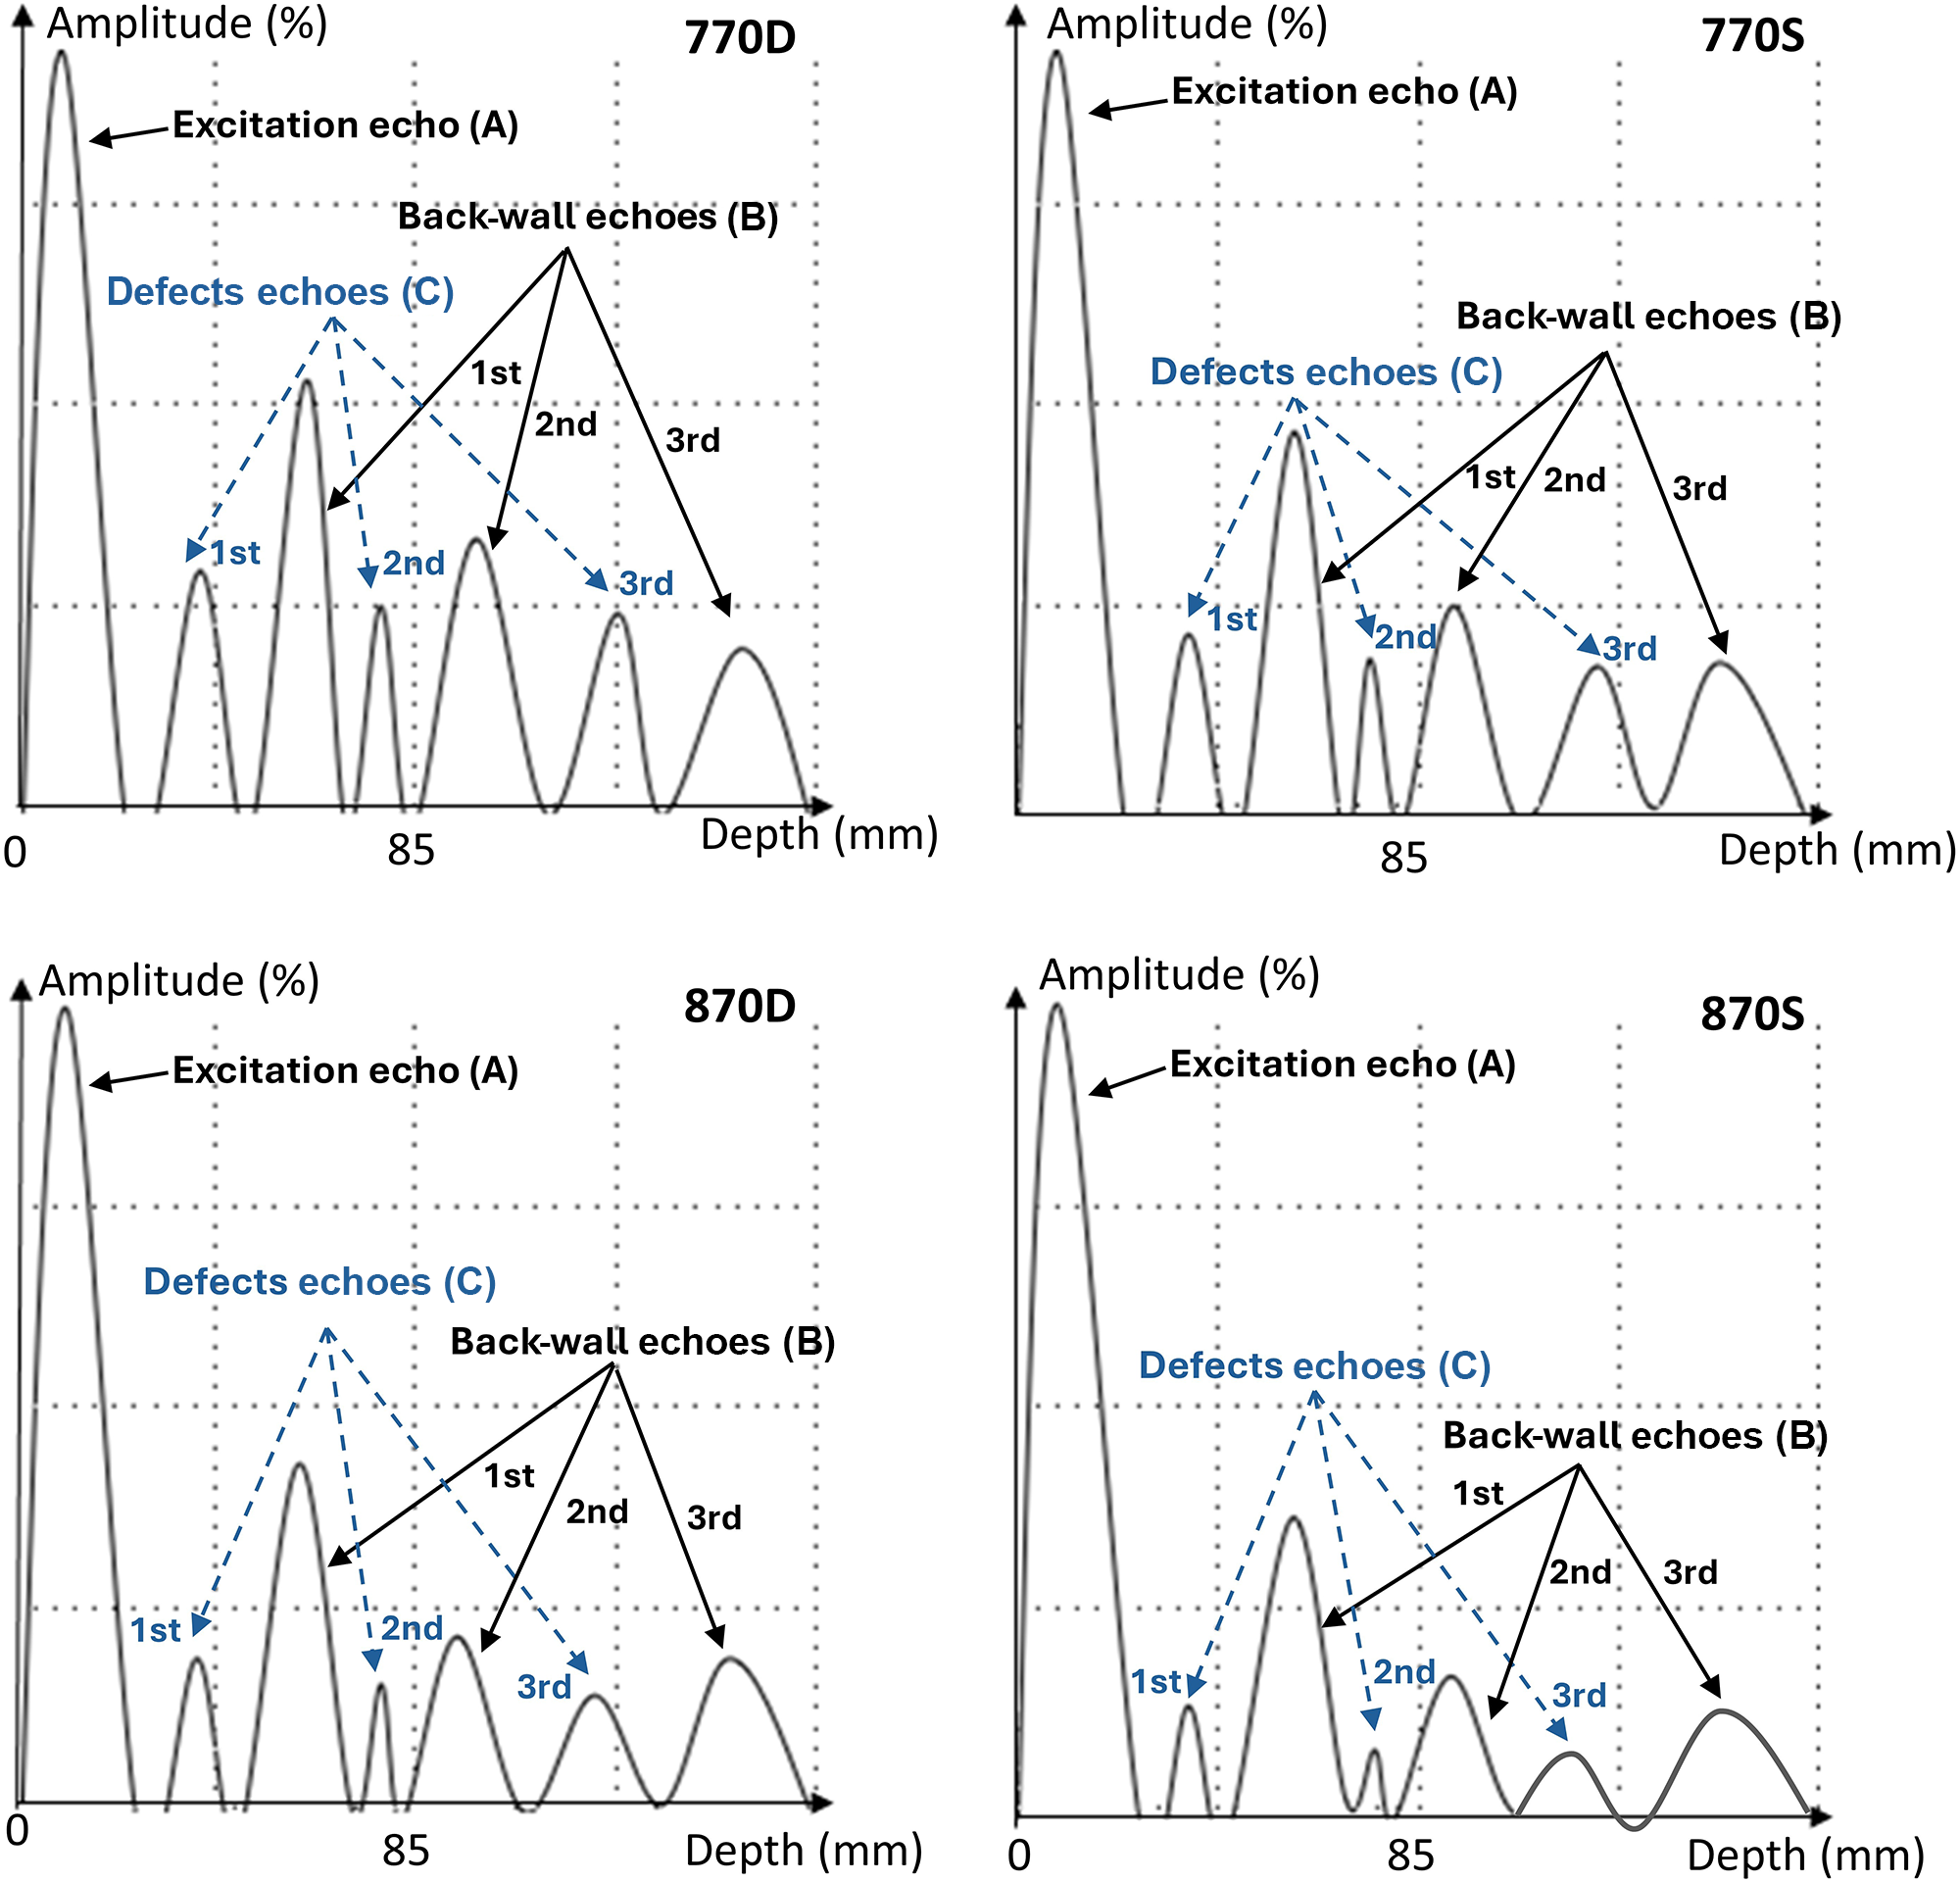
Analysis of defects in the specimens was carried out through the examination of echographs (Fig. 12). Three peak types are identified: (1) peak A, corresponding to the excitation echo generated by transducer–specimen contact; (2) peak B, corresponding to the back-wall echo resulting from wave reflection at the opposite brick face; and (3) peak C, the defect echo, produced by material anomalies through which the wave is reflected upon encountering an obstacle (Krautkrämer & Krautkrämer, Reference Krautkrämer, Krautkrämer, Krautkrämer and Krautkrämer1990).
Echographs of the elaborated bricks.

Figure 12 Long description
Echographs of the elaborated bricks. Four line graphs display amplitude in percent versus depth in millimeters for different specimens labeled 770D, 770S, 870D and 870S. The x-axis is labeled Depth (millimeter) ranging from 0 to 85. The y-axis is labeled Amplitude (percent). Each graph shows three main echo types: Excitation echo (A) at the start, Defects echoes (C) in the middle and Back-wall echoes (B) towards the end. Peaks are labeled 1st, 2nd and 3rd within the defect and back-wall echo groups. The graphs compare different conditions or specimens, with 770 and 870 possibly indicating different frequencies or settings and D versus S indicating different specimen types or conditions. The excitation echo occurs at a depth of approximately 0 millimeters, defect echoes range around 20 to 50 millimeters and back-wall echoes appear near 85 millimeters. The amplitude and position of these echoes vary slightly across the four graphs, indicating differences in material properties or conditions.
Defect echoes exhibit varying signal intensities: the 770D signals are the most intense, whereas the 870S echoes are the most attenuated. Defect echoes in stepped process specimens are less pronounced than those in bricks from the direct process, consistent with their material properties. The relative amplitude of the echoes provides an indication of defect size (Brancheriau, Reference Brancheriau2013), with higher amplitudes corresponding to larger or more abundant pores.
The measured rebound values (R), the estimated compressive strength (CS) based on the equation reported in Brencich et al. (Reference Brencich, Dawid, Matysek, Orban and Sterpi2021) and the corresponding error (%) relative to the measured values are presented in Fig. 11, calculated according to Equation 2:
 \begin{equation}{\text{CS }}\left( {{\text{estimated}}} \right){\text{ = 0}}{\text{.30}}R{\text{ + 1}}{\text{.2}}\end{equation}
Rebound number values range from 19.4 to 29.0, corresponding to estimated compressive strengths between 7.01 and 9.9 MPa. The stepped firing process produced 18% higher rebound values than direct firing. This increased compactness increases brick hardness and resistance to the hammer plunger.
The rebound values found in this study exceed those reported in Roknuzzaman et al. (Reference Roknuzzaman, Hossain, Mostazid and Haque2017) but are lower than the values recorded in Debailleux (Reference Debailleux2019). The Schmidt hammer results for concrete show even higher values, reaching up to 30.5 (Kovler et al., Reference Kovler, Wang and Muravin2018), while earth-based mortar yielded lower values (11.9–25.9; Gambilongo et al., Reference Gambilongo, Barontini, Silva and Lourenço2023). The estimated compressive strengths are lower than those from standard mechanical testing (Fig. 11), with errors ranging from 26.1% to 29.6%. These results demonstrate the positive effects of stepped firing.
Mineralogical and microstructural evolution
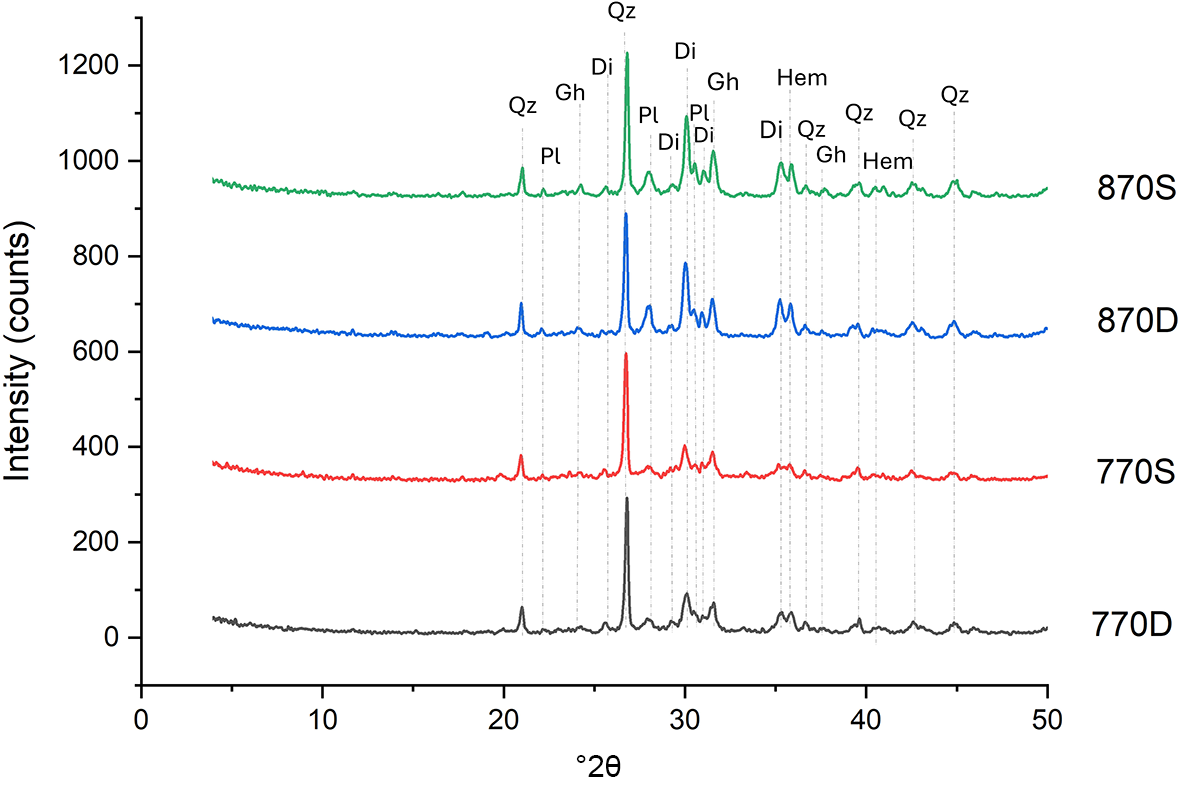
The XRD traces of the fired specimens reveal the disappearance of calcite and dolomite, the transformation of clay minerals and the formation of new phases (diopside, hematite, plagioclase and gehlenite; Fig. 13). Quartz persists, as expected, up to 1100°C (Trindade et al., Reference Trindade, Dias, Coroado and Rocha2009; El Ouahabi et al., Reference El Ouahabi, Daoudi, Hatert and Fagel2015). These mineralogical transformations are attributed to the reactions of SiO2 and Al2O3, derived from quartz and clay minerals, with CaO and MgO released during decarbonation of calcite and dolomite. The XRD results also indicate the presence of an amorphous phase, probably composed of residual calcite, dolomite and quartz that did not fully react during firing.
XRD traces of the brick specimens. Di = diopside; Gh = gehlenite; Hem = hematite; Pl = plagioclase; Qz = quartz.

Figure 13 Long description
Intensity (counts) versus minus 2 theta (Cu K alpha) plot with four stacked line traces labeled 870S, 870D, 770S and 770D. The x-axis is labeled minus 2 theta (Cu K alpha), ranging from 0 to 50 with tick marks at 0, 10, 20, 30, 40 and 50. The y-axis is labeled Intensity (counts), ranging from 0 to 1200 with tick marks at 0, 200, 400, 600, 800, 1000 and 1200. The 870S trace is the top trace. It shows a baseline near 1000 counts at low minus 2 theta, then multiple narrow peaks between about 20 and 45. Peak labels above this trace include Qz, Gh, Pl, Di, Hem and Qz at different peak positions. The 870D trace is the second trace. It shows a baseline near 800 counts and multiple narrow peaks mainly between about 20 and 45. Several peaks are labeled above the trace with Qz, Gh, Pl, Di, Hem and Qz. The 770S trace is the third trace. It shows a baseline near 500 counts and multiple narrow peaks mainly between about 20 and 45. Several peaks are labeled above the trace with Qz, Gh, Pl, Di, Hem and Qz. The 770D trace is the bottom trace. It shows a baseline near 200 counts and multiple narrow peaks mainly between about 20 and 45. Several peaks are labeled above the trace with Qz, Gh, Pl, Di, Hem and Qz.
Gehlenite forms through the reaction of illite/mica, calcite and quartz as follows (Rathossi & Pontikes, Reference Rathossi and Pontikes2010):
 \begin{align*}{\text{KA}}{{\text{l}}_{\text{2}}}\left( {{\text{S}}{{\text{i}}_{\text{3}}}{\text{Al}}} \right){{\text{O}}_{{\text{10}}}}{\left( {{\text{OH}}} \right)_{\text{2}}} {\text{ + 2CaC}}{{\text{O}}_{\text{3}}} & {\text{ + Si}}{{\text{O}}_{\text{2}}} \to {\text{ C}}{{\text{a}}_{\text{2}}}{\text{A}}{{\text{l}}_{\text{2}}}{\text{Si}}{{\text{O}}_{\text{7}}}\nonumber\\
&\quad{\text{ + KAlS}}{{\text{i}}_{\text{3}}}{{\text{O}}_{\text{8}}}{\text{ + }}{{\text{H}}_{\text{2}}}{\text{O + 2C}}{{\text{O}}_{\text{2}}}\end{align*}
\begin{align*}{\text{KA}}{{\text{l}}_{\text{2}}}\left( {{\text{S}}{{\text{i}}_{\text{3}}}{\text{Al}}} \right){{\text{O}}_{{\text{10}}}}{\left( {{\text{OH}}} \right)_{\text{2}}} {\text{ + 2CaC}}{{\text{O}}_{\text{3}}} & {\text{ + Si}}{{\text{O}}_{\text{2}}} \to {\text{ C}}{{\text{a}}_{\text{2}}}{\text{A}}{{\text{l}}_{\text{2}}}{\text{Si}}{{\text{O}}_{\text{7}}}\nonumber\\
&\quad{\text{ + KAlS}}{{\text{i}}_{\text{3}}}{{\text{O}}_{\text{8}}}{\text{ + }}{{\text{H}}_{\text{2}}}{\text{O + 2C}}{{\text{O}}_{\text{2}}}\end{align*}Diopside forms according to the following reaction (Cultrone et al., Reference Cultrone, Javier and Rosua2020):
 \begin{equation*}{\text{2Si}}{{\text{O}}_{\text{2}}}{\text{ + CaMg}}{\left( {{\text{C}}{{\text{O}}_{\text{3}}}} \right)_{\text{2}}} \to {\text{ CaMgS}}{{\text{i}}_{\text{2}}}{{\text{O}}_{\text{6}}}{\text{ + 2C}}{{\text{O}}_{\text{2}}}\end{equation*}
Pores form in the brick matrix through dehydration, dehydroxylation and subsequent decarbonation, which generates CO2. Decarbonation also releases CaO and MgO (Cultrone et al., Reference Cultrone, Javier and Rosua2020), which react with SiO2 and Al2O3 to from new phases. These newly formed phases partially fill pores, reducing porosity and water absorption. Consequently, the materials become denser, leading to increased mechanical strength and thermal conductivity while minimizing defects and increasing UPV. The intensity of diopside, gehlenite and plagioclase peaks increases with rising temperature, improving brick properties. The decomposition of calcite is completed at ∼850°C (Rodriguez-Navarro et al., Reference Rodriguez-Navarro, Ruiz-Agudo, Luque, Rodriguez-Navarro and Ortega-Huertas2009), explaining the observed improvement at 870°C. The reduced intensity of the hematite peak is attributed to the presence of a significant amount of carbonates, which inhibit the formation of iron oxides (Maniatis et al., Reference Maniatis, Simopoulos and Kostikas1981), contributing lighter brick colours. The abundance of fluxing agents in the studied clays, particularly CaO and MgO, lowers the melting temperature, promoting early densification and glassy phases (Boukili et al., Reference Boukili, Lechheb, Ouakarrouch, Dekayir, Kifani-Sahban and Khaldoun2021). Consequently, calcareous clays improve these physical and mechanical properties (Kadir et al., Reference Kadir, Mohajerani, Roddick and Buckeridge2009).
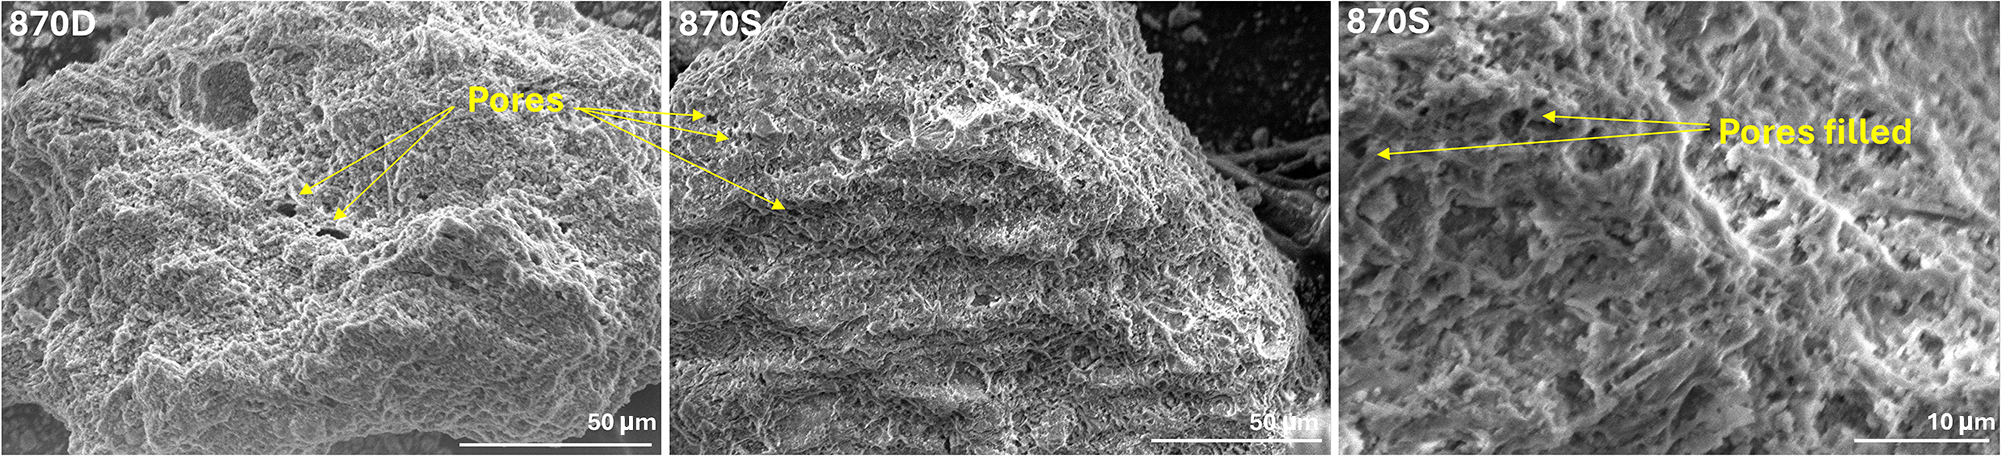
SEM images reveal a homogeneous and porous structure regardless of firing process (Fig. 14). However, stepped firing significantly reduces pore size, as newly formed phases partially fill pores, in line with the previously discussed brick properties. The direct firing process improves insulation performance by increasing porosity and water absorption, while the stepped firing slightly improves durability by increasing compactness and reducing defects.
SEM images of 870D and 870S brick specimens.

Summary and conclusions
Clays from the Ouled Mansour area, north-east Morocco, were characterized and valorized for the production of eco-friendly fired bricks. An innovative firing process based on firing stages was investigated as an alternative to conventional direct firing. In the direct firing process, the temperature was continuously increased until reaching the target temperatures (770°C and 870°C), at which point the bricks were soaked for 1.5 h. In the stepped firing process, the temperature was first raised to 500°C and held for 30 min, then increased to 700°C with a soaking time of 30 min. Finally, the bricks were soaked at the target temperatures (700°C and 800°C) for an additional 30 min.
The raw materials mainly consist of quartz, carbonates and clay minerals (illite, kaolinite, chlorite and smectite). These materials exhibit an adequate grain-size distribution and plasticity, making them suitable for brick manufacturing.
The stepped firing process slightly improved brick properties: compressive strength increased, while water absorption and open porosity decreased. Non-destructive tests provided valuable insights. Schmidt hammer measurements indicated higher rebound values for bricks fired using the stepped process at 770°C and 870°C. Ultrasonic tests revealed that materials with numerous defects exhibited lower UPV, which may improve acoustic insulation.
Mineralogical transformations during firing stages drive microstructural changes that determine brick properties. Thermal conductivity and diffusivity remained nearly constant across the firing processes, indicating that stepped firing maintains insulation performance. Among the tested processes, stepped firing at 770°C (770D) proved most ecological due to its lower energy consumption.
The Ouled Mansour Neogene marl deposit exhibits significant potential for brick manufacturing, supporting economic and industrial development in north-east Morocco. The stepped heat treatment offers an eco-friendly alternative capable of reducing energy consumption at both the industrial scale and during the service life of the building by promoting thermal comfort.
Acknowledgements
The authors acknowledge the Centre National pour la Recherche Scientifique et Technique (CNRST) in Morocco for the PhD Associate Scholarship PASS programme. We also acknowledge the Erasmus+ exchange programme. Hanane Miri thanks Professor Bachir El Kihel for his valuable help with ultrasonic testing.
Competing interests
The authors declare that they have no known competing financial interests or personal relationships that could have appeared to influence the work reported in this paper.
Declaration of generative AI and AI-assisted technologies in the writing process
During the preparation of this work, the authors used AI-based tools to assist with language refinement and style. All scientific content and interpretations remain the authors’ own. After using the AI-based tools, the authors reviewed and edited the content as needed and take full responsibility for the publication.


 Open access

