


Introduction
The animal agriculture industry has traditionally relied on antibiotics as growth promoters (AGPs) to enhance production and feed efficiency in livestock and poultry (Dahiya et al., Reference Dahiya, Wilkie and Van Kessel2006). However, the widespread AGP use has raised serious concerns about food safety and antimicrobial resistance, catalyzing the search for safer and more natural alternatives (Hao et al., Reference Hao, Cheng and Iqbal2014). Probiotic supplementation has shown to improve body weight gain (BWG) and feed-conversion ratios (FCR) across multiple animal models (Abou-Kassem et al., Reference Abou-Kassem, Elsadek and Abdel-Moneim2021; Tran et al., Reference Tran, Horyanto and Stanley2023), as well as enhanced antioxidant activity and upregulated immune function (Sun et al., Reference Sun, Zhang and Liu2022; Xu et al., Reference Xu, Yu and Shen2021). These benefits have driven interest in selecting specific probiotic strains, especially those from the genus Bacillus (Kruse et al., Reference Kruse, Becker and Pierre2022; Urdaci et al., Reference Urdaci, Bressollier and Pinchuk2004).
While the effects of Bacillus supplementation on the host have been studied, analysis of the gastrointestinal system remains challenging due to its complexity and the invasive nature of sampling. To address these challenges, researchers have utilized NMR-based metabolomics to examine non-invasive metabolite profiles of gut samples (Wu et al., Reference Wu, Liu and Zhao2022). Recent advances in NMR instrumentation and online metabolome databases have enabled accurate quantification of gut metabolites, facilitating the detection of subtle changes in response to different feeding strategies (Chen et al., Reference Chen, Fang and Wei2021; Thornton et al., Reference Thornton, Nelson and Mayberry2022).
This study aims to clarify the mechanisms underlying a multi-strain Bacillus-based feed supplement (F1), composed of strains BPR-11, BPR-16, and BPR-17, in broiler chickens using NMR metabolomics. Metabolites significantly affected by F1 were identified, quantified, and mapped to metabolic pathways to assess its impact on the cecal metabolome and overall physiology.
Results
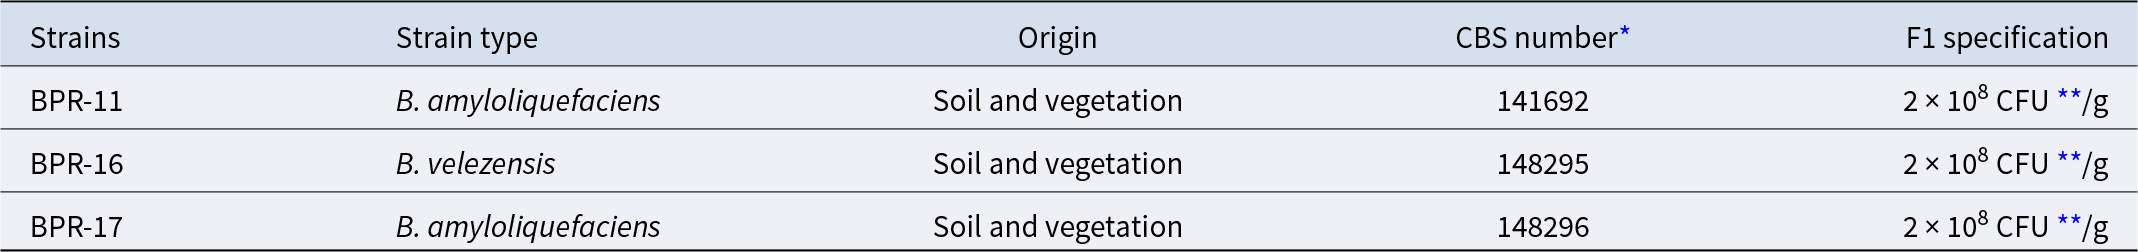
Three Bacillus strains (Table 1) were selected for the F1 formulation based on their antimicrobial activity against poultry pathogens (Tran et al., Reference Tran, Horyanto and Stanley2023). Performance data (Table S1) showed a 13% improvement in FCR during days 21–28, (1.06 ± 0.10 for F1 group and 1.22 ± 0.10 for control) (p = 0.0106). To explore mechanisms underlying this enhanced feed utilization, cecal samples were analyzed using NMR-based metabolomics. On day 28, cecal contents were extracted with methanol and H2O (1:1, v/v) (Table S1 and Fig. S1). We acquired 1D and 2D NMR spectra, identified 18 metabolites (Table S3), and validated them using the Livestock Metabolome Database (https://www.lmdb.ca).
Characteristics of Bacillus strains used in F1 formulation

* CBS: (Centraalbureau voor Schimmelcultures) Generated by Westerdijk Fungal Biodiversity Institute in Utrecht, the Netherland.
** CFU: colony forming units.
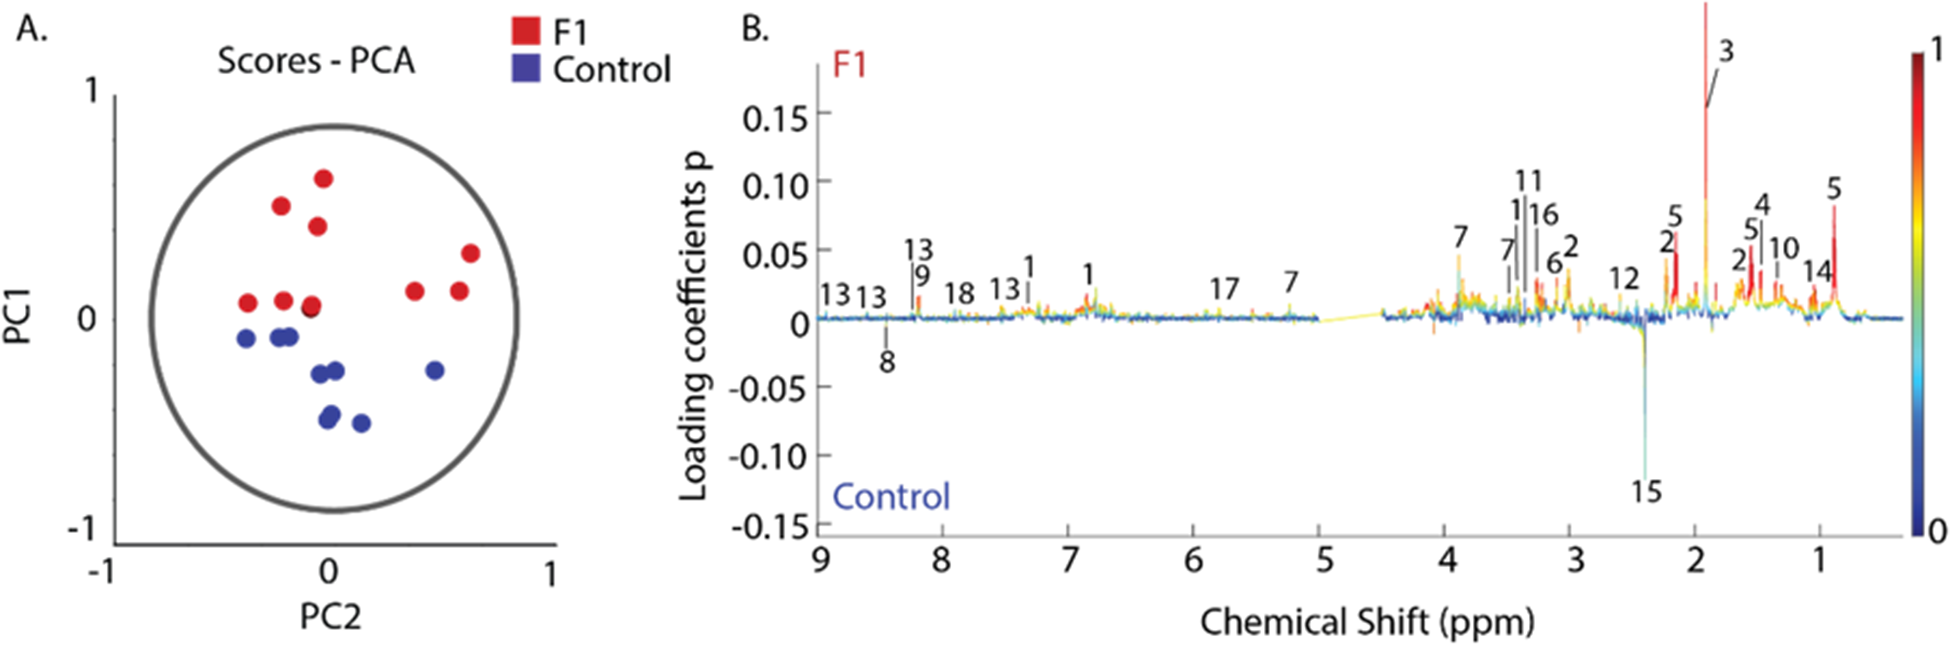
To evaluate metabolite profile variance between the control and F1-supplemented groups, we performed unsupervised multivariate statistical analysis on 1H NMR spectra of cecal extracts. Principal component analysis (PCA) showed a clear separation along PC1, which accounted for 40.4% of variance (Fig. 1A). PC2 explained 15.7% of the variance. Overall, the first three PCs captured 73.10 % of the X-variance, with a Q 2 value of 0.6565, based on 20 spectra and 9189 variables. Metabolites such as short chain fatty acids (SCFAs), glucose and amino acids were significantly increased in the F1 group compared with controls (Table 2).
PCA of 1H-NMR spectra from broiler chicken cecal extracts. (A) Scores plot illustrating the metabolic separation between the control (blue circles) and Bacillus-supplemented (red circles) treatment groups. Each point represents an individual sample. The ellipse indicates the 95% confidence intervals for all samples. PC1 and PC2 explain 40.4% and 15.7% of the total variance, respectively. (B) Bivariate 1D loadings plot showing contribution from individual metabolites to the group separation observed in (A). Individual metabolites are numbered, with the identity given in Table 2. The x-axis shows chemical shifts in ppm, the y-axis represents loadings coefficients p, onto which the absolute values of correlation-scaled loadings coefficients |p(corr)| were overlayed as a heatmap.

Metabolite quantification in the control and F1 treated groups
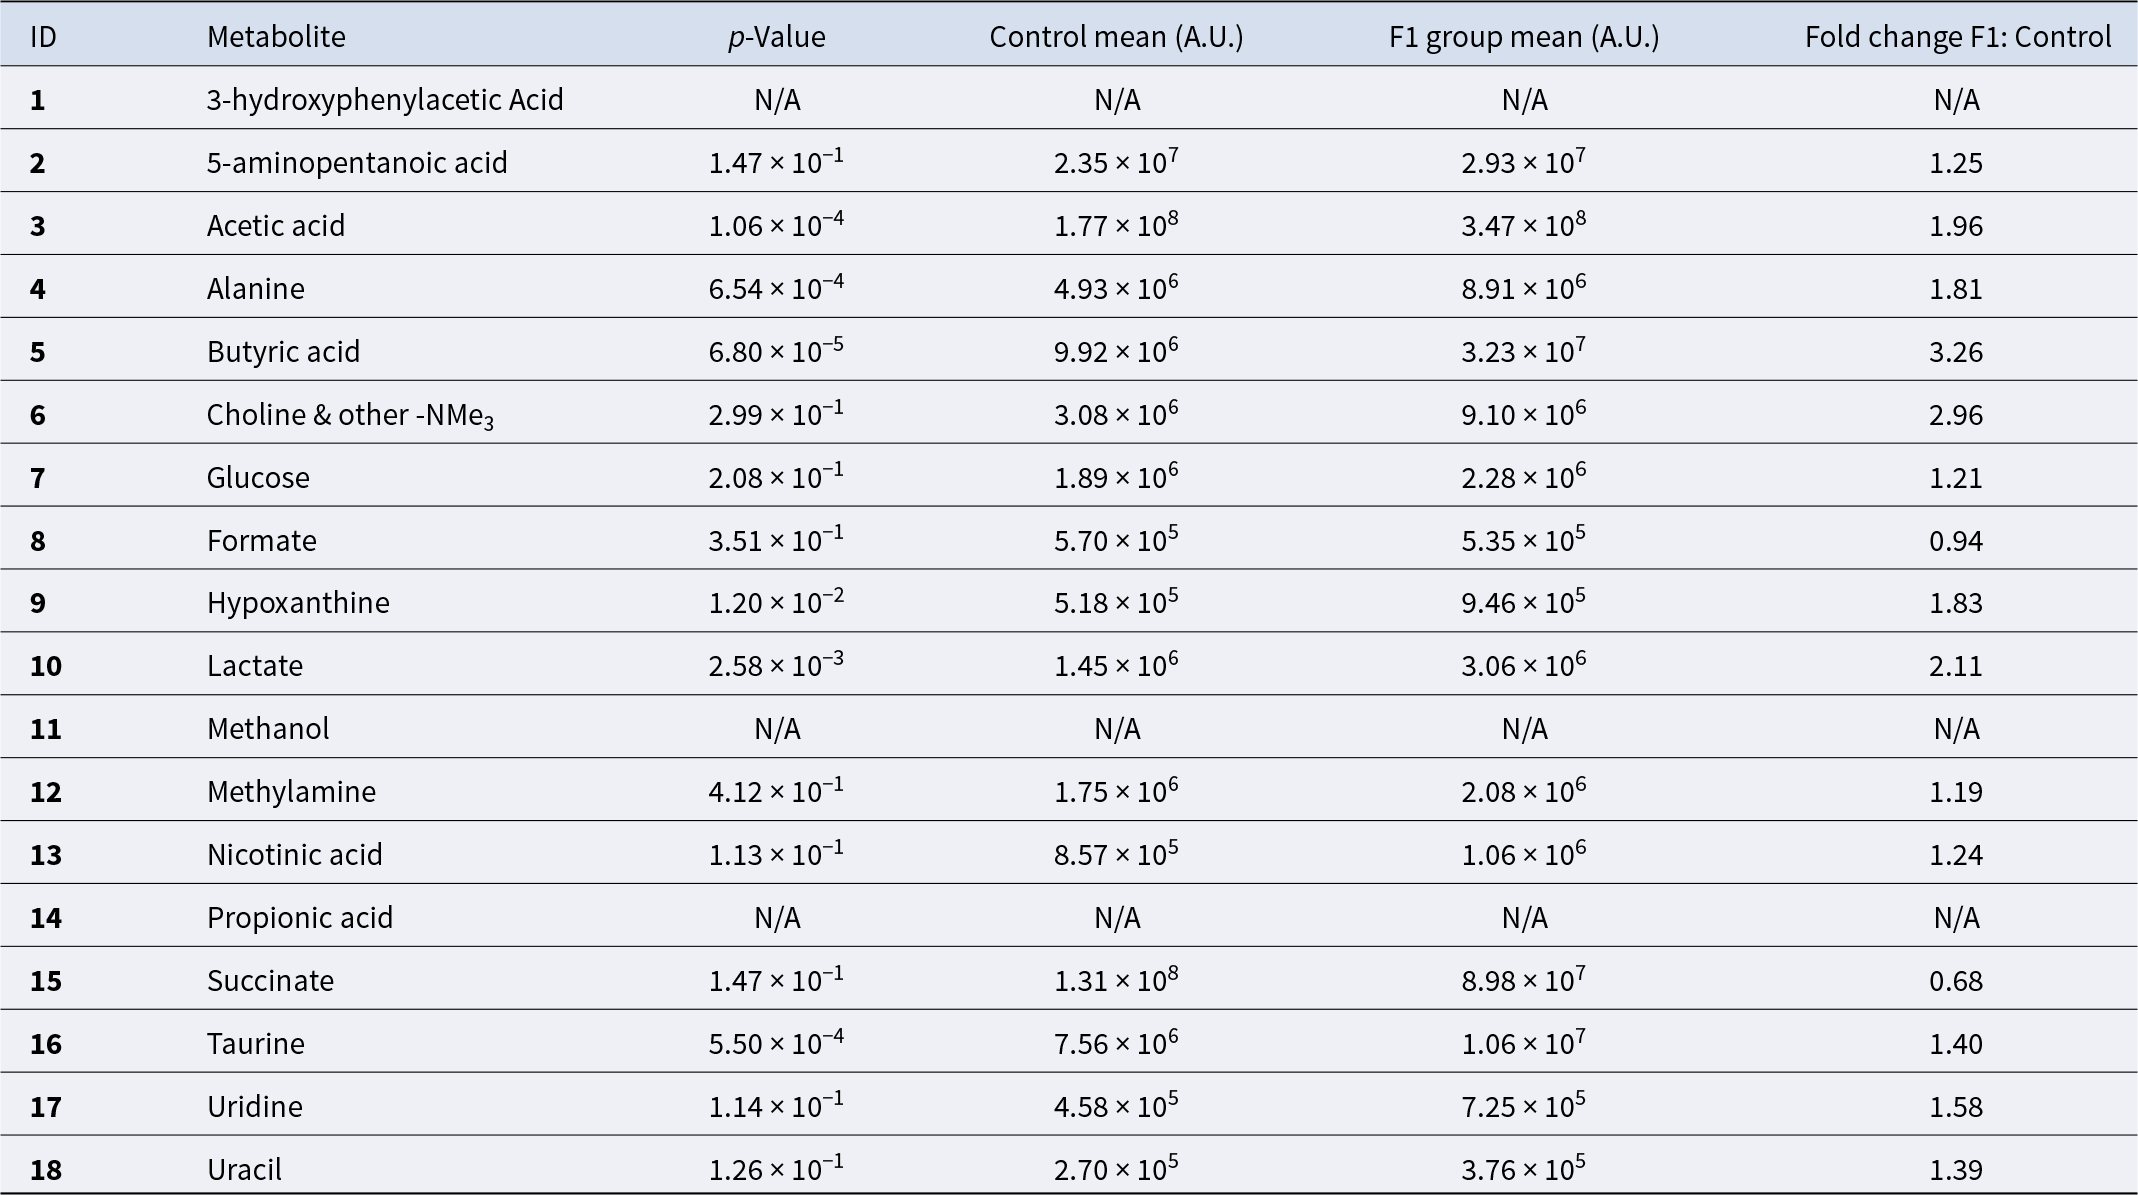
NA indicates “not available” due to 1H NMR signal overlapping. However, these metabolites were confirmed by 2D NMR analysis.
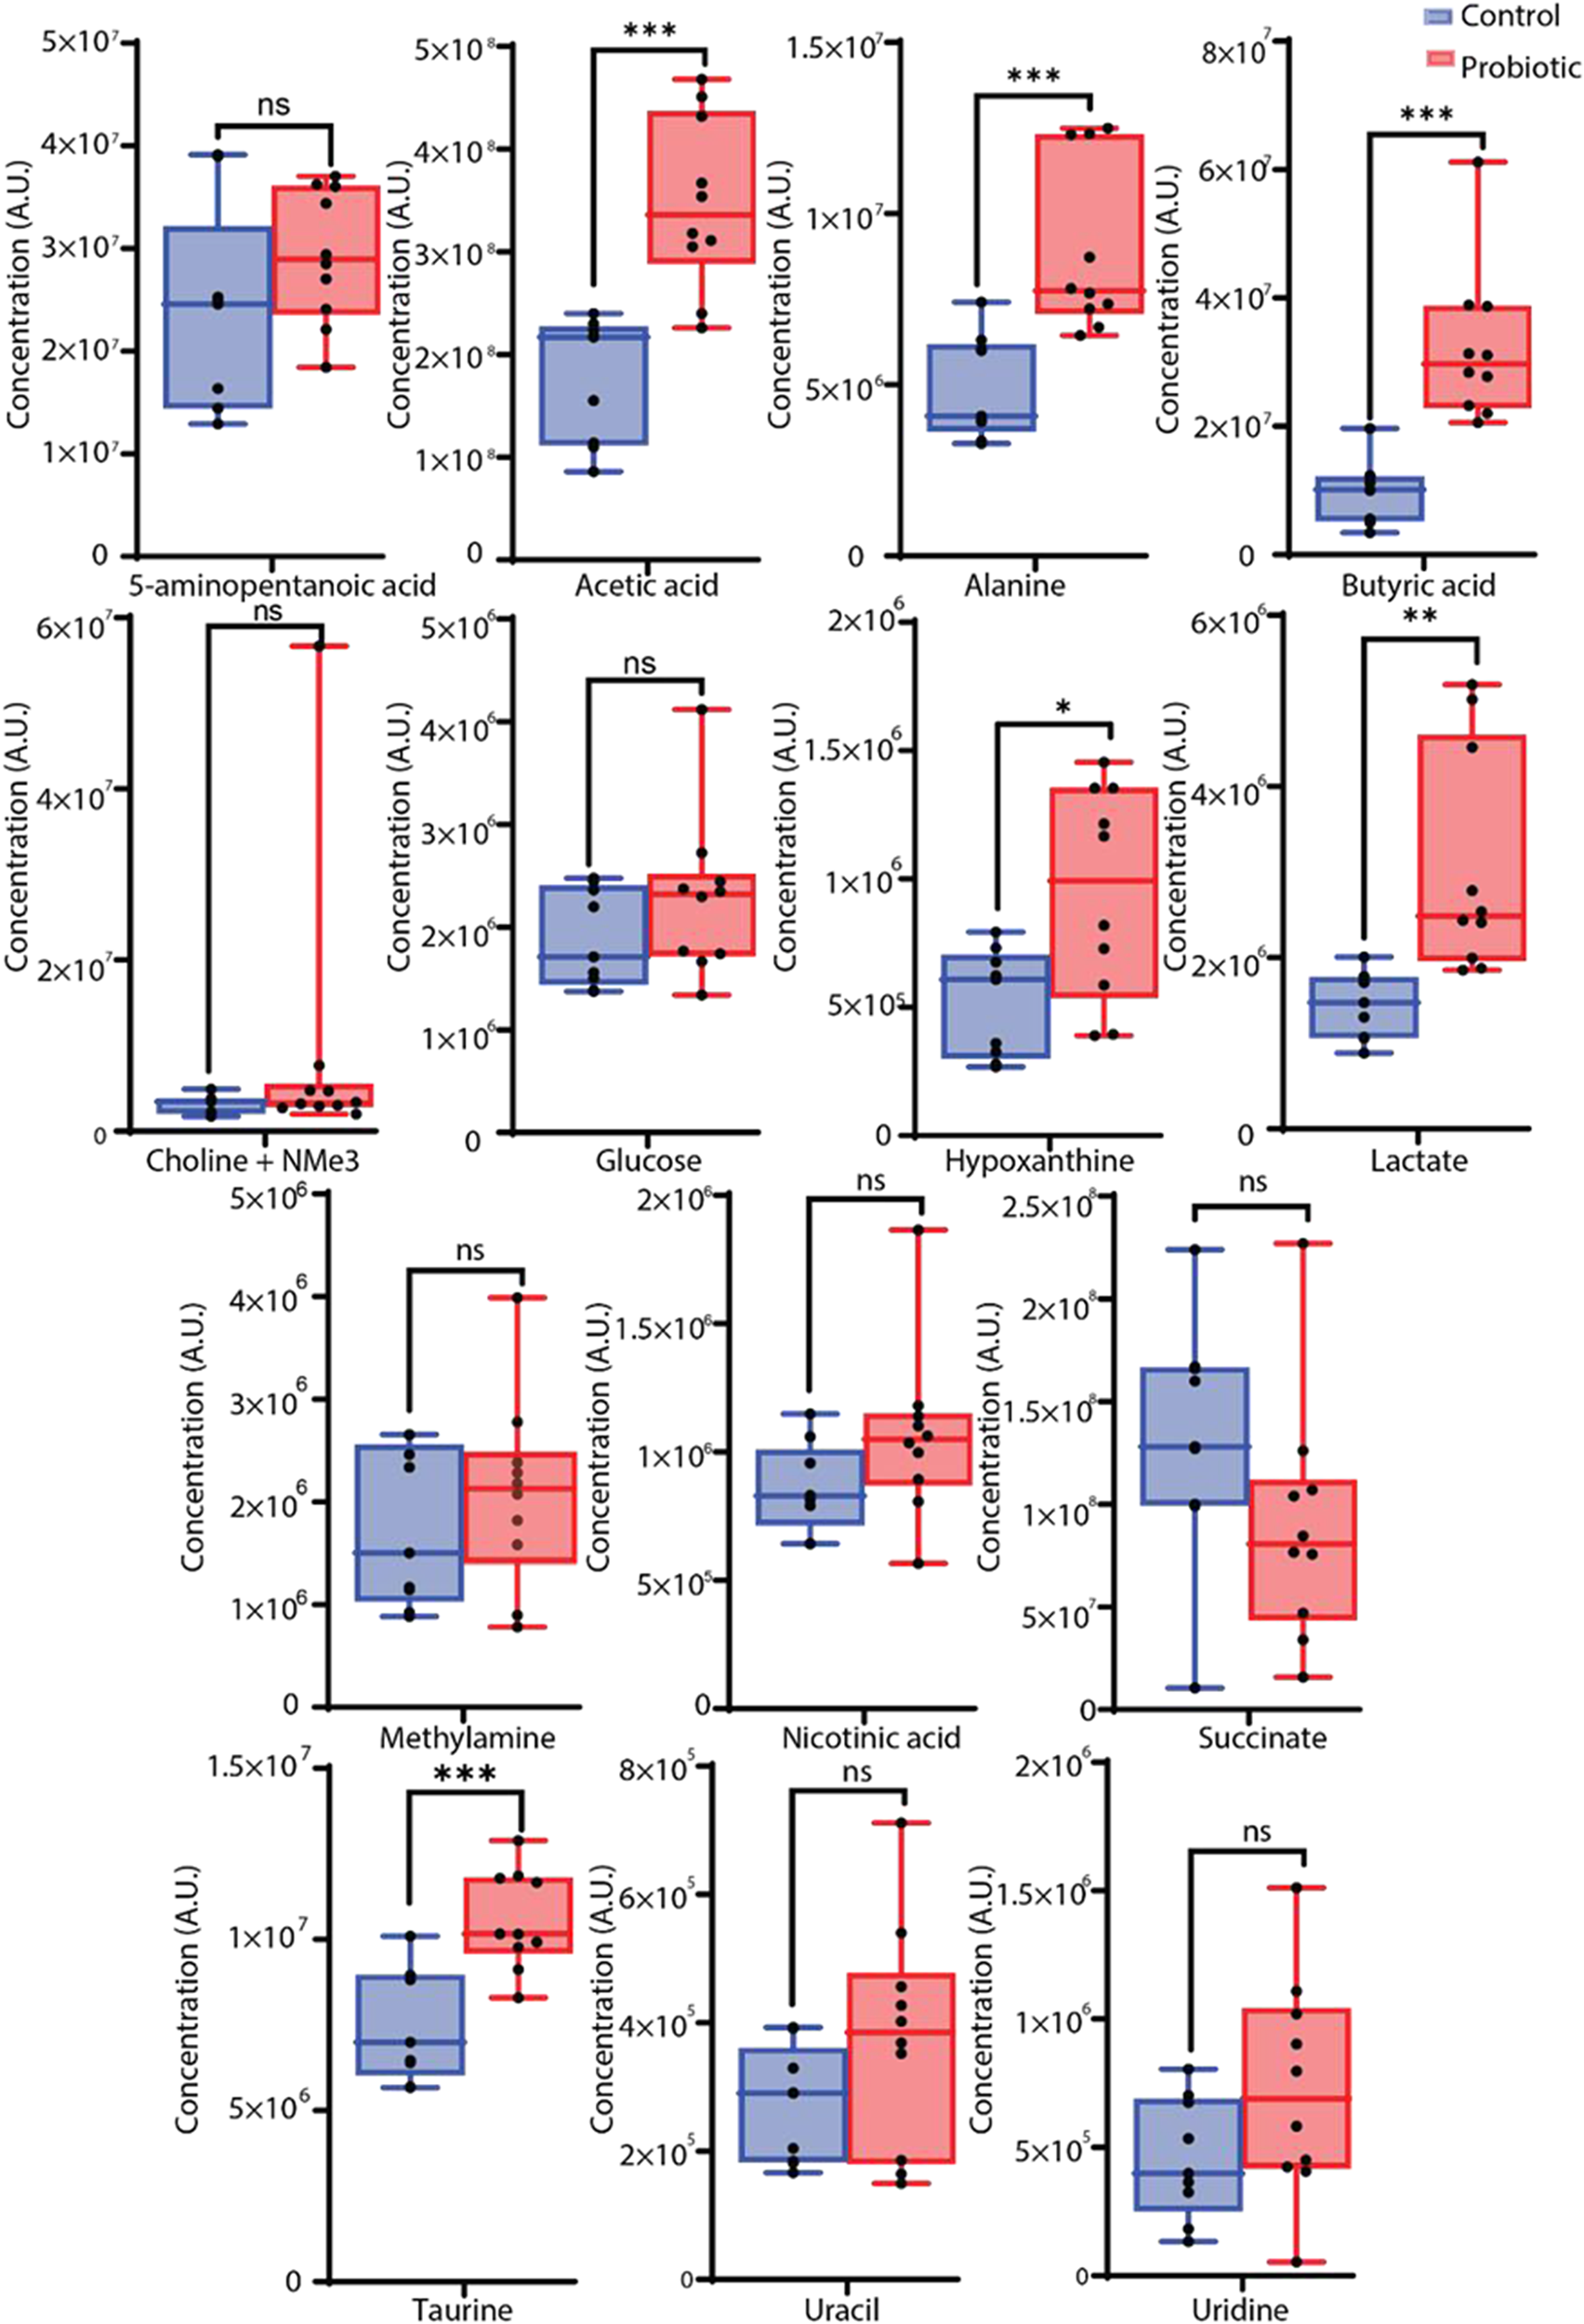
Metabolites identified by PCA as contributing to differences between F1 supplemented and control samples were further analyzed using univariate statistical methods (Fig. 2). Significant increases in the F1 treated group compared to controls (p < 0.001) were observed in acetic acid, butyric acid, taurine and alanine. Levels of hypoxanthine, nicotinic acid, uracil, glucose, 5-aminopentanoic acid, lactate, methylamine and choline with other trimethylammonium (-NMe3) compounds were elevated after F1 treatment but did not reach statistical significance (Table 2). Formate and succinate decreased following F1 treatment, though these changes were not statistically significant.
Concentrations of metabolites in the cecal contents of control (blue) and F1-treated (red) broiler chickens. Metabolite levels are expressed in mM. Asterisks denote statistically significant differences between the control and F1-treated groups, with * indicating p < 0.05, ** indicating p < 0.01, and *** indicating p < 0.001 based on the Mann–Whitney U-test corrected with the Benjamini–Hochberg method.
Discussion
This study investigated the effects of F1 Bacillus supplementation on growth performance and gut metabolite profiles in broiler chickens. F1 supplementation significantly improved FCR and reduced mortality, particularly during the later stages of the trial (days 21–28). Although the improvement in FCR was statistically significant, no corresponding increase in BWG was observed. This finding likely reflects natural variability in BW measurement due to behavioral variability and underscores the consistent improvement in feed efficiency in the supplemented group. These findings align with previously reported mechanisms involving enhanced digestion of complex materials and greater diversity of beneficial gut bacteria (Fotakis et al., Reference Fotakis, Lantzouraki and Goliomytis2017; Zhang et al., Reference Zhang, Zhong and Shao2021).
To elucidate the biological relevance of the observed metabolic changes, we mapped both detected and elevated metabolites to Gallus gallus and B. subtilis metabolic pathways using the KEGG and SMPDB databases. Figure 3 illustrates the key mechanisms and pathways proposed to be altered following F1 probiotic supplementation in chickens.
Schematic representation of significantly altered metabolic pathways based on the compounds identified to be different after F1 treatment/supplementation. The green boxes denote an increase in metabolite levels and the asterisks (*) highlight statistical significance.
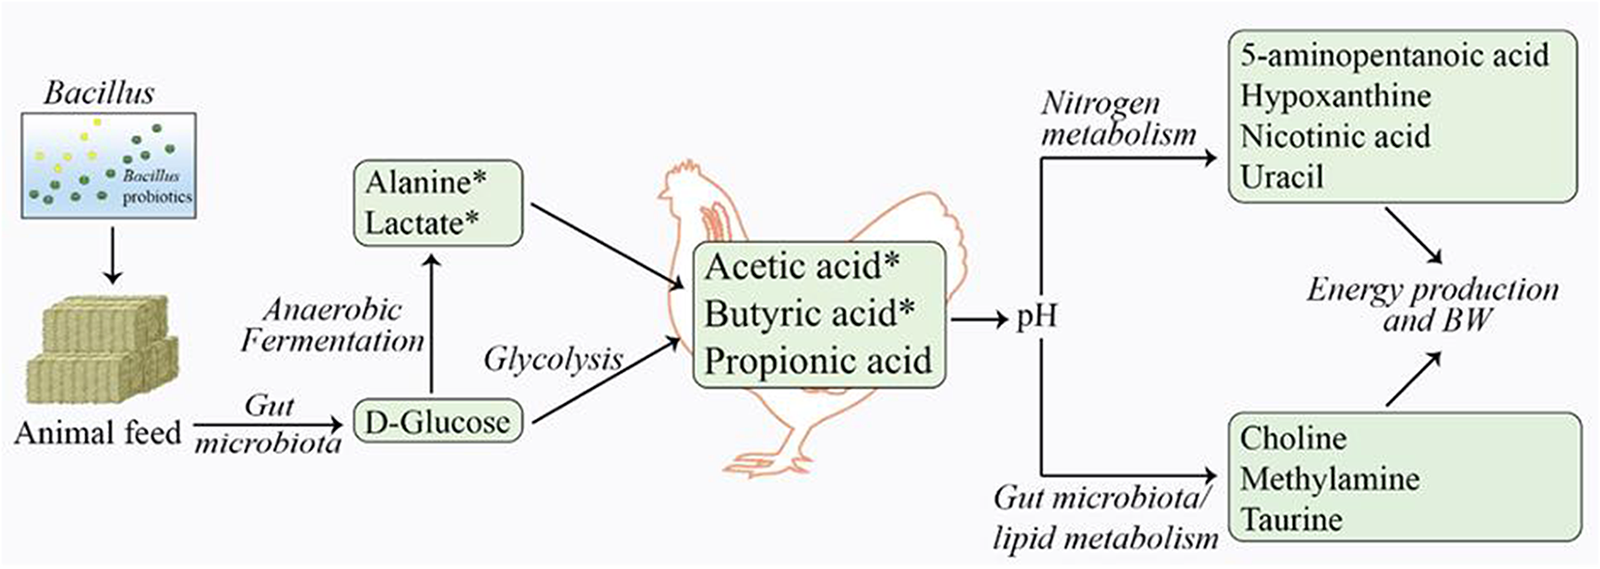
F1 Bacillus supplementation in broiler chickens induced significant changes in the gut metabolite profile, primarily through elevated SCFAs, including acetic (1.96-fold) and butyric acid (3.26-fold). These SCFAs were the most affected metabolites, suggesting that the primary effect of Bacillus supplementation involves enhanced dietary fiber breakdown by Bacillus bacteria (Koh et al., Reference Koh, De Vadder and Kovatcheva-Datchary2016). This process likely increases glucose level (1.21-fold), which subsequently leads to anaerobic production of SCFAs (acetate and butyrate) via glycolysis and related pathways. These SCFAs are absorbed by enterocytes or transported through the portal vein into the host bloodstream, where they are metabolized through fatty acid, ketone body, and/or gluconeogenesis pathways to generate energy.
Similarly, the increased levels of lactic acid (2.11-fold) and alanine (1.81-fold) in the F1 treatment group likely results from glucose fermentation in the anaerobic environment of the ceca. Taurine, a metabolite with antioxidant and anti-inflammatory properties produced by the cecal microbiota, also showed a 1.40-fold increase in the F1 group. Additional metabolic pathways, including amino acid and nucleotide metabolism, may have contributed to changes in hypoxanthine (1.83-fold in-crease), nicotinic acid (1.24-fold increase) and 5-aminopentanoic acid (1.25-fold increase) in the probiotic group compared to the control.
Our previous studies (Tran et al., Reference Tran, Addison and Cock2025) demonstrated that the multi-strain formulation F1, when compared with individual Bacillus strains, exhibited markedly superior performance in several key aspects. Specifically, F1 promoted more robust microbial growth, significantly enhanced the synthesis of antimicrobial metabolites, including surfactin C analogues, and exerted stronger inhibitory effects against pathogenic microorganisms. These findings underscore a clear synergistic interaction among the constituent strains, which collectively amplify the probiotic efficacy of the formulation.
However, the focus on gastrointestinal provides only a narrow snapshot of SCFA-related changes contributing to energy metabolism. Future studies should include blood, saliva or broad gastrointestinal analyses. These approaches will help elucidate systemic effects of Bacillus supplementation and may reveal additional biomarkers for feed efficiency and livestock production.
Conclusions
The results of this study suggest that Bacillus supplementation significantly altered the cecal metabolic profile in chickens. Increased levels of acetic acid, butyric acid, alanine, lactate and taurine indicate that the supplement may enhance dietary fiber digestion, energy metabolism and nitrogen metabolism in the gut. These changes highlight the potential of Bacillus-based formulations to improve feed efficiency and gut health, although further research is needed to confirm systemic effects and clarify underlying mechanisms.
Supplementary material
The supplementary material for this article can be found at https://doi.org/10.1017/anr.2026.10027.
Acknowledgements
This work was supported through a PhD scholarship for C.T. by Bioproton Pty Ltd.
Author contributions
C.T.: Conceptualization, Methodology, Investigation, Formal analysis, Writing – Original draft. D.W.: Methodology, Investigation, Formal analysis. L.H.: Methodology, Investigation, Formal analysis. D.S.: Conceptualization, Writing-review and editing. H.J.S.: Methodology, Formal analysis, Writing – review and editing. I.E.C.: Writing- review and editing, Supervision. X.C.: Conceptualization, Writing – review and editing, Supervision. Y.F.: Conceptualization, Funding acquisition, Resources, Project administration, Writing – review and editing, Supervision.
Conflicts of interest
The publication presents the results of an industry collaborative research project. The project involves students and staff from Griffith University (C.T., I.C. and Y.F.) and Bioproton Pty Ltd. (D.H. and X.C.).
Ethical standards
The animal study was in accordance with the Animal Ethics Committee (approval number: 0000023123) of Central Queensland University, Rockhampton, Australia.


 Open access