

1. Introduction
History has seen major infectious diseases such as acquired immune deficiency syndrome (AIDS), cholera, Ebola, leprosy, tuberculosis, and COVID-19. The economic impact of these diseases (Malani & Laxminarayan, Reference Malani, Laxminarayan, Giled and Peter2011) has spurred debates on whether criminalizing behaviors that facilitate their spread is effective (Burris Reference Burris2006; WHO, 2015). Such legislation often exacerbates discrimination against those infected, deterring serostatus disclosure, care-seeking, and self-protection, which increases the overall societal health burden (Chandrashekhar, Reference Chandrashekhar2020; Valdiserri, Reference Valdiserri2002).Footnote 1 However, rigorous empirical studies on the impact of such legislation are limited.
This study examines legislation in Mali aimed at reducing the spread of human immunodeficiency virus (HIV), focusing on its impact on voluntary testing through the underlying influence of HIV stigma. Recently, over half of sub-Saharan African countries have enacted similar laws (Eba, Reference Eba2015). These laws combine protective provisions for alienated groups, such as counseling for persons living with HIV (PLHs), men who have sex with men (MSM), and sex workers, with punitive provisions like criminalizing HIV non-disclosure, exposure, and transmission. Public health experts and advocates argue that such criminalization worsens discrimination against these already marginalized groups, discouraging serostatus disclosure and the practice of HIV-protective behaviors, such as voluntary testing (Bernard & Cameron, Reference Bernard and Cameron2016; Eba & Lim, Reference Eba and Lim2017).
To explore this issue theoretically, I develop a model in which two types of agents with different beliefs about their HIV status – based on past sexual behavior – decide whether to undergo HIV testing. In this community with a fixed fraction of HIV-positive individuals and existing discrimination, testing incurs two costs related to HIV stigma: reduced self-esteem and fear of peer discrimination if tested individuals are perceived as HIV-positive. This perceived cost is calculated as the exogenous incremental cost of being viewed as a PLH, multiplied by the peers’ endogenous belief that tested individuals are HIV-positive. HIV criminalization increases these stigma costs by signaling state endorsement of discrimination. The model thus predicts that, all else being equal, HIV criminalization discourages testing, especially among those who more strongly care about the stigma costs (likely, HIV-positive individuals).
I assess the impact of the law using data from the 2006 Standard Demographic and Health Survey (DHS), which offered informed, anonymous, and voluntary HIV testing. This setting is ideal for three reasons.
First, Mali’s HIV-specific law was enacted on June 29 (hereafter, referred to as the day of legislation) during the survey period (April to December 2006). There is no discontinuity in the number of respondents on that date, and covariate checks show similar characteristics for respondents interviewed just before and after the legislation. This permits the use of a regression discontinuity (RD) design with the interview day as the running variable. The temporal coincidence of the law’s enactment and the survey provides a rare and powerful quasi-experimental setting for causal identification. In contrast, other common non-experimental methods, such as difference-in-differences, are less suitable because HIV-specific legislation usually applies nationwide – making it difficult to identify a valid control group – and because long-term panel data would be required to control for time trends. Finding a valid instrumental variable for the legislation would also be challenging. To the best of my knowledge, no other African country has conducted a Standard DHS with HIV testing modules concurrently with the enactment of an HIV-specific law, making Mali’s 2006 survey uniquely informative.
Second, the DHS’s testing aimed solely at HIV surveillance, with results not linked to individuals and no feedback given to tested individuals. This minimizes the impact of fear of legal punishment and the law’s protective measures on testing behavior.
Third, the consent process often lacked privacy in practice, potentially allowing household members to infer who was tested and leading to speculation about the seropositivity of tested individuals and subsequent discrimination. Therefore, HIV stigma influenced respondents’ decisions to accept or refuse testing.
Empirical analyses show a 3%–4% decrease in women’s HIV testing uptake on the day of legislation compared to the previous day. The decline was greater in rural areas – where stigma might be more impactful due to limited job opportunities, stronger mutual support networks, and greater visibility of testing status – compared to urban areas. Additionally, the effect was stronger among those with access to radios, suggesting that radio broadcasts heightened awareness of the new law. Furthermore, the legislation primarily discouraged testing among women without completed formal education, who may have misunderstood the testing procedures – particularly the anonymity and confidentiality of test results – and thus experienced stronger stigma-related concerns. In contrast, the law did not significantly affect men’s testing uptake. These findings remain robust across various bandwidths and polynomial orders, as well as through standard robustness checks, including the donut-hole exercise and permutation test. Using alternative interview dates as hypothetical cutoffs did not produce similar results, and the decline in women’s testing uptake is not significantly affected by specific refusals.
This gendered difference may be explained by high gender inequality and discrimination in Mali (OECD, 2023; Sida, 2004) and prior research. Malian women, with limited financial independence (Heath et al., Reference Heath, Hidrobo and Roy2020; Lees et al., Reference Lees, Kyegombe, Diatta, Zogrone, Roy and Hidrobo2021; Van de Walle, Reference Van de Walle2013), are vulnerable to HIV-related mistreatment from family members, increasing their incentive to avoid being perceived as a PLH. Thus, the law may have exacerbated this incentive, disproportionately deterring women from testing. This view supports existing claims that HIV criminalization disproportionately harms women (Ahmed, Reference Ahmed2011; Global Commission on HIV and the Law, 2011; Weait, Reference Weait2011), as women, frequently the first to discover their HIV infection through antenatal or other healthcare services, face blame for HIV transmission and are at higher risk of abuse from family members, leading to reduced willingness to seek healthcare services after the legislation.
This study contributes to the literature in four key ways. First, while existing research has explored the association of HIV-specific legislation with attitudes toward the law, disclosure, testing, safer sex practices, and stigma (for literature reviews, see Harsono et al., Reference Harsono, Galletly, O’Keefe and Lazzarini2017 and O’Byrne et al., Reference O’Byrne, Bryan and Roy2013), this study evaluates the causal impact of such legislation.Footnote 2 Unlike many studies focused on PLHs and at-risk groups in the US (e.g., drug users, heterosexuals, immigrants, MSM, and sex workers), it also examines representative populations in Africa, where HIV is a major issue, and offers a fresh perspective by analyzing actual testing decisions rather than self-reported experiences.Footnote 3
Second, this study advances the literature on HIV-prevention programs, particularly those targeting HIV stigma to encourage voluntary testing and reduce risky behavior. Despite the importance of this issue, few studies have rigorously evaluated the impact of such programs on HIV stigma (Arimoto et al., Reference Arimoto, Hori, Ito, Kudo and Tsukada2016; Godlonton & Thornton, Reference Godlonton and Thornton2012; Thornton, Reference Thornton2008; for literature reviews, see Andersson et al., Reference Andersson, Reinius, Eriksson, Svedhem, Esfahani, Deuba, Rao, Lyatuu, Giovenco and Esktröm2020 and Sengupta et al., Reference Sengupta, Banks, Jonas, Miles and Smith2011). This study suggests that HIV stigma hinders testing uptake and that HIV-specific laws may have effects similar to some nonfinancial (see McCoy et al., Reference McCoy, Kangwende and Padian2010 for literature reviews) and financial interventions (Kohler & Thornton, Reference Kohler and Thornton2011) that have not significantly reduced HIV incidence.Footnote 4
Third, this study extends research on HIV stigma, including conceptual frameworks (Maughan-Brown, Reference Maughan-Brown2006; Parker & Aggleton, Reference Parker and Aggleton2003), quantitative measures (Berger et al., Reference Berger, Ferrans and Lashley2001; Hoffmann et al., Reference Hoffmann, Fooks and Messer2014; Kalichman et al., Reference Kalichman, Simbayi, Jooste, Toefy, Cain, Cherry and Kagee2005), and the stigma-testing relationship (Haffejee et al., Reference Haffejee, Maughan-Brown, Buthelezi and Kharsany2018; Kalichman & Simbayi, Reference Kalichman and Simbayi2003; Maughan-Brown & Nyblade, Reference Maughan-Brown and Nyblade2014; Young & Bendavid, Reference Young and Bendavid2003). It specifically examines how law-induced stigma affects HIV testing uptake.
Fourth, this study highlights the unintended consequences of public policies, consistent with previous research (Cameron et al., Reference Cameron, Seager and Shah2021; Doleac & Hansen, Reference Doleac and Hansen2020). For example, Gertler and Shah (Reference Gertler and Shah2011) found that licensing regulations in Ecuador’s brothel sector led some sex workers to migrate to riskier street sectors, increasing sexually transmitted infection rates in both sectors.
The remainder of this paper is organized as follows. Section 2 describes Mali’s HIV-specific law. Section 3 presents the conceptual framework for understanding how HIV-specific legislation influences voluntary testing and assesses whether HIV testing protocols in the DHS help address this study’s question. Sections 4 and 5 detail the data and empirical strategy, with findings presented in Section 6. Section 7 concludes the paper.
2. Background
2.1. HIV-specific law in Mali
On June 29, 2006, Mali enacted its HIV-specific law (Loi n ${{\rm{\;}}^ \circ }$
06-028; see Section S.6 of the supplementary material) upon the signing by President Amadou Toumani Touré. This law was based on the N’Djamena Model Law, developed and promoted by Action for West Africa Region-HIV/AIDS, a nongovernmental organization (NGO) funded by the United States Agency for International Development. The model law aimed to standardize legal frameworks and best practices for addressing sexually transmitted infections and HIV/AIDS in western and central Africa. Named after N’Djamena, Chad, where it was finalized in 2004 at a meeting with parliamentarians from 18 countries, the N’Djamena Model Law was intended to be adapted to each country’s specific context. However, it was rapidly adopted by many countries (Grace, Reference Grace2015), with most passing legislation closely mirroring the model law (Kazatchkine & Kra, Reference Kazatchkine and Kra2020).
${{\rm{\;}}^ \circ }$
06-028; see Section S.6 of the supplementary material) upon the signing by President Amadou Toumani Touré. This law was based on the N’Djamena Model Law, developed and promoted by Action for West Africa Region-HIV/AIDS, a nongovernmental organization (NGO) funded by the United States Agency for International Development. The model law aimed to standardize legal frameworks and best practices for addressing sexually transmitted infections and HIV/AIDS in western and central Africa. Named after N’Djamena, Chad, where it was finalized in 2004 at a meeting with parliamentarians from 18 countries, the N’Djamena Model Law was intended to be adapted to each country’s specific context. However, it was rapidly adopted by many countries (Grace, Reference Grace2015), with most passing legislation closely mirroring the model law (Kazatchkine & Kra, Reference Kazatchkine and Kra2020).
The HIV-specific law in Mali is omnibus legislation similar to the N’Djamena Model Law. It was originally designed to protect marginalized groups, including PLHs, MSM, and sex workers. Accordingly, it features protective measures on HIV-related education, equal access to healthcare and support, informed consent for HIV testing, confidentiality of test results, pre- and post-test counseling, and a prohibition on discrimination against PLHs.
However, the law also criminalizes HIV non-disclosure, exposure, and transmission. For instance, PLHs are required to disclose their serostatus to their spouse or sexual partners within 6 weeks of diagnosis (Article 27). Violations of this requirement can result in imprisonment for 6 months to 2 years and/or a fine of CFA francs 50,000 to 500,000 (Article 29).Footnote 5 Additionally, the law imposes sentences of 5 to 20 years for PLHs who intentionally expose others to HIV (Article 37). This provision aims to deter intentional transmission, but proving intent is often difficult. The law’s vagueness might also lead to criminalizing non-malicious exposure, including mother-to-child transmission (Csete et al., Reference Csete, Pearshouse and Symington2009). Furthermore, Articles 18 and 25 allow for compulsory HIV testing under certain conditions (e.g., for sexual offenders and pregnant women, or in marital disputes), involuntary notification of HIV status to partners by healthcare professionals, and potential discrimination based on HIV status (e.g., by partners or parents).
The protective provisions are intended to encourage voluntary testing among at-risk individuals, particularly those who are HIV-positive. However, the restrictive and punitive provisions discourage testing in three ways. First, at-risk individuals may avoid HIV testing to evade criminal liability for non-disclosure and intentional transmission, which they believe would apply only if they were aware of their serostatus. Second, the fear of involuntary notification of seropositivity to sexual partners, along with potential consequences like discrimination and legal prosecution, reduces testing uptake. Third, these provisions exacerbate HIV stigma by publicly endorsing discrimination against PLHs, which deters at-risk and HIV-positive individuals from engaging in protective behaviors, seeking appropriate healthcare, and disclosing their serostatus (Eba & Lim, Reference Eba and Lim2017; Pearshouse, Reference Pearshouse2007). This study focuses on the third mechanism, as the test setting described in subsection 3.2 narrows the scope, and HIV stigma is widespread in Mali (Castle, Reference Castle2003, Reference Castle2004).
Finally, the law includes multiple provisions, each considered a distinct treatment. This study cannot identify which specific provision increases or decreases HIV stigma. Nonetheless, the overall impact of these provisions on HIV stigma and testing remains important from a policy perspective.
2.2. Public awareness
For the HIV-specific law to influence testing uptake, it must be assumed that citizens were aware of the legislation. However, DHS data do not include information on such awareness, and research on public knowledge of the legislation in Mali is limited. To my knowledge, the only relevant study, by Cissé et al. (Reference Cissé, Diop, Abadie, Henry, Bernier, Fguon, Dembele, Otis and Preau2015), surveyed 300 adults PLHs in Bamako, Kati, and Koulikoro. This study found that HIV stigma (not necessarily related to the legislation) discouraged serostatus disclosure, noting that the law was seen as “adding even more complexity to the issue of disclosure” (p. 3). Therefore, this subsection provides evidence suggesting that the legislation was known to the public during the study period.
I gathered information from local experts, including public health researchers and NGO staff with extensive experience in HIV control programs in Mali. They reported that the law was developed collaboratively with the Ministry of Health, HIV-focused NGOs, and legal consultants, increasing stakeholders’ awareness. Following its enactment, the full text of the law was published in the government’s official newspaper (Journal Official de la Republique du Mali, 2006) and disseminated through posters at various HIV/AIDS care organizations.
Local experts recalled that upon the law’s promulgation, information campaigns were conducted on radio and TV to inform PLHs, healthcare providers, and the general public. These media were the primary tools for government communication on HIV-related issues at that time, as indicated by Mali’s national strategic framework (Haut Conseil National de Lutte Contre le VIH/SIDA, 2006). This framework notes that over 60% of Malian women listened to the radio at least once a week, and about 31% had access to TV news, prompting the government to collaborate with the media in combating HIV/AIDS from 2006 to 2010.Footnote 6
While specific data for Mali in 2006 is lacking, evidence from around that time highlights the importance of radio and TV as information sources. For example, in 2008, radio and TV were the primary sources of HIV information for high school students in northern Mali (Cissoko et al., Reference Cissoko, Traoré, Sidibé, Maiga, Coulibaly, Maiga, Diamoye, Ly, Sidibè, Dao and Diarra2014). Additionally, data from DHSs across 27 sub-Saharan African countries, including Mali’s 2006 DHS, show that exposure to radio and TV was positively associated with HIV/AIDS knowledge and preventive behaviors (Westoff et al., Reference Westoff, Koffman and Moreau2011). Thus, these media likely played a crucial role in disseminating information about the new law’s enactment.Footnote 7
Overall, individuals had sufficient means – primarily radio – to be informed about the legislation at the time of this study. Consistently, three of the five local experts I interviewed separately confirmed that people were aware of the law in June 2006.
3. Conceptual framework
3.1. Model of HIV testing including fear of legal consequences and stigma
HIV stigma, reflecting negative attitudes toward and beliefs about PLHs, is a significant barrier to HIV prevention and treatment (Mahajan et al., Reference Mahajan, Sayles, Patel, Remien, Ortiz, Szekeres and Coates2008; Valdiserri, Reference Valdiserri2002). The following theoretical model, adapted from Bursztyn et al. (Reference Bursztyn, Egorov and Jensen2019), elucidates the law’s impact while clearly detailing its influence.
Consider a community where PLHs face discrimination, with the population size normalized to one. This community comprises two types of agents with different beliefs about their HIV serostatus based on past sexual behavior: positive (type $H$
) or negative (type
$H$
) or negative (type $L$
). The exogeneous proportion of type-
$L$
). The exogeneous proportion of type- $H$
agents is
$H$
agents is $q$
$q$ $\in$
$\in$ $\left( {0,1} \right)$
. For simplicity, these beliefs are assumed to accurately reflect their serostatus, although confirmation requires testing. This assumption is plausible; for instance, Arimoto et al. (Reference Arimoto, Hori, Ito, Kudo and Tsukada2016) found that factory workers’ subjective probabilities of their own serostatus in South Africa predicted their actual HIV status.Footnote
8
$\left( {0,1} \right)$
. For simplicity, these beliefs are assumed to accurately reflect their serostatus, although confirmation requires testing. This assumption is plausible; for instance, Arimoto et al. (Reference Arimoto, Hori, Ito, Kudo and Tsukada2016) found that factory workers’ subjective probabilities of their own serostatus in South Africa predicted their actual HIV status.Footnote
8
Undergoing testing would benefit the agents because their recent serostatus information would lead them to update their sexual behavior (Boozer & Philipson, Reference Boozer and Philipson2000). Specifically, they would adopt protective measures for themselves and, if they are altruistic, for their sexual partners as well. This expected benefit is assumed to be the same for both types, such that ${b_H}$ $=$
$=$ ${b_L}$ $=$
$=$ $b$
$b$ $>$
$>$ $0$
, because introducing asymmetry does not add significant insights into this study.
$0$
, because introducing asymmetry does not add significant insights into this study.
Type- $H$
agents are more likely to fear learning their serostatus compared to type-
$H$
agents are more likely to fear learning their serostatus compared to type- $L$
agents. This fear may be exacerbated if the law criminalizes HIV non-disclosure, exposure, and transmission or if it allows healthcare professionals to inform partners of an individual’s serostatus. Additionally, type-
$L$
agents. This fear may be exacerbated if the law criminalizes HIV non-disclosure, exposure, and transmission or if it allows healthcare professionals to inform partners of an individual’s serostatus. Additionally, type- $H$
agents might experience greater anxiety post-testing – one psychological cost of HIV stigma – due to potential harm to their self-image. Consequently, type-
$H$
agents might experience greater anxiety post-testing – one psychological cost of HIV stigma – due to potential harm to their self-image. Consequently, type- $H$
agents face a higher total psychological cost for HIV testing than type-
$H$
agents face a higher total psychological cost for HIV testing than type- $L$
agents (
$L$
agents ( ${c_H}{\rm{ \gt }}{c_L} \ge 0$
), despite identical opportunity costs related to travel and clinic wait times.
${c_H}{\rm{ \gt }}{c_L} \ge 0$
), despite identical opportunity costs related to travel and clinic wait times.
For simplicity, it is assumed that those tested are surely and publicly known. Therefore, an agent $i$
(either
$i$
(either $H$
or
$H$
or $L$
) incurs an additional cost of HIV stigma if perceived as a PLH by peers (e.g., colleagues, friends, neighbors, and spouses).Footnote
9
Let
$L$
) incurs an additional cost of HIV stigma if perceived as a PLH by peers (e.g., colleagues, friends, neighbors, and spouses).Footnote
9
Let $\rho {\rm{ }}\; \gt \;0$
denote the incremental cost of being perceived as a PLH, and let
$\rho {\rm{ }}\; \gt \;0$
denote the incremental cost of being perceived as a PLH, and let ${a_i}$
be a binary indicator for whether agent
${a_i}$
be a binary indicator for whether agent $i$
has taken the test (1 if yes, 0 if no). Additionally, by writing
$i$
has taken the test (1 if yes, 0 if no). Additionally, by writing ${c_i} = {c_H}$
, I hereafter indicate that agent
${c_i} = {c_H}$
, I hereafter indicate that agent $i$
is seropositive, as all HIV-positive agents in this model are by assumption type-
$i$
is seropositive, as all HIV-positive agents in this model are by assumption type- $H$
. The stigma cost is thus expressed as
$H$
. The stigma cost is thus expressed as $\rho {\rm{\;\;Pro}}{{\rm{b}}_{ - i}}({c_i} = {c_H}{\rm{\;\;}}|{\rm{\;\;}}{a_i} = 1)$
, where
$\rho {\rm{\;\;Pro}}{{\rm{b}}_{ - i}}({c_i} = {c_H}{\rm{\;\;}}|{\rm{\;\;}}{a_i} = 1)$
, where ${\rm{Pro}}{{\rm{b}}_{ - i}}({c_i} = {c_H}|{a_i} = 1)$
represents the peers’ (endogenously determined) belief that agent
${\rm{Pro}}{{\rm{b}}_{ - i}}({c_i} = {c_H}|{a_i} = 1)$
represents the peers’ (endogenously determined) belief that agent $i$
undergoing HIV testing is seropositive (hereafter, the subscript
$i$
undergoing HIV testing is seropositive (hereafter, the subscript $- i$
is omitted for simplicity). Agents will choose to undergo testing if the benefits outweigh the costs, represented by:
$- i$
is omitted for simplicity). Agents will choose to undergo testing if the benefits outweigh the costs, represented by: ${\theta _i}{\rm{ \gt }}\rho \;\;{\rm{Prob}}({c_i} = {c_H}\;\;|\;\;{a_i} = 1),$
where ${\theta _i} \equiv b - {c_i}$
(implying
${\theta _i} \equiv b - {c_i}$
(implying ${\theta _L}{\rm{ \gt }}{\theta _H}$
).
${\theta _L}{\rm{ \gt }}{\theta _H}$
).
To illustrate a case of interest, I assume ${\theta _i}$ $\gt$
$\gt$ $0$
and
$0$
and ${\theta _L}$ $\gt$
$\gt$ $\rho$ $\gt$
$\gt$ ${\theta _H}$ $\gt$
$\gt$ $0$
; that is, HIV testing benefits agents in the absence of discrimination by peers, and discrimination is primarily a significant concern only for type-
$0$
; that is, HIV testing benefits agents in the absence of discrimination by peers, and discrimination is primarily a significant concern only for type- $H$
agents. Under these assumptions, all type-
$H$
agents. Under these assumptions, all type- $L$
agents would undergo testing, resulting in
$L$
agents would undergo testing, resulting in ${\rm{Prob}}({c_i} = {c_H}{\rm{\;\;}}|{\rm{\;\;}}{a_i} = 1)$ $=$
$=$ ${{q{\rm{Prob}}({a_i} = 1\;\;|\;\;{c_i} = {c_H})} \over {q{\rm{Prob}}({a_i} = 1\;\;|\;\;{c_i} = {c_H}) + 1 - q}}$
by Bayes’ rule. Therefore, if an interior equilibrium, wherein only a fraction of type-
${{q{\rm{Prob}}({a_i} = 1\;\;|\;\;{c_i} = {c_H})} \over {q{\rm{Prob}}({a_i} = 1\;\;|\;\;{c_i} = {c_H}) + 1 - q}}$
by Bayes’ rule. Therefore, if an interior equilibrium, wherein only a fraction of type- $H$
agents undergo testing, is assumed, they must be indifferent about testing vs. not testing; that is,
$H$
agents undergo testing, is assumed, they must be indifferent about testing vs. not testing; that is, ${\theta _H}$ $=$
$=$ ${{\rho q{\rm{Prob}}({a_i} = 1\;\;|\;\;{c_i} = {c_H})} \over {q{\rm{Prob}}({a_i} = 1\;\;|\;\;{c_i} = {c_H}) + 1 - q}}$
. Solving this yields:
${{\rho q{\rm{Prob}}({a_i} = 1\;\;|\;\;{c_i} = {c_H})} \over {q{\rm{Prob}}({a_i} = 1\;\;|\;\;{c_i} = {c_H}) + 1 - q}}$
. Solving this yields: $\;\;{\rm{Prob}}({a_i} = 1\;\;|\;\;{c_i} = {c_H}) = {{1 - q} \over {{{q\rho } \over {{\theta _H}}} - q}}\; \gt \;0,$ ${\rm{Prob}}\left( {{a_i} = 1} \right) = {{1 - q} \over {1 - {{{\theta _H}} \over \rho }}}\; \gt \;0,$
where ${\rm{Prob}}\left( {{a_i} = 1} \right)$ $\in$
$\in$ $\left( {1 - q,1} \right)$
; that is,
$\left( {1 - q,1} \right)$
; that is, $q\rho$ $\gt$
$\gt$ ${\theta _H}$
.
${\theta _H}$
.
Coercive provisions in HIV-specific legislation increase the incremental cost of being perceived as a PLH (i.e., $\rho$
) by signaling state support for discrimination. This reduces overall testing uptake and particularly among HIV-positive individuals (i.e.,
$\rho$
) by signaling state support for discrimination. This reduces overall testing uptake and particularly among HIV-positive individuals (i.e., ${{\partial {\rm{Prob}}\left( {{a_i} = 1} \right)} \over {\partial \rho }}$ $\lt$
$\lt$ $0$
and
$0$
and ${{\partial {\rm{Prob}}({a_i} = 1\;\;|\;\;{c_i} = {c_H})} \over { \partial \rho }}$ $\lt$
$\lt$ $0$
). This decline occurs when agents are informed about the law through local media (e.g., radio), implying a positive law-induced stigma cost,
$0$
). This decline occurs when agents are informed about the law through local media (e.g., radio), implying a positive law-induced stigma cost, $\Delta \rho {\rm{ }}\; \gt \;0$
. The increase in stigma cost is likely greater in rural communities than urban ones (
$\Delta \rho {\rm{ }}\; \gt \;0$
. The increase in stigma cost is likely greater in rural communities than urban ones ( $\Delta {\rho _R}{\rm{ \gt }}\Delta {\rho _U}$
), reflecting stronger social ties and mutual livelihood support (e.g., informal insurance) in rural areas, which intensifies the reduction in rural testing uptake. Similar reductions in testing uptake also occur when the fear of legal consequences (e.g., legal punishment and involuntary serostatus notification) or test-induced self-esteem damage (both constituting
$\Delta {\rho _R}{\rm{ \gt }}\Delta {\rho _U}$
), reflecting stronger social ties and mutual livelihood support (e.g., informal insurance) in rural areas, which intensifies the reduction in rural testing uptake. Similar reductions in testing uptake also occur when the fear of legal consequences (e.g., legal punishment and involuntary serostatus notification) or test-induced self-esteem damage (both constituting ${c_i}$
) increase due to the legislation, such that
${c_i}$
) increase due to the legislation, such that ${\theta _L}$ $\gt$
$\gt$ $\rho$ $\gt$
$\gt$ $0$
$0$ $\gt$
$\gt$ ${\theta _H}$
, resulting in
${\theta _H}$
, resulting in ${\theta _H}$ $\lt$
$\lt$ $\rho {\rm{\;\;Prob}}({c_i} = {c_H}{\rm{\;\;}}|{\rm{\;\;}}{a_i} = 1)$
. In summary, ceteris paribus, increased HIV stigma due to the legislation is likely to discourage testing uptake.
Footnote 10,Footnote 11
$\rho {\rm{\;\;Prob}}({c_i} = {c_H}{\rm{\;\;}}|{\rm{\;\;}}{a_i} = 1)$
. In summary, ceteris paribus, increased HIV stigma due to the legislation is likely to discourage testing uptake.
Footnote 10,Footnote 11
3.2. HIV testing protocol in the DHS
According to the protocol approved by Mali’s National Ethics Committee, the DHS program conducted HIV testing as follows: Field workers first obtained signed consent from respondents, confirming their understanding and willingness. They then collected dried blood spot samples from a finger prick using filter paper, ensuring proper hygiene and safety. Both the blood collection and DHS interview were conducted individually at respondents’ homes. The samples were then sent to a laboratory for serostatus testing via enzyme-linked immunosorbent assay (see Macro International, 2007).
In the DHS, HIV testing was conducted solely for surveillance, with no counseling provided during household visits. Field workers, trained for sample collection but not typically medical personnel, collected blood samples. To ensure anonymity, blood samples were identified only by bar codes, and laboratory technicians examined them for HIV antibodies after removing all personal identifiers (except the bar code) from the survey data. Respondents did not see their results, and confidentiality was emphasized during the informed consent process.
In principle, the confidentiality of test results (even to participants) offers no direct benefit to those tested and eliminates the cost of testing uptake. While this might seem to undermine the suitability of this setting for this study’s question, this assumption is incorrect for two reasons.
First, the high uptake rates for HIV testing indicate that DHS respondents likely derived positive utility from participating, such as aiding field workers or contributing to public health. This utility is akin to ${b_H}$ $=$
$=$ ${b_L}$ $=$
$=$ $b$
$b$ $\gt$
$\gt$ $0$
, as considered in the model. This is plausible given Mali’s active engagement in HIV/AIDS control during the 2006 DHS.Footnote
12
Concerns about AIDS were also emphasized during the informed consent process.Footnote
13
This conjecture is also supported by interviews I conducted for this study with two DHS specialists knowledgeable about the program’s practices, including the 2006 DHS in Mali. These specialists confirmed that respondents were informed that their survey data could help the government and other stakeholders improve healthcare services, thus providing indirect benefits.Footnote
14
$0$
, as considered in the model. This is plausible given Mali’s active engagement in HIV/AIDS control during the 2006 DHS.Footnote
12
Concerns about AIDS were also emphasized during the informed consent process.Footnote
13
This conjecture is also supported by interviews I conducted for this study with two DHS specialists knowledgeable about the program’s practices, including the 2006 DHS in Mali. These specialists confirmed that respondents were informed that their survey data could help the government and other stakeholders improve healthcare services, thus providing indirect benefits.Footnote
14
Second, concerns about learning one’s serostatus or potential legal consequences (such as punishment or involuntary serostatus notification) are not relevant in this setting, as results could not be linked to specific individuals. However, HIV stigma remains a concern if household members could identify tested individuals and speculate that those tested are HIV-positive. According to DHS specialists, while blood collection and interviews were private, the consent process was not always so. Other household members might have observed or overheard the consent process, making it difficult to ensure complete confidentiality given the time required for interviews and blood collection. Consequently, stigma from family members – and possibly from community members who interacted them or were present during the interview – could influence respondents’ decisions to accept or refuse HIV testing. This effect would likely have been especially pronounced if respondents misunderstood the testing protocol, particularly regarding the anonymity and confidentiality of test results.
This view aligns with prior studies highlighting the impact of HIV stigma on blood collection during the DHS. Research estimating national HIV prevalence in Africa using DHS data has shown substantial refusal bias (Adegboye et al., Reference Adegboye, Fujii and Leung2020; García-Calleja et al., Reference García-Calleja, Gouws and Ghys2006), with those refusing testing more likely to be HIV-positive compared to participants (Marston et al., Reference Marston, Harriss and Slaymaker2008; Mishra et al., Reference Mishra, Barrere, Hong and Khan2008; Reniers & Eaton, Reference Reniers and Eaton2009). For example, Mishra et al. (Reference Mishra, Barrere, Hong and Khan2008) used multivariate models with common predictors to estimate HIV prevalence among those who refused testing, finding a prevalence of about 3.71% among women who refused compared to 1.83% among those tested, based on 2003 DHS data from Burkina Faso – a neighboring country to Mali (no similar study has been conducted with DHS data from Mali). Although respondents – regardless of their serostatus or knowledge of it – did not gain additional information from participating in HIV testing during the DHS, refusal bias was evident, suggesting that the psychological cost of HIV testing, likely linked to stigma, varies by serostatus (i.e., ${c_H}$ $\gt$
$\gt$ ${c_L}$ $\geqslant$ $0$
), even when results are strictly anonymous. Alternatively, respondents – especially those who are HIV-positive – might have perceived that confidentiality was not fully assured within households, extended families, or tight-knit communities (i.e.,
$0$
), even when results are strictly anonymous. Alternatively, respondents – especially those who are HIV-positive – might have perceived that confidentiality was not fully assured within households, extended families, or tight-knit communities (i.e., $\rho {\rm{\;\;Prob}}({c_i} = {c_H}{\rm{\;\;}}|{\rm{\;\;}}{a_i} = 1)$ $\gt$
$\gt$ $0$
).
$0$
).
In summary, HIV testing during the DHS differed from typical voluntary counseling and testing at health facilities. The lack of opportunity costs related to visiting and waiting at a clinic, the indirect benefits of participating in blood collection, and the anonymity and confidentiality of results contributed to high uptake rates during the DHS (as detailed shortly).Footnote 15 Despite this, the test setting – where HIV stigma remained a concern – still enables this study to evaluate the impact of HIV-specific legislation on voluntary testing through its effect on HIV stigma.
4. Data
I use cross-sectional data from the 2006 Standard DHS in Mali, which provides nationally representative information on population, health, and nutrition. The survey employed a two-stage sampling process: communities (clusters) were first selected from the 1998 General Census of Population, followed by household selection within these communities. Women aged 15–49 in all selected households and men aged 15–59 in one-third of the households were interviewed. Additionally, anonymous and voluntary HIV testing was offered to individuals in the households selected for men’s interviews (hereafter, referred to as the HIV testing sample).
For the RD design, it is crucial to note that the DHS was conducted from April to December 2006, coinciding with the enactment of Mali’s HIV-specific law. I analyze the HIV testing sample who completed their interviews within a 50-day symmetric window around the day of legislation, as determined by data-driven bandwidth selection (see Section 5).Footnote 16 The main study sample comprises 1658 women and 1456 men from 148 communities, representing approximately 33% and 34% of the total female and male HIV testing samples, respectively.
The main outcome in this study is an indicator equal to one for respondents who consented to blood collection for HIV testing. The top two panels of Figure 1 display this indicator averaged within 5-day bins (scatter plots) for the main study sample, along with predicted values (solid line) and 95% confidence intervals (dashed line) from a linear polynomial regression, with standard errors clustered at the community and day-of-interview levels.Footnote 17
HIV testing uptake.
Note: (1) The top two panels show the value of the analyzed variables averaged within five-day bins (scatter plots), along with the predicted outcomes (solid line) and 95% confidence intervals (dashed line) from a linear polynomial regression of equation (4). The 11 scatter plots represent the mean values for interviews conducted −25 to −21, −20 to −16, −15 to −11, −10 to −6, −5 to −1, 0 to 4, 5 to 9, 10 to 14, 15 to 19, 20 to 24, and 25 days after the legislation. (2) The bottom two panels show the value of the analyzed variables averaged within five-day bins (scatter plots), along with the predicted outcomes (solid line) and 95% confidence intervals (dashed line) from a quadratic polynomial regression of equation (4). (3) In all panels, standard errors are clustered at the community and day-of-interview levels.

Four findings emerge. First, in the main study sample, 97.7% of women and 95.0% of men agreed to undergo HIV testing. Second, especially for women, there is an upward trend in testing acceptance approaching the day of legislation, suggesting that field workers may have enhanced respondents’ understanding and willingness over time. Third, there was a notable decrease of approximately 3–4 percentage points in women’s testing uptake on the day of legislation, indicating that the HIV-specific legislation discouraged testing among women only. Fourth, while women’s testing uptake appears to have rebounded to pre-legislation levels after this decline, the drop actually persisted for several months post-legislation, as shown in the bottom left panel of the figure, which illustrates longer-term trends using predicted values from a quadratic polynomial regression with 95% confidence intervals.
Regarding the representativeness of the main study sample, Figure 2 illustrates the locations of surveyed communities (marked with crosses) and the mean interview month for each cercle, Mali’s second-level administrative unit. Aside from the eastern areas and the northern desert (which was not surveyed), respondents interviewed in June and July were evenly distributed and relatively close to each other. However, the main study sample largely consisted of individuals from poorer rural families, as indicated by measures such as education, health, and household property (see Figure S1 of the supplementary material).Footnote 18 Therefore, this study’s findings should be considered with this sample limitation in mind.Footnote 19
Distribution of the timing of the interview.
Note: This figure shows the locations of surveyed communities (marked with crosses) and the mean interview month for each cercle, Mali’s second-level administrative unit. I matched the DHS community’s GPS coordinates with the country map from the United Nations Office for the Coordination of Humanitarian Affairs (https://data.humdata.org/dataset/cod-ab-mli?).

5. Empirical strategy
To identify the impact of the HIV-specific legislation, I use the following specification for respondent $i$
:
$i$
: ${y_i} = {\alpha _1} + {\alpha _2}{S_i} + {\alpha _3}f\left( {{d_i} - z} \right) + {\varepsilon _i},$ $\forall {\rm{\;\;\;\;}}{d_i} \in \left[ {z - h,z + h} \right],$
where ${y_i}$
represents the outcome of interest;
${y_i}$
represents the outcome of interest; ${d_i}$
is the day of the respondent’s DHS interview;
${d_i}$
is the day of the respondent’s DHS interview; $z$
is the cutoff day (June 29, 2006);
$z$
is the cutoff day (June 29, 2006); $h$
denotes the bandwidth in days;
$h$
denotes the bandwidth in days; ${S_i} = {\rm{\;}}1 \left( {{d_i} \ge z} \right)$
is a treatment indicator; and
${S_i} = {\rm{\;}}1 \left( {{d_i} \ge z} \right)$
is a treatment indicator; and ${\varepsilon _i}$
is the error term. The function
${\varepsilon _i}$
is the error term. The function $f\left( {{d_i} - z} \right)$
represents an RD polynomial of the time distance
$f\left( {{d_i} - z} \right)$
represents an RD polynomial of the time distance ${d_i} - z$
, with separate polynomial coefficients for each side of the cutoff. I estimate equation (4) using a first-order polynomial with
${d_i} - z$
, with separate polynomial coefficients for each side of the cutoff. I estimate equation (4) using a first-order polynomial with $h = 25$
by ordinary least squares (OLS), as the optimal bandwidths minimizing mean squared error of the point estimator for HIV testing uptake were 29.2 days for females and 21.5 days for males (Calonico et al., Reference Calonico, Cattaneo and Titiunik2014).
$h = 25$
by ordinary least squares (OLS), as the optimal bandwidths minimizing mean squared error of the point estimator for HIV testing uptake were 29.2 days for females and 21.5 days for males (Calonico et al., Reference Calonico, Cattaneo and Titiunik2014).
The influence of HIV stigma on testing uptake is likely to vary across communities. Additionally, given the specification error inherent in RD models with a discrete running variable, the model error may be correlated within the interview day (Lee & Card, Reference Lee and Card2008). Therefore, I cluster standard errors at the community and day-of-interview levels (148 and 51 groups, respectively).
There are two main concerns regarding the validity of the RD design. First, the DHS data exclude individuals who either actively or passively (e.g., absence) refused to be interviewed, which could bias estimates if HIV-specific legislation influenced their selection into the interview and HIV testing.Footnote 20 Although the 2006 DHS reported high response rates of 91% for men and 97% for women (Samaké et al., Reference Samaké, Traoré, Ba, Dembélé, Diop, Mariko and Libité2007, pp. 9–10),Footnote 21 the RD design still faces this concern. Second, survey enumerators might have rescheduled interviews based on respondents’ health characteristics, potentially due to anticipated effects of HIV legislation or by chance (e.g., failing to reach respondents who were away from home during the initial visit and scheduling callback visits).Footnote 22 For example, interviews of HIV-positive individuals might have been postponed from just before to just after the legislation, while those of HIV-negative individuals could have been moved in the opposite direction.
To mitigate these concerns, I conducted two exercises. First, particularly to tackle the issue of selective sorting, the top left (for women) and top right (for men) panels of Figure 3 show the number of respondents interviewed each day, revealing no clear sorting at the cutoff. Additionally, I applied the density test proposed by Cattaneo et al. (Reference Cattaneo, Jansson and Ma2020), which is less restrictive than the seminal test by McCrary (Reference McCrary2008).Footnote 23 The null hypothesis of no discontinuity was not rejected, as indicated by the p-values reported at the bottom of each panel.
RD validity checks: The number of respondents and balanced covariate checks.
Note: (1) The top two panels display the number of respondents eligible for HIV testing and interviewed within a 50-day symmetric window around the day of legislation. (2) The bottom two panels show the standardized treatment effect on each analyzed variable with 95% confidence intervals, derived from a linear polynomial regression of equation (4). Standard errors are clustered at the community and day-of-interview levels. (3) Height, weight, and circumcision-related information are not available for men.

Second, I assessed whether several variables (see Table 1 for summary statistics), likely unaffected by the law, are balanced at the treatment threshold. Specifically, I estimated a local linear polynomial model of equation (4) with $h = 25$
for each variable and reported the standardized coefficient of
$h = 25$
for each variable and reported the standardized coefficient of ${\alpha _2}$
with 95% confidence intervals in the bottom panels of Figure 3. The variables examined include individual-level covariates such as age, religion (Muslim), ethnicity (Bambara, Mali’s largest ethnic group), highest level of education, height and weight (available only for women), HIV-related knowledge score (0–10, detailed in Section S.1 of the supplementary material), marital status, and circumcision-related indicators (available only for women) as well as an indicator for recent contraction of sexually transmitted diseases (STDs).Footnote
24
Household-level covariates include household size and ownership of a radio, TV, bicycle, or electricity (indicators). Community-level covariates include an urban indicator, population density, precipitation, temperature, altitude, slope, and distances from Bamako (the capital) and the nearest national border (see Section S.1 for details).Footnote
25
The variables varied smoothly at the cutoff.Footnote
26
The subsequent empirical results remain robust when controlling for these covariates.
${\alpha _2}$
with 95% confidence intervals in the bottom panels of Figure 3. The variables examined include individual-level covariates such as age, religion (Muslim), ethnicity (Bambara, Mali’s largest ethnic group), highest level of education, height and weight (available only for women), HIV-related knowledge score (0–10, detailed in Section S.1 of the supplementary material), marital status, and circumcision-related indicators (available only for women) as well as an indicator for recent contraction of sexually transmitted diseases (STDs).Footnote
24
Household-level covariates include household size and ownership of a radio, TV, bicycle, or electricity (indicators). Community-level covariates include an urban indicator, population density, precipitation, temperature, altitude, slope, and distances from Bamako (the capital) and the nearest national border (see Section S.1 for details).Footnote
25
The variables varied smoothly at the cutoff.Footnote
26
The subsequent empirical results remain robust when controlling for these covariates.
Summary statistics

Note: (1) Information on † is available only for respondents who had heard of AIDS. (2) The circumcision indicator is zero for uncut women and those who had never heard of circumcision. (3) The HIV knowledge score is zero for those who had never heard of AIDS.
Finally, the National Assembly passed the bill on June 2, and it went into effect on June 29, coinciding with President Touré’s signing of the bill into law. Therefore, one may concern that the bill’s passage had an impact before the enforcement. However, according to Mali’s Constitution (Article 40), the President must promulgate laws within 15 days of receiving the final text. During this period, the President can request the National Assembly to reconsider certain provisions, which can delay promulgation. The President’s signature was thus essential for enforcing the HIV-specific law and signaled the state’s official endorsement. Moreover, note that the main analyses use a 50-day symmetric window around the legislation date (June 29), thereby automatically excluding data from respondents interviewed before the voting date (June 2). This approach minimizes contamination from the passage effect on respondents’ behavior and attitudes. Additionally, if the voting on the bill had already discouraged testing before the law’s enforcement, this would likely reduce the observed impact of the legislation. Therefore, the true effect of the law in discouraging testing is likely more pronounced than what this study reports. Further discussion and analysis are provided in Section S.2 of the supplementary material.
6. Empirical findings
6.1. HIV testing uptake
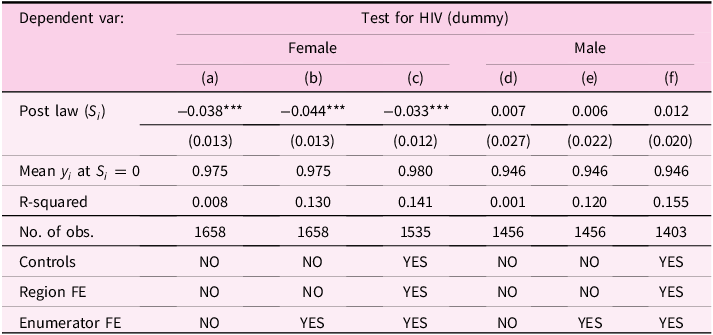
For the binary indicator of respondents who underwent HIV testing, I estimated a linear polynomial model as specified in equation (4), shown in column (a) of Table 2, using the female sample. In column (b), I included enumerator fixed effects. According to DHS specialists, HIV testing was conducted anonymously and confidentially by non-medical field workers without counseling (subsection 3.2), so it is unlikely that they informed respondents about the HIV-specific legislation.Footnote 27 Nonetheless, the significant increase in R-squared value in column (b) suggests that enumerator characteristics influenced respondents’ survey responses (West & Blom, Reference West and Blom2017). In column (c), I additionally controlled for the abovementioned covariates and regional fixed effects (eight groups). The results show that the HIV-specific law reduced HIV testing uptake by approximately 3–4 percentage points on the day of legislation, reflecting a 3%–4% decline from the 100% testing rate the day before.
HIV testing uptake (OLS)

Note: (1) Figures () are standard errors that are clustered at the community and day-of-interview levels. *** denotes significance at 1%. (2) The controls used include all covariates listed in Table 1.
Although the settings are indirectly comparable, the immediate 3%–4% decline in testing uptake can be contextualized with estimates from previous studies on financial and informational interventions. In Rwanda, de Walque et al. (Reference de Walque, Gertler, Bautista-Arredondo, Kwan, Vermeersch, de Dieu Bizimana, Binagwaho and Condo2015) found that performance-based monetary incentives – USD 0.92 per individual tested and USD 4.59 per couple tested – boosted self-reported testing uptake among married individuals by approximately 14.5% over 18 months, from a baseline uptake rate of 70%.Footnote 28 Additionally, Dupas (Reference Dupas2011) showed that informing Kenyan schoolchildren about the relative risk of HIV infection based on partner’s age led to a 28% reduction in the incidence of childbearing within one year.
Columns (d) through (f) repeat these analyses for men, finding no impact on their testing uptake. These differing results will be discussed further in subsection 6.3.
Table 3 explores heterogeneity in the law’s impact. First, the government’s radio- and TV-based public awareness campaigns (subsection 2.2) imply that individuals with these devices would have been better informed about the legislation. As a result, the law may have had a greater discouraging effect on testing uptake among those with such devices. Radios, in particular, are significant due to their broad coverage. The estimation results in column (a), which include interaction terms between the treatment indicator and dummies for respondents with and without a radio, support this hypothesis.
Heterogeneity (OLS)

Note: (1) Figures () are standard errors that are clustered at the community and day-of-interview levels. *** denotes significance at 1%. (2) The controls used include all covariates listed in Table 1.
Second, stigma costs are likely higher in rural areas due to limited livelihood opportunities (Van de Walle, Reference Van de Walle2013), mutual support systems (e.g., informal insurance), and tight-knit social bonds, which amplify the risk of being perceived as a PLH by peers. As a result, the law’s impact is likely more pronounced among rural women compared to their urban counterparts, as evidenced in column (b).Footnote 29
Third, stigma may have had a stronger impact on less educated individuals, who were potentially more prone to misinterpret the testing procedures – particularly regarding the anonymity and confidentiality of test results. Column (c) provides evidence consistent with this conjecture.Footnote 30
6.2. Threats and robustness checks
I addressed two major threats to the findings. First, the observed decrease in women’s testing uptake might be due to chance, given that 38 women (and 72 men) refused HIV testing in the main study sample. To address this, I sequentially excluded each individual who refused testing from the sample and re-estimated a linear polynomial model of equation (4) with full controls. The stable pattern of the estimates, as shown in Figure S.2 of the supplementary material, including the original estimates at ID $=$
$=$ $0$
on the horizontal axis, indicates that the decrease in women’s testing uptake is unlikely due to specific refusals.
$0$
on the horizontal axis, indicates that the decrease in women’s testing uptake is unlikely due to specific refusals.
Second, despite Figure 3 supporting the validity of the RD design, there is concern that the observed decrease in women’s testing uptake might be due to an unintended post-legislation increase in the proportion of those who would have refused testing regardless of the law. To address this, I applied methods from Lee (Reference Lee2009) (i.e., bounds on treatment effects) and Oster (Reference Oster2019) (i.e., assessing bias from unobservables) to evaluate the potential impact of such refusals. First, I analyzed data from respondents interviewed before the legislation and regressed HIV testing uptake on full controls. Second, I used these coefficients to predict testing uptake for respondents interviewed on or after the legislation, reflecting their likely behavior had the law not been enacted. Third, I estimated a linear polynomial model of equation (4) with full controls, excluding respondents in the bottom 50% of the predicted value distribution among those who refused testing post-legislation. The estimated effect on women’s testing uptake was -0.021, with a standard error of 0.010, which is a reduction from the original −0.033 (column (c), Table 2). However, even after excluding the bottom 50% of the predicted value distribution, the effect remains statistically and economically significant. Thus, attributing the decrease in women’s testing uptake to an invalid RD design would require assuming that over 50% of those who refused testing post-legislation would have refused testing regardless of the law, which seems unlikely.
Figure 4 presents the results of four robustness checks. First, the left two panels illustrate the law’s impact on HIV testing uptake under various specifications. The findings are robust across different bandwidths and polynomial orders.
Robustness checks (OLS).
Note: (1) The left two panels display the estimated ${\alpha _2}$
from equation (4) with 95% confidence intervals, varying by bandwidth and polynomial order. The estimations control for all available covariates (as listed in Table 1), region-fixed effects, and enumerator-fixed effects. Standard errors are clustered at the community and day-of-interview levels. (2) The top-middle panel displays the estimated
${\alpha _2}$
from equation (4) with 95% confidence intervals, varying by bandwidth and polynomial order. The estimations control for all available covariates (as listed in Table 1), region-fixed effects, and enumerator-fixed effects. Standard errors are clustered at the community and day-of-interview levels. (2) The top-middle panel displays the estimated ${\alpha _2}$
from equation (4) with 95% confidence intervals. The estimates for
${\alpha _2}$
from equation (4) with 95% confidence intervals. The estimates for $M$
(ranging from
$M$
(ranging from $- 25$
to
$- 25$
to $25$
) on the horizontal axis are derived from a linear polynomial regression, using “June 29, 2006,
$25$
) on the horizontal axis are derived from a linear polynomial regression, using “June 29, 2006, $+$
$+$ $M$
days” as the cutoff date. For instance, estimates at
$M$
days” as the cutoff date. For instance, estimates at $M$
$M$ $=$
$=$ $- 25$
and
$- 25$
and $M$
$M$ $=$
$=$ $25$
are derived from using June 4, 2006, and July 24, 2006, as the cutoff date, respectively. The original estimates, as reported in Table 2, are indicated at
$25$
are derived from using June 4, 2006, and July 24, 2006, as the cutoff date, respectively. The original estimates, as reported in Table 2, are indicated at $M$
$M$ $=$
$=$ $0$
. The estimations control for all available covariates (as listed in Table 1), region-fixed effects, and enumerator-fixed effects. Standard errors are clustered at the community and day-of-interview levels. (3) The bottom-middle panel shows the estimated
$0$
. The estimations control for all available covariates (as listed in Table 1), region-fixed effects, and enumerator-fixed effects. Standard errors are clustered at the community and day-of-interview levels. (3) The bottom-middle panel shows the estimated ${\alpha _2}$
from equation (4) with 95% confidence intervals. The estimates for
${\alpha _2}$
from equation (4) with 95% confidence intervals. The estimates for $W$
(ranging from
$W$
(ranging from $0$
to
$0$
to $5$
) on the horizontal axis are derived from a linear polynomial regression excluding observations with
$5$
) on the horizontal axis are derived from a linear polynomial regression excluding observations with $\left| {{d_i} - z} \right|$ $\lt$
$\lt$ $W$
. For instance, excluding respondents interviewed on the day of legislation corresponds to
$W$
. For instance, excluding respondents interviewed on the day of legislation corresponds to $W$
$W$ $=$
$=$ $1$
. The original estimates, as reported in Table 2, are shown at
$1$
. The original estimates, as reported in Table 2, are shown at $W$
$W$ $=$
$=$ $0$
. The estimations control for all available covariates (as listed in Table 1), region-fixed effects, and enumerator-fixed effects. Standard errors are clustered at the community and day-of-interview levels. (4) The right two panels show the distribution of 1000 placebo estimates (horizontal axis) and their frequency (vertical axis). Each placebo estimate is derived by randomly permuting interview dates across individuals and estimating a linear polynomial model from equation (4) using a “fake” treatment indicator based on a “fake” running variable. The estimations control for all available covariates (as listed in Table 1), region-fixed effects, and enumerator-fixed effects. The dashed lines indicate the 5th and 95th percentiles of the placebo estimates’ distribution. The solid lines represent the original estimates, as reported in Table 2.
$0$
. The estimations control for all available covariates (as listed in Table 1), region-fixed effects, and enumerator-fixed effects. Standard errors are clustered at the community and day-of-interview levels. (4) The right two panels show the distribution of 1000 placebo estimates (horizontal axis) and their frequency (vertical axis). Each placebo estimate is derived by randomly permuting interview dates across individuals and estimating a linear polynomial model from equation (4) using a “fake” treatment indicator based on a “fake” running variable. The estimations control for all available covariates (as listed in Table 1), region-fixed effects, and enumerator-fixed effects. The dashed lines indicate the 5th and 95th percentiles of the placebo estimates’ distribution. The solid lines represent the original estimates, as reported in Table 2.

Second, I confirmed no discontinuities at other interview dates, as shown in the top-middle panel. This panel presents estimates from a linear polynomial regression of equation (4) with full controls, using “June 29, 2006, $+$
$+$ $M$
days” as the cutoff date, with
$M$
days” as the cutoff date, with $M$
on the horizontal axis. For
$M$
on the horizontal axis. For $M$
$M$ $=$
$=$ $25$
(or
$25$
(or $M$
$M$ $=$
$=$ $- 25$
) with a bandwidth of
$- 25$
) with a bandwidth of $h = 25$
, only treated (or control) observations are analyzed, minimizing potential contamination from the actual treatment effect.Footnote
31
$h = 25$
, only treated (or control) observations are analyzed, minimizing potential contamination from the actual treatment effect.Footnote
31
Third, I assessed the sensitivity of the findings to observations near the cutoff, as reported in the bottom-middle panel. This panel shows estimates from a linear polynomial model of equation (4) with full controls, excluding observations with $\left| {{d_i} - z} \right|{\rm{ \lt }}W$
for various
$\left| {{d_i} - z} \right|{\rm{ \lt }}W$
for various $W$
values on the horizontal axis.Footnote
32
This “donut-hole” analysis helps ensure the absence of selecting sorting at the treatment threshold. The results confirm that the decrease in women’s testing uptake remains robust.
$W$
values on the horizontal axis.Footnote
32
This “donut-hole” analysis helps ensure the absence of selecting sorting at the treatment threshold. The results confirm that the decrease in women’s testing uptake remains robust.
Fourth, I conducted a variant of the permutation test, shown in the right two panels, which presents the distribution of 1000 placebo estimates. Each estimate was generated by randomly permuting interview dates across individuals and estimating a linear polynomial model of equation (4) with full controls using a “fake” treatment indicator based on a “fake” running variable. The dashed lines in the panels represent the 5th and 95th percentiles of this distribution, while the solid lines indicate the original estimates from Table 2. The study’s overall implications remain robust.
6.3. What explains the difference in HIV testing uptake between the sexes?
The law discouraged women’s testing uptake, but had no effect on men. This gendered difference may be attributed to the high level of gender equality and discrimination in Mali. Specifically, gender inequality in Mali is severe (Heath et al., Reference Heath, Hidrobo and Roy2020; Lees et al., Reference Lees, Kyegombe, Diatta, Zogrone, Roy and Hidrobo2021; Sida, 2004), with the country being classified as having a “very high” level of gender discrimination in social institutions (OECD, 2023). Especially, despite common resource pooling in households, women’s bargaining power remains insufficient, placing Mali 34th and 36th out of 180 and 157 countries, respectively, for discrimination in the family and access to productive and financial resources (OECD, Reference Castron.d.).Footnote 33 The 2006 DHS data show that only 11% of Malian women could independently decide on large household purchases, and 17% could decide on daily purchases. In the 2012–13 DHS, about 84% of women reported that their husbands solely decided how to use their earnings (the 2006 DHS lacked similar information).Footnote 34 These factors, combined with restricted income opportunities, force many Malian women to rely heavily on their partners for financial support (Van de Walle, Reference Van de Walle2013).
Such financial reliance makes Malian women particularly vulnerable to HIV-related mistreatment from family members. As a result, they may be more reluctant to undergo testing compared to men, fearing that being perceived as a PLH could lead to mistreatment. In this study, the law may have heightened these fears, deterring testing more strongly among women than men.
This interpretation aligns with the perception that coercive HIV-specific legislation disproportionately impacts women (Global Commission on HIV and the Law, 2011). Specifically, women often first learn of their HIV-positive status through antenatal or other healthcare services, making them more likely to face accusations from family members of exposing their partners to HIV (WHO, 2015, p. 22). Some scholars argue that women might avoid seeking necessary healthcare services, such as those for preventing mother-to-child transmission, to escape prosecution or physical and emotional abuse (Ahmed, Reference Ahmed2011; Weait, Reference Weait2011).Footnote 35
6.4. Limitations
Before concluding, this subsection discusses three key limitations of the study. First, although HIV stigma likely influenced testing behavior – particularly in rural areas [column (b), Table 3] – its conceptual and empirical complexity prevents direct measurement and analysis. Nevertheless, I examine the law’s effect on perceived stigma – specifically, on the parameters ${c_i}$
and
${c_i}$
and $\rho$
– using relevant DHS questions. I offer suggestive evidence in Section S.3 of the supplementary material that stigma played a role in shaping testing behavior, although these empirical analyses are exploratory due to measurement challenges and yield nuanced results.
$\rho$
– using relevant DHS questions. I offer suggestive evidence in Section S.3 of the supplementary material that stigma played a role in shaping testing behavior, although these empirical analyses are exploratory due to measurement challenges and yield nuanced results.
Second, evaluating the law’s effect on respondents who tested seropositive – i.e., ${\rm{Prob}}\left( {{a_i} = 1 \cap {c_i} = {c_H}} \right)$
– is particularly insightful for understanding how the legislation affected testing uptake among HIV-positive individuals, expressed as
${\rm{Prob}}\left( {{a_i} = 1 \cap {c_i} = {c_H}} \right)$
– is particularly insightful for understanding how the legislation affected testing uptake among HIV-positive individuals, expressed as ${\rm{Prob}}({a_i} = 1{\rm{\;\;}}|{\rm{\;\;}}{c_i} = {c_H})$
.Footnote
36
However, conducting this analysis is constrained by the very low HIV prevalence in the study sample – less than 2% among women and 1% among men – which hampers robust conclusions. Additional discussion and analysis are available in Section S.4 of the supplementary material.
${\rm{Prob}}({a_i} = 1{\rm{\;\;}}|{\rm{\;\;}}{c_i} = {c_H})$
.Footnote
36
However, conducting this analysis is constrained by the very low HIV prevalence in the study sample – less than 2% among women and 1% among men – which hampers robust conclusions. Additional discussion and analysis are available in Section S.4 of the supplementary material.
Third, examining changes in sexual behavior is contextually relevant, as the DHS provides self-reported data on condom use during the most recent sexual intercourse and the type of sexual partners involved. However, the timing of this intercourse is not specified. Thus, using the interview day as the running variable would not accurately capture behavioral changes unless the intercourse occurred around the legislation date. Additionally, concerns about the accuracy of self-reported sexual behavior (Corno & de Paula, Reference Corno and de Paula2019) further complicate the analysis.
7. Conclusion
HIV criminalization is a global phenomenon: 82 countries – covering 111 jurisdictions, including subnational entities within Mexico, Nigeria, and the US – have enacted HIV-specific criminal laws (Symington & Bernard, Reference Symington and Bernard2022). Sub-Saharan Africa has the largest number of such jurisdictions (30 countries), followed by Eastern Europe and Central Asia, Latin America and the Caribbean, the Asia-Pacific region, the Middle East and North Africa, and North America (only the US) (ibid.).Footnote 37 Public health experts and advocacy groups have expressed concern that these laws reinforce discrimination against PLHs, undermine prevention efforts, and exacerbate the epidemic. The Global AIDS Strategy 2021–2026 (UNAIDS, 2021) sets a target that, by 2025, fewer than 10% of countries will maintain punitive legal and policy environments that result in the denial or restriction of access to healthcare services. Nevertheless, only a few countries have thus far repealed these laws. Despite ongoing global policy discussions, rigorous empirical studies evaluating the impacts of HIV criminalization remain limited.
In this study, I examined the effect of Mali’s HIV-specific law on voluntary testing, focusing on HIV stigma. I used an RD design within a unique context: Mali enacted the law during a nationally representative survey offering anonymous and voluntary testing. This setting was ideal for studying stigma rather than legal consequences, as testing was confidential, though household members could still infer who was tested and potentially discriminate based on suspected positive serostatus.
Empirical analyses showed that the law reduced women’s HIV testing uptake by approximately 3–4% compared to the day before. Rural women more strongly refused testing than urban women, likely due to higher stigma costs in rural areas. These effects were more pronounced among those with radios, suggesting that radio broadcasts heightened public awareness of the legislation. Women without completed formal education were particularly deterred from testing, likely because they misunderstood the anonymity and confidentiality of test results, thereby experiencing greater stigma-related concerns. In contrast, the law did not impact men’s testing uptake. Malian women, who typically depend on men for financial support (Heath et al., Reference Heath, Hidrobo and Roy2020; Lees et al., Reference Lees, Kyegombe, Diatta, Zogrone, Roy and Hidrobo2021; Van de Walle, Reference Van de Walle2013), are vulnerable to HIV-related mistreatment from family members. This likely makes women more reluctant to test due to fear of assumed positive serostatus and subsequent mistreatment. The law may have intensified this fear, resulting in a stronger deterrent effect on testing among women than men. This aligns with the common view that HIV criminalization disproportionately affects women, who often first discover their seropositivity through antenatal or other healthcare services and face discrimination from peers who may blame them for the virus. This fear of discrimination likely deterred women from seeking healthcare post-legislation.
The theoretical model also suggested that the law may have deterred testing among HIV-positive individuals. Consequently, HIV criminalization might drive at-risk populations into hiding, potentially increasing HIV prevalence over time. However, due to the small number of seropositive cases and limited data variation, the law’s effect on testing uptake among HIV-positive individuals remains inconclusive. Future research should explore this further.
Previous studies estimate Mali’s HIV prevalence at approximately 3% (Pichard et al. Reference Pichard, Guindo, Grossetete, Fofana, Maiga, Koumare, Traore, Maiga, Brun-Vezinet and Rosenheim1988; White et al. Reference White, Kristensen, Coulibaly, Sarro, Chamot and Tounkara2009). If the law discouraged testing among HIV-negative individuals by 1%, the observed 3%–4% overall decline implies that roughly 67%–100% of HIV-positive individuals avoided testing due to the legislation. Given that Mali’s female population aged 15–64 is approximately 5.647 million (The World Factbook, 2023), this corresponds to 0.114–0.171 million fewer women knowing their seropositive status, with potential downstream effects on health and household welfare (e.g., childcare and domestic responsibilities).Footnote 38
Reduced maternal health may increase children’s school dropout rates and psychological stress, as children assume greater caregiving and domestic responsibilities. Some may eventually be orphaned following maternal death. Moreover, undiagnosed women may contribute to higher HIV prevalence by transmitting the virus to their partners or newborns. According to the 2006 DHS data, Malian women give birth to an average of 3.535 children. Given a 15%–45% rate of mother-to-child transmission without effective interventions in Africa (WHO Africa Region, 2025), assuming a 15% transmission rate and three births per woman implies that 0.114–0.171 million untreated seropositive mothers could transmit the virus to approximately 51,000–77,000 newborns. These estimates highlight that even a modest 3%–4% decline in HIV testing uptake can have considerable public health and socioeconomic consequences.
Although based on data from a single country, these findings can serve as a useful reference point for understanding potential impacts in other contexts. On the one hand, during the DHS, HIV testing was offered under conditions that minimized monetary, opportunity, and psychological costs: respondents could be tested using clean and safe equipment, free of charge, without visiting a health facility, and without facing language barriers. Consequently, the law may have a stronger deterrent effect on HIV testing uptake in settings where individuals must travel to local health centers for voluntary counseling and testing. Moreover, the negative impact could be larger than that estimated here, as the DHS did not capture non-household populations – such as at-risk individuals living on the streets or in institutions (e.g., brothels) (Mishra et al., Reference Mishra, Barrere, Hong and Khan2008).
On the other hand, Mali’s overall HIV prevalence is relatively low. Compared with epidemic countries in eastern and southern Africa, this “minority” status of PLHs, combined with an exaggerated public perception of infection risk (Godlonton & Thornton, Reference Godlonton and Thornton2013), may have intensified HIV-related stigma in Mali. Consequently, at-risk individuals might be more selective in deciding whether to take an HIV test. Furthermore, while many countries in western and central Africa – where HIV prevalence levels are similar to Mali’s – adopted the N’Djamena model law, HIV-specific legislation in epidemic countries in eastern and southern Africa tends to be less punitive and more inclusive of marginalized groups (Csete et al., Reference Csete, Pearshouse and Symington2009, p. 158). Therefore, HIV-specific laws in those regions may not necessarily discourage HIV-positive individuals from undergoing testing.
While the reduction in women’s testing uptake appears to have persisted for several months (Figure 1; see also Section S.5 of the supplementary material), this study focused only on the immediate effects of HIV-specific legislation on testing within the DHS context, with particular emphasis on HIV stigma. Future research should explore the broader and long-term impacts on voluntary testing, sexual behavior, and HIV prevalence, and evaluate the relative significance of protective versus punitive measures. Despite these limitations, the findings offer valuable insights for policymakers considering legal interventions to control infectious diseases.
Supplementary material
The supplementary material for this article can be found at https://doi.org/10.1017/dem.2026.10019
Acknowledgements
I thank an editor, two anonymous referees, Seiro Ito, Chikako Yamauchi, and participants at several seminars and conferences. I am also much obliged to Traore Bouyagui, Mamadou Cissé, Bintou Dembélé Keita, Seydou Doumbia, Macky Tall, Nouhoum Telly, and some others for helping me obtain the detailed information on the DHS program and the development process of the legislation. During the preparation of this work, the author used ChatGPT in order to improve language and readability. After using this tool, the author reviewed and edited the content as needed and takes full responsibility for the content of the published article. The author has no relevant or material financial interests that relate to the research described in this paper. The findings, interpretations, and conclusions expressed in this paper are entirely those of the author and do not represent the views of the IDE-JETRO. All errors are my own.
Funding statement
This research was supported by a research grant from the Institute of Developing Economies, Japan External Trade Organization [2019_2_40_007].














 Open access

