

Online surveys using convenience samples are increasingly popular in the social sciences. While subject recruitment can be outsourced to commercial internet panels, scholars often rely on lower-cost, do-it-yourself methods, such as Facebook advertisements and Amazon.com’s Mechanical Turk (MTurk). MTurk is now a common source for survey respondents in American politics (e.g., Arceneaux Reference Arceneaux2012; Grimmer, Messing and Westwood Reference Grimmer, Messing and Westwood2012; Huber, Hill and Lenz Reference Huber, Hill and Lenz2012; Christenson and Glick Reference Christenson and Glick2015a; Christenson and Glick Reference Charnysh, Lucas and Singh2015b) and the study of India (e.g., Ausderan Reference Ausderan2014; Charnysh, Lucas and Singh Reference Charnysh, Lucas and Singh2015; Dietrich and Winters Reference Dietrich and Winters2015). Meanwhile, Facebook advertisements have become a popular recruitment method for studies focusing on other countries (e.g., Samuels and Zucco Reference Samuels and Zucco2014; Boas Reference Boas2016).
The availability of different recruitment options for online convenience samples poses important questions about advantages and disadvantages. Yet, scholars rarely compare sources of online respondents to one another, and it is not clear that they actively consider alternatives at the design stage. In social science research on India and the United States, the two countries where both Facebook and MTurk are viable, we are not aware of any study that used advertisements on Facebook as its primary subject recruitment method.
This study presents a comparison of online convenience sampling via Facebook, MTurk, and a Qualtrics internet panel in India and the United States. In the fall of 2015, we administered an online survey to at least 1000 respondents recruited through each method in each country. We examine demographics, attitudes, and knowledge by drawing questions from recent gold standard surveys using face-to-face interviews with national probability samples. We also measure respondent quality, focusing on non-response, attrition, and screener passage rates (Berinsky, Margolis and Sances Reference Berinsky, Margolis and Sances2014). Finally, we replicate several survey experiments conducted on probability samples in each country. The research design and pre-analysis plan (PAP) were registered in advance with Evidence in Government and Politics (EGAP).
This study builds upon existing methodological research on online convenience samples, while also moving beyond it. A growing literature has evaluated MTurk samples in the United States by comparing them to probability samples and/or traditional, in-person convenience samples (Berinsky, Huber and Lenz Reference Berinsky, Huber and Lenz2012; Krupnikov and Levine Reference Krupnikov and Levine2014; Clifford, Jewell and Waggoner Reference Clifford, Jewell and Waggoner2015; Huff and Tingley Reference Huff and Tingley2015; Leeper and Mullinix Reference Leeper and Mullinix2015; Mullinix et al. Reference Mullinix, Leeper, Druckman and Freese2015; Levay, Freese and Druckman Reference Levay, Freese and Druckman2016; Necka et al. Reference Necka, Cacioppo, Norman and Cacioppo2016). Samuels and Zucco (Reference Samuels and Zucco2013) have done a similar comparison using Facebook in Brazil. Studies in other disciplines have compared the demographics of MTurk users in India and the United States (e.g., Antin and Shaw Reference Antin and Shaw2012; Litman, Robinson and Rosenzweig Reference Litman, Robinson and Rosenzweig2014). Yet, few studies have compared MTurk to alternative online convenience sample sources, and those that have included Facebook have recruited few respondents from this source (Leeper and Mullinix Reference Leeper and Mullinix2015; Antoun et al. Reference Antoun, Zhang, Conrad and Schober2016). Our study is the first—of India or the United States—to compare MTurk recruitment to both Facebook and a commercial panel. Moreover, it draws large samples using each of these methods, allowing for more confident comparisons.
The best choice for online convenience sampling will depend on the location of a study and its objectives. In the United States, MTurk’s low cost and recruitment speed make it an excellent method for pretesting, exploratory research, and designs that depend on current events (Christenson and Glick Reference Christenson and Glick2013). It also draws the most attentive and cooperative subject pools which is useful for testing the effects of subtle experimental treatments. Meanwhile, for studies aiming to attract a more representative sample, a Qualtrics panel offers advantages at approximately three times the cost of MTurk. For its part, Facebook offers attractive options for targeted recruitment via advertisements to particular demographic or political groups.
In India, online recruitment methods tend to draw a less diverse sample than in the United States, meaning that scholars should be wary of using them to estimate population parameters. All three online samples were disproportionately young, wealthy, male, highly educated and upper-caste. Yet, there are marked differences in geographical diversity. Facebook’s broad national coverage was indistinguishable from that of a representative sample, whereas MTurk drew heavily from the two southern states of Kerala and Tamil Nadu. The Qualtrics panel, while fast and easy, was more expensive than other methods, without the gains in sample diversity.
Finally, our replication of survey experiments offers lessons about the advantages and disadvantages of online convenience samples as a whole. Using all three recruitment methods, we were mostly successful at replicating patterns of treatment interactions with partisanship in the United States—namely, experimental prompts to which Republicans respond more substantially than Democrats. These results suggest that online convenience samples can often provide valid inferences regarding treatment heterogeneity. On the other hand, online convenience samples often lack representativeness on the same variables, including partisanship, that generate heterogeneous treatment effects, which has implications for external validity. Across recruitment methods and countries, sample average treatment effects in our replicated experiments were often quite far from benchmarks obtained using nationally representative samples—though always correct in direction and significance. Hence, scholars intending to generalize treatment effect estimates beyond their online samples should be prepared to carefully defend the validity of these broader inferences.
Recruitment methods for online convenience samples
Recruiting subjects for online convenience samples requires notifying a study population of the availability of a survey and offering some incentive for participation. Facebook, MTurk, and commercial internet panels differ significantly in terms of the costs and procedures for accomplishing these tasks.Footnote 1
MTurk is an online labor market in which workers are hired to complete Human Intelligence Tasks (HITs). A HIT announcement conveys the amount of compensation and estimated completion time; those who click on it are redirected to an online survey on an external site. Upon completion, respondents are typically given randomly generated codes that they use to claim payment, which takes place entirely within the MTurk system. Recruitment costs consist of a 40 percent commission paid to Amazon.
Recruiting survey respondents via Facebook differs in several respects. While MTurk workers are actively looking for employment, one must reach out to Facebook users by buying advertisements that lead them to the online survey. Advertisements can be targeted based on demographic data, as well as less objective information, such as political sympathies, that Facebook gleans from users’ online behavior. Payment and the frequency of ad displays are based on a bid system; one can pay for each click, ad view, or action taken on the target website. The latter option allows Facebook to dynamically adjust advertising based on the types of users who are most likely to complete the survey. Recruiting via Facebook also differs in that there is no built-in mechanism for compensating subjects. A common approach is to offer a raffle prize as an incentive for participation. Upon completion of the survey, those entering the raffle can be redirected to a separate survey where they provide their contact information.
A third popular option for gathering online convenience samples is to outsource recruitment to an internet panel provider. Internet panels consist of respondents who have signed up to take online surveys in exchange for incentives such as cash, airline miles, and gift cards. Recruitment and compensation are handled by the third-party firm, so researchers have no direct control over how much subjects are paid or who is targeted, apart from defining the audience and specifying certain quotas. Rather, they pay the panel provider a set price per completed survey. This option is typically the most expensive, but it is fast and easy to manage. We opted for a panel from Qualtrics, which aggregates panel respondents initially recruited by other firms.
Research design
We used the Qualtrics survey platform to administer identical questionnaires to subjects recruited through Facebook, MTurk, and Qualtrics internet panels in India and the United States. We initially recruited approximately 3000 respondents in each country, evenly divided among recruitment methods. We subsequently drew another 600 respondents each from Facebook and MTurk in the United States, targeting age ranges that were underrepresented in the initial sample. The surveys ran from October 26, 2015 through December 14, 2015 (India) and January 16, 2016 (United States). In neither country was there a national election or other major political event taking place that might be expected to affect responses.Footnote 2
We made the recruitment methods in each country as similar to one another as possible. We used a raffle rather than individual payments to Facebook-recruited respondents, but we ensured that the expected value of individual compensation was equal to the payments to MTurk workers, as discussed in Appendix section 1.Footnote 3 We had no control over the amount of compensation offered to Qualtrics participants, and Qualtrics was unable to provide us with compensation details. However, we were informed that payments are generally one-third the amount Qualtrics charges to the client, or $1.50–$2.50, in both India and the United States These payments are higher—many times so in India—than the compensation offered to MTurk and Facebook respondents.
Other recruitment decisions aimed to balance the goals of drawing a broad, unadulterated sample, keeping costs manageable, and adhering to standard practice in prior political science research. For the Qualtrics panel, we opted not to use quotas even though several were included in the base price. On MTurk, we advertised the HIT to all workers over 18 with a 95 percent or higher approval rating (Berinsky, Huber and Lenz Reference Berinsky, Huber and Lenz2012), but we imposed no other restrictions. Facebook advertisements were targeted to all adults in India and the United States using either desktop computers or mobile devices. We optimized Facebook ad placement for survey completions and linked ads to a sponsoring Facebook business page, both of which reduce advertising costs. As with prior studies of India (Charnysh, Lucas and Singh Reference Charnysh, Lucas and Singh2015; Dietrich and Winters Reference Dietrich and Winters2015), our online survey was administered in English, a common second language among the computer literate.
Recruitment methods in each country varied significantly in the cost and time required to draw an N=1000 sample, as summarized in Appendix section 1. For Facebook, we planned on recruiting for one to two weeks and set our advertising budget accordingly. Total costs (advertising plus compensation) for these samples were $2.55 per completed survey in the United States, where the ad ran for 10 days, and $1.43 in India, where it ran for 15. Our MTurk sample in the United States was the quickest to recruit; we obtained 500 completions within 15 minutes and nearly 1000 within four hours. Meanwhile, the India MTurk sample was the slowest to come in, stretching over more than six weeks. Total costs for MTurk respondents, including Amazon.com’s 40 percent commission, consisted of $1.38 per valid, completed survey in the United States and $0.43 in India. Finally, we contracted with Qualtrics to pay $5 per respondent for an N=1000 sample in the United States, which was recruited over two days, and $6 in India, which took four days. Final costs were slightly lower ($4.67 in the United States and $5.87 in India) due to extra completions.
After initial recruitment, we found that the age ranges in the US Facebook and MTurk samples were highly restricted, but in different ways. In the Facebook sample, 90 percent of respondents were 55 or older. Facebook’s algorithm had aggressively optimized ad placement for this age group, which was completing the survey at the lowest cost. The MTurk sample was biased in the opposition direction, with 80 percent of respondents being 40 or younger.
Given the skewed age distribution in both samples, we opted to use targeted recruitment to draw an additional 600 respondents from each source. On Facebook, we relaunched our advertisements, forcing the algorithm to optimize for completions within distinct age brackets. These advertisements ran for six days; total costs for this phase were $3.60 per completed survey. With MTurk, we targeted older respondents using the two-stage sampling method described by (Gay, Hochschild and White Reference Gay, Hochschild and White2016). We first conducted a screening survey within MTurk, for a payment of 7–10 cents, that asked age, sex, and a dummy question about current events. After gathering 4000 responses over about five weeks, we then recontacted respondents over 40 and invited them to take our main survey, which led to 626 additional completions from January 4–16. Total costs for this phase, including the screening survey, amounted to $2.13 per completed survey.
In the analysis that follows, we report one set of results using our raw convenience samples and another that applies census-based, post-stratification weights for region, and sex.Footnote 4 For the US MTurk and Facebook samples, our unweighted analysis uses only the initial N≈1000 samples while our weighted analysis also draws on the newly recruited respondents.
Several advantages and disadvantages of the various methods are evident from our recruiting experience. MTurk features the lowest-cost respondents in both countries and is fastest option in the United States. In India, MTurk implies trading low cost for slower recruitment. A Qualtrics internet panel is the most expensive option in both places—significantly so in India—but it is quick and hassle-free. The cost of Facebook recruiting lies between the other two. Finally, for both MTurk and Facebook, targeting harder-to-reach age groups increased the overall cost per completed survey by about 40–50 percent. With Facebook, targeted recruitment based on age—or virtually anything else Facebook knows about its users—can be accomplished quickly and easily. On MTurk, targeted recruitment can be done at even lower cost, and with similar ease, for variables included in a new “premiere qualifications” option, discussed in Appendix section 1.
Demographics
To compare the demographics of convenience sample respondents to those of the national population, we drew questions from recent surveys involving face-to-face interviews with national probability samples—primarily the 2014 General Social Survey (GSS) in the United States and the 2014 National Election Study in India. In this section and those that follow, we present a number of comparisons between each convenience sample and these national benchmarks. For MTurk and Facebook, most of the unweighted comparisons correspond to specific pre-registered hypotheses. Analyzing Qualtrics-recruited samples was also included in our PAP, as was the weighted analysis of all three samples, but we did not advance specific hypotheses in these areas. In the analysis below, we present descriptive statistics from each sample graphically. In Appendix section 3, we present tables of standardized mean differences and significance tests, indicating which tests were pre-specified and whether they are supported or rejected (adjusting p-values for multiple comparisons using the method of Benjamini and Hochberg Reference Benjamini and Hochberg1995).
The demographics of our US MTurk sample (Figure 1) generally comport with what other studies have found (Berinsky, Huber and Lenz Reference Berinsky, Huber and Lenz2012; Christenson and Glick Reference Charnysh, Lucas and Singh2015b; Huff and Tingley Reference Huff and Tingley2015; Leeper and Mullinix Reference Leeper and Mullinix2015; Levay, Freese and Druckman Reference Levay, Freese and Druckman2016). Our MTurk sample reports lower incomes than one finds in a probability sample; respondents are also younger and more highly educated. Consistent with this profile, they are also less likely to be married or report a religious affiliation. As with prior studies, we find that Hispanics and African-Americans are significantly underrepresented. We also find no difference in rural versus urban residence (operationalized as the log of the population density of the county associated with the respondent’s ZIP code) compared to the Cooperative Congressional Election Study (CCES).Footnote 5 Our MTurk sample is disproportionately male, whereas prior studies have characterized the MTurk population as primarily female. When applying weights based on age, sex, and region of the country, the difference in marriage rate disappears, and the income and religiosity gaps decrease, but the sample becomes less representative in terms of education, race, and ethnicity.
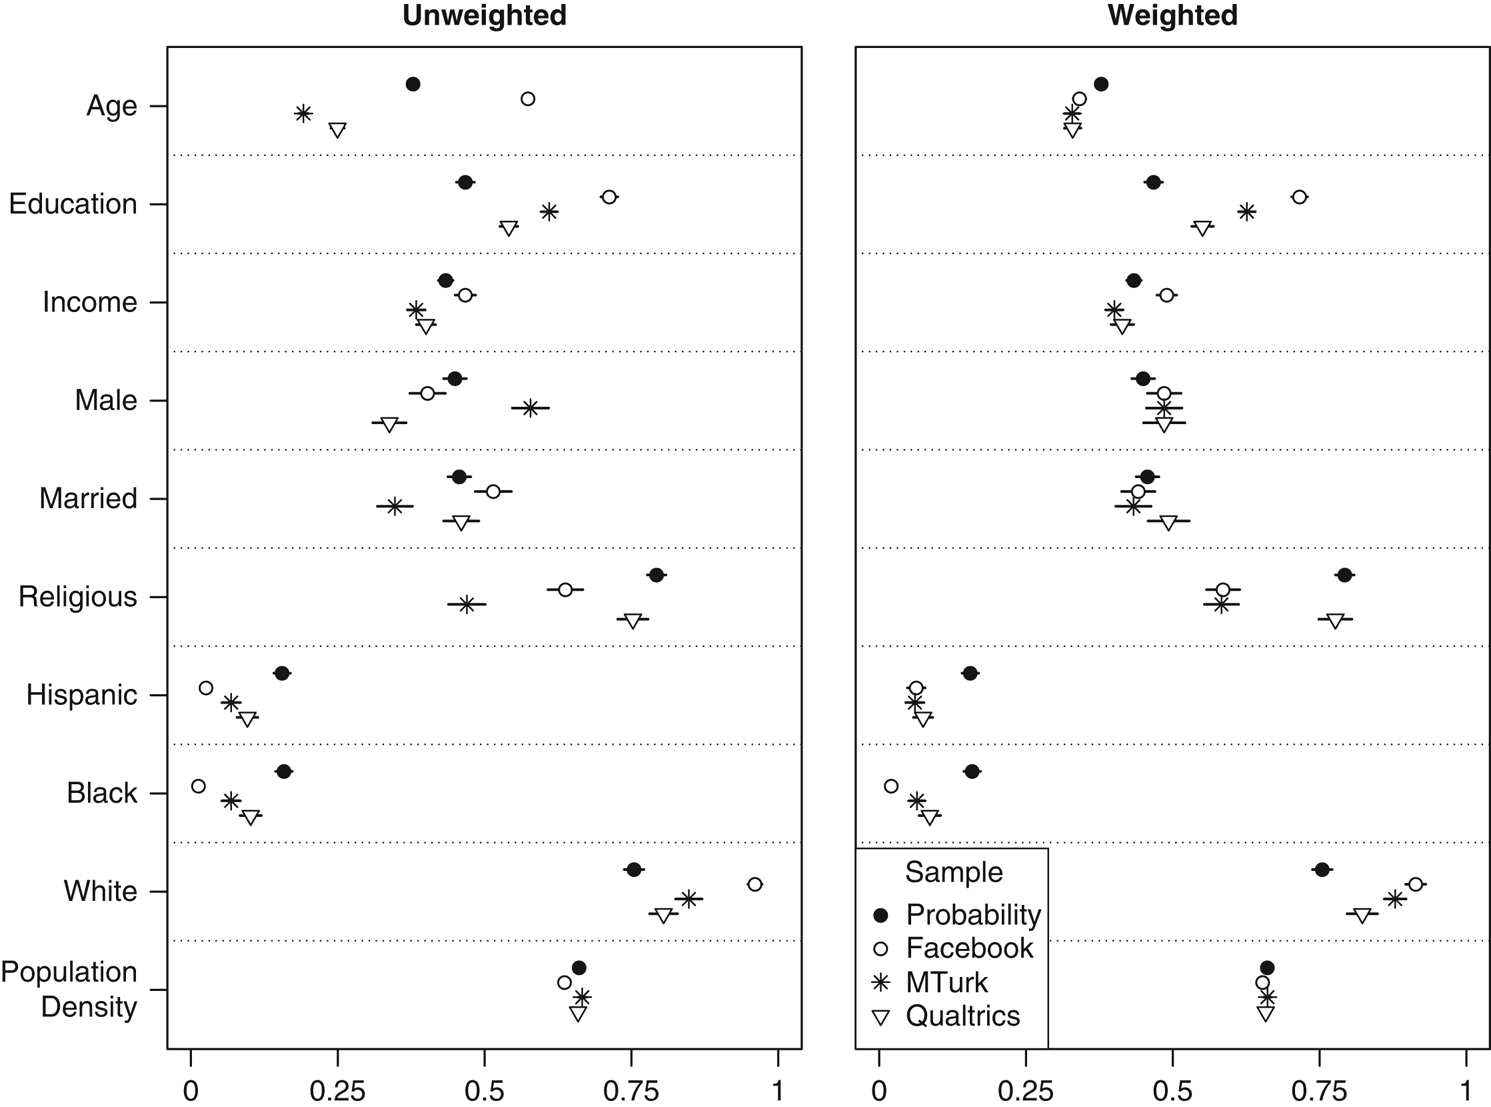
Figure 1 United States: demographics Note: Dots give sample means and lines indicate 95% confidence intervals. All variables scaled 0–1. Probability sample is the 2012 American National Election Study (education; non-oversampled face-to-face interviews only), the 2014 Cooperative Congressional Election Survey (population density), or the 2014 General Social Survey cross-section (all other variables).
As noted above, our US Facebook sample was unexpectedly old. Accordingly, we find that Facebook respondents are more likely to be married than those from the GSS. In other respects, the Facebook sample confirms our prior expectations. It is more highly educated, wealthier, more female, and less religious than a representative sample. It also has the largest share of whites, and the fewest blacks and Hispanics, of our US convenience samples. Facebook respondents come from less densely populated counties than CCES respondents, though this difference largely disappears when we weight by age, sex, and region. Weighting also reduces the disparities in terms of race, ethnicity, and marriage rate, though it exacerbates differences in income and religiosity.
In the United States, the Qualtrics-recruited sample came closest to a national probability sample on most variables. On age, education, income, race, and ethnicity, it was biased in the same direction as MTurk, but less severely so. For marriage rate and rural versus urban residence, there were no significant differences, and 75 percent of Qualtrics respondents reported a religious affiliation, only slightly less than in the GSS (79 percent). The sample stood out most in terms of sex; it was only 34 percent male. When applying weights, most of these disparities were eliminated or reduced.
We also sought to examine the geographical representativeness of each convenience sample. To do this, we compared the proportion of each sample residing in each state to the corresponding proportion of the over-18 US population, calculating the ϕ coefficient as a goodness-of-fit statistic and bootstrapping its sampling distribution.Footnote 6 As shown in Appendix section 4, our convenience samples do not differ significantly from a national probability sample, or from each other, based on this measure. Moreover, a barplot of state of residence shows that no state is under- or overrepresented in any online sample by more than about 3 percentage points.
In India (Figure 2), each of our convenience samples differed from a national probability sample in the same way, varying only by degrees. All respondents were younger, with Facebook the most extreme of the three samples (an average age of 27), followed by Qualtrics (31) and MTurk (32). Respondents were also more educated (averaging between an undergraduate and master’s level), without meaningful differences among convenience samples. Mean monthly income for each group was in the range of 10,000–20,000 Rupees ($150–300), versus 3000–4000 Rupees for a nationally representative sample. Male respondents made up 67 percent of the MTurk sample, 76 percent for Facebook, and 77 percent for Qualtrics. Consistent with the age, income, and education biases, convenience sample respondents were less likely to be married—especially Facebook (19 percent). All three had a smaller share of lower-caste members, with Facebook again constituting the outlier. Given our English-language survey instrument, we suspect that pronounced cross-caste differences in English language proficiency explain this pattern (Azam, Chin and Prakash Reference Azam, Chin and Prakash2013). Rural versus urban residence was operationalized in a similar fashion as in the United States, taking the log of the population density of the district associated with the respondent’s postal (PIN) code. Here, we lack a probability sample benchmark, but we found that MTurk respondents come from the least densely populated districts, followed by Facebook and Qualtrics. Weighting the sample based on age, sex, and region of the country reduced disparities in terms of marriage rate but generally exacerbated them in terms of caste, education, and income. In the case of MTurk, the findings are largely consistent with prior studies (Antin and Shaw Reference Antin and Shaw2012; Charnysh, Lucas and Singh Reference Charnysh, Lucas and Singh2015; Dietrich and Winters Reference Dietrich and Winters2015).
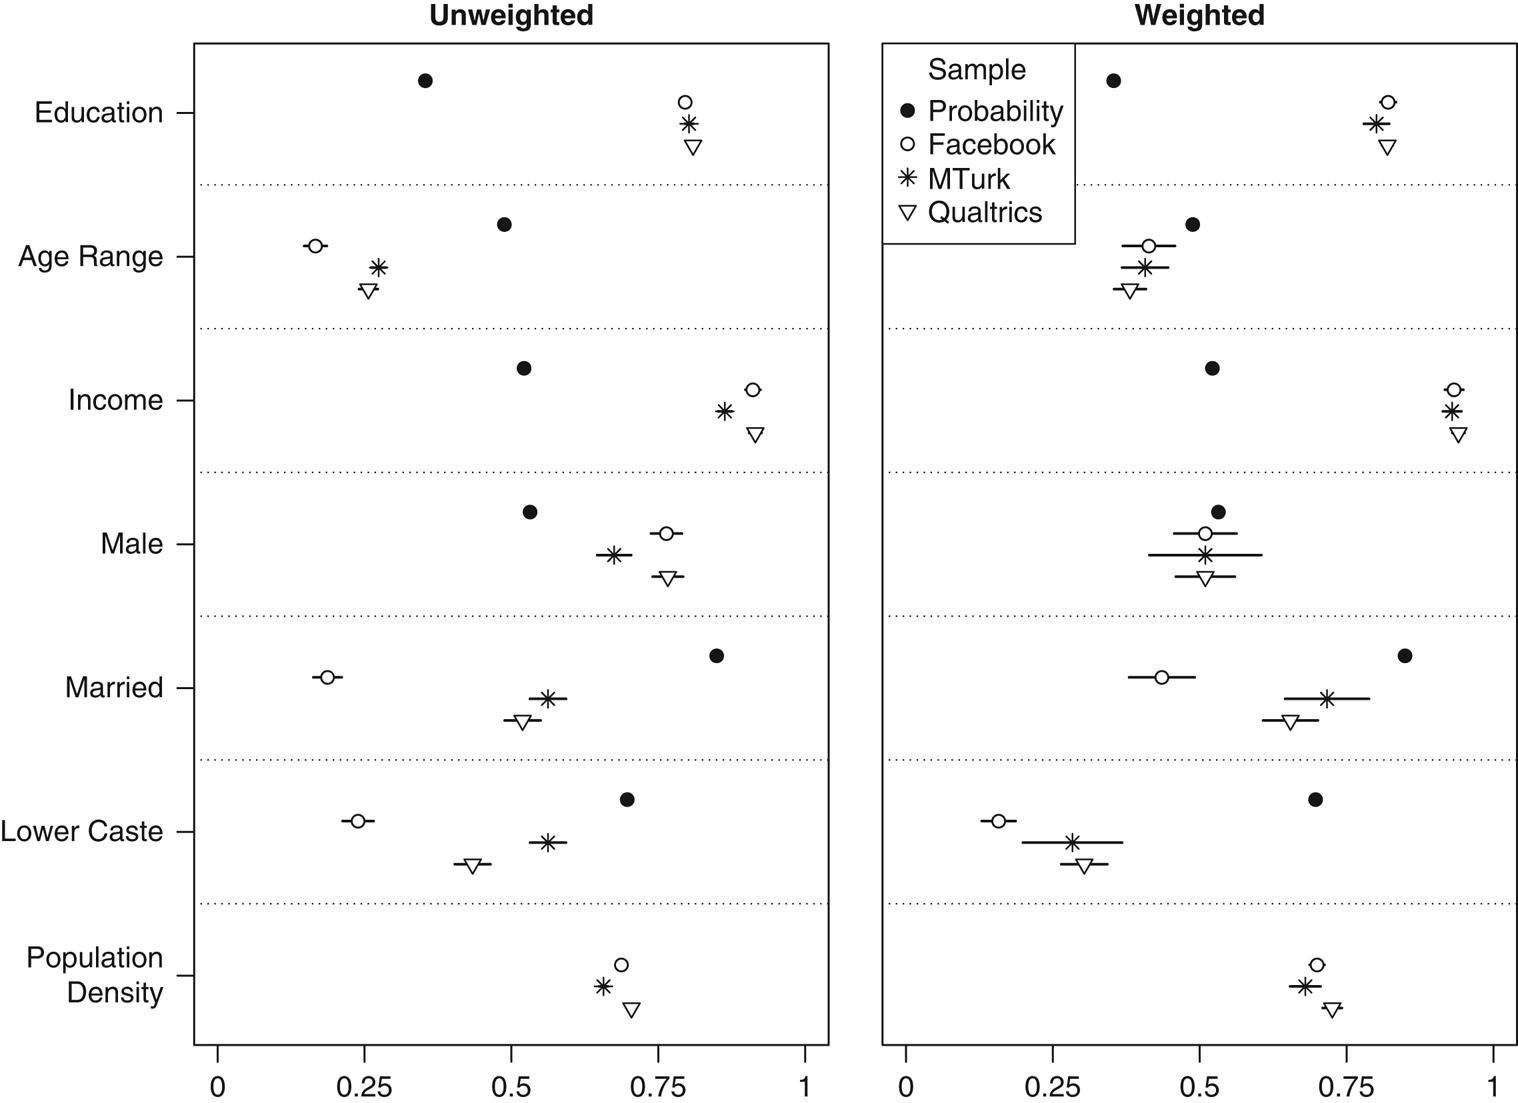
Figure 2 India: demographics Note: Dots give sample means and lines indicate 95% confidence intervals, though these are not visible for the probability sample given extremely large sample size. All variables scaled 0–1. Probability sample is the 2014 Indian National Election Study (pre-poll for married; post-poll for other variables).
In terms of geography, our Indian MTurk sample stands out as unusual. As shown in Appendix section 4, 47 percent is from the state of Tamil Nadu, compared to 6 percent of the national population, and 21 percent comes from Kerala, versus 3 percent of the population. Kerala and Tamil Nadu, the two southernmost states in India, are also overrepresented in the Facebook and Qualtrics samples, but not as dramatically. MTurk also underrepresents Uttar Pradesh, which is 17 percent of the population and only 1 percent of the sample (see Dietrich and Winters Reference Dietrich and Winters2015 for similar results). According to goodness-of-fit ϕ coefficients, Qualtrics and MTurk are less geographically representative than a national probability sample, whereas Facebook does not do significantly worse.Footnote 7
Some have attributed the heavy concentration of MTurk workers in Kerala and Tamil Nadu to demographic factors, such as higher levels of education and English-language fluency, as well as to the existence of MTurk “factories”—call center-type operations where numerous workers participate in surveys from a single physical location. We find little evidence for either explanation. The demographic similarities among our three samples suggest that each is drawing from a similar class of well-educated, technologically savvy respondents. If MTurk factories explain the concentration, this sample should present more geographical clustering within Kerala and Tamil Nadu. Figure 3 plots sample densities as a heat map by district within these states. Contrary to the factory hypothesis, MTurk respondents are fairly well distributed across Southern India, similar to the other samples. Moreover, Chennai, the capital of Tamil Nadu and the region’s major base for call center operations, is only modestly overrepresented in our MTurk sample (9.4 percent of the Tamil Nadu respondents, versus 6.4 percent of the state population) but heavily overrepresented in the Facebook and Qualtrics samples (37.2 and 25.2 percent, respectively).
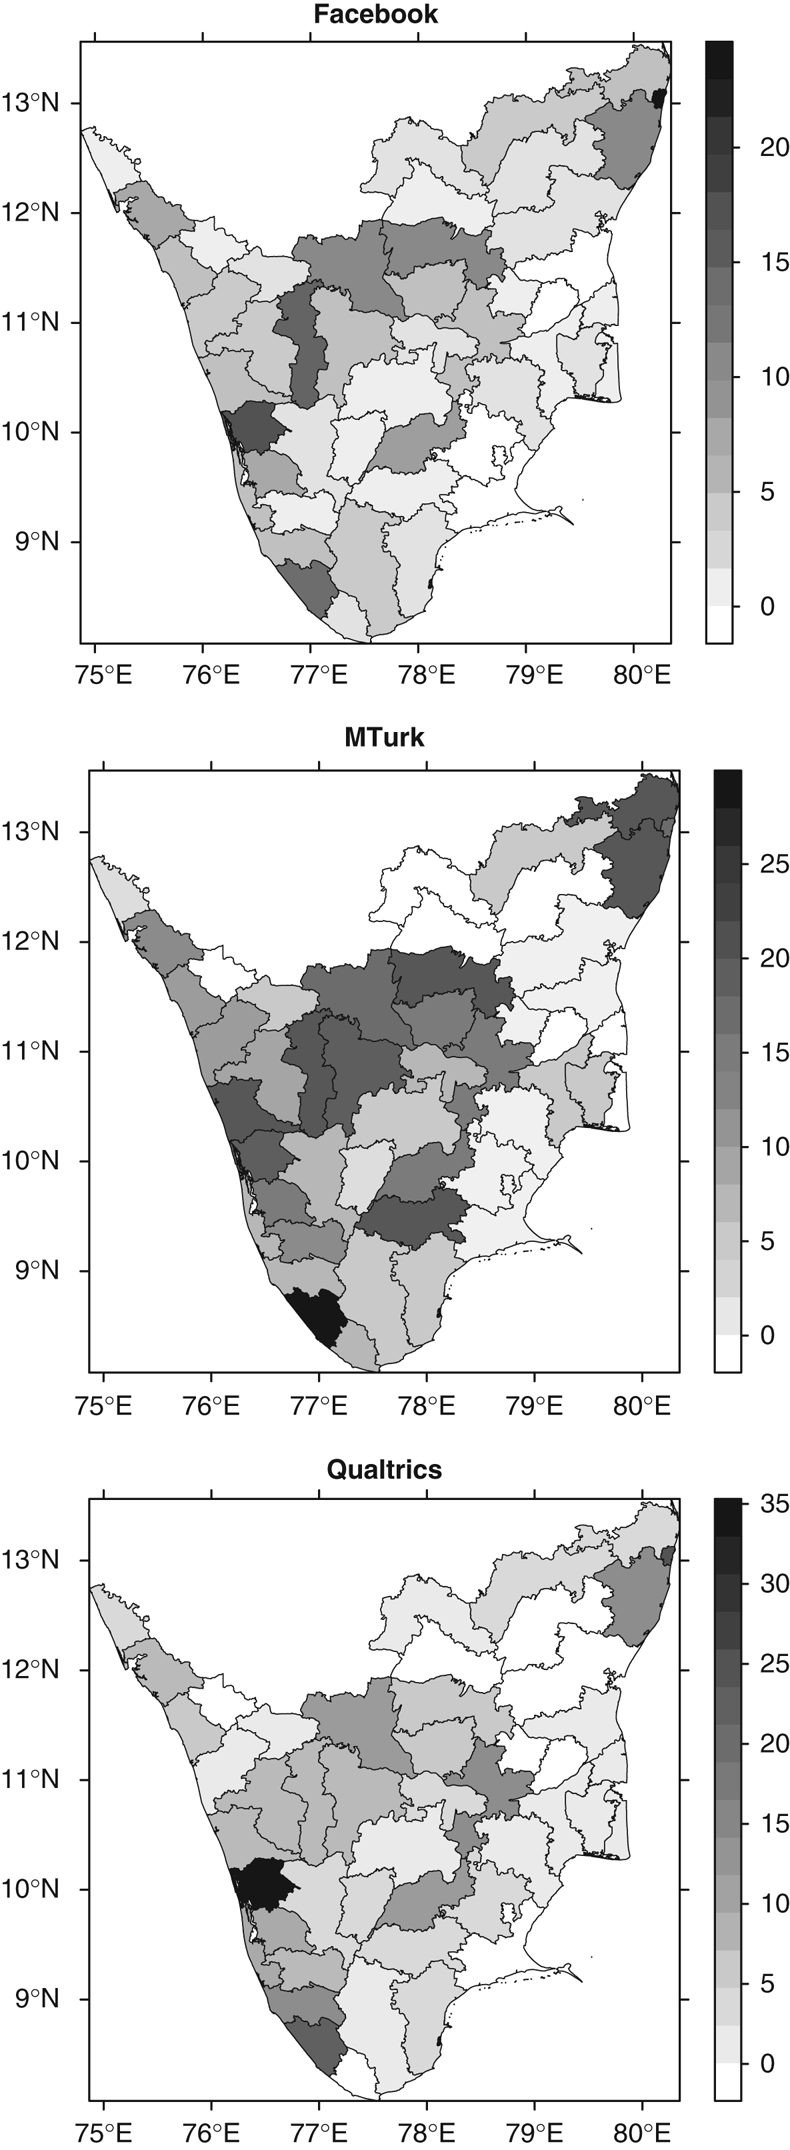
Figure 3 Sample densities by district in Kerala and Tamil Nadu
One likely explanation for differences in geographical representativeness within India concerns modes of internet access. Our online survey could be taken on mobile phones as well as desktops, but only 4–7 percent of the MTurk and Qualtrics samples accessed the survey via mobile devices, versus 43 percent of the Facebook sample. Internet access via desktop computers is limited in India, and rates vary widely across states, ranging from 1 to 19 percent of households in 2011. Mobile telephone access is more common, ranging from 27 to 76 percent.Footnote 8 A sample that draws substantially from mobile phone users has greater potential to be geographically representative of the Indian population than one that draws almost exclusively from desktop computer users.
To summarize our findings on demographics, the convenience samples are mostly biased in a similar fashion; differences from national probability samples are primarily differences of degree rather than direction. The overrepresentation of older age groups in our US Facebook sample is a surprising exception. In the US, Qualtrics came closest to a national probability sample on a majority of variables. In India, our convenience samples look less like the national population and a lot more like an elite class of tech-savvy workers. While the three Indian sources deviate from population parameters in similar ways, MTurk was often the closest. However, Qualtrics and especially Facebook achieve better geographical coverage in India. We find no such geographic skew in the United States.
Political attitudes and knowledge
Of particular interest to political scientists is how convenience samples deviate from national probability samples with respect to substantive political variables. In this vein, our surveys measure interest in politics, ideology, voter registration, turnout, vote in previous elections, party identification, news consumption, civics knowledge, identification of political leaders, and, in the United States, a policy familiarity question on Medicare.
In the United States, our Qualtrics sample is politically most similar to a national probability sample, Facebook is the most unusual, and MTurk lies in between. On partisanship, voter registration, and vote in the 2012 election (Figure 4), Qualtrics is indistinguishable from the 2014 GSS or the 2012 American National Election Studies (ANES). On ideology, it differs only slightly. Meanwhile, Facebook and MTurk respondents are substantially more liberal than a representative sample, and they have higher proportions of Democrats and 2012 Obama voters. All three convenience samples report more interest in politics and higher turnout in the 2012 election. The MTurk and Facebook samples also report higher rates of voter registration. Facebook is an outlier on each of these variables, perhaps because the algorithm successfully targeted advertisements to those who were more likely to complete a survey about politics. These patterns largely persist, though in a less extreme fashion, when we weight each sample based on age, sex, and region.
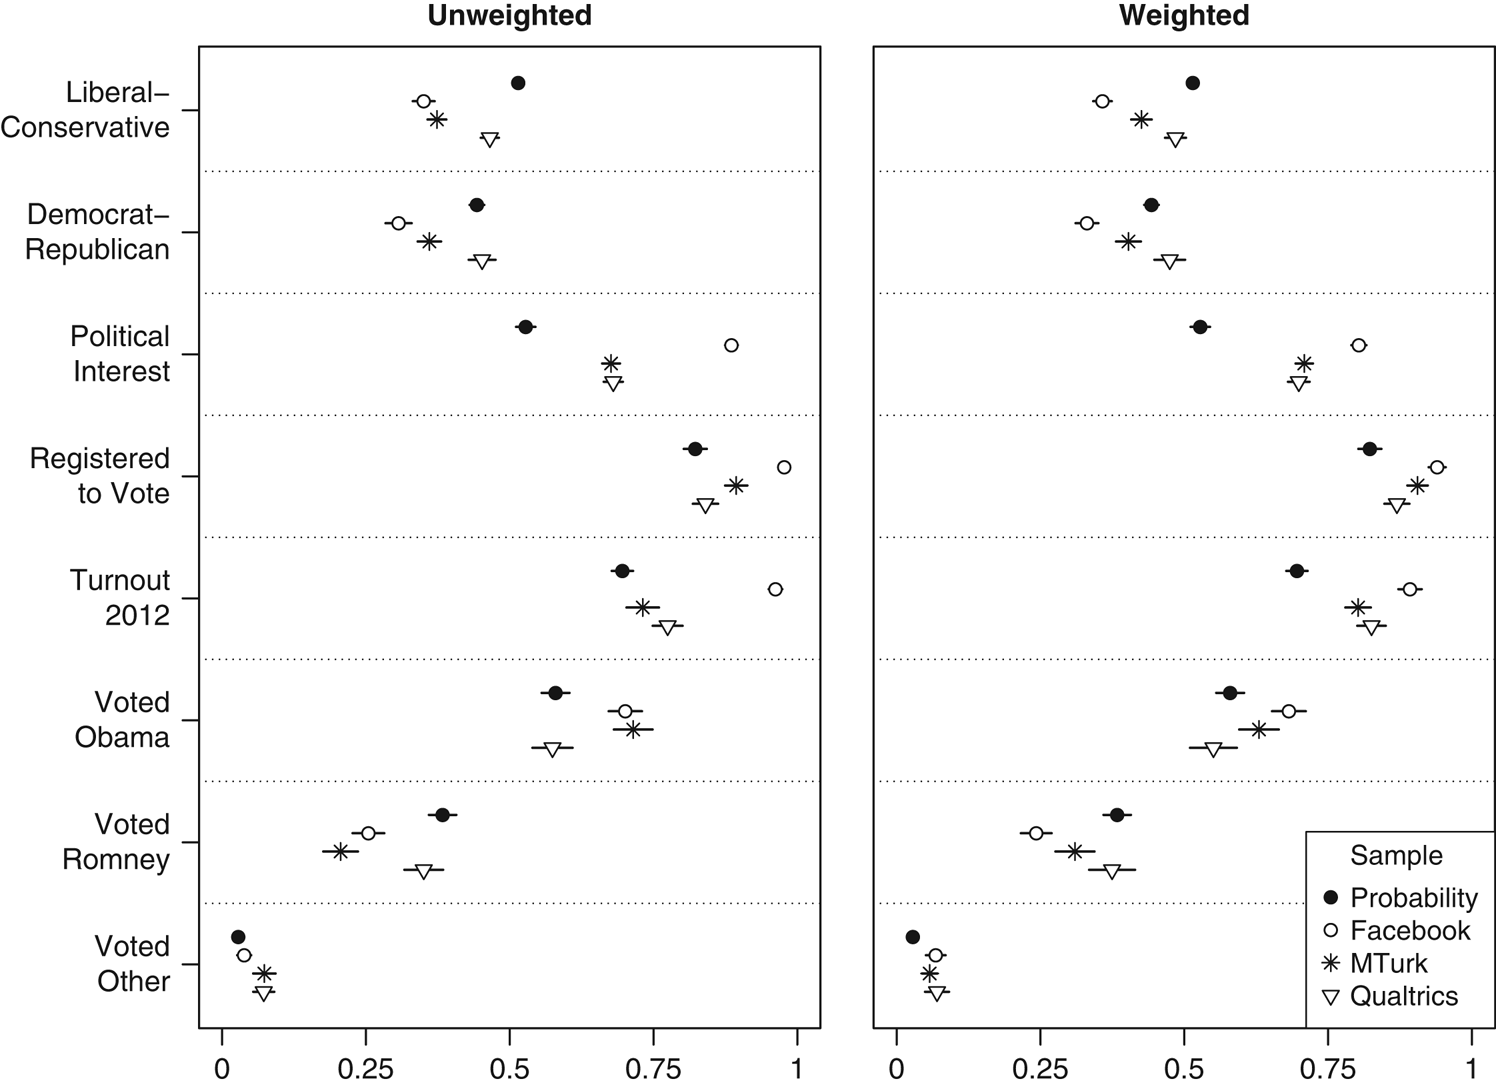
Figure 4 United Sates: ideology, party ID, interest, and Voting Note: Dots give sample means and lines indicate 95% confidence intervals. All variables scaled 0–1. Probability sample is the 2012 American National Election Study (voter registration; non-oversampled face-to-face interviews only) or the 2014 General Social Survey cross-section (all other variables).
Qualtrics is also closest to a representative sample in terms of political knowledge and several types of media consumption (Figure 5). As a whole, online convenience sample respondents are better at answering political knowledge questions than the general public.Footnote 9 Qualtrics-recruited respondents, however, generally come closer to these benchmarks than those from the other convenience samples. They are more knowledgeable than a representative sample, but not drastically so. Facebook-recruited respondents are generally the best informed, with MTurk lying in between. Qualtrics is also most similar to the 2012 ANES on most forms of news consumption. Some of these media consumption differences seem to be age-driven and disappear in the weighted analysis, where Facebook is most often closest to population figures. However, the political knowledge patterns persist.
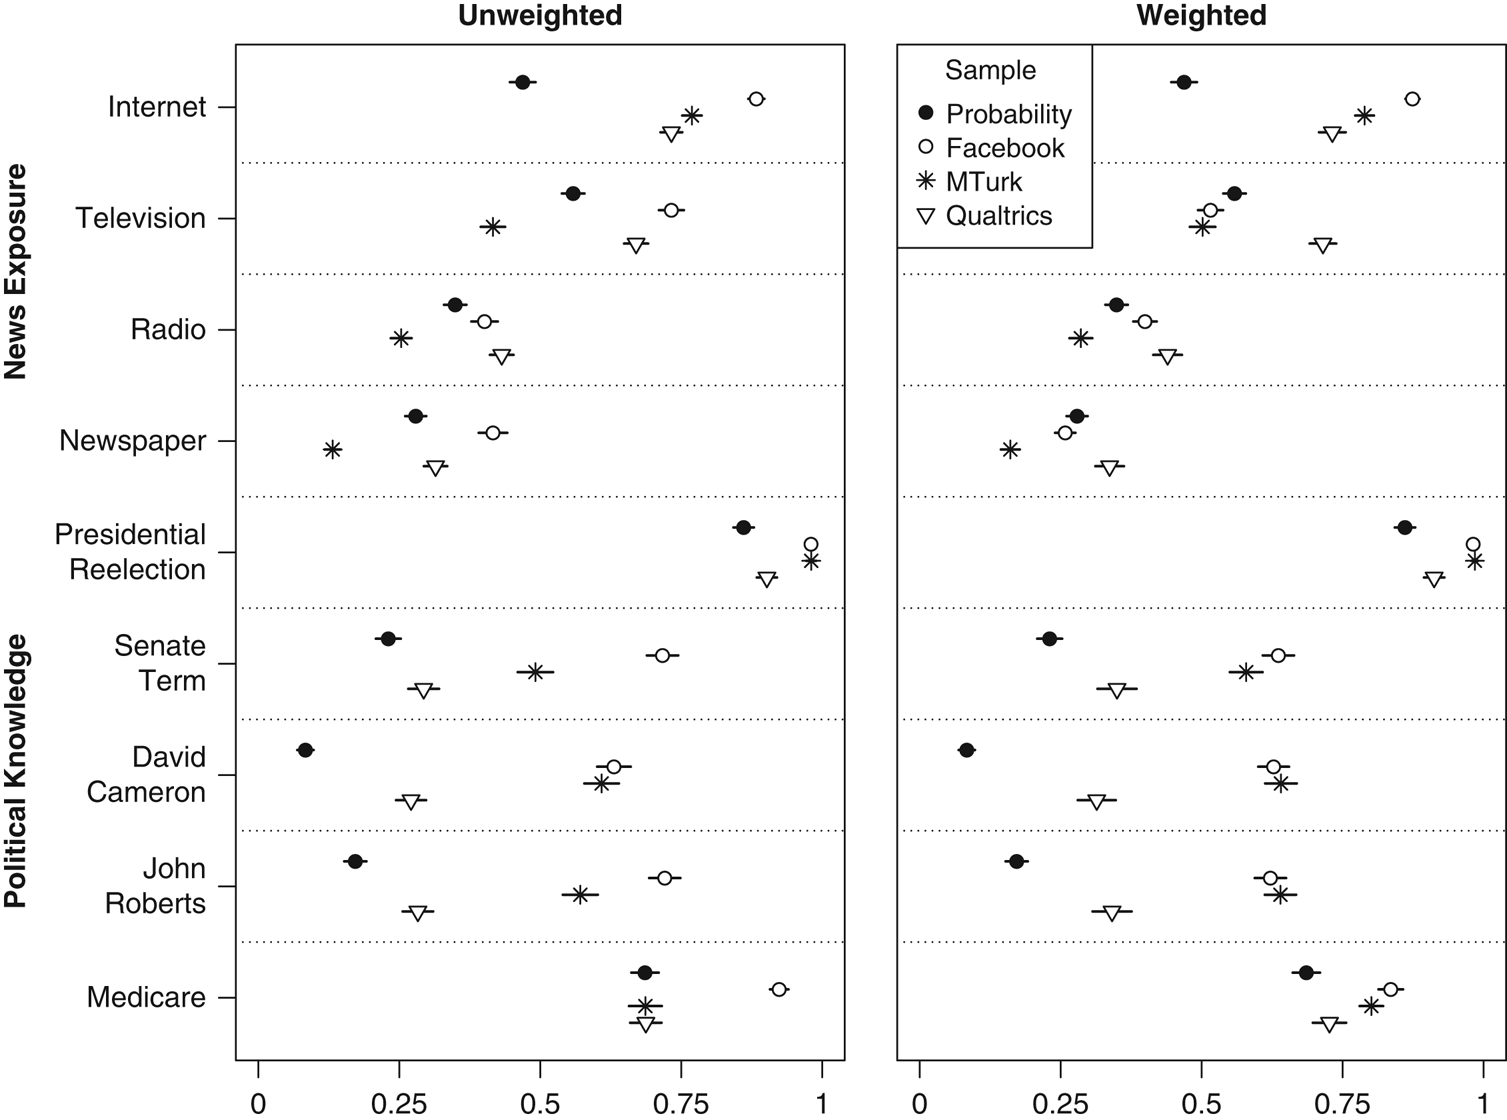
Figure 5 United States: news consumption and political knowledge Note: Dots give sample means and lines indicate 95% confidence intervals. All variables scaled 0–1. Probability sample is the 2012 American National Election Study (political knowledge; non-oversampled face-to-face interviews only) or the 2014 General Social Survey cross-section (news consumption).
In India (Figures 6 and 7), the relative performance of convenience samples is reversed: Facebook is politically closest to a national probability sample, while Qualtrics is often most distant and MTurk lies in between. All three convenience samples skew to the right of a representative sample, likely due to their higher incomes. Respondents are more likely to be partisans, to be interested in politics, and to have voted for the more right-wing of India’s two major parties (the Bharatiya Janata Party, or BJP) in the 2014 election. Facebook is closest to the benchmark figures on all but vote choice, while Qualtrics is most distant on each of them. All convenience samples show low levels of voting for smaller or regional parties, though Facebook is least extreme in this regard. Convenience sample respondents consume more news than those from probability samples, with Qualtrics again being the most extreme and Facebook coming closest to the benchmark figures for most media types. In terms of political knowledge, nearly all convenience sample respondents can name the chief minister of their state and identify the holidays celebrated on January 26 (Republic Day) and October 2 (Gandhi’s birthday). Facebook stands out as least representative with respect to being registered to vote and voting in the 2014 election. These particular disparities seem at least partially age-driven; they are reduced, but not eliminated, when weighting the sample.
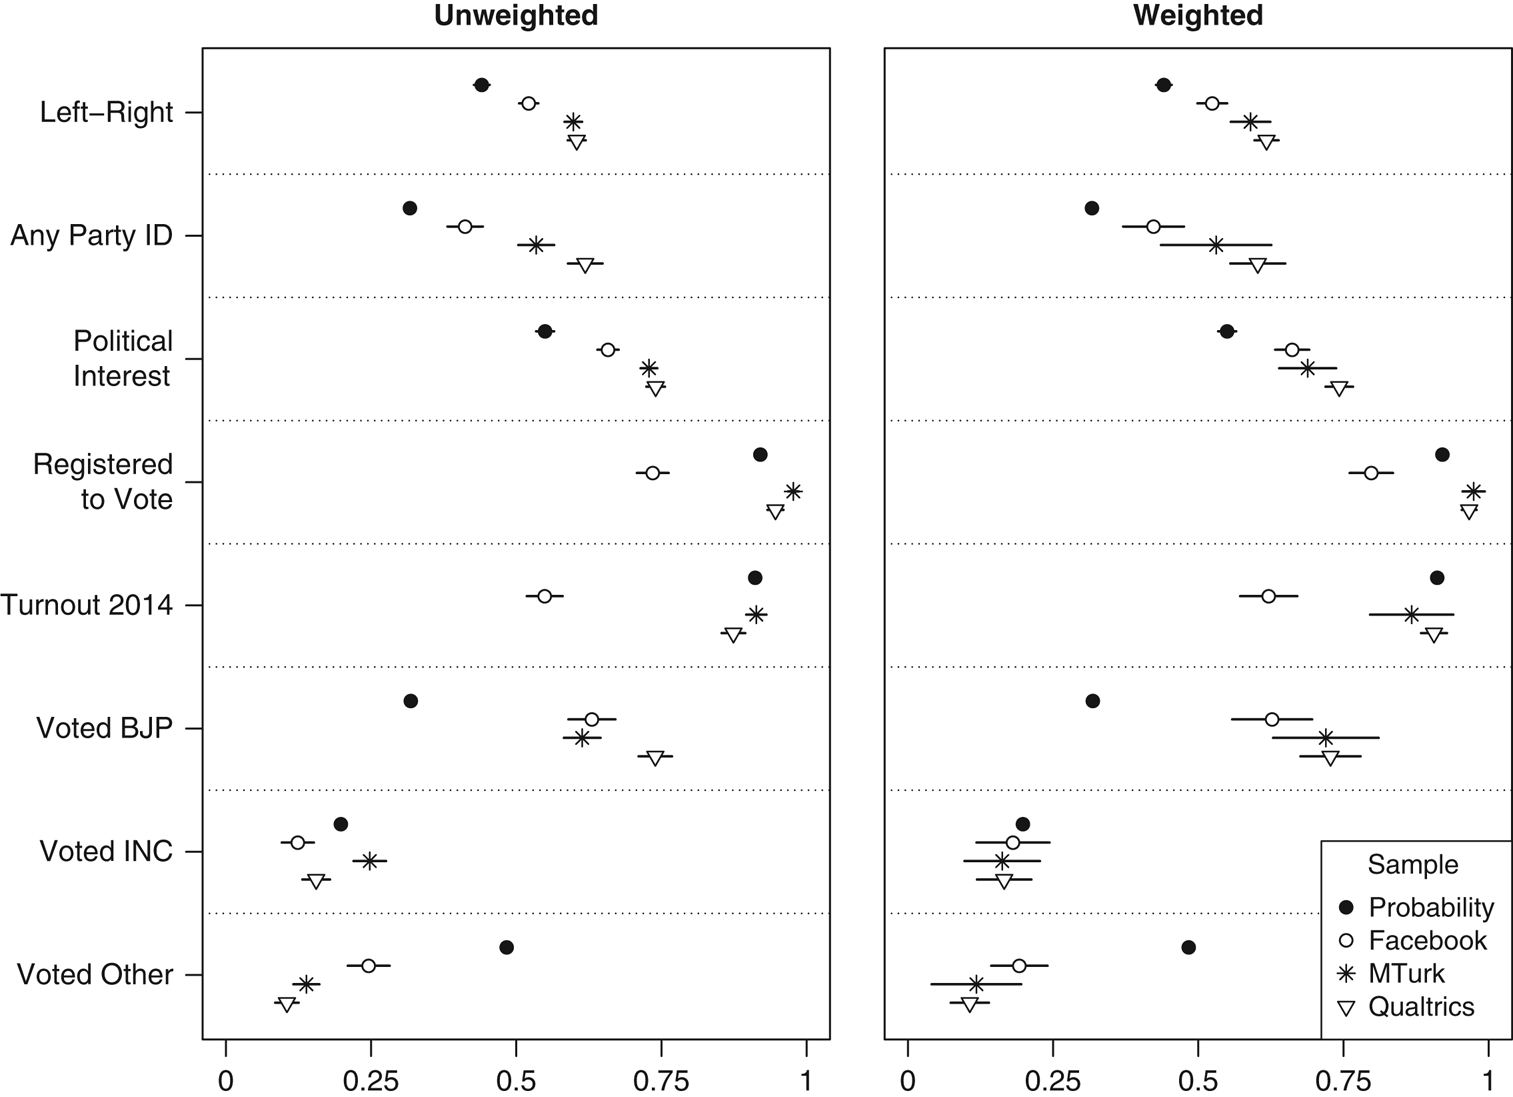
Figure 6 India: ideology, party ID, interest, and voting Note: Dots give sample means and lines indicate 95% confidence intervals, though these are mostly not visible for the probability sample given extremely large sample size. All variables scaled 0–1. Probability sample is the 2009 Indian National Election Study (voter registration), the 2014 World Values Survey (ideology and interest), or the 2014 Indian National Election Study, post-poll (party ID and voting).
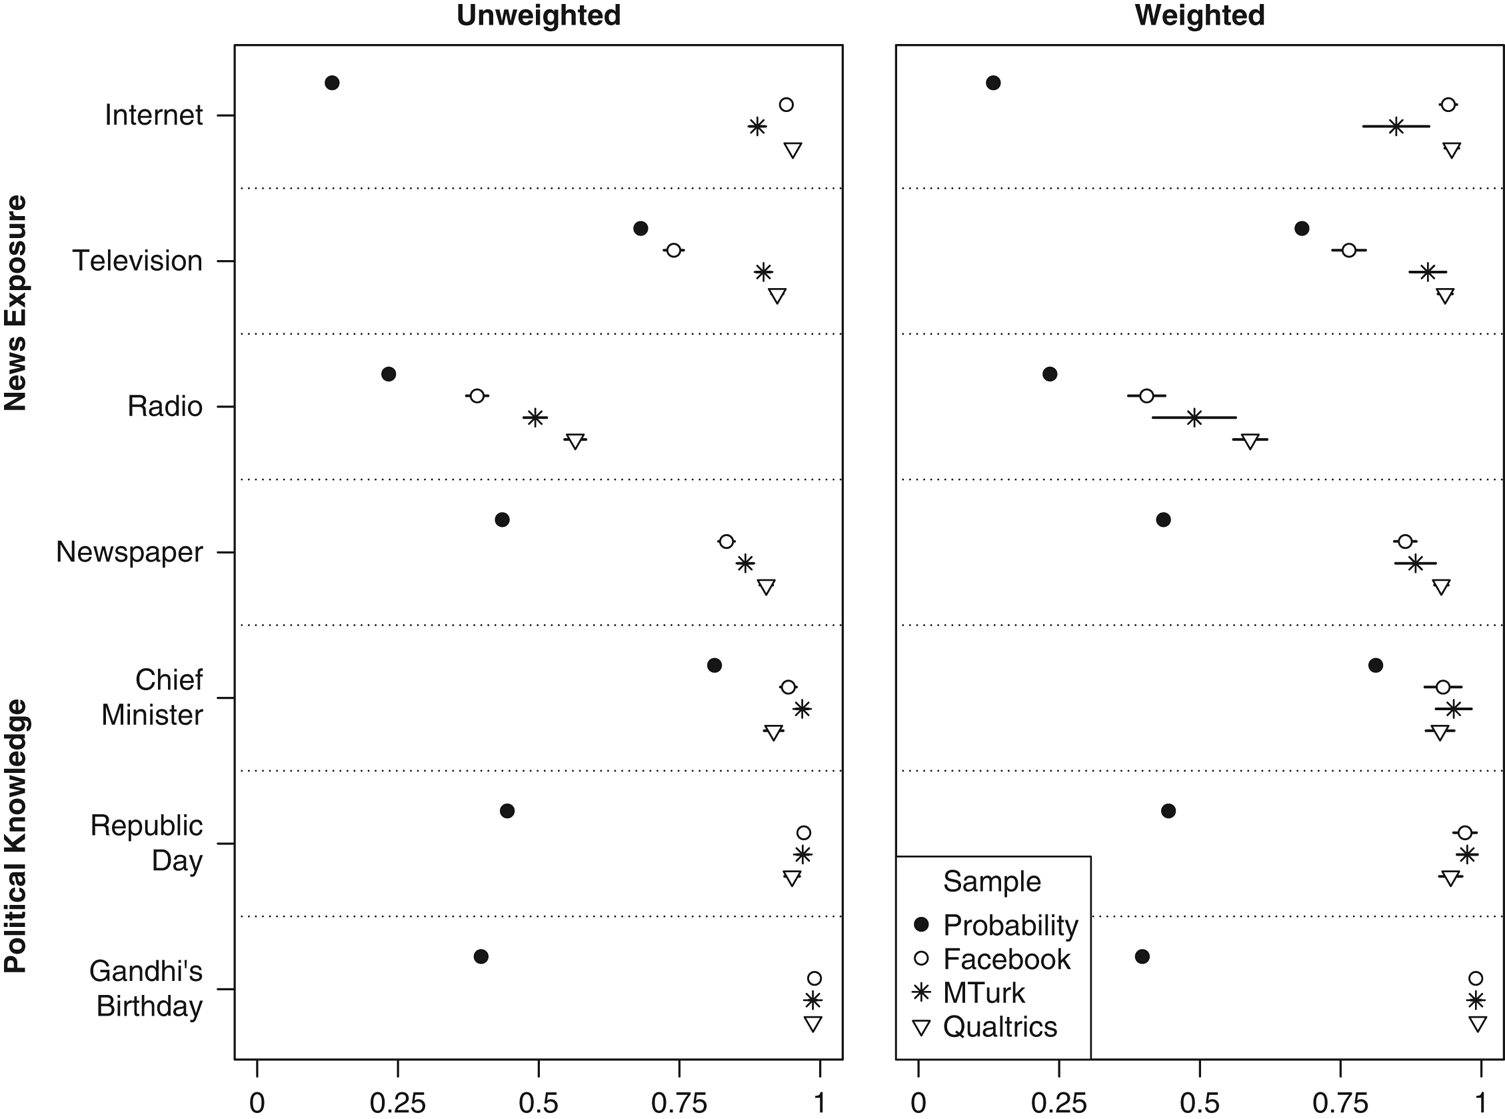
Figure 7 India: news consumption and political knowledge Note: Dots give sample means and lines indicate 95% confidence intervals, though these are not visible for the probability sample given extremely large sample size. All variables scaled 0–1. Probability sample is the January 2006 State of the Nation Survey (knowledge of Republic Day and Gandhi’s Birthday) or the 2014 Indian National Election Study, post-poll (all other variables).
For the most part, our findings accord with prior research on the political leanings of MTurk respondents in the United States (Berinsky, Huber and Lenz Reference Berinsky, Huber and Lenz2012; Christenson and Glick Reference Christenson and Glick2015a; Huff and Tingley Reference Huff and Tingley2015; Leeper and Mullinix Reference Leeper and Mullinix2015) and India (Dietrich and Winters Reference Dietrich and Winters2015). However, the comparative analysis shows that samples from Qualtrics in the United States and Facebook in India are politically more representative than their MTurk-recruited counterparts.
Subject cooperativeness
Because online surveys are self-administered and generally offer an incentive for completion, researchers are limited in their ability to force subjects to cooperate with instructions and prevent problematic behaviors such as answering quickly or randomly (Necka et al. Reference Necka, Cacioppo, Norman and Cacioppo2016). Without prompting from an in-person interviewer, respondents may also be more likely to choose a “don’t know” option, especially when asked to provide personal information. Inducing subjects to cooperate with survey procedures is thus important in any online survey. Instrumental manipulation checks, or screener questions, are routinely used to evaluate these issues (Berinsky, Huber and Lenz 2014; Peer, Vosgerau and Acquisti Reference Peer, Vosgerau and Acquisti2014).
Prior research on the United States has shown that MTurk respondents are more attentive and compliant than those from other convenience samples. In several studies, average screener passage rates for MTurk workers ranged from 85 to 97 percent (Litman, Robinson and Rosenzweig Reference Litman, Robinson and Rosenzweig2014; Peer, Vosgerau and Acquisti Reference Peer, Vosgerau and Acquisti2014), higher than the 65 percent obtained by Berinsky, Margolis and Sances (Reference Berinsky, Margolis and Sances2014) for a nationally representative internet panel from Survey Sampling International (SSI). Antoun et al. (Reference Antoun, Zhang, Conrad and Schober2016) also found that MTurk workers provided fewer “don’t know” answers and were less likely to skip personal information questions than those recruited via Google AdWords.
Differences in the attentiveness and cooperativeness of convenience sample respondents is often attributed to professional incentives. On MTurk, payment depends upon approval of work, and future work opportunities rely on having a high approval rating. Likewise, participants in commercial internet panels may be screened out of the sample, and their payment reduced or withheld completely, if they do not pass screener questions. In our studies, compensation did not depend upon screener passage, but frequent, professional survey takers are likely to develop habits based on common practice. Alternatively, the superior attentiveness of MTurk workers might be due to a different feature of this subject pool: regular exposure to online surveys (Marder and Fritz Reference Marder and Fritz2015) and contact among respondents (Necka et al. Reference Necka, Cacioppo, Norman and Cacioppo2016), which could increase screener passage rates.Footnote 10
To measure subject attentiveness, we used a single screener, a variation on the “interest” question used by Berinsky, Margolis and Sances (Reference Berinsky, Margolis and Sances2014). Our question asked respondents to choose (from a drop-down menu) the most serious problem facing the country. Buried in the instructions was a sentence telling them to ignore the question and select a blank answer choice at the bottom of the list, which respondents would be unlikely to choose if they were answering randomly or naively.
Screener passage rates, as well as other measures of subject cooperativeness, are summarized in Figure 8. As expected, the MTurk screener passage rate in the United States is very high (93 percent), whereas the rate for Facebook (66 percent) is closer to the 57 percent passage rate that Berinsky, Margolis and Sances (Reference Berinsky, Margolis and Sances2014) obtained for a similar screener with a nationally representative SSI panel. Somewhat surprisingly given their professional incentives, Qualtrics respondents passed at the lowest rate (40 percent). In India, screener passage rates were lower across the board, likely due to lower levels of English-language fluency and less experience with online surveys. However, we see a similar pattern: MTurk respondents passed at the highest rate (67 percent), followed by Facebook (32 percent) and Qualtrics (25 percent).
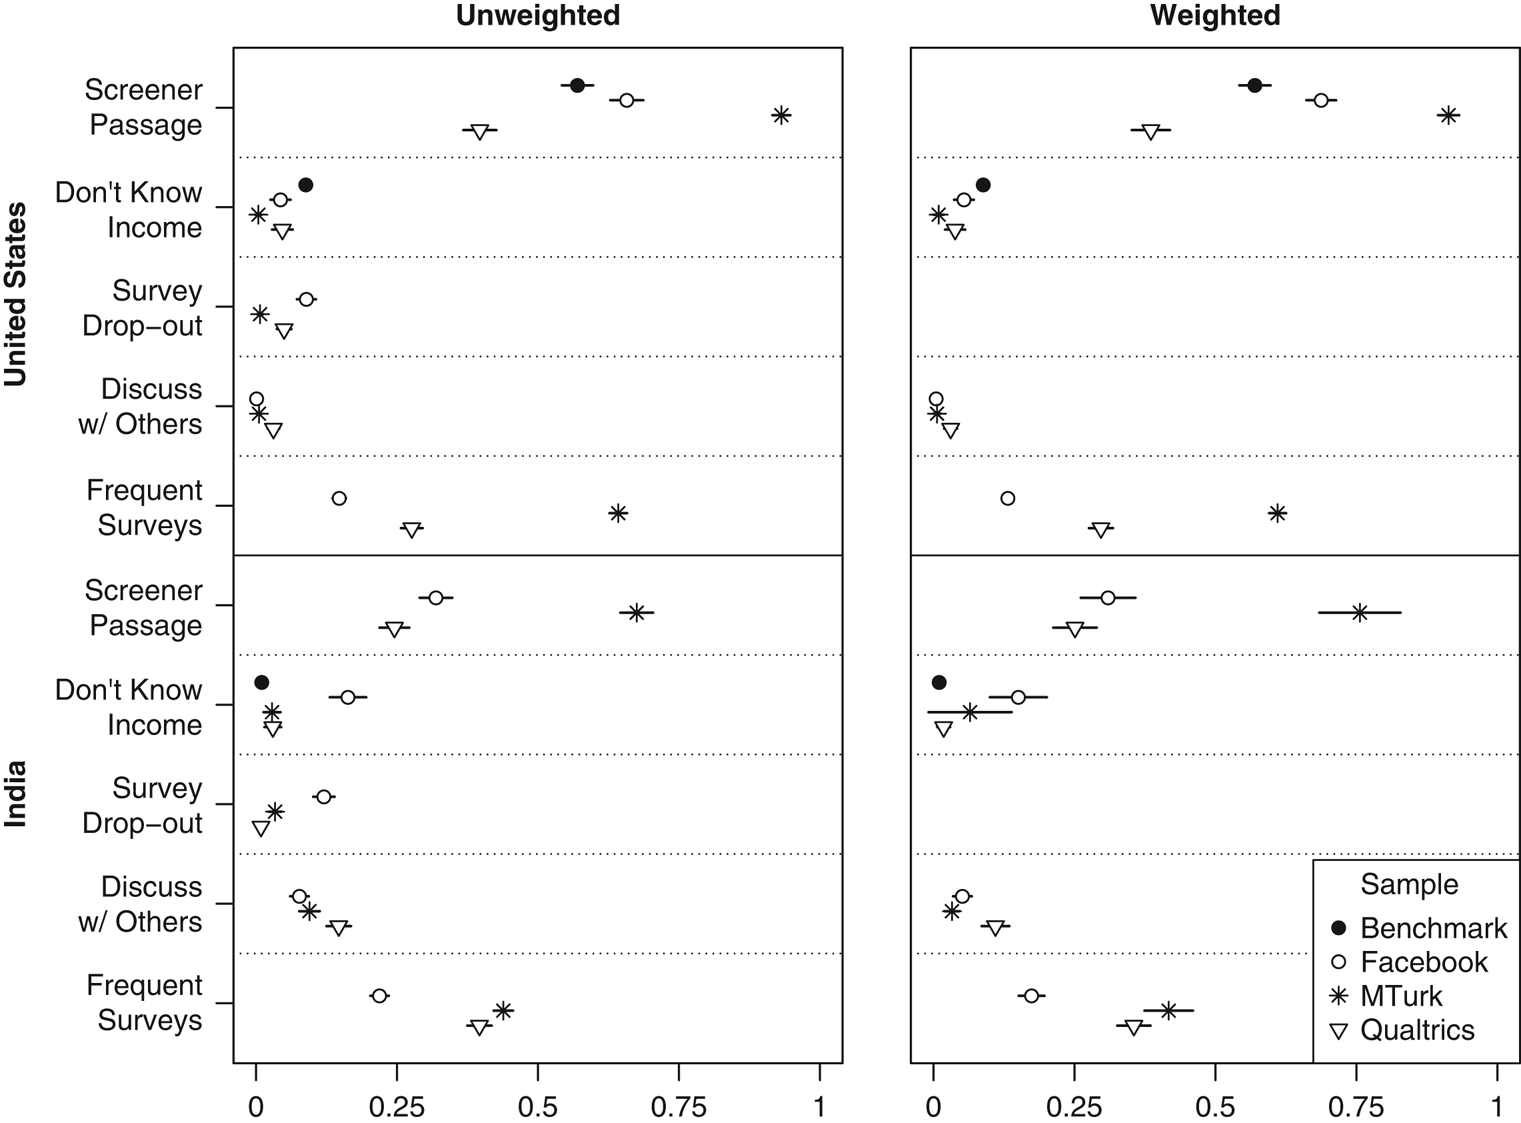
Figure 8 Subject cooperativeness in India and the United States Note: Dots give sample means and lines indicate 95% confidence intervals. All variables scaled 0–1. Benchmarks are Study 2 in Berinsky, Margolis and Sances (Reference Berinsky, Margolis and Sances2014) (US screener passage), the 2014 General Social Survey cross-section (“don’t know” on income in the United States), and the 2014 World Values Survey (“don’t know” on income in India).
We also found that MTurk respondents were more cooperative in other ways. On the question about family income, we included a “don’t know” option for half of each sample, chosen at random. Only 0.4 percent of US MTurk respondents who were offered this option chose it, versus 4 percent for Facebook and 5 percent for Qualtrics. Likewise, only 1 percent of the MTurk sample dropped out before completing the survey, versus 5 percent for Qualtrics and 9 percent for Facebook. In India, Qualtrics respondents performed similarly or slightly better than MTurk respondents on these measures. Meanwhile, Indian Facebook respondents were the most likely to provide “don’t know” responses on family income (perhaps partially driven by their younger age) and to quit the survey before finishing.
We included two questions that specifically attempt to gauge the behavior of frequent survey takers. A first asked whether respondents had discussed any aspect of the survey, either in person or online, with anyone who had already taken it. A second asked how often they took online surveys about politics. We found low rates of reported contact among respondents in the United States; Qualtrics was the highest, at 3 percent. As expected, MTurk respondents report taking political surveys more often; the modal response was “a few times a week,” versus “never or almost never” for Qualtrics and Facebook recruits. In India, reported contact among respondents was more common across the board but was most prevalent among Qualtrics respondents (15 percent). As in the United States, the Indian Facebook sample reported taking political surveys least often, whereas MTurk respondents did so the most.
In sum, MTurk workers in each country pay closest attention to question wording, passing screeners at the highest rates. This is an important consideration for survey experiments in which treatments involve manipulating the question text. Moreover, we found comparatively low levels of self-reported contact among MTurk respondents, which bodes well for the internal validity of experimental findings. Yet MTurk workers’ greater attentiveness may be partially attributable to higher levels of exposure to online surveys, which has implications for external validity.
Replicating survey experiments
One of the primary uses of online convenience samples in political science and other disciplines is recruiting subjects for survey experiments. The greater internal validity of experimental research is often invoked as a justification for using non-representative samples. However, when researchers have a strong expectation of heterogeneous treatment effects in groups over- or undersampled by their survey, the value of convenience samples is more limited. Sample average treatment effects, even if internally valid, may be unlikely to generalize to a broader population.
In each country, our surveys sought to replicate several experiments conducted on nationally representative samples. In the United States, we replicate experiments examining support for home mortgage interest subsidies via tax breaks versus cash payments (Haselswerdt and Bartels Reference Haselswerdt and Bartels2015); support for a hypothetical military intervention along the Korean border under the current all-volunteer force, versus a reinstatement of the draft (Kriner and Shen Reference Kriner and Shen2016); and belief that too much money is being spent on “welfare,” as opposed to “assistance for the poor” (Berinsky, Huber and Lenz Reference Berinsky, Huber and Lenz2012). The first two experiments were administered online to nationally representative samples by YouGov Polimetrix, while the third was part of the 2014 GSS cross-section, involving face-to-face interviews. In each case, we examine the effects of a binary treatment on a binary dependent variable, collapsing multiple categories (e.g., “support” and “strongly support”) as in the original analysis. In each original experiment, sample average treatment effects are positive, but they differ significantly by partisanship and/or ideology.Footnote 11
For India, there are few survey experiments that have been conducted on nationally representative samples. We replicate two list experiments from the 2014–2015 Lok Surveys, which achieved national coverage but oversampled urban areas (we use weighted figures which correct for this design). The first list experiment measures family preference for male rather than female children, and the second looks at opposition to political candidates with criminal convictions. Estimates from both experiments vary widely across states (Kapur, Sircar and Vaishnav Reference Kapur, Sircar and Vaishnav2014; Reed and Kapur Reference Reed and Kapur2015). Our Indian MTurk sample is particularly unrepresentative in terms of geography, and all three are unrepresentative in terms of sex, which might be expected to affect preference for sons.
Treatment effect estimates for each of our samples are summarized in Figure 9. For the US experiments, we present sample average treatment effects as well as those broken down by partisanship.Footnote 12 For the home mortgage and welfare experiments, we were able to replicate the pattern of effect sizes in partisan subgroups: effects are always larger among Republicans than Democrats. The differences are significant for all three samples in the first experiment, and for the Facebook sample in the second. On the other hand, average treatment effects in our convenience samples were often far from—and generally smaller than—the representative sample benchmarks. This is true not only of the full sample estimates, but also of those broken down by party. Weighting the samples improves things somewhat, especially for the mortgage experiment, but it is not a panacea. Moreover, in none of our convenience samples do we find the pattern of results demonstrated by Kriner and Shen (Reference Kriner and Shen2016) for the military draft experiment: a large effect among Democrats and near-zero effect among Republicans.
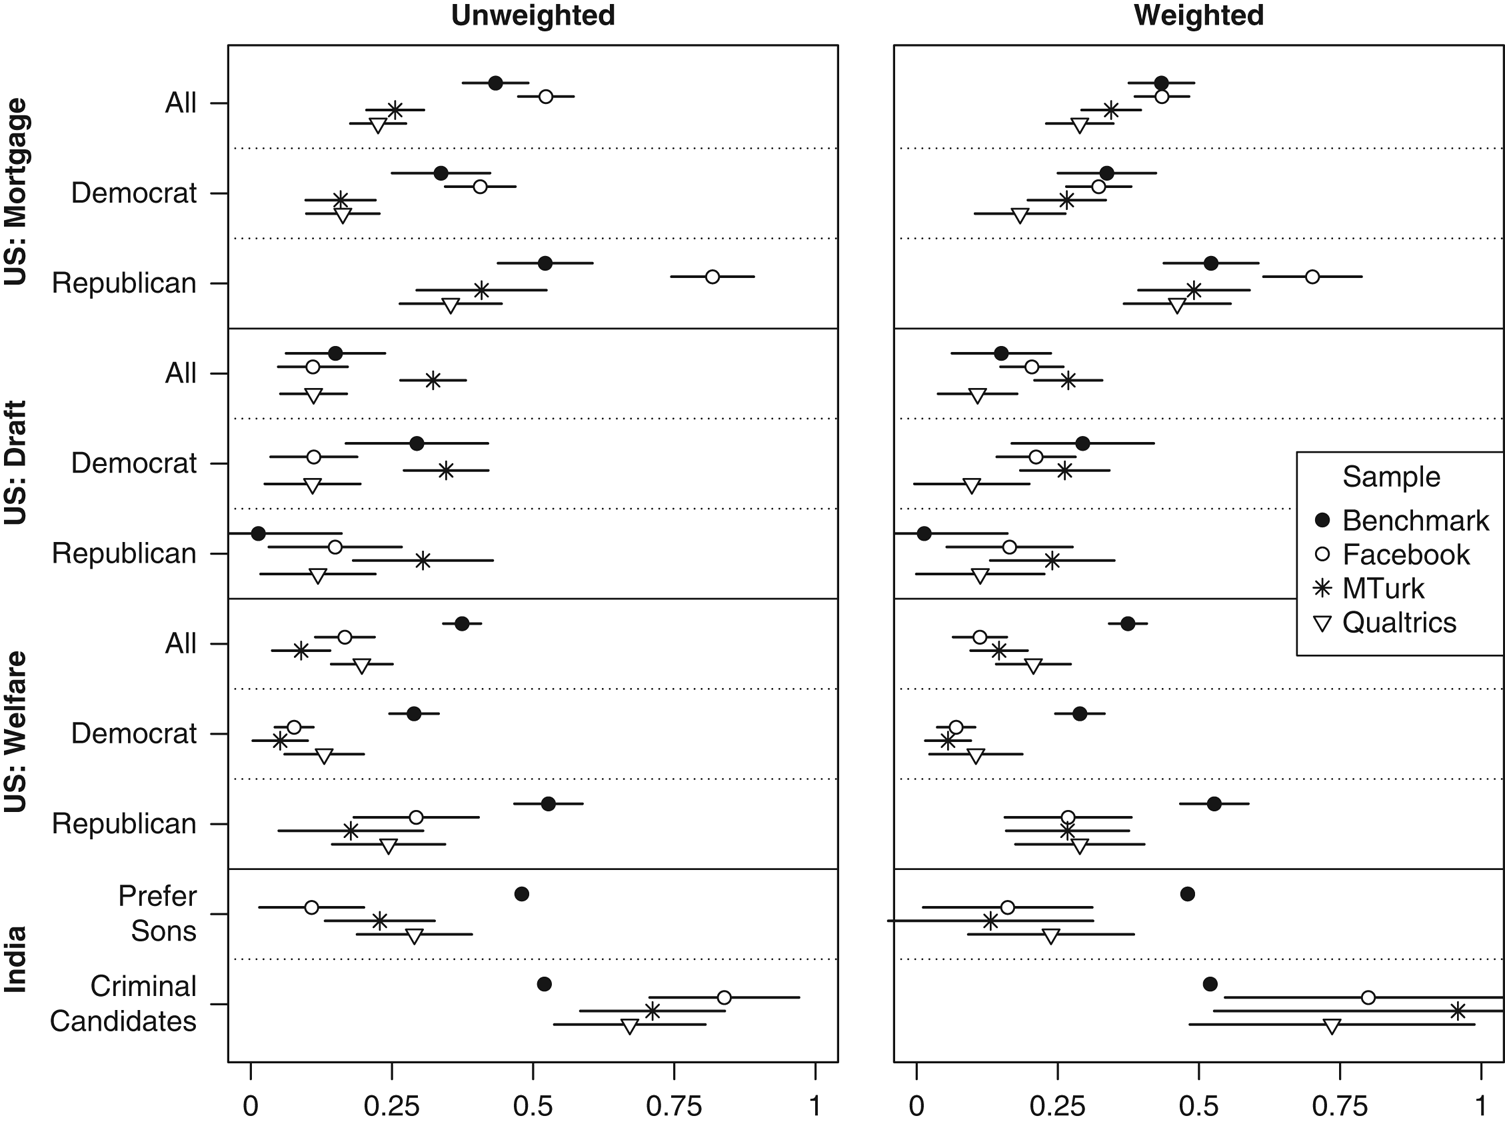
Figure 9 Replicating experiments in India and the United States Note: Dots give average treatment effect estimates and lines indicate 95% confidence intervals. Benchmarks are described in the text.
For the Indian list experiments, each of our convenience samples is biased in the socially acceptable direction (no preference for male children, and being bothered by criminal candidates), with Qualtrics coming closest to the benchmark. These patterns persist when we weight the samples, suggesting that unrepresentativeness in terms of geography, age, or sex is not driving the bias. Rather, we suspect that traditional attitudes of the sort measured by these list experiments are simply less prevalent among the highly educated and comparatively wealthy Indians who make up our convenience samples.
On the whole, our analysis of experimental replicability does not point to a clear winner among the convenience samples. Rather, several conclusions arise from the results obtained with all three. Our analysis suggests that online convenience samples may offer good alternatives to probability samples for testing hypotheses about partisan treatment interactions. In two out of three experiments in the United States, we were able to replicate a pattern of heterogeneous treatment effects by party ID using each of our samples (see also Mullinix et al. Reference Mullinix, Leeper, Druckman and Freese2015, for similar results using MTurk). This is good news, given that political scientists are often particularly interested in these sorts of interactions.
On the other hand, we would caution political scientists regarding the external validity of sample average treatment effects obtained from convenience samples. In our analysis, point estimates were often quite far from benchmarks obtained using nationally representative samples, regardless of the country or recruitment method. Several classic psychology experiments have been replicated on MTurk, with similar point estimates as in the original studies (Paolacci, Chandler and Ipeirotis Reference Paolacci, Chandler and Ipeirotis2010; Berinsky, Huber and Lenz Reference Berinsky, Huber and Lenz2012). But survey experiments in political science are probably more likely than those in psychology to generate heterogeneous treatment effects according to the same variables on which the survey is unrepresentative, as we find with party ID in the mortgage and welfare experiments. The combination of unrepresentativeness and heterogeneity might explain our failure to replicate sample average treatment effects with most of our samples and survey experiments, though other factors, such as publication bias or survey mode effects, could also be at play.
Conclusion
Our comparisons of the three recruitment methods underscore that a scholar’s best option for online convenience samples will depend on where the research is being conducted and what its objectives are. A summary table of comparative advantages is in Appendix section 5. In the United States, MTurk stands out in terms of the low cost and speed with which one can recruit a sample, making it the optimal choice for pretesting or exploratory research. MTurk’s attentive and compliant subject pool may also be an advantage in some contexts, including subtle experimental treatments, panel studies, and designs that depend on current events (see also Christenson and Glick Reference Christenson and Glick2013). For scholars aiming to estimate treatment effects on the treated or to discard respondents who do not pass screeners, an MTurk sample should maximize statistical power compared to other alternatives.
We also found that, where scholars are particularly concerned with representativeness or sample diversity on demographic and political variables, a Qualtrics panel offers clear advantages, even without employing the quotas that are included in the base price. At roughly three times the cost of MTurk, but far less than probability samples or the highest-quality online panels such as those from YouGov, Qualtrics may represent an attractive middle ground to researchers with somewhat larger budgets. While scholars should be aware of the low levels of attentiveness we found among Qualtrics respondents, they should also bear in mind that highly attentive survey respondents may themselves be unrepresentative (Berinsky, Margolis and Sances Reference Berinsky, Margolis and Sances2014). If a survey experimenter aims to estimate realistic intent-to-treat effects, including among respondents who only minimally process the treatment information, the added cost of Qualtrics may be justified.
Finally, Facebook recruitment in the United States offers a good alternative for targeted sampling. While less expensive overall, the two-stage approach that we used to recruit older respondents on MTurk was relatively slow. Such inefficiency might be exacerbated when targeting an even smaller share of the MTurk worker pool, such as residents of a particular city or state. Targeted recruitment on certain variables, including age, has recently been made available on MTurk through the “premiere qualifications” option, which eliminates the inefficiencies and maintains a relatively low cost (see Appendix section 1). At somewhat greater cost, Facebook offers an easy method for targeted recruitment on virtually any variable, without substantial increases in recruitment time or demands on the researcher.
In India, Facebook stands out as the best option for drawing a national convenience sample, given its broad geographical dispersion and greater representativeness on many political variables. Targeting Facebook ads by age and sex, which we did not attempt in India, could make this source of respondents even more attractive. MTurk in India offers some of the same advantages as in the United States—low-cost recruitment, and a comparatively attentive subject pool—yet its heavy concentration in the two southern states of Kerala and Tamil Nadu make it less geographically representative. Moreover, the slow pace of MTurk subject recruitment in India eliminates one of its major advantages in the United States. Finally, a Qualtrics panel seems to offer few advantages in India other than convenience and speed, given its high cost and distance from national benchmarks on many political variables. In other words, while different methods still carry relative advantages, scholars working on India face fewer tradeoffs than those studying the United States.
While we have emphasized differences and comparative advantages, one commonality across countries and recruitment methods concerns the implications of heterogeneous treatment effects and unrepresentativeness on political variables. Political scientists are often interested in whether treatment effects are moderated by variables such as ideology or partisanship, and our replication of survey experiments suggests that online convenience samples often provide valid inferences in this regard. However, the fact that our online convenience samples were consistently unrepresentative on these same moderators suggests that scholars should exercise caution when interpreting sample average treatment effects. Point estimates may deviate significantly from those obtained using representative samples. A disproportionately wealthy, educated, and cosmopolitan subject pool in India or a liberal-leaning, politically engaged one in the United States may sometimes behave just like the population, but this will not always be so.
For scholars considering recruitment options for their own online surveys, an important question is whether future studies using the same methods should deliver similar results to those reported here. As noted above, on most variables for which they can be compared, our findings for the MTurk samples in both India and the United States mirror those of numerous prior studies conducted over nearly a decade. These results suggest that our estimates lie somewhere in the central part of the distribution rather than the tails. For Facebook and Qualtrics, where there is no prior basis for comparison, it is more difficult to know whether we drew an outlier sample. However, the fact that we used standard, well-established procedures for recruiting from both respondent pools suggests that our findings should not be unusual by virtue of research design.
How might scholars evaluate online recruitment methods in other countries, beyond the United States and India? Given its broad global penetration and accessibility via mobile phone, Facebook seems a promising option for drawing samples that are diverse in terms of geography and, potentially, political variables. Crowdsourced labor markets—MTurk, or alternatives such as CrowdFlower with broader global coverage—have a much smaller user base. Moreover, country-specific patterns of adoption, such as the prevalence of South Indians on MTurk, may render this user base unrepresentative in unexpected ways. On the other hand, we expect that the common advantages of MTurk in both India and the United States—cost and subject attentiveness—will be replicated in other crowdsourced labor markets, since they derive from the nature of the recruitment method. While commercial internet panels are a comparatively hassle-free option, one should also price out social media or crowdsourced alternatives, especially in places with a low cost of labor where the savings may be large. Finally, whatever method one uses, it is important to validate online samples by comparing descriptive statistics to those from probability samples or the national census, rather than just citing prior research, especially on another country.
Supplementary Material
To view supplementary material for this article, please visit https://doi.org/10.1017/psrm.2018.28
Acknowledgments
This research has been generously supported by a grant from the Hariri Institute for Computational Science and Engineering at Boston University. For helpful comments and suggestions, the authors are grateful to Azer Bestavros, Jennifer Bussell, John Byers, Simon Chauchard, Doug Kriner, Michele Margolis, Ryan Moore, Irfan Nooruddin, and Cesar Zucco. Thanks to Neelanjan Sircar for sharing the Lok Surveys instruments. This study is pre-registered with EGAP (ID 20151027AA; http://egap.org/registration/1572). Approval was obtained from the Institutional Review Board of Boston University (protocol 3891X). Replication data are available via https://dataverse.harvard.edu/dataverse/PSRM.


