


In Australia, most children who are clinically identified with hearing loss (HL) at birth (as per the Universal Newborn Hearing Screening) are fitted with first devices (covered by national healthcare insurance) soon after identification. Of children screened, at five years, 56% of those with hearing aids (HAs) were fitted by the age of six months; 44% of those with cochlear implants (CIs) were fitted by the age of 12 months (Ching & Leigh, Reference Ching and Leigh2020). Between one and six years of age, the number of children fitted with their first device triples, likely also accounting for initially unidentified mild or unilateral HL, progressive HL, or newly emerged HL due to trauma or illness (Hearing Australia, 2022). Within subsequent early intervention programmes, the communication mode is predominantly oral (e.g., appr. 80% of those with HAs and 70% of those with CIs, Cupples et al., Reference Cupples, Ching, Button, Seeto, Zhang, Whitfield, Gunnourie, Martin and Marnane2018), with the majority of children going on to mainstream education alongside their peers with hearing in the normal range (NH) (i.e., 85%, Van Der Straaten et al., Reference Van Der Straaten, Briaire, Dirks, Soede, Rieffe and Frijns2021).
In spoken language contexts, such as within mainstream schools or at home with hearing parents, reduced acoustic access may affect children’s spoken language processing. First, the limited access to speech prior to device fitting may delay the development of sensitivity to relevant acoustic cues and the efficient use of such cues for speech perception (e.g., Giezen et al., Reference Giezen, Escudero and Baker2010; Nittrouer et al., Reference Nittrouer, Caldwell-Tarr, Moberly and Lowenstein2014). Second, once fitted, hearing devices such as HAs and CIs are limited in how well they transmit the cues that allow differentiation of phonemic contrasts (Peng et al., Reference Peng, Hess, Saffran, Edwards and Litovsky2019; van Tasell, Reference van Tasell1993; Xu et al., Reference Xu, Thompson and Pfingst2005). Even for children with unilateral losses, who have the limited HA or CI signal in only one ear, overall acoustic access may nevertheless differ from NH peers (e.g., Snapp & Ausili, Reference Snapp and Ausili2020), with observable knock-on effects for spoken language outcomes (Fitzpatrick et al., Reference Fitzpatrick, Gaboury, Durieux-Smith, Coyle, Whittingham and Nassrallah2019). In the current study, we investigate the effects of any reduced acoustic access by assessing spoken word recognition in children who are clinically identified with a hearing loss, referred to here as deaf and hard of hearing (DHH), whose main mode of communication is oral. In the remainder of this article, when referring to the terms “language processing” or “language development”, we mean spoken language processing/development.
Children acquiring spoken language(s) need to make use of small acoustic differences between sounds to perceive phonemic contrasts. For example, stop phonemes may be differentiated based on their voice onset time (a temporal cue) and the formant transitions present in adjacent vowels (a spectral cue). Perceiving these acoustic cues allows children to differentiate similar word forms (e.g., /bin-pin/, /map-mat/) and acquire distinct representations of these words in the lexicon. However, perceiving the phonemic distinctions necessary for word recognition can be challenging for DHH preschoolers. For users of HAs, signal processing algorithms such as frequency lowering and amplitude compression may distort acoustic cues, particularly spectral and amplitude cues (e.g., Souza, Reference Souza, Popelka, Moore, Fay and Popper2016). For CI users, signal degradation is much more severe as the continuous frequency spectrum of incoming speech must be segregated into discrete frequency bands used to stimulate discrete regions of the cochlea. For NH listeners, this can be approximated via four-channel vocoding of speech (e.g., McMurray et al., Reference McMurray, Farris-Trimble and Rigler2017). Due to this reduced frequency resolution, as well as potential overlap in stimulation between adjacent cochlear electrodes, CI processing typically provides poor spectral cues to speech (e.g., Cychosz et al., Reference Cychosz, Mahr, Munson, Newman and Edwards2023). The distortion or unavailability of these acoustic cues can lead to ambiguity between phonemes and words, altering children’s real-time spoken word recognition (e.g., Grieco-Calub et al., Reference Grieco-Calub, Saffran and Litovsky2009; McMurray et al., Reference McMurray, Farris-Trimble and Rigler2017; Simeon & Grieco-Calub, Reference Simeon and Grieco-Calub2021).
A recent study found no evidence that DHH preschoolers recognise words differently from their peers with NH when identifying a target alongside a novel referent (e.g., the familiar target word soup presented with images of soup and an unfamiliar object [bamboo steamer], Cychosz et al., Reference Cychosz, Mahr, Munson, Newman and Edwards2023). However, it is not yet known how HL affects the dynamics of word recognition when the target is in competition with other known, phonologically similar referents, and is thus potentially ambiguous if insufficient acoustic cues are available to the listener (e.g., target word bin presented with images of a bin and a pin, which differ only in the voicing of the initial phoneme). The present study therefore investigates how real-time word recognition compares between DHH preschoolers and their peers with NH in contexts of high and low phonological competition. This is important since altered lexical processing during preschool, well after children have commenced lexical acquisition, may present risks for spoken language and communication throughout development (e.g., Marchman & Fernald, Reference Marchman and Fernald2008; Tsao et al., Reference Tsao, Liu and Kuhl2004).
Word recognition in DHH populations
In typically developing populations, word recognition is best understood as an incremental process, where suitable lexical candidates (stored word representations in the mental lexicon that are potential matches for the input) are activated in parallel. When one candidate best matches the signal and its activation exceeds a threshold, recognition is achieved (e.g., the TRACE model (McClelland & Elman, Reference McClelland and Elman1986) (also see Mattys et al., Reference Mattys, Davis, Bradlow and Scott2012; Weber & Scharenborg, Reference Weber and Scharenborg2012). Evidence for fast and incremental processing is found in children with NH as young as 18 months (e.g., Fernald et al., Reference Fernald, Pinto, Swingley, Weinberg and McRoberts1998, Reference Fernald, Swingley and Pinto2001). However, any degradation of the speech signal, such as that experienced by DHH children with various types of HL, may negatively affect word recognition in two ways. First, Mattys et al. (Reference Mattys, Davis, Bradlow and Scott2012) hypothesized that an in-the-moment lack of acoustic-phonetic detail in the signal (for example, the distorted or absent spectral cues to stop place of articulation (PoA) available to DHH children through their hearing devices) can result in slower word recognition due to weaker activation of the target in combination with prolonged activation from competitors (words in the listener’s mental lexicon that share characteristics with the target, and thus receive some activation during word recognition). In the worst-case-scenario, a wrong lexical candidate may receive the most activation, leading to miscomprehension (Mattys et al., Reference Mattys, Davis, Bradlow and Scott2012). Second, McMurray et al. (Reference McMurray, Farris-Trimble and Rigler2017) proposed that DHH listeners with prelingual HL face the additional challenge of acquiring lexical representations based on a degraded signal. They suggest that this may result in overlap between the representations of phonemes, resulting in long-term overlapping lexical representations. Both accounts predict that DHH preschoolers may show altered dynamics of word recognition relative to NH peers. Some of these dynamics may be less efficient for comprehension and/or word learning, leaving DHH children at a disadvantage in their spoken language processing.
Several studies have investigated spoken word recognition in DHH children using open-set speech recognition tasks (i.e., repeating a word back to the experimenter) (e.g., Eisenberg et al., Reference Eisenberg, Martinez, Holowecky and Pgorelsky2002; Kirk et al., Reference Kirk, Pisoni and Osberger1995). However, such tasks are less appropriate for targeting real-time aspects of word recognition, such as the timing of lexical activation and processes of lexical competition. Real-time measures such as eye-tracking allow tracking of children’s response to a word over a millisecond time course. To date, only a handful of studies have investigated real-time spoken word recognition in DHH populations.
Evidence from postlingually deaf adults with CIs confirms that a degraded speech signal can lead to slower word recognition (Farris-Trimble et al., Reference Farris-Trimble, McMurray, Cigrand and Tomblin2014). In a visual world paradigm, lexical access was measured by tracking listeners’ eye-movements to four pictures in response to a spoken target word. The pictures presented the target (e.g., wizard), an onset competitor (e.g., whistle), a rhyme competitor (e.g., lizard), and a distractor (e.g., baggage). Compared to adults with NH, adults with CIs were slower to fixate the target and showed increased competition from onset and rhyme competitors.
When tested with an identical design, prelingually deaf 12–25-year-olds with CIs showed larger delays in target fixations (~200 ms delays; McMurray et al., Reference McMurray, Farris-Trimble and Rigler2017) than the postlingually deaf CI users in Farris-Trimble et al. (Reference Farris-Trimble, McMurray, Cigrand and Tomblin2014) (~75 ms delays). These prelingually deaf adolescents furthermore showed increased competition from rhyme, but decreased competition from onset competitors. The authors concluded that lexical access may not be incremental for prelingually deaf CI users, but only achieved once enough information has been accumulated.
Few studies to date have investigated real-time spoken word recognition in younger DHH children, showing mixed results across ages and experimental paradigms. Similar to adolescents, two-year-olds with CIs showed ~200 ms delays compared to peers with NH when their eye movements to a target and an unrelated distractor (e.g., shoe vs. ball) were tracked in response to an auditory prompt (e.g., the target shoe) (Grieco-Calub et al., Reference Grieco-Calub, Saffran and Litovsky2009). Furthermore, five-to-ten-year-old children with CIs showed fewer looks to targets compared to their peers with NH when attempting to recognise targets in the presence of an unrelated distractor (penny vs. carrot) and, to a lesser extent, an onset competitor (penny vs. pencil) (Simeon & Grieco-Calub, Reference Simeon and Grieco-Calub2021). The same population furthermore appears able to use the broader semantic context to facilitate their lexical access (i.e., faster looks to the target and greater suppression of phonological competitors when informative semantic context is present), but less so than their NH peers (Blomquist et al., Reference Blomquist, Newman, Huang and Edwards2021). Nine-to-12-year-olds using CIs or HAs both showed the same “wait-and-see” pattern of lexical access as adult and adolescent CI users, with slower looks to target, decreased onset competition and increased rhyme competition, although this pattern was more pronounced for children using CIs than HAs (Klein et al., Reference Klein, Walker and McMurray2023).
However, not all studies of word recognition in DHH children have found significant differences to NH peers. Three-to-five-year-olds with CIs showed no evidence for (or against) a different time course of word recognition compared to peers with NH when target words were presented with a novel distractor (Cychosz et al., Reference Cychosz, Mahr, Munson, Newman and Edwards2023). Furthermore, eight- to 12-year-olds with diverse hearing device configurations (bilateral CIs, bilateral HAs, bimodal fittings, or unilateral HL) were not significantly different to NH peers in the time course of word recognition for words presented in either predictable or unpredictable sentences (Holt et al., Reference Holt, Bruggeman and Demuth2021). The lack of clear evidence for or against a lexical access disadvantage in DHH preschoolers therefore requires further investigation.
These previous findings also raise questions about the extent to which HL affects the dynamics of word recognition in preschoolers when phonological competition is increased, an issue that has not yet been addressed in this age group. Thus, although DHH preschoolers may easily disambiguate target words from known distractor referents that are phonologically and acoustically dissimilar (Grieco-Calub et al., Reference Grieco-Calub, Saffran and Litovsky2009; Simeon & Grieco-Calub, Reference Simeon and Grieco-Calub2021), word recognition may be compromised when they have to rely on a single sound and only a few acoustic cues to resolve ambiguity. The present study therefore assessed these children’s real-time word recognition in the presence of a phonological competitor (e.g., a minimal pair: bin-pin, map -mat ) vs. an unrelated distractor (e.g., a non-minimal pair: toy-bed). If DHH children experience more acoustic ambiguity or overlap in lexical representations, then the presence of a phonological competitor should increase lexical competition while decreasing target activation, leading to slower or less certain word recognition relative to their peers with NH.
Potential effects of phonological properties on word recognition
Most perception research with DHH children has focused on speech-sound contrasts in isolation or in word onset position (Giezen et al., Reference Giezen, Escudero and Baker2010; Kishon-Rabin et al., Reference Kishon-Rabin, Gehtler, Taitelbaum, Kronenberg, Muchnik and Hildesheimer2002; Mildner et al., Reference Mildner, Šindija and Zrinski2009; Peng et al., Reference Peng, Hess, Saffran, Edwards and Litovsky2019). However, the dynamics of word recognition may be different for codas than onsets, since models predict parallel activation of lexical candidates as the speech signal unfolds (Mattys et al., Reference Mattys, Davis, Bradlow and Scott2012; McClelland & Elman, Reference McClelland and Elman1986; Weber & Scharenborg, Reference Weber and Scharenborg2012). Furthermore, while 18-month-olds with NH detect coda mispronunciations with a time course comparable to that of onset mispronunciations (Swingley, Reference Swingley2009), DHH preschoolers with HAs and CIs might still exhibit challenges with processing coda contrasts, as they also produce more coda (41%) than onset (8%) voicing errors (Bruggeman et al., Reference Bruggeman, Millasseau, Yuen and Demuth2021). The present study will therefore investigate whether DHH preschoolers experience increased difficulty processing coda minimal pairs (e.g., /map-mat /) than onset minimal pairs (/ pool-tool/), compared to their peers with NH. The onset and coda minimal pairs used in this study differed in either voicing (e.g., /b-p/) or PoA (e.g., /t-k/). Hearing devices limit the transmission of spectral acoustic information in the speech signal due to, in the case of HAs, the implementation of signal-processing algorithms such as frequency compression and, in the case of CIs, the segregation of the speech signal into discrete frequency bands (Peng et al., Reference Peng, Hess, Saffran, Edwards and Litovsky2019; van Tasell, Reference van Tasell1993; Xu et al., Reference Xu, Thompson and Pfingst2005). PoA contrasts, which are cued by spectro-temporal information (i.e., formant transitions), may therefore be less reliably transmitted by HAs and CIs than voicing contrasts, where the primary cues are temporal (i.e., Voice Onset Time for onsets and closure duration and vowel length for codas) (Lisker & Abramson, Reference Lisker and Abramson1964; Song et al., Reference Song, Demuth and Shattuck-Hufnagel2012). Nevertheless, both contrast types appear challenging to perceive for children with HAs and CIs (Johnson et al., Reference Johnson, Dorman and Whaley1984; Mildner et al., Reference Mildner, Šindija and Zrinski2009; Peng et al., Reference Peng, Hess, Saffran, Edwards and Litovsky2019). In addition, one study finds that two-to-ten-year-olds with CIs had more difficulty perceiving voicing than PoA contrasts in the first two-to-three years post-implantation, going against the prediction that PoA contrasts would be harder to process (Kishon-Rabin et al., Reference Kishon-Rabin, Gehtler, Taitelbaum, Kronenberg, Muchnik and Hildesheimer2002). These variable findings thus require further investigation into the relative difficulties processing voicing and PoA contrasts. It is necessary to examine the processing of these contrasts in the context of word recognition, rather than in isolation, as the ability to discriminate phonemes is subject to effects of context, even at preschool age (e.g., Creel, Reference Creel2022; Stager et al., Reference Stager, Morett, Stelmach, Parente, Mickler and Scofield2023).
The current study
The current study therefore aimed to investigate the impact of any experience of HL on word recognition in preschoolers, assessing whether DHH preschoolers have more difficulty recognising words than their peers with NH. In particular, we investigate if this effect would be greater for targets presented alongside a phonological competitor (i.e., a minimal pair: bin-pin) compared to an unrelated distractor (i.e., a non-minimal pair: toy-bed). Within minimal pairs, we further addressed the potential effects of segment position (i.e., Onset vs. Coda) and/or type of contrast (i.e., Voicing vs. PoA) on recognition accuracy.
A Looking-While-Listening (LWL) paradigm was used (Fernald et al., Reference Fernald, Zangl, Portillo and Marchman2008), where the child was auditorily prompted to look at a target word while an eye-tracker captured their real-time gaze pattern to two visual referents, a target and a competitor. Global word recognition was assessed by calculating the average proportion of looking time to target over a set time window (see also Delle Luche et al., Reference Delle Luche, Durrant, Poltrock and Floccia2015). A time-course analysis was also conducted to take advantage of the rich, time-varying data provided by eye-tracking, which provides insight into not only differences in overall activation of the target and competitors, but the dynamics of this activation over time leading to word recognition (see also Tamási et al., Reference Tamási, McKean, Gafos and Höhle2019). We predicted that DHH preschoolers, compared to NH, would have greater difficulties recognising minimal pair than non-minimal pair words (Cychosz et al., Reference Cychosz, Mahr, Munson, Newman and Edwards2023; Johnson et al., Reference Johnson, Dorman and Whaley1984; Kishon-Rabin et al., Reference Kishon-Rabin, Gehtler, Taitelbaum, Kronenberg, Muchnik and Hildesheimer2002; Mildner et al., Reference Mildner, Šindija and Zrinski2009; Peng et al., Reference Peng, Hess, Saffran, Edwards and Litovsky2019). Within minimal pairs, we also predicted – albeit more tentatively – that DHH preschoolers might have more difficulty recognising contrasts in Coda compared to the onset position (Bruggeman et al., Reference Bruggeman, Millasseau, Yuen and Demuth2021), and greater difficulty recognising PoA compared to Voicing contrasts (based on acoustic models of hearing devices: van Tasell, Reference van Tasell1993; Xu et al., Reference Xu, Thompson and Pfingst2005, though see Kishon-Rabin et al., Reference Kishon-Rabin, Gehtler, Taitelbaum, Kronenberg, Muchnik and Hildesheimer2002; Mildner et al., Reference Mildner, Šindija and Zrinski2009; Peng et al., Reference Peng, Hess, Saffran, Edwards and Litovsky2019).
The current study’s primary goal was to examine the word recognition abilities of DHH children, a very heterogeneous population (see, e.g., Cupples et al., Reference Cupples, Ching, Button, Seeto, Zhang, Whitfield, Gunnourie, Martin and Marnane2018, Lieu et al., Reference Lieu, Kenna, Anne and Davidson2020). Previous research on word recognition in DHH children has largely focused on a single subgroup: bilateral CI users who predominantly have profound HL (Blomquist et al., Reference Blomquist, Newman, Huang and Edwards2021; Cychosz et al., Reference Cychosz, Mahr, Munson, Newman and Edwards2023; Grieco-Calub et al., Reference Grieco-Calub, Saffran and Litovsky2009; McMurray et al., Reference McMurray, Farris-Trimble and Rigler2017; Simeon & Grieco-Calub, Reference Simeon and Grieco-Calub2021). However, in Australia, children with profound HL constitute only 8% of the population under 26 years old using hearing devices (Hearing Australia, 2022). To better inform practical intervention or support for the wider DHH population, there is a need for inclusive investigations of spoken word recognition in children with all types of HL.
Previous research shows shared language processing challenges between DHH children with diverse hearing characteristics, despite the very different input signals received by children with different hearing profiles. Irrespective of device and laterality differences (HAs vs. CIs vs. bimodal fittings; bilateral vs. unilateral HL) and differences in the type of HL (e.g., ANSD, sensorineural, conductive), these children all experience reduced acoustic access in formative years (Ching et al., Reference Ching, Day, Dillon, Gardner-Berry, Hou, Seeto, Wong and Zhang2013; McSweeny et al., Reference McSweeny, Cushing, Campos, Papsin and Gordon2021; Snapp & Ausili, Reference Snapp and Ausili2020; Tomblin et al., Reference Tomblin, Harrison, Ambrose, Walker, Oleson and Moeller2015), and show evidence of challenges with spoken language and listening (e.g., Fitzpatrick et al., Reference Fitzpatrick, Gaboury, Durieux-Smith, Coyle, Whittingham and Nassrallah2019; Cupples et al., Reference Cupples, Ching, Button, Seeto, Zhang, Whitfield, Gunnourie, Martin and Marnane2018; Ching et al., Reference Ching, Day, Dillon, Gardner-Berry, Hou, Seeto, Wong and Zhang2013; Tomblin et al., Reference Tomblin, Harrison, Ambrose, Walker, Oleson and Moeller2015; McSweeny et al., Reference McSweeny, Cushing, Campos, Papsin and Gordon2021). While the sources of difficulty may vary for DHH children with different hearing profiles (e.g., differences in the aspects of the signal most degraded by HAs vs. CIs, difficulty with spatial integration leading to poor binaural hearing in children with unilateral HL), they may experience shared outcomes and indeed typically share a similar course of aural/oral intervention in the Australian context. The sparsity of the current literature does not inform strong hypotheses about differences in word recognition as a function of HL laterality or device type, aside from suggesting that alterations to word recognition may be more pronounced for CI than HA users, despite being present for both (Klein et al., Reference Klein, Walker and McMurray2023).
Consistent with this research aim, the sample of DHH preschoolers tested in this study was diverse, including children with uni- and bilateral HL, children with different hearing devices (HAs, CIs, bimodal fitting, or not aided), and children with acquired HL. The present study, therefore, focuses on the group-level contrast between DHH children and their NH peers, rather than a particular sub-group of the DHH population. However, we acknowledge that, due to the diversity of hearing profiles represented, not all DHH participants will experience equivalent signal degradation or will have had equivalent access to sound during language acquisition. To pave the way for future research into the effect of particular hearing characteristics on word recognition, exploratory analyses examining effects of device type and laterality of HL were therefore conducted. Potential effects of DHH children’s vocabulary knowledge and age at first device fitting are furthermore reported in Supplemental Materials 1.
Methods
Participants
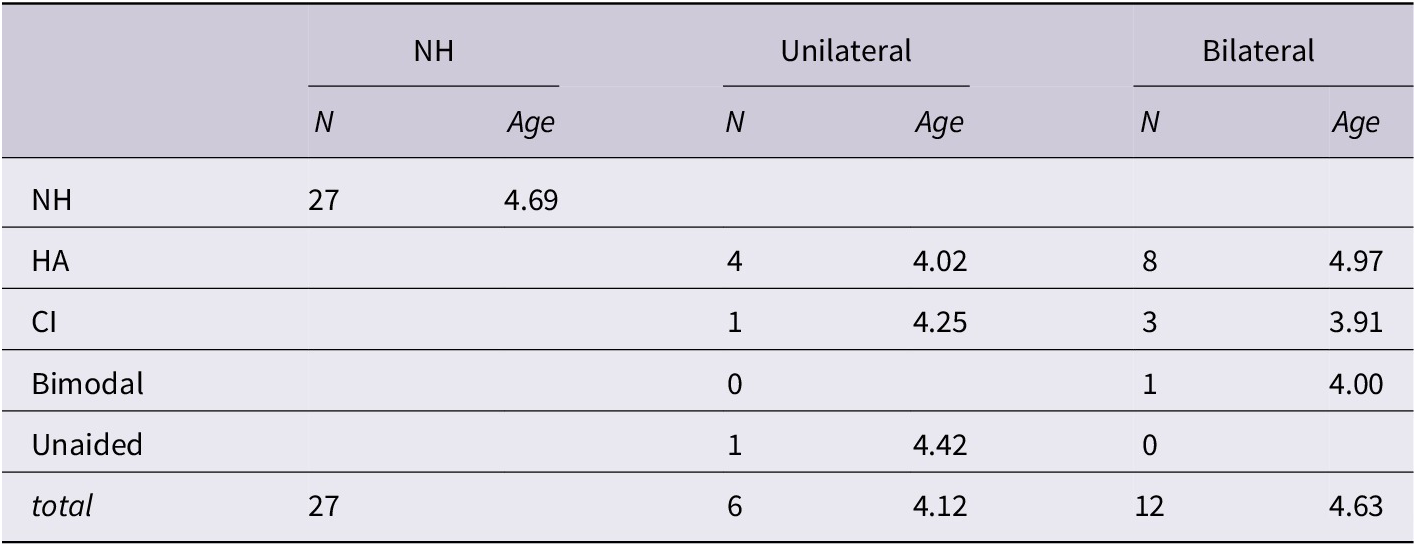
This study reports on data from 27 children with NH (M age (SD) = 4.69 (0.85) years; range: 3.16–5.83; 12 females, 15 males) and 18 DHH children (M age (SD) = 4.46 (0.99) years; range: 3.25–6.67; 10 females, 8 males) (see Table 1). None of the parents of children with NH reported that their child had hearing difficulties as per a screening questionnaire. All children were living in Australia and spoke Australian English at home, with oral communication as their main mode of communication. Two children with NH and three DHH children were exposed to a language other than English at home for on average 0.5 (NH) and 1.5 (DHH) hrs/week. None of the children were diagnosed with any developmental disorder. This study was approved by the Macquarie University Human Ethics panel, approval no. 52021575628599] and families received a $30 gift card for their participation. Any child with any type of HL that was clinically diagnosed by one of the partnering clinical services could participate in the study. All of these children received intervention from one of the partnering clinical services. The resulting DHH group consisted of children with different laterality of HL and device types: eight bilateral HAs, three bilateral CIs, one bimodal fitting, four unilateral HAs, one unilateral CI, and one unilateral unaided. All CI users had been fitted with HA(s) prior to cochlear implantation. The reader is referred to Table 1 for further descriptive individual clinical characteristics (including a measure of receptive vocabulary: the Peabody Picture Vocabulary Task (Dunn & Dunn, Reference Dunn and Dunn2007), age of implantation, type of hearing loss, and pure tone averages).
Characteristics of DHH children in the sample

Note. DHH = deaf and hard of hearing, PPVT = Peabody Picture Vocabulary Task, HA = Hearing Aid, CI = Cochlear Implant, R = right, L = left, ANSD = Auditory neuropathy spectrum disorder, M = male, F = female, 4-freq PTA = pure tone average over four frequencies. nd = no data.
a The HL of these children was diagnosed at 4.5 and 6.1 years of age. This late diagnosis suggests progressive HL, which means they may have developed some spoken language with their hearing early in development.
b Exact Age at HA unknown, but HL identified at 4.5, and parent-reported HA use at the time of testing.
c According to parental report, this child had been suffering from chronic middle ear infection in their good ear.
d Version 4, form B of the PPVT was obtained for DHH children by a clinician during a therapy session (N=4) within three months before or after testing, or by the experimenter on the day of testing (N=11).
In addition to the 45 children included in this study, 11 others were tested but excluded for the following reasons: 18 hrs/week exposure to another language at home (NH = 1), subsequent unilateral HL diagnosis (NH = 1), an ADHD diagnosis (DHH = 1), or contributing <50% of trials to analysis after pre-processing (NH = 1, DHH = 7) (see Analysis: Pre-processing).
Materials
Target pairs
Sixty-six monosyllabic nouns and one adjective (‘cold’) were selected to form eight non-minimal and 30 minimal yoked pairs (factor: Word Type). The non-minimal pairs were ‘book-tail’, ‘comb-bib’, ‘dice-pear’, ‘toy-bed’, ‘dog-cow’, ‘ball-car’, ‘bus-kite’, and ‘pan-door’, none of which had phonological overlap in Australian English. Minimal pairs (e.g., ‘bath-path’, ‘pool-tool’, ‘tea-key’, ‘mud-mug’, ‘cup-cut’; see Supplemental Materials 2) phonologically overlapped except for one sound in either Onset or Coda position (factor: Segment Position) which contrasted in either Voicing or PoA (factor: Type of Contrast). The Onset condition included six Voicing and 12 PoA pairs and the Coda condition included four Voicing and eight PoA pairsFootnote 1, Footnote 2. Five words appeared in two selected minimal pairs (‘dough’: ‘toe’ and ‘bow’, ‘cape’: ‘tape’ and ‘cake’, ‘key’: ‘pea’ and ‘tea’, ‘goat’: ‘coat’ and ‘boat’, ‘back’: ‘bat’ and ‘bag’).
Within each Segment Position (onset, coda) × Type Contrast (voicing, PoA) condition, phonological contrasts were balanced as much as possible. This means that the pairs in the Voicing condition contained three places of articulation (bilabial: b/p; velar: d/t; alveolar: g/k) with near-equal distributions, and the Place of Articulation condition contained three different place contrasts (near-equally distributed) with both voiced and unvoiced pairs where possible (bilabial-velar: b/g and p/k, bilabial-alveolar: b/d and p/t, alveolar-velar: d/g and t/k) (see Supplemental Materials 2).
Target words were considered familiar and included in the stimulus set if four or five out of five three-year-olds with NH (M (SD) age= 3;7 (0;2), one female, four males) could match the word to their corresponding picture in a three-Alternative Forced Choice pilot study. Four exceptions: ‘date’, ‘coast’ (recognised by 3/5 children with NH), ‘pea’, and ‘tear’ (recognised by 2/5 children with NH) were presented twice in the familiarization procedure prior to the LWL task (see below).
Mean lexical frequency, calculated from the CBeebies Subtlex-UK database (van Heuven et al., Reference van Heuven, Mandera, Keuleers and Brysbaert2014), did not differ significantly between non-minimal (M = 4.87, SD = 0.63) and minimal pair words (M = 4.66, SD = 0.61), as per a one-way ANOVA testing a main effect of Word Type (F(1, 74) = 1.43, p = .24, ηp2 = .02). For minimal pair words, a two-way ANOVA testing effects of Segment Position and Type of Contrast showed no significant difference between Onset (M = 4.62, SD = 0.51) and Coda words (M = 4.74, SD = 0.74) (F(1, 56) = .49, p = .49, ηp2 = .00) or between Voicing (M = 4.67, SD = 0.69) and PoA words (M = 4.67, SD = 0.58) (F(1, 56) = .00, p = .99, ηp2 = .00), and no significant interaction between Segment Position and Type of Contrast (F(1, 56) = .23, p = .63, ηp2 = .00).
Visual Stimuli
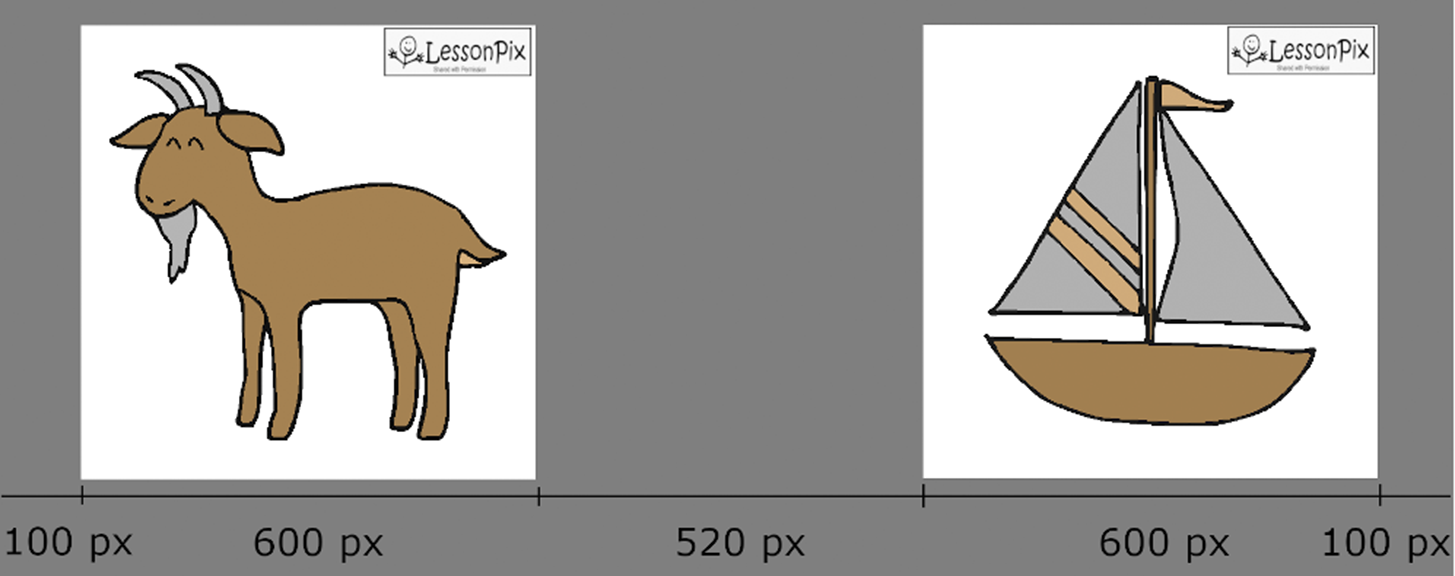
Visual stimuli were simple line drawings adapted from pictures retrieved from Lessonpix.com (Binko & Binko, Reference Binko and Binko2020) or from publicly available images using GIMP 2.10.12 (see Figure 1). To match complexity and attractiveness across and within picture pairs, pictures were sized approximately 320×320px on a 600×600px white background. Mean pixel difference within pairs was on average 1.2% of the total pixel size (M =1262, SD = 907). Within pairs, pictures were coloured with the same palette of up to three colours and luminance across the coloured part of the pictures was normalised to a mean of 0.883 hsv value (SD = 0.003 hsv value) using the Matlab SHINE_Color ToolboxFootnote 3 (Dal Ben, Reference Dal Ben2019). Items appearing in two pairs were depicted with a different picture in each pair (except ‘dough’ where 4/5 children in the pilot did not recognise the second picture). Animate items were drawn with their eyes closed. Supplemental Materials 3 shows pixel counts and pre- and post-adjusted luminance values per item.
Example of a picture pair (‘goat’ vs. ‘boat’) as presented on the screen. Pixel values on the x-axis indicate how the pictures were positioned on the screen. In the horizontal plane, pictures were centered at 540px. The pixel values and the logo were not displayed in the experiment (pictures presented with permission)

Auditory stimuli
A female native speaker of Australian English recorded the words in a soundproof booth using a child-directed register. Target words were not elicited in pairs to ensure that the speaker did not overemphasise acoustic differences between minimal pairs. All words were recorded within the carrier sentence ‘Look at [the X]’. One recording of [Look at] was selected based on naturalness. Tokens of [the X] were spliced into [Look at], preserving the natural co-articulation between ‘the’ and the target words. The coarticulation between the determiner and noun includes some of the main acoustic cues to the disambiguation of onset consonants, and is also readily available when listening in real-world environments. Therefore, it was considered necessary to maintain these acoustic cues by splicing prior to the determiner. Intensity was not scaled across stimuli to preserve phoneme-intrinsic intensity variation. Mean target word intensity was 47 dB SPL (SD = 3 dB, range = 40–52 dB) (see Supplemental Materials 4 for individual values). All stimuli were listened to and approved by the authors for naturalness prior to use.
Parent questionnaire
Prior to the experiment visit, all parents were sent a questionnaire asking whether their child understood each item in the LWL task in daily life. These data were collected for all children except one DHH child whose parent did not fill out the questionnaire. On average, parents of children with NH indicated that their children understood 92% (SD = 11%, range = 40–100%) of the items, whereas parents of DHH children marked 83% as understood (SD = 17%, range = 48–100%). A t-test indicated that this difference was marginally significant (t(26) = −2.02, p = .05).
Even though children were familiarised with all words in a familiarisation procedure before the LWL-task (see below), we ran additional analyses to address the possibility that prior differences in word familiarity for DHH children vs. children with NH had influenced the word recognition results. Analyses including only the items familiar to each child, according to parental reportFootnote 4, rendered largely the same result as the analyses with all items, indicating that effects of group, conditions, or age were not driven by prior word familiarity differences. We therefore report outcomes of analyses on all items in the main text. Please see Supplemental Materials 5 for a link to the online scripts with detailed outcomes of the additional analyses.
Procedure
Children were tested either in a sound treated university lab or in a quiet room in one of the participating speech-therapy clinics. Data were collected during the COVID-19 pandemic and the experimenter thus wore a face shield during the familiarisation part of the session, with their voice amplified using a clip-on Lapel mic connected to a GENELEC 8020C loudspeaker placed 1m in front of the child. The experimenter assessed whether the child could hear well enough in this setup by asking them to respond to three verbal instructions (raise their hand when hearing a word; point at named colours; and name colours). After this warm-up task children were familiarised with the pictures and associated target words through a picture-naming task on an iPad (20 minutes). If a child did not provide the target label directly, the experimenter named the word and asked the child to repeat it. Pictures were presented in a single randomly generated order, or its reverse (counterbalanced between participants).
After familiarization, children completed the LWL task (10 minutes) sitting in front of an Alienware 15 R3 laptop on a chair (23cm high) with eyes approximately 60cm from the screen. A Tobii X2-60 portable eye-tracker monitored their looking behaviour. Visual stimuli were displayed on a 1920×1080px screen with a grey background. Auditory stimuli were played via a Soundblaster X7 external soundcard and a GENELEC 8020C loudspeaker positioned behind the laptop on a raised platform (24 cm). The output level of the speaker was calibrated such that a pure tone generated at 47dB in Praat (the median of the target words) was played at 60dB. Stimuli were thus played at an average 60 dB volume, while preserving natural variation in stimuli intensity. The laptop fan produced a small amount of noise (a mean of 24dB compared to 18dB), but the frequency spectrum of the fan noise, as analysed in Praat, did not visibly mask any speech cues. The LWL task was programmed and presented using E-prime 3.0 and the Extension for Tobii Pro (EET). Each trial (7020ms) presented two pictures in silence, followed by the carrier phrase ‘Look at the [target]’, with the offset of ‘the’ time locked to 3000ms into the trial. Between trials, a grey screen was shown for 180ms. At the start of the task, the child was instructed to keep still, listen to the voice saying the word, and look at the corresponding picture.
Each child was presented with 42 trials in total and saw each (non-)minimal pair only once during the task. It was counterbalanced between participants which word of each pair was the target and whether the target appeared left or right on the screen. Trials were blocked by Segment Position (Onset: 4 non-minimal pair, 2 s-cluster and 18 onset trials; Coda: 4 non-minimal pair, 2 s-cluster and 12 coda trials). Block order was counterbalanced between participants. All counterbalancing (for target, target side, and block order) resulted in eight experiment configurations which were assigned within the group (NH vs. DHH). Stimulus order was pseudo-randomized within Onset/Coda blocks with two constraints: (1) minimal pairs with words that appeared twice in the set did not appear consecutively (e.g., ‘boat-goat’, ‘goat-coat’) and (2) non-minimal pair trials were separated by at least two minimal pair trials. A new pseudo-randomization was generated for each participant.
The LWL task was divided into seven sections separated by six 9s animations of one of six animals racing across the screen, enabling children to track their progress. Sections consisted of 5, 6, or 7 trials in the Onset block and of 6 trials in the Coda block. At the end of the LWL task, the child was rewarded with a sticker chart. Eleven DHH children were administered the Peabody Picture Vocabulary (PPVT) task after the session (15 minutes), and the others received this task during a therapy session (see Table 1).
Analysis & results
Pre-processing
Track loss up to 300ms was compensated for by the default eye blink compensation duration setting in EET Tobii pro. This meant that sequences of <300ms of invalid samples were counted towards cumulative look duration if a child looked towards the same area of interest (target 600×600px box; distractor 600×600px box; elsewhere on the screen; see Figure 1) both before and after the sequence. The eye-tracking data were then pre-processed in R version 4.2.1. A sample was coded as part of a look if the child looked consecutively at an area of interest for 100ms or longer (e.g., Egger et al., Reference Egger, Rowland and Bergmann2020).
Target onset was re-aligned between trials to the start of the burst of the target plosive (i.e., ‘b’ in ‘bin’ for Onset/non-minimal pairs and ‘p’ in ‘map’ for Coda pairs) as annotated in Praat (Boersma & Weenink, Reference Boersma and Weenink2020). Trials in the procedure were longer than the customary 3000ms as we anticipated that processing in DHH children might be substantially delayed. However, visual inspection indicated that both groups reached the proportion of target-looking peaks well before 3000ms (HL: appr. 1800ms, NH: appr. 1300ms) (see also Delle Luche et al., Reference Delle Luche, Durrant, Poltrock and Floccia2015). Therefore the post-naming analysis window was defined as 0–3000ms after target plosive onset, following Tamási et al. (Reference Tamási, McKean, Gafos and Höhle2019). We did not analyse beyond this cut-off.
Trials with > 1500ms post-naming looking to the screen (as an indicator of sufficient attention to the trial) were included (cf. Bailey & Plunkett, Reference Bailey and Plunkett2002). Children with less than 50% trials remaining were excluded from the analysis (cf. Tamási et al., Reference Tamási, McKean, Gafos and Höhle2019) (for N, see Participants section). For the children that remained in the final analysis (DHH: N = 18, NH: N = 27), on average 21.3% of trials (DHH) and 15.8% of trials (NH) were excluded. See Supplemental Materials 6 for a further breakdown of excluded and included trials per condition, group, and child.
Average proportion of target looking
Global word recognition accuracy was quantified as the proportion target looking time over the post-naming window (i.e., the number of samples directed to the target divided by the number of samples directed to the target and distractor combined). The average proportion of target looking was analysed using generalised mixed effects logistic regression (see Wieling, Reference Wieling2023) as implemented in the lme4 package (version 1.1.21) (Bates, Mächler, et al., Reference Bates, Mächler, Bolker and Walker2015). Logistic regression is appropriate as proportions are essentially categorical data (i.e., a binary choice of 1 or 0 between the target and distractor at each sampled time-point) and using logistic regression avoids fitting linear models to categorical data and its associated problems (Barr, Reference Barr2008; Jaeger, Reference Jaeger2008). The models compared the number of successes looking at the target vs. distractor aggregated per participant per trialFootnote 5.
Model outcomes are interpreted in-text as log-odds estimates, which can be interpreted, when positive, as an increase in the target vs. distractor success ratio, and when negative, as a decrease in the target vs. distractor success ratio. The precision of our estimated effects is conveyed by 95% Confidence Intervals around the estimates reported in the tables.
We anticipated that the dynamics of word recognition may differ over the age range of participants examined, with older children showing better performance (faster and greater looks toward the target). We therefore considered that participant Age may need to be included in the analysis to account for systematic variability in looking behaviour due to age that might influence the Group effects central to our research questions. Participants’ age indeed correlated with their subject-averaged proportion of post-naming target looking (r(44), 0.45, p = 0.001, 95% CI [.19,.67]) and was thus z-transformed and included as a continuous predictor in the models. Random effects were included in the models starting with the maximal random effects structure warranted by the design and then reduced to a parsimonious random-effects structure if needed, following the ‘Parsimonious Mixed Models approach’ (Bates, Kliegl, et al., Reference Bates, Kliegl, Vasishth and Baayen2015). For all models, the “bobyqa” optimizer was used. p-values between 0.05 and 0.10 were considered marginally significant and were interpreted as suggestive of trends in the data that warrant further investigation. All reported models converged.
A first “all trial” model was constructed to test whether the increased difficulty recognising minimal pairs (vs. non-minimal pairs) was larger for DHH than NH children. A second “minimal pair” model included only minimal pair trials and was constructed to address whether minimal pair recognition was influenced by (a) type of contrast (Voicing vs. PoA), (b) the position of the segment in the word (Onset vs. Coda), or (c) an interaction between these two factors.
Baseline looking preferences were assessed based on the proportion of target looking in a pre-naming window of 2500–500ms before target plosive onset (excluding the noisy data at the start of the trial, and the last 500ms before burst onset, which might contain acoustic cues to the target plosive). As the same analyses on pre-naming target looking provided no indication of differences in baseline preference (See Supplemental Materials 7, 8, and 9), we only report outcomes for the proportion of post-naming target looking.
All trial model. The all trial model included fixed factors Group (NH=−0.5 vs. DHH=+0.5) and Word Type (Non-MP=−0.5 vs. MP=+0.5) and their interaction. Negative β values reflect increased looks to the target in the negative-coded group/condition, while positive β values reflect increased looks to the target in the positive-coded group/condition. Interactions with age (continuous, z-transformed) were included since preliminary analysis showed that Age trended towards a 3-way interaction with Group and Word Type (p = 0.072). The model included random intercepts for Subject and Item and random slopes for Word Type by Subject and for Group by Item.
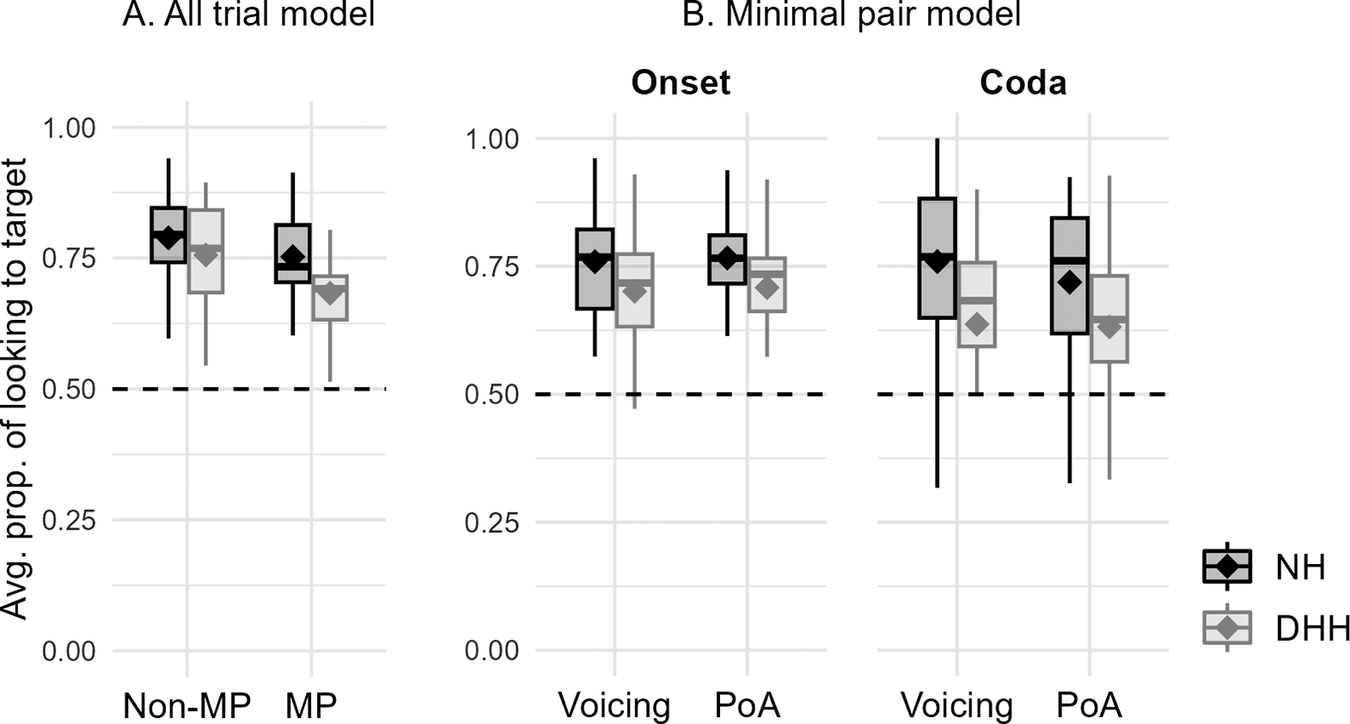
Figure 2a shows the proportion of target looking per Group and Word Type, and Table 2 shows the results of the all trial model. A significant negative effect of Word Type (β = −0.33, SE = 0.16, z = −2.12, p = .034) showed that childrenlooked more towards the target vs. distractor in non-minimal compared to minimal pair trials. A significant effect of Age (β = 0.21, SE = 0.06, z = 3.32, p = .001) indicated that older children looked more towards the target vs. distractor than younger children. There was no significant main effect of Group. However, a marginally significant three-way interaction between Age, Group, and Word Type (β = 0.25, SE = 0.14, z = 1.80, p = .072) was detected, in the absence of the predicted two-way interaction between Group and Word Type (β = −0.03, SE = 0.21, z= −0.17, p = .867), which tested whether DHH children experienced difficulty recognising minimal pairs. The marginally significant three-way interaction suggests that future research should assess if increased difficulty with minimal pairs in the DHH group is larger for younger rather than older children.
Boxplots showing the proportion of looking time to target over the post-naming window in (a) the all trial model and (b) the minimal pair model. Diamonds indicate the mean. Non-MP = Non-Minimal Pair, MP = Minimal Pair, NH = Normal Hearing, DHH = Deaf and Hard Of Hearing, PoA =Place of Articulation, prop. = proportion, avg. = average.

Results of the all trial model (Group, Word Type), showing model estimates (in log-odds and odds ratios), standard errors (SE), t-values, and p-values

Note. The log-odds model outputs are reported in-text, but the table also reports odds ratios, i.e., exp(log-odds). Bold font with an asterisk indicates a p-value < 0.05. Bold font only indicates a p-value <0.10. Conf. Int. = Confidence Interval, NH = Normal Hearing, DHH = Deaf and Hard of Hearing, Non-MP = Non-Minimal Pair, MP = Minimal Pair, Est. = Estimate.
Minimal pair model. The minimal pair model included fixed factors Group (NH=−0.5 vs. DHH=+0.5), Segment Position (Onset=−0.5 vs. Coda=+0.5), Type of Contrast (Voicing=−0.5 vs. PoA=+0.5), Age (continuous and z-transformed), and all interactions. First, a maximal version of this model was evaluated (see Supplemental Materials 10) with all the above-mentioned fixed factors and random intercepts for Subject and Item and random slopes for Word Type by Subject and Group by Item. The fixed effects structure of the maximal model was then reduced to a parsimonious structure that would explain maximal variance with a minimal number of fixed effects, namely all main and interaction effects of theoretical interest, including other terms only if they were (near-)significant (p<.10) in the maximal model. The parsimonious model included the main effects of Group, Segment Position, Type of Contrast and all their higher-order interactions, as well as Age and the Age x Group interaction (p = .059 in the maximal model). The selected random-effects structure was identical to that of the maximal model. As there was no evidence for a difference between the maximal and parsimonious model fits (χ2 = 4.46, df = 6, p = .613), the results of the parsimonious model are presented in text. Between models, the only change in the pattern of results was that a marginally significant Age x Group interaction in the maximal model was not significant in the parsimonious model. Figure 2 B shows the proportion of target looking per Group, Segment Position, and Type of Contrast, and Table 3 shows the results of the (fixed) parsimonious minimal pair model. This model did not show significant effects of Segment Position, Type of Contrast or any interactions. As the minimal pair model contained a subset of the data included for the all trial model, we refrain from re-reporting the effects of Age and Group already included in that model.
Results of the parsimonious minimal pair model (Group, Segment Position, and Type of Contrast), showing model estimates, standard errors (SE), t-values, p-values, and odds ratios

Note. The log-odds model outputs are reported in-text, but the table also reports the Odds Ratios, i.e., exp(log-odds). Bold font with an asterisk indicates a p-value < 0.05. Bold font only indicates a p-value <0.10. Conf. Int. = Confidence Interval, NH = Normal Hearing, DHH = Deaf and Hard of Hearing, SegPos = Segment Position, TypeCon = Type of Contrast, Est. = Estimate.
Time-course analyses
To assess fine-grained differences in looking behaviour over time, we used non-parametric cluster-based permutation analyses (Maris & Oostenveld, Reference Maris and Oostenveld2007), as implemented by the EyeTrackingR package in R (Ferguson & Dink, Reference Ferguson and Dink2018) (see also Tamási et al., Reference Tamási, McKean, Gafos and Höhle2019). All comparisons were performed within a time window of −500 to +3000ms relative to the target plosive onset to take into account transitional cues in the preceding vowel. We first assessed the main effects of Group and Word Type (all trials) and Segment Position and Type of Contrast (minimal pair trials) on the proportion of looking to target over time, calculated for each 100ms time bin as number of samples to target/number of samples to target + distractor. First, subject-averaged time courses were compared between two predictor levels (e.g., NH and DHH for Group) by conducting a t-testFootnote 6 (dependent samples for within-subject, independent samples for between-subject predictors) at each time bin. Significant time bins (defined as p<0.05) were clustered based on temporal adjacency. For each cluster, the t-values were summed into a cluster-level sum statistic, which was then evaluated against a permutation distribution to obtain the cluster p-value. This permutation distribution was constructed by, 1000 times, randomly re-assigning the predictor labels to the proportions in each time bin and re-iterating the steps above in the same way as for the observed data. The cluster p-value was determined as the proportion of permutations that yielded a more extreme cluster statistic than the cluster in the original data (Monte Carlo p). If cluster p < 0.05, the curves were deemed significantly different between the two levels of the given predictor. As Age had a large effect in the average proportion analysis we explored effects of Age on the time course averaged across all trials, using as test-statistic, the t-value associated with Age (z-transformed; continuous predictor) in a linear model. We then assessed interaction effects (Group * Word Type (all trials), Group * Segment Position, Group * Type of Contrast and Segment Position * Type of Contrast (minimal pair trials)) by calculating the time-course difference in the proportion of target looking between two (within-subject) factor levels (e.g., Word Type: Non-MP vs. MP) and testing whether these difference curves differed between two levels of a second (within-subject or between-subject) factor (e.g., Group: NH vs. DHH) (see also Koch et al., Reference Koch, Bulté, Housen and Godfroid2021). The effect of the second factor on these difference curves was then assessed with cluster-based statistics using independent samples t-tests for interactions with Group and dependent samples t-tests for the Segment Position * Type of Contrast interaction. This latter interaction was performed first for all children and then within each group separately, excluding children that did not contribute data in all time bins (NH = 2, DHH = 5), as it was not possible to calculate difference curves if subjects contributed data to one but not another level of a factor.
A table with all detected time clusters, including non-significant ones, for both main effects and interactions is presented in Supplemental Materials 11.
Time-course results for the main effects
Figure 3 shows the time courses for the main effects of Group, Word Type, Segment Position, and Type of Contrast. Children with NH looked significantly more towards the target than DHH children in the 500–1800ms window (∑ t = −33.33, Monte Carlo p = 0.012), suggesting they better recognised words. Children looked significantly more towards the target in Non-MP than in MP trials in the 1000–2400ms window (∑ t = 45.72, Monte Carlo p = 0.000), suggesting that words in non-minimal pairs were better recognised than words in minimal pairs. In the minimal pair data, the proportion of looking to target over time was not found to be significantly different between Onset vs. Coda trials or Voicing vs. PoA trials.
Proportion of looks to target over time as a function of (a) Group, (b) Word Type, (c) Segment Position, and (d) Type of Contrast. Shaded regions (light: p > 0.05, dark: p < 0.05) indicate detected time-clusters. Curves are smoothed using the “gam” method.

Time-course results for the interactions
Figure 4A shows the time courses for the Group * Word Type interaction. The increased looking to targets in Non-MP vs. MP trials was significantly larger for DHH children than those with NH between 1700 and 2400ms (∑ t = −18.85, Monte Carlo p = 0.011).
The proportion of looks to target over time as a function of a) Word Type × Group, b) Segment Position × Type of Contrast, and c) Age (divided into older and younger children by a median split (strict inequalities) for the purposes of visualisation). Shaded regions (light: p > 0.05, dark: p < 0.05) indicate detected time-clusters. The interaction time-clusters (Panels A and B) are indicated in both sides of the panel. Curves are smoothed using the “gam” method. Panel B: the time course represents a subset of data, excluding 2 children with NH and 5 DHH.

Within the minimal pair trials, children with NH and DHH children did not differ significantly from each other in looking time course between Onset and Coda (Group × Segment Position) and Voicing and PoA trials (Group × Type of Contrast) (see Supplemental Materials 12 for figures).
Figure 4B shows the time courses for the Segment Position × Type of Contrast interaction. The difference in looking time courses between Voicing and PoA trials was significantly larger in Coda than in Onset trials between 400 and 900ms (∑ t = 13.71, Monte Carlo p = 0.037). Visual inspection of the time courses suggests that in Onset trials, children processed PoA contrasts later than Voicing contrasts, whereas in Coda trials, children processed PoA contrasts earlier than Voicing contrasts. When assessing the Segment Position * Type of Contrast interaction for each group separately we found no evidence of an interaction for either the DHH children or their peers with NH (see Supplemental Materials 13 for figures).
Time-course results for age
Figure 4C provides a visual picture of the effect of Age on word recognition. The analysis (with Age as a continuous predictor) revealed that the older the child, the more they looked towards the target, with the most prominent effects found early after target plosive onset, between 100 and 1200ms (∑ t = 32.91, Monte Carlo p = .005). Inspection of the time course, where this effect is visualised with a median split, suggests that younger children processed words more slowly than older children. A second cluster was found much later between 2400 and 3000ms (∑ t = 19.31, Monte Carlo p = .024), potentially reflecting older children’s ability to better sustain attention throughout the trial.
Effects of device type and laterality
The devices that children in our sample were fitted with (HAs, CIs, bimodal fitting or no aids), as well as their laterality of HL (uni- or bilateral), might have moderated word recognition. Figure 5 shows the proportion of looking to target averaged for (A) all trials and (B) within minimal pair trials separately per (1) Device Type and (2) Laterality. Inferential statistics were not performed as the number of children in each sub group was so small that analyses may result in spurious conclusions. Furthermore, dividing the groups by laterality would result in those groups having variable device types, and vice versa (see Table 4), as well as subgroup differences in age. We therefore describe visual trends, with the recommendation that these should be the topic of further research. First, the higher proportion of looking to target for non-minimal compared to minimal pair trials is visible for all device types. Second, systematic differences between the device types are apparent and fairly stable across conditions: Children with HAs seem to perform best, followed by children with CIs, then bimodally fitted children and lastly the unaided child. Note that the parental report revealed that the unaided child had been suffering from chronic middle ear infection in their good ear, potentially explaining their difficulty with the task. Third, we see no obvious trend towards children with unilateral HL outperforming children with bilateral HL.
Boxplots showing proportion of looks averaged over the post-naming window as a function of (a) all trials and (b) minimal pair trials for (1) Device Types and (2) Laterality of HL. Coloured diamonds indicate the mean. Non-MP = Non-Minimal Pair, MP = Minimal Pair, NH = Normal-Hearing, CI = Cochlear Implant, HA = Hearing Aid, PoA = Place of Articulation, avg. = average.

Mean N and Age per subgroup as a function of hearing characteristics

Note. CI = Cochlear Implant, HA = Hearing Aid, NH = Normal-Hearing. Age in years.
Discussion
The purpose of this study was to assess whether HL affects real-time spoken word recognition for a diverse sample of DHH three-to-six-year-olds compared to peers with NH. Measuring looking behaviour using eye-tracking, we first tested how well children recognised a target picture in the presence of a phonological (minimal pair) competitor compared to an unrelated (non-minimal pair) distractor. Then, within minimal pairs, we assessed whether recognition was influenced by the position of the segment in the word (Onset or Coda) or the type of contrast (Voicing vs. PoA).
In the proportion of looking analysis, children looked more towards the target in non-minimal compared to minimal pair trials, regardless of Group. This effect was also found in the more fine-grained time course analysis, along with greater overall looks to the target for children with NH than DHH peers, and an interaction such that the difference in looks to the target in minimal vs. non-minimal pair trials was greater for DHH children than those with NH. A Segment position by Type of contrast interaction was also observed in the time course analysis, where children seemed to process PoA contrasts later than Voicing contrasts in onset MP trials, but PoA contrasts earlier than Voicing contrasts in coda MP trials.
Some variability in performance was also observed within groups. Increased looks to the target with increasing age was found in both the proportion of looking and time course analyses. In the proportion of looking analysis, a marginally significant interaction suggested that difficulty with minimal pairs relative to non-minimal pairs in the DHH group may be greater for younger relative to older children. Visual inspection of data from DHH participants divided according to hearing device type and laterality of HL revealed that, while the pattern of increased looks to target for non-minimal compared to minimal pair trials held for all subgroups, children with HAs tended to show greatest looks to the target overall, followed by children with CIs, bimodal fittings and no device, respectively. Differences in performance according to vocabulary size were also observed, reported in Supplemental Materials 1.
Effects of phonological competition on word recognition
We predicted that the impact of phonological competition would be larger for DHH children than NH children, but the observed effects were more nuanced. The global word recognition analysis did not directly reveal more phonological competition for DHH children compared to peers with NH but trended towards increased competition for DHH children the younger children were. This aligns with previous reports that younger two-to-three-year-olds with bilateral CIs have greater difficulty discriminating voicing and PoA minimal pairs than peers with NH (Peng et al., Reference Peng, Hess, Saffran, Edwards and Litovsky2019). It may be the case that DHH children experience more phonological competition than peers with NH during the early preschool years but then catch up with age and increasing auditory experience.
The fine-grained time-course analysis (not taking into account age) provided further support for increased phonological competition in DHH compared to NH children and revealed insight into the dynamics of this effect, with difficulties occurring relatively late in the word recognition time course (1700ms after the target plosive). Visually, the minimal-pair looking curve of DHH children reaches a lower asymptote than that of their peers with NH. As this pattern occurred specifically in the phonological competition context, it suggests that DHH children activate words less strongly than their peers with NH due to ongoing activation of phonological competitors. Reduced asymptotes were not expected, although these have been observed for adolescents with developmental language disorder when looks to target were measured amongst phonological and non-phonological distractors (McMurray et al., Reference McMurray, Samelson, Lee and Bruce Tomblin2010). McMurray et al. (Reference McMurray, Samelson, Lee and Bruce Tomblin2010) showed through simulations that such reduced asymptotes may be due to several perceptual or lexical processes, including ‘Noise’ and ‘Lexical Decay’ as defined in the TRACE model (McClelland & Elman, Reference McClelland and Elman1986)Footnote 7. If ‘Noise’ is similarly responsible for the reduced asymptotes in DHH children, it would support the hypothesis that speech signal degradation increases acoustic-phonetic ambiguity, resulting in decreased target activation or prolonged competitor activation (Mattys et al., Reference Mattys, Davis, Bradlow and Scott2012). However, it is also plausible that the reduced asymptotes found in DHH children are caused by a (Lexical) Decay in target activation due to an inability to maintain words in memory. A Lexical Decay account better aligns with the hypothesis that long-term lexical representations are less specified for DHH populations with prelingual HL (McMurray et al., Reference McMurray, Farris-Trimble and Rigler2017) and fits reported links between working memory and word recognition/vocabulary size for DHH children (Nittrouer et al., Reference Nittrouer, Caldwell-Tarr, Low and Lowenstein2017; Pisoni & Geers, Reference Pisoni and Geers2000).
However, the reduced asymptotes observed for the DHH group may not necessarily reflect differences in lexical processing but could also be explained by cognitive differences, specifically in inhibitory control. DHH children using HAs or CIs score more poorly on measures of inhibitory control than their NH peers (Blank et al., Reference Blank, Frush Holt, Pisoni and Kronenberger2020; Lind-Combs & Frush Holt, Reference Lind-Combs and Frush Holt2022). Reduced asymptotes among DHH children may therefore reflect limitations in DHH children’s ability to effectively inhibit competitors, rather than, or in addition to, reflecting group differences in properties of the input speech signal or lexical representations. This highlights the need to tease apart the perceptual, lexical, and cognitive origins of the reduced asymptotes in the looking curves of DHH children.
Interestingly, the fine-grained time-course analysis did not provide indications that DHH preschoolers experience delays in initial target word activation compared to peers with NH, even when phonological competition is increased. Group differences early in the time-course (e.g., 0–500ms post target plosive) were not found. Maybe lexical access is truly not delayed in DHH preschoolers, matching conclusions of Cychosz et al., (Reference Cychosz, Mahr, Munson, Newman and Edwards2023). However, it is also possible that delays are present in DHH preschoolers, matching findings for toddlers, adolescents and school-aged children (Grieco-Calub et al., Reference Grieco-Calub, Saffran and Litovsky2009; McMurray et al., Reference McMurray, Farris-Trimble and Rigler2017; Simeon & Grieco-Calub, Reference Simeon and Grieco-Calub2021) but not detected by the analysis method in the present study. Analyses that can appropriately capture how quickly children initiate their looks to target are necessary to confirm such delays (cf. Seedorff et al., Reference Seedorff, Oleson and McMurray2018).
Within-minimal pair effects of phonological properties on word recognition
In both the global and fine-grained analyses, we found no evidence for (or against) larger effects of phonological properties on minimal pair recognition in DHH children vs. children with NH. The lack of evidence for a Coda difficulty (compared to Onset contrasts) diverges from Bruggeman et al. (Reference Bruggeman, Millasseau, Yuen and Demuth2021), who found that DHH preschoolers produced more voicing errors in Codas compared to Onsets. It remains unclear if and how difficulty with the perception of Coda vs. Onset contrasts is overcome before production challenges. However, it is possible that the use of stimuli in which the target coda consonants fell in the perceptually salient utterance-final position and which were produced in a clear speech mode, as typical of laboratory perception studies, may have facilitated coda consonant perception (cf. Sundara et al., Reference Sundara, Demuth and Kuhl2011). Difficulties in the perception of coda consonants may arise in utterance-medial positions and/or in speech produced in a conversational manner. The lack of evidence for a perceptual advantage of Voicing compared to PoA contrasts for DHH children echoes earlier mixed results (Kishon-Rabin et al., Reference Kishon-Rabin, Gehtler, Taitelbaum, Kronenberg, Muchnik and Hildesheimer2002; Mildner et al., Reference Mildner, Šindija and Zrinski2009; Peng et al., Reference Peng, Hess, Saffran, Edwards and Litovsky2019) but contrasts with predictions based on acoustic models of hearing devices (van Tasell, Reference van Tasell1993; Xu et al., Reference Xu, Thompson and Pfingst2005). As acoustic model results are often based on DHH adults with postlingual HL, these models may be less appropriate for understanding perception of these contrasts in DHH children. Unlike adults, DHH children might still be developing sensitivity to the temporal information in Voicing contrasts after fitting, leading to poorer-than-expected performance on Voicing minimal pairs (see Kishon-Rabin et al., Reference Kishon-Rabin, Gehtler, Taitelbaum, Kronenberg, Muchnik and Hildesheimer2002). On the other hand, they may be less affected by the distortion of spectral cues, as they may be developing representations in which distorted cues are canonical due to the absence of phonological representations acquired prior to HL onset. Furthermore, enhanced cortical plasticity in child as opposed to adult populations (e.g., Sharma et al., Reference Sharma, Dorman and Spahr2002) may give children with prelingual HL an advantage over postlingually deafened adults in adapting to the degraded spectral cues provided by their hearing devices. These factors may allow DHH children to perform better than expected by acoustic models on the spectral cues of PoA minimal pairs. Future research with larger sample sizes facilitating comparison between users of different devices may be better able to detect potential differences in sensitivity to Voicing and PoA contrasts limited to certain device types.
Although this interaction was not predicted, recognition of Voicing and PoA contrasts differed in Onsets as opposed to Codas according to the fine-grained analysis. As this effect was short-lived (400–900ms), it may have been washed out in the global recognition analysis, which averaged over a 3000ms time window. This is compatible with the large Confidence Interval around the Segment Position by Type of Contrast interaction effect in the global recognition analysis, suggesting that this latter analysis was not able to give a precise estimate of this effect. The fine-grained analysis showed that, averaged across both groups, children seemed to recognise Onset targets earlier when pairs contrasted in PoA rather than in Voicing, while the reverse held for Codas. These patterns may reflect fine differences in the availability and use of acoustic cues to disambiguate upcoming segments at the beginnings and ends of words, complementing previous findings on toddlers’ and adults’ predictive usage of coarticulatory cues in the speech signal (e.g., Zamuner et al., Reference Zamuner, Moore and Desmeules-Trudel2016).
Effects of age, device type, and laterality
The observed age effect across both DHH children and children with NH contributes to a growing body of evidence that lexical processing develops continuously during early childhood (see e.g., McMurray et al., Reference McMurray, Apfelbaum and Tomblin2022). All analyses showed that the older children are, the better they are at recognising the target words. This age effect, occurring early in the trial (100ms post target plosive), combined with a visual indication of earlier initiated looks to the target for the older compared to younger children (when divided by median split), suggests that older children are faster to activate the target. This may reflect either age-related changes in domain-general processing speed (Peter et al., Reference Peter, Durrant, Jessop, Bidgood, Pine and Rowland2019), or selective improvements in speed of word recognition. This result adds to findings from previous word recognition studies in children with NH, where changes in the dynamics of word recognition as a function of age have been found in 15–24-month-old toddlers (e.g., Fernald et al., Reference Fernald, Pinto, Swingley, Weinberg and McRoberts1998) and children as old as 9–16 years (Rigler et al., Reference Rigler, Farris-Trimble, Greiner, Walker, Tomblin and McMurray2015), though age effects for three-to-six-year-olds are still lacking in the literature (see also Rigler et al., Reference Rigler, Farris-Trimble, Greiner, Walker, Tomblin and McMurray2015; McMurray et al., Reference McMurray, Apfelbaum and Tomblin2022, for a review). The present study therefore adds much-needed evidence about age-related changes in lexical activation the pre-school years.
The descriptive results for device type and laterality of HL suggest a need for inclusive research into children with all kinds of hearing characteristics, as well as a better understanding of the effects thereof on word recognition. On the one hand, children in each device type group (CI, HA, bimodal or unaided) looked numerically less towards the target than the NH group when phonological competition was present, indicating more difficulty with word recognition. Also, children with unilateral HL, despite having typical access to sound in one ear, seemed to perform similarly to those with bilateral HL, corroborating research showing language difficulties in children with unilateral HL (Fitzpatrick et al., Reference Fitzpatrick, Gaboury, Durieux-Smith, Coyle, Whittingham and Nassrallah2019). On the other hand, there were trends for differences between device types: the four children with CIs in this study looked numerically less towards the targets than the 12 children with HAs, indicating more difficulty with word recognition. Future research can use these observations as a starting point to further investigate the effects of all types of hearing characteristics on word recognition.
Limitations
This study provides a first insight into the effects of phonological competition on word recognition in DHH preschoolers. Because our data showed a trend towards an interaction with age, we suggest that age-related changes in phonological competition should be a first target for further study with more participants. While small sample sizes are not uncommon in studies with DHH children and adolescents (e.g., reporting on N <20: Bruggeman et al., Reference Bruggeman, Millasseau, Yuen and Demuth2021; McMurray et al., Reference McMurray, Farris-Trimble and Rigler2017; Simeon & Grieco-Calub, Reference Simeon and Grieco-Calub2021), future research may also examine larger samples of DHH children to better distinguish between subgroups of DHH participants with different auditory experiences, such as HA vs. CI users, or children with unilateral vs. bilateral HL. In addition to the insights directly afforded by this study, our results can indirectly advance the field by contributing to future meta analyses (Bergmann et al., Reference Bergmann, Tsuji, Piccinini, Lewis, Braginsky, Frank and Cristia2018).
This study also investigated the effects of phonological properties on minimal pair recognition. The small number of trials in some sub-conditions (e.g. 4 trials for the Coda Voicing condition) may have contributed to our inability to detect phonological effects. Because the small lexicon of preschoolers contains only a few minimal pairs that could serve as stimuli, future studies could employ repeated testing to arrive at more robust conclusions. Despite these constraints, this study’s stimulus set contains a larger number of words and contrasts than previous studies investigating word recognition or discrimination in children before 5 years of age (e.g., 4 words: Fernald et al., Reference Fernald, Swingley and Pinto2001; Grieco-Calub et al., Reference Grieco-Calub, Saffran and Litovsky2009; 3 contrasts: Peng et al., Reference Peng, Hess, Saffran, Edwards and Litovsky2019; 6 minimal pairs: Swingley, Reference Swingley2009), thus providing a much-needed starting point for comprehensively investigating the effects of phonological properties on word recognition in various child populations.
There was a higher percentage of DHH than NH children in our sample that had to be excluded due to data loss (NH = 1, DHH = 7). We have scrutinized the available information on these children, and have not been able to pinpoint a single likely cause of the data loss. We assume that a mixture of factors played into this. While some of the excluded DHH children may have been less compliant because they found the task more challenging than NH peers, others may have been more fatigued during the task as their participation had to be scheduled after a regular intervention session to accommodate families’ busy schedules.
Conclusion
In conclusion, this study investigated the dynamics of spoken word recognition in DHH preschoolers with diverse hearing profiles and their peers with NH. Reduced target looks for DHH preschoolers relative to peers with NH, specifically in the context of phonological competition, could reflect increased activation of competitors during word recognition. Increased phonological competition may be one factor underlying challenges with spoken language development for DHH children, and may affect children’s later abilities to process and understand spoken language in everyday life.
Supplementary material
The supplementary material for this article can be found at http://doi.org/10.1017/S0305000925000066.
Data availability statement
R-markdown scripts with analysis code are available at https://osf.io/bezj8/. The raw data generated by this study are currently not publicly available to protect participant privacy, however they are available from the corresponding author on reasonable request.
Acknowledgements
We thank Serje Robidoux for statistical advice, Sarah Resende, Colleen Merhi and Louise Ratko for assistance with stimuli preparation, and The Shepherd Centre, Next Sense and Hearing Australia for recruitment assistance and participant detail provision.
Statement of financial support
This research was supported by an International Macquarie University Research Excellence Scholarship (20191047) to Rosanne Abrahamse and grant funding from ARC LP180100534 to Katherine Demuth.
Competing interest
None of the authors have potential competing interests to disclose.


 Open access